
- Contact Us:
-

-

-

-


Daily Market Updates
11 Jan 2024
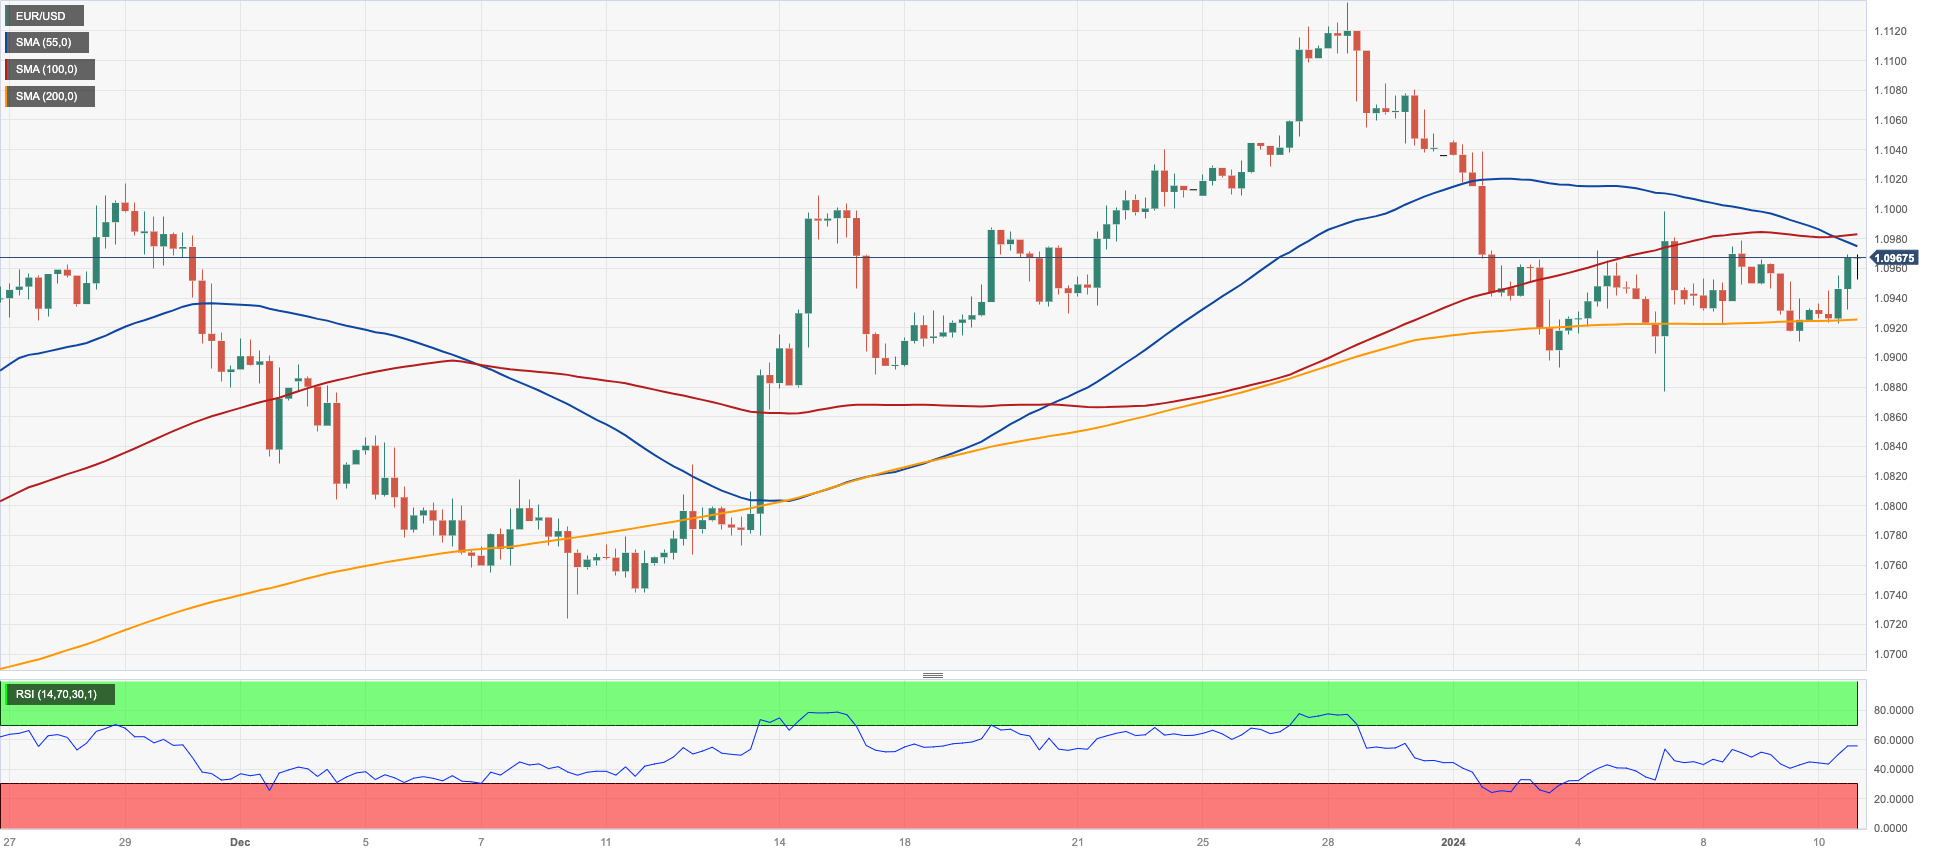
EURUSD
EUR/USD regained the smile and progressed to the 1.0970 region, or new weekly highs, on Wednesday, where some initial resistance appears to have emerged.
The pair left behind Tuesday’s retracement on the back of the inconclusive session in the greenback as well as marginal developments in money markets on both sides of the ocean, as pre-US CPI cautiousness dominated the scenery once again.
Nothing worth mentioning in the data realm in the euro area other than comments from ECB Vice President De Guindos, who mentioned that the swift decrease in inflation we saw in 2023 is expected to decelerate in 2024, possibly pausing at the start of the year. He added that there's a negative bias in economic prospects, and the ECB's future choices will still rely on incoming data.
Still around the ECB, Board member I. Schnabel emphasized that a 2% target is the most effective for preserving price stability, adding that the Phillips curve indicates a likelihood of a soft landing. She also anticipated a steady decrease in wage growth throughout 2024, while the immediate economic forecast aligns with our expectations, showing continued weakness. Schnabel reiterated that there's a sustained elevation in underlying price pressures and expected the bank’s target to be hit in 2025. She ruled out rate cuts for the time being and added that extra data is needed to confirm the disinflationary trend.
Data-wise, in the US, Mortgage Applications expanded 9.9% in the week to January 5, according to the MBA, and Wholesale Inventories contracted at a monthly 0.2% in November.
The breakout of the weekly high of 1.0998 (January 5) might push EUR/USD to revisit the December 2023 top of 1.1139 (December 27), which is also supported by the 200-week SMA at 1.1150, both of which precede the 2023 peak of 1.1275 (July 18). Instead, a breach of the 2024 low of 1.0892 (January 3) might reintroduce a challenge of the important 200-day SMA of 1.0846, ahead of the transitory 100-day SMA of 1.0763 and the December 2023 bottom of 1.0723 (December 8). The loss of the latter exposes the weekly low of 1.0495 (October 13, 2023) prior to the 2023 low of 1.0448 (October 3) and the round level of 1.0400. On a daily basis, the RSI rose past the 53 mark.
Resistance levels: 1.0998 1.1009 1.1139 (4H chart)
Support levels: 1.0923 1.0876 1.0723 (4H chart)
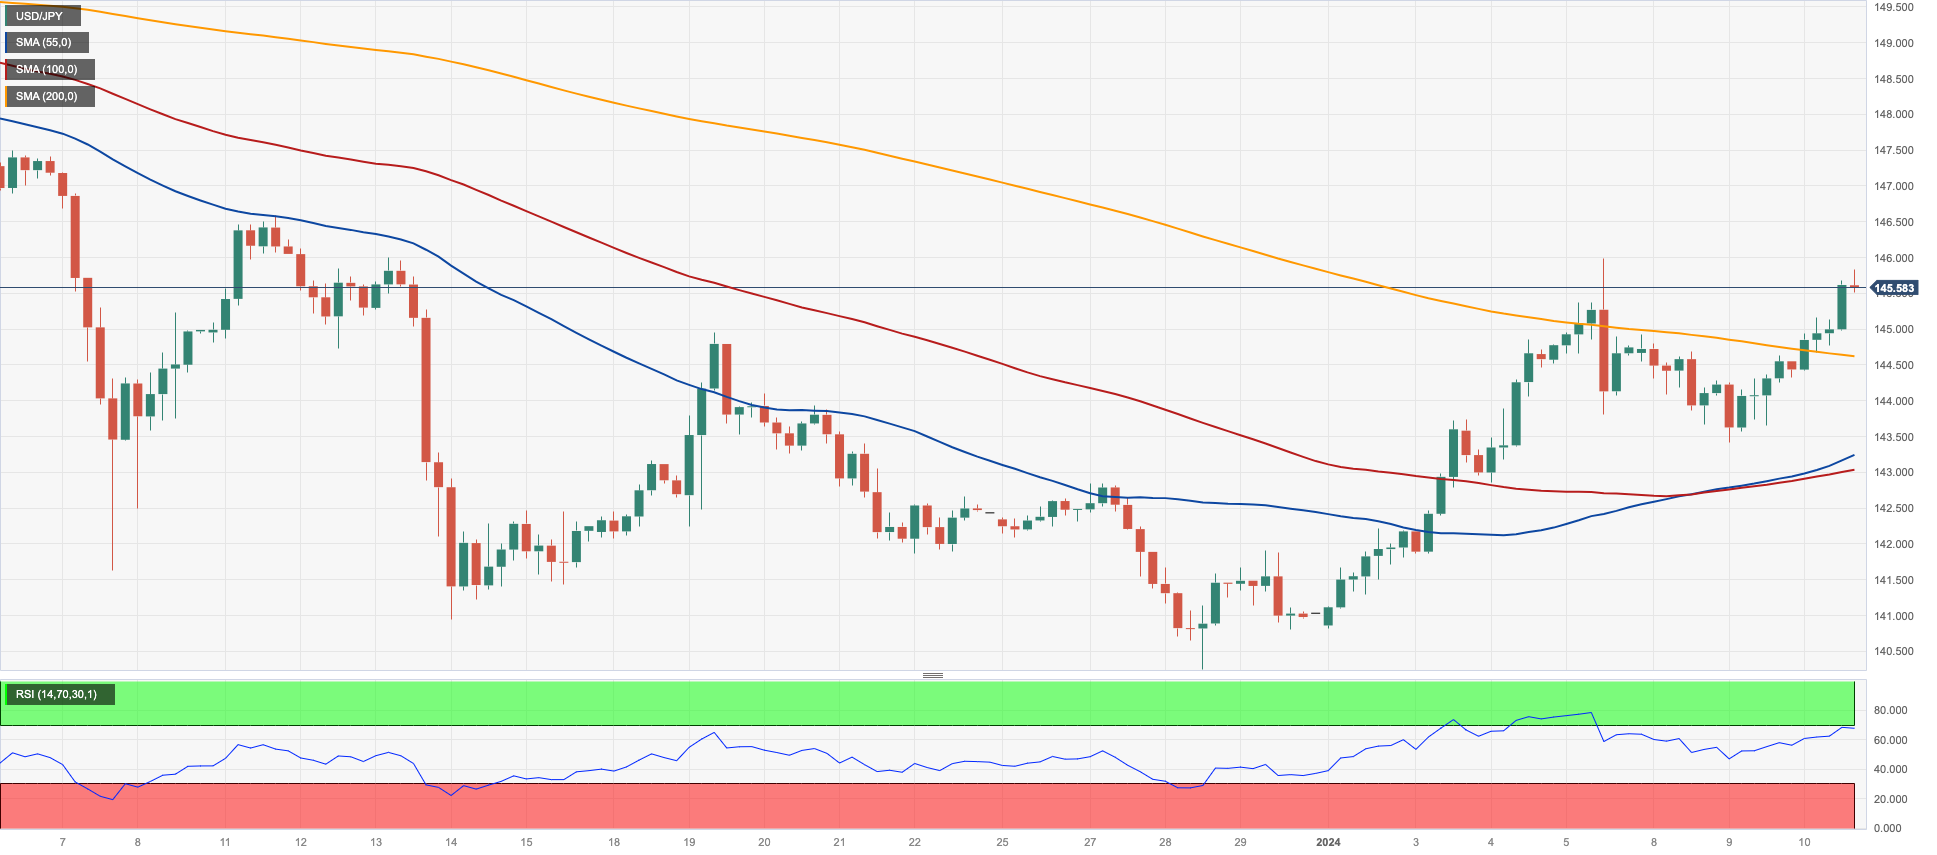
USDJPY
The intense resurgence of the appetite for riskier assets in combination with directionless US yields across the curve favoured further gains in USD/JPY.
Against that backdrop, the pair advanced to three-day highs near 145.80, while another negative session of JGB 10-year yields also bolstered the selling pressure in the Japanese currency.
In Japan, Average Cash Earnings expanded by 0.2% in November from a year earlier, while Overtime Pay increased by 0.9% over the last twelve months.
If the positive trend continues, USD/JPY will encounter the next up-barrier at the 2024 high of 145.97 (January 5) before confronting the transitory 55-day SMA of 146.80. The important 150.00 level emerges north of here, before the 2023 top of 151.90 (November 13), the 2022 peak of 151.94 (October 21), and the round number of 152.00. On the flip side, if the pair falls below the important 200-day SMA at 14.42, it may face the December 2023 low of 140.24 (December 28) before reaching the round milestone of 140.00. South of here, the July 2023 low of 137.23 (July 14) emerges, followed by the March 2023 low of 129.63 (March 24). The daily RSI flirted with the 57 yardstick.
Resistance levels: 145.97 146.58 147.49 (4H chart)
Support levels: 143.42 140.24 138.05 (4H chart)
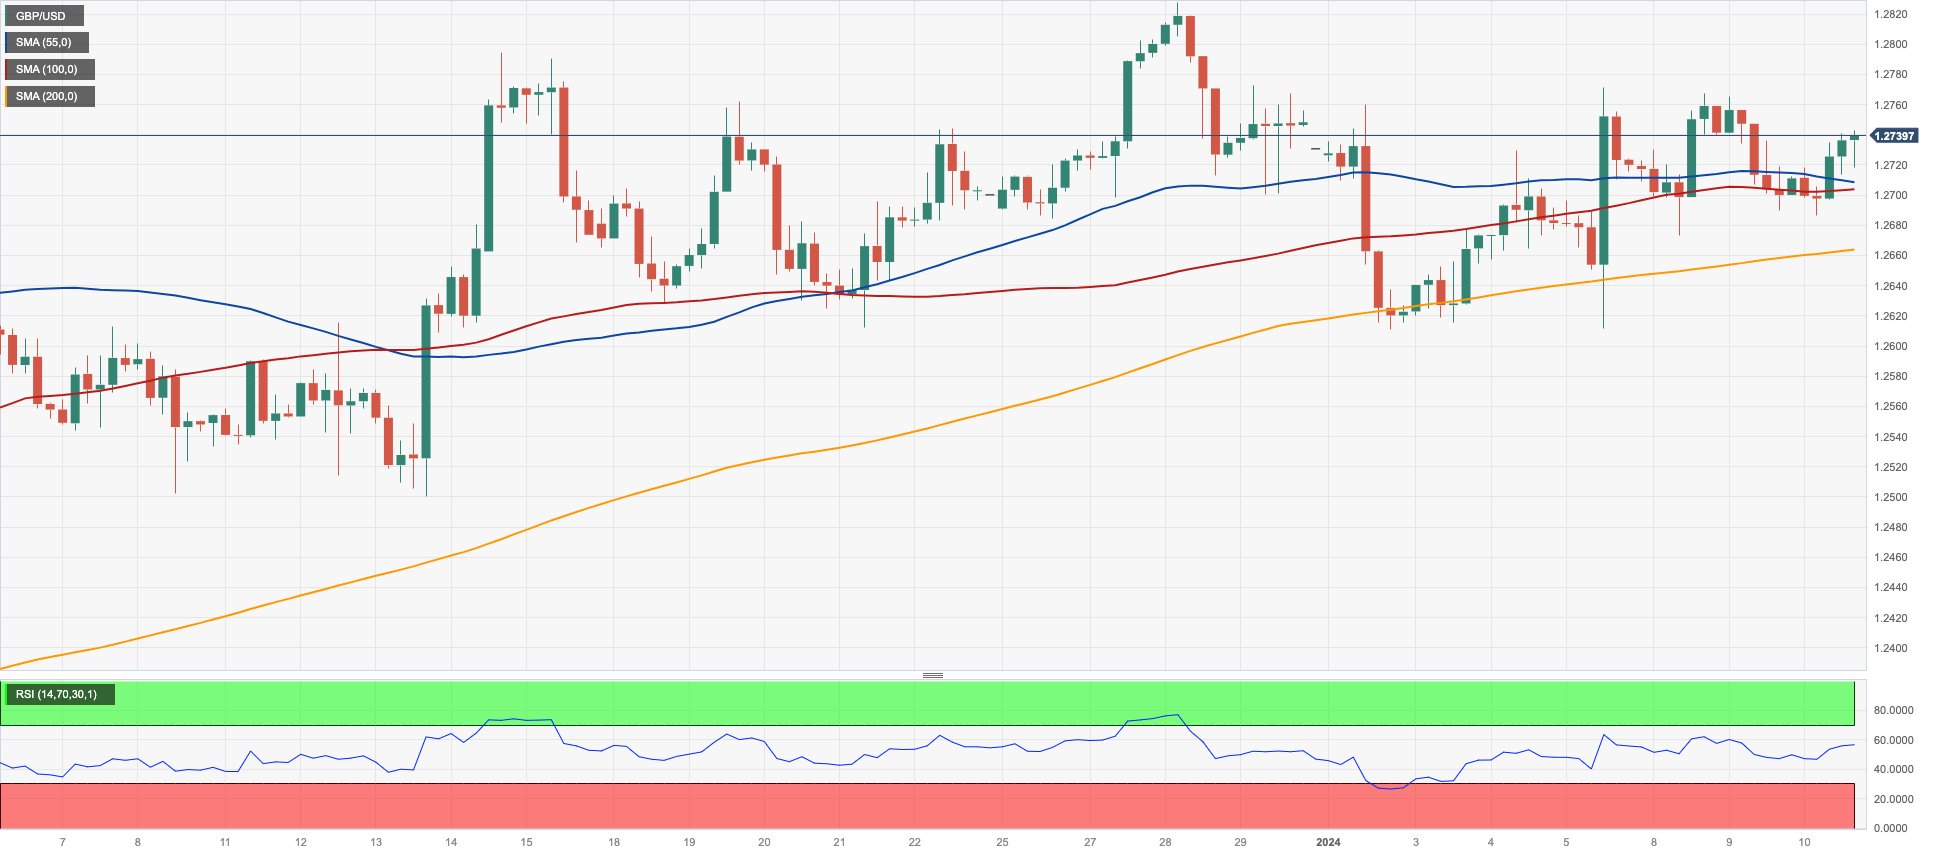
GBPUSD
The small knee-jerk in the greenback seems to have been enough to support a decent recovery in the British pound and the rest of the risk complex.
Indeed, GBP/USD faded Tuesday’s drop and advanced once again north of the 1.2700 barrier, following the soft tone in the dollar and rising prudence ahead of the publication of the US CPI on Thursday.
The pair’s bounce was also accompanied by another positive session in UK 10-year gilt yields, which added to the previous day’s advance beyond the 3.80% level.
Absent data releases across the Channel, investors’ attention remained on the testimony by BoE Governor A. Bailey to the UK Parliament, who said that it is crucial to bring UK inflation back to its goal. He also mentioned that there hasn't been a significant increase in unemployment in the UK. Additionally, he reported that household incomes in the UK have increased in recent months. Bailey believes that these factors help alleviate the impact of higher interest rates.
If the present recovery gains traction, GBP/USD might revisit the December 2023 top of 1.2827 (December 28), seconded by the weekly peak of 1.2995 (July 27 2023), which is just over the key 1.3000 level. A break below the so-far 2024 low of 1.2610 (January 2), on the other hand, might send the pair probing the 200-day SMA at 1.2538 before the December 2023 bottom of 1.2500 (December 13), which appears to be supported by the proximity of the temporary 55-day SMA. Once Cable clears this zone, it might begin a move to the weekly low of 1.2187 (November 10, 2023), which comes before the October 2023 low of 1.2037 (October 3), the key 1.2000 level, and the 2023 bottom of 1.1802 (November 10, 2023). The everyday RSI climbed to the proximity of 57.
Resistance levels: 1.2771 1.2827 1.2995 (4H chart)
Support levels: 1.2654 1.2610 1.2500 (4H chart)
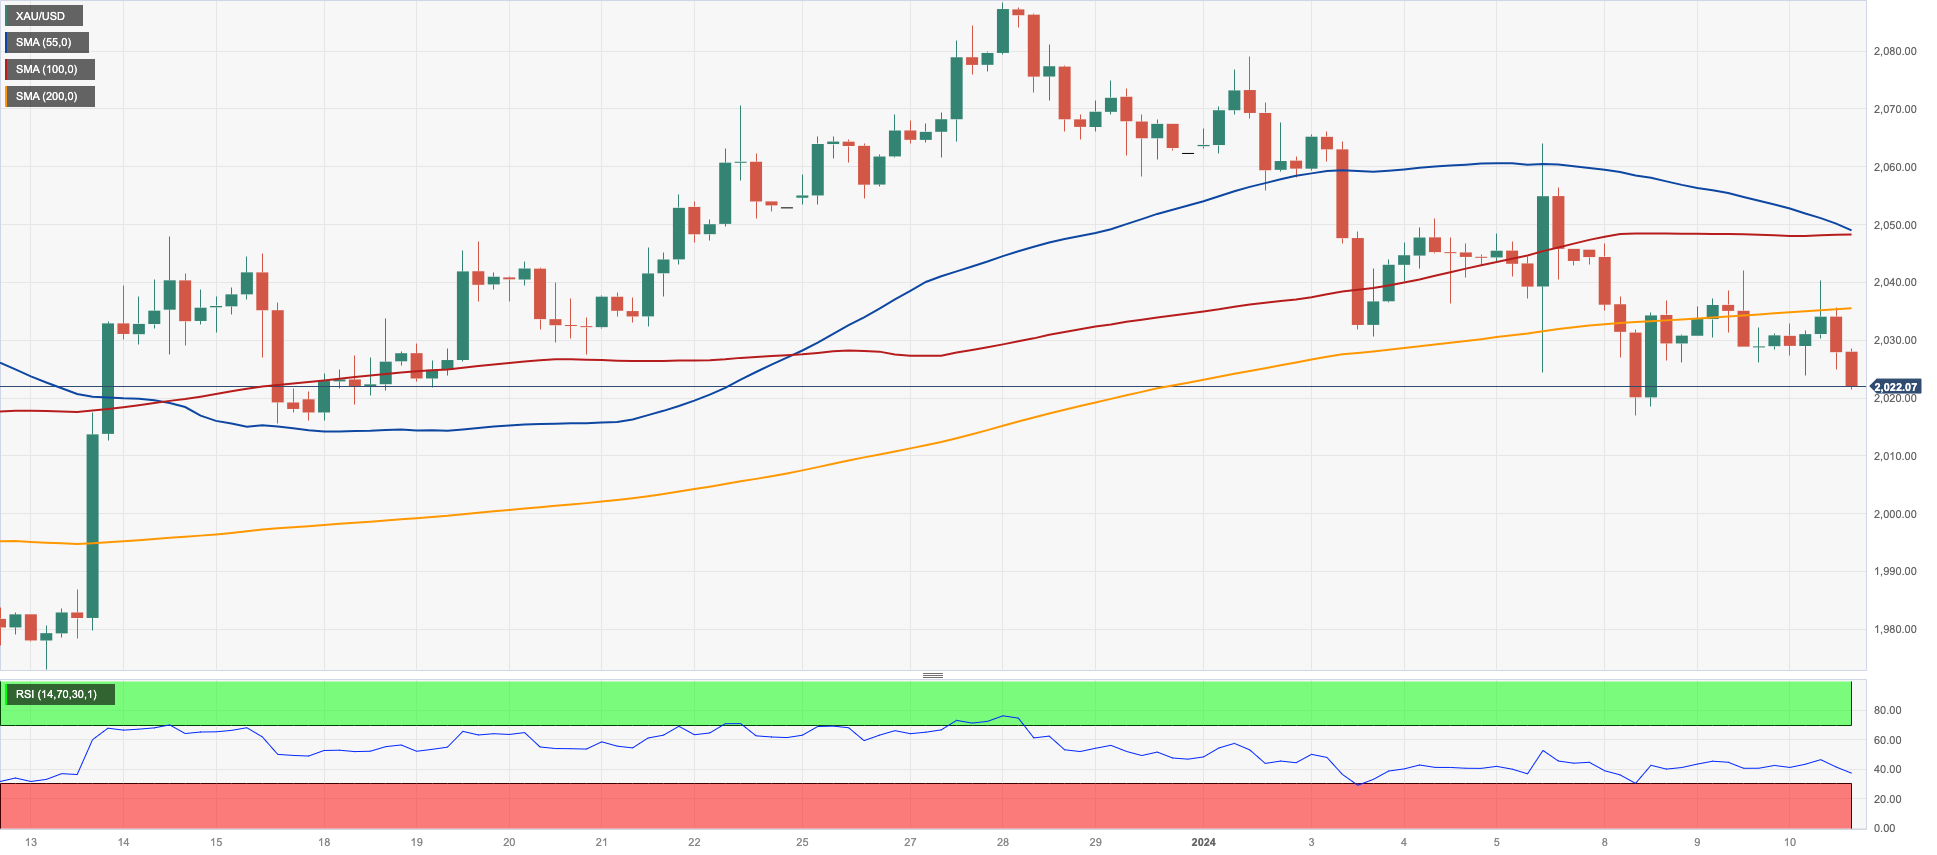
GOLD
Gold prices extended their weekly choppiness and ended the session marginally lower near the $2030 zone per troy ounce amidst a narrow trading range on Wednesday.
The slight pullback in the precious metal came despite the equally mild decline in the greenback, while the lack of a clear direction in US yields across the curve somehow limited the downside potential.
In the meantime, bullion is expected to keep a tight range amidst persevering cautiousness ahead of the release of US inflation readings for the month of December (January 11).
If the 2024 low of $2016 (January 8) is broken, gold prices may be dragged to the intermediate 55-day SMA around $2010 before hitting the critical conflict zone around $2000. This sector's breakdown indicates a decline to the December 2023 low of $1973 (December 13), which comes before the 200-day SMA of $1962 and the November 2023 low of $1931 (November 13). Down from here, the October 2023 low of $1810 (October 6), the 2023 low of $1804 (February 28), and, lastly, the important $1800 support zone may be seen. Instead, the next level of resistance is positioned at the weekly peak of $2088 (December 28), prior to the all-time high of $2150 (December 4 2023).
Resistance levels: $2064 $2078 $2088 (4H chart)
Support levels: $2016 $1973 $1965 (4H chart)
CRUDE WTI
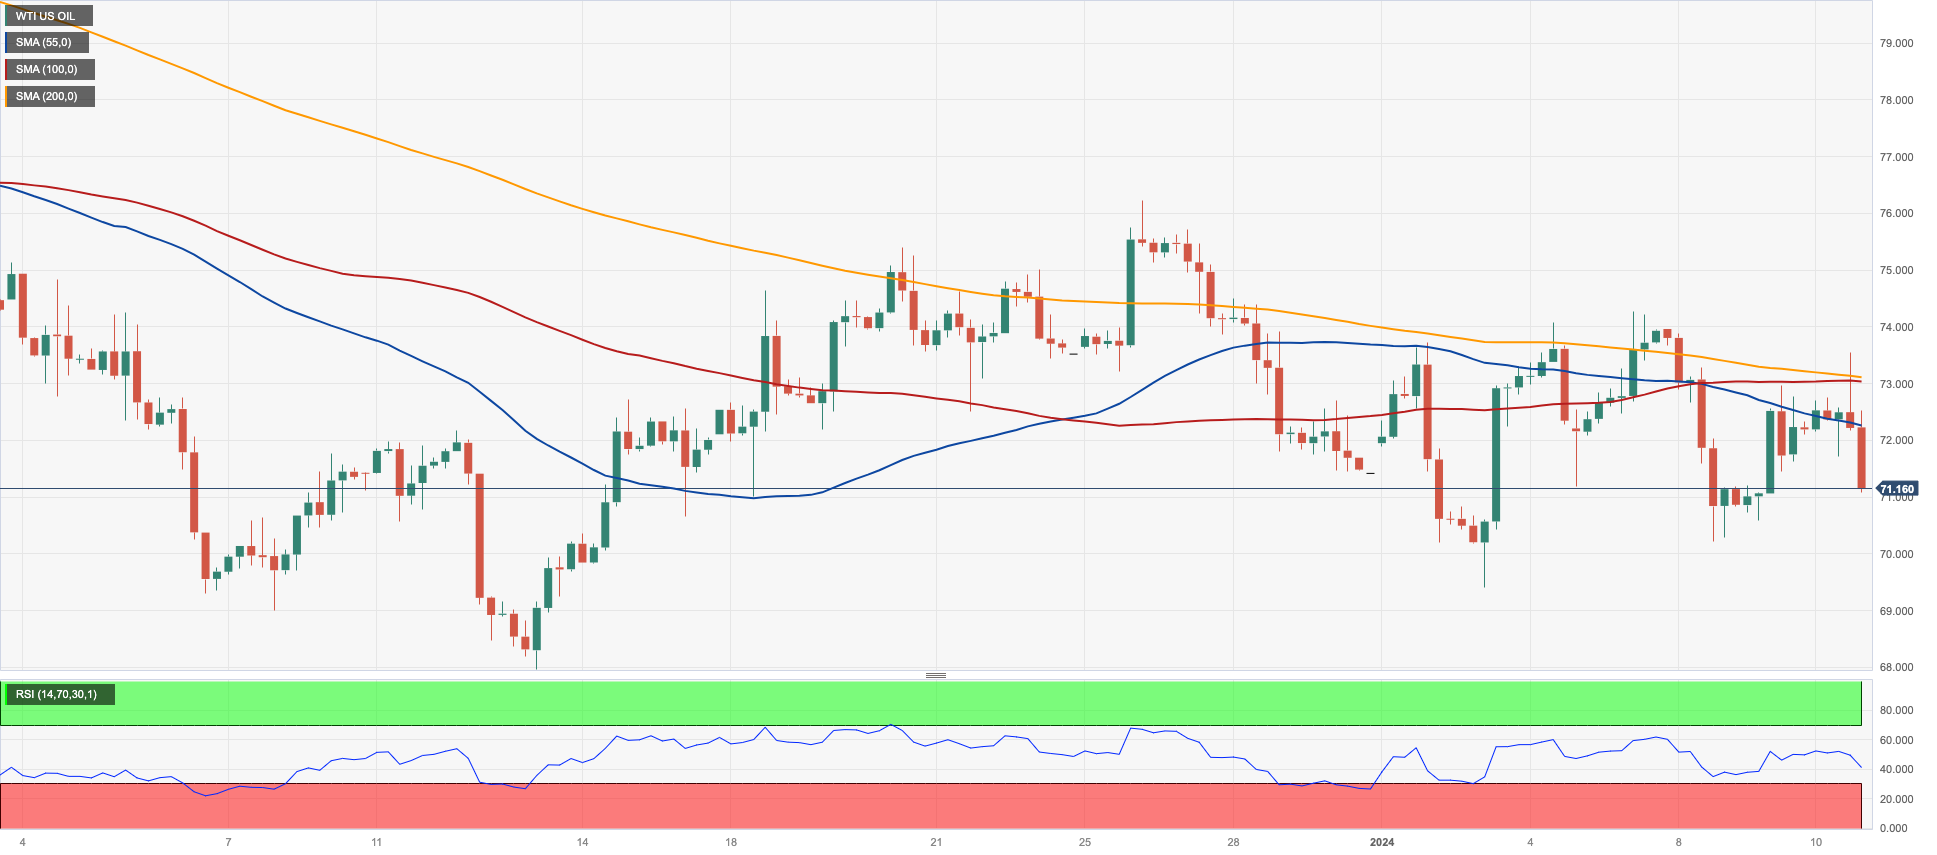
Prices of the WTI could not sustain the early move to daily highs past the $73.00 mark per barrel and retreated to the $71.50 region on Wednesday as the unexpected weekly build in US crude oil supplies, as per the EIA’s report, reignited demand concerns in the US market.
In fact, on the latter, the agency said that US crude oil inventories increased by 1.338M barrels in the week to January 5, while supplies at Cushing shrank by 0.506M barrels, Weekly Distillate Stocks went up by 6.528M barrels, and gasoline stockpiles rose by 8.029M barrels.
Meanwhile, geopolitical concerns in the Red Sea and the Israel-Hamas conflict continued to limit the downside of the commodity, along with supply disruption developments in Libya.
Looking at the broader picture, traders find themselves in a dilemma as they navigate through escalating oil transit costs in certain regions, sluggish global economic growth, and the possibility of upcoming interest rate cuts by the Fed starting in March.
WTI's next target is the weekly high of $76.14 (December 26 2023), followed by the crucial 200-day SMA at $77.85, the critical $80.00 barrier, and the November 2023 top of $80.15 (November 3). Further advances from here may push the market back to its weekly peak of $89.83 (October 18 2023), ahead of the 2023 high of $94.99 (September 28 2023) and the August 2022 top of $97.65 (August 30), all before the psychological $100.00 mark. In the other direction, a break below the 2024 low of $69.31 (January 3) would allow for a further slide to the December 2023 low of $67.74 (December 13), ahead of the June 2023 low of $66.85 (June 12) and the 2023 bottom of $63.61.
Resistance levels: $74.20 $76.14 $79.56 (4H chart)
Support levels: $70.10 $69.25 $67.68 (4H chart)
GER40
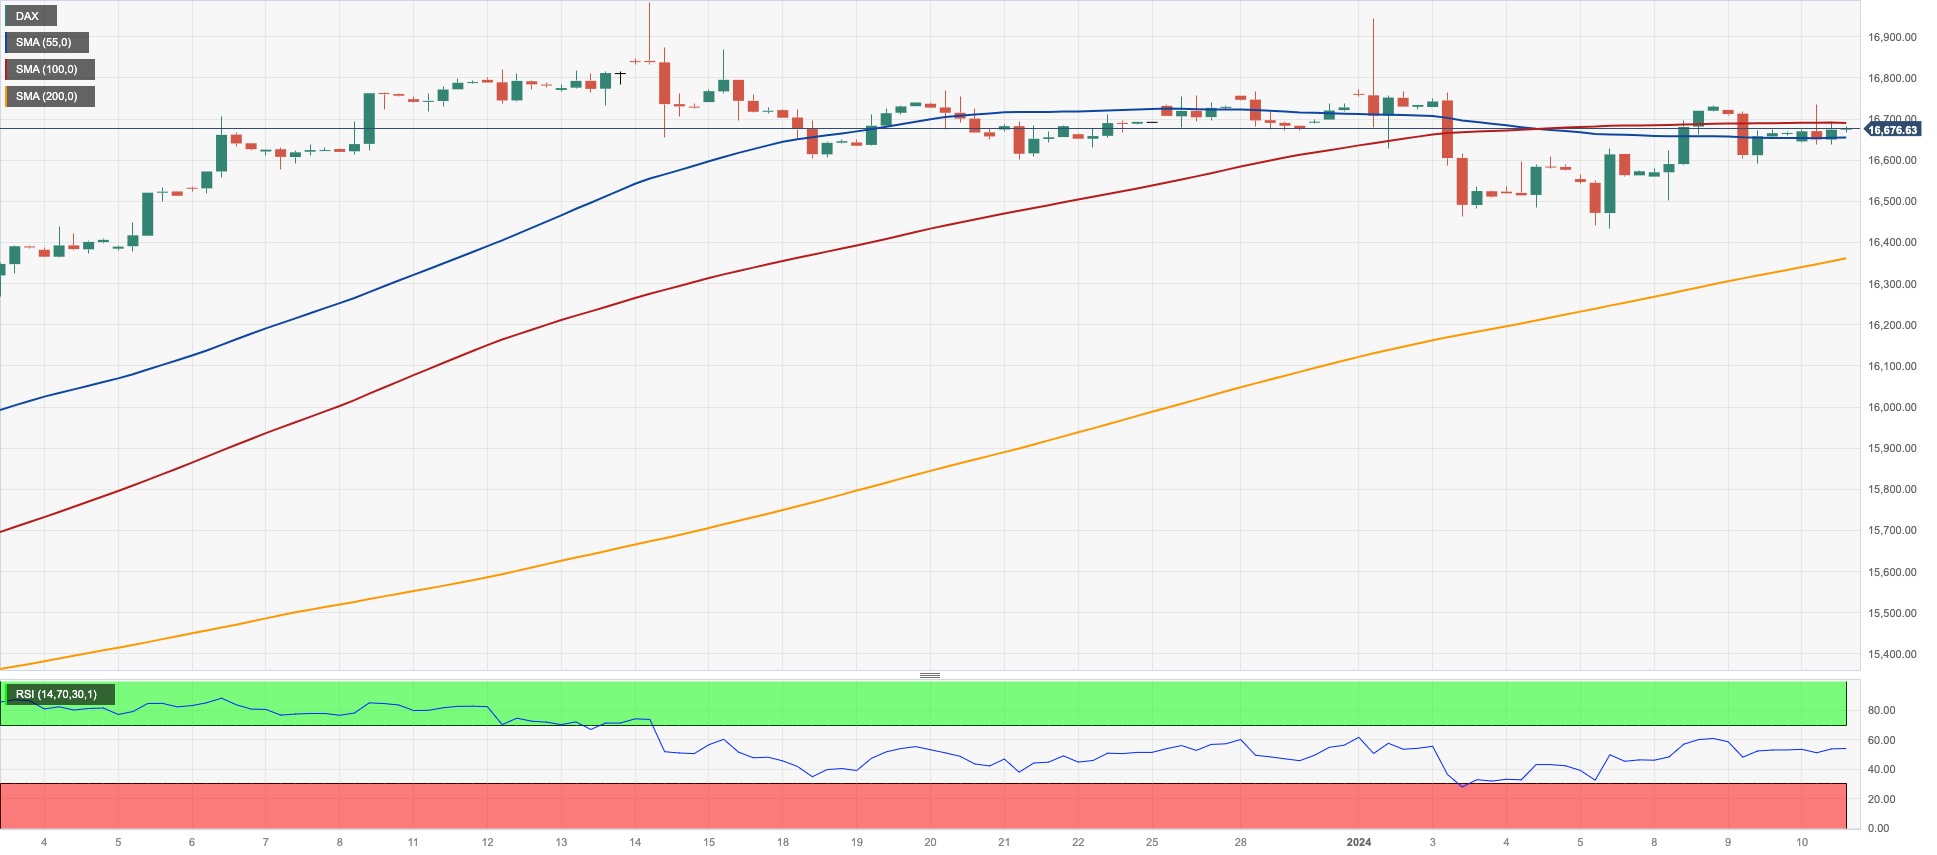
German stocks measured by the DAX40 ended the session barely changing around Tuesday’s closing levels near the 16700 zone on Wednesday.
The vacillating price action in the index came in tandem with persistent uncertainty prior to the release of US inflation prints gauged by the CPI on Thursday and its potential impact on the Fed’s intentions to start reducing its interest rates in the spring.
Additionally, German 10-year bund yields rose to three-week highs past 2.20%.
Further increases might take the DAX40 to the yearly peak of 16963 (January 2) before reaching the all-time high of 17003 (December 14). Having said that, immediate contention turns up at the so-far 2024 low of 16448 (January 5), which is previous to the weekly low of 15915 (November 28), as well as the crucial 200-day SMA of 15861. Down from here, the October 2023 bottom of 14630 (October 23) is aligned with the March 2023 low of 14458 (March 20). The daily RSI settled just below 60.
Best Performers: Heidelbergcement, Siemens Energy AG, SAP
Worst Performers: Sartorius AG VZO, Bayer, Qiagen
Resistance levels: 16963 17003 (4H chart)
Support levels: 16448 15915 15837 (4H chart)
GBPJPY
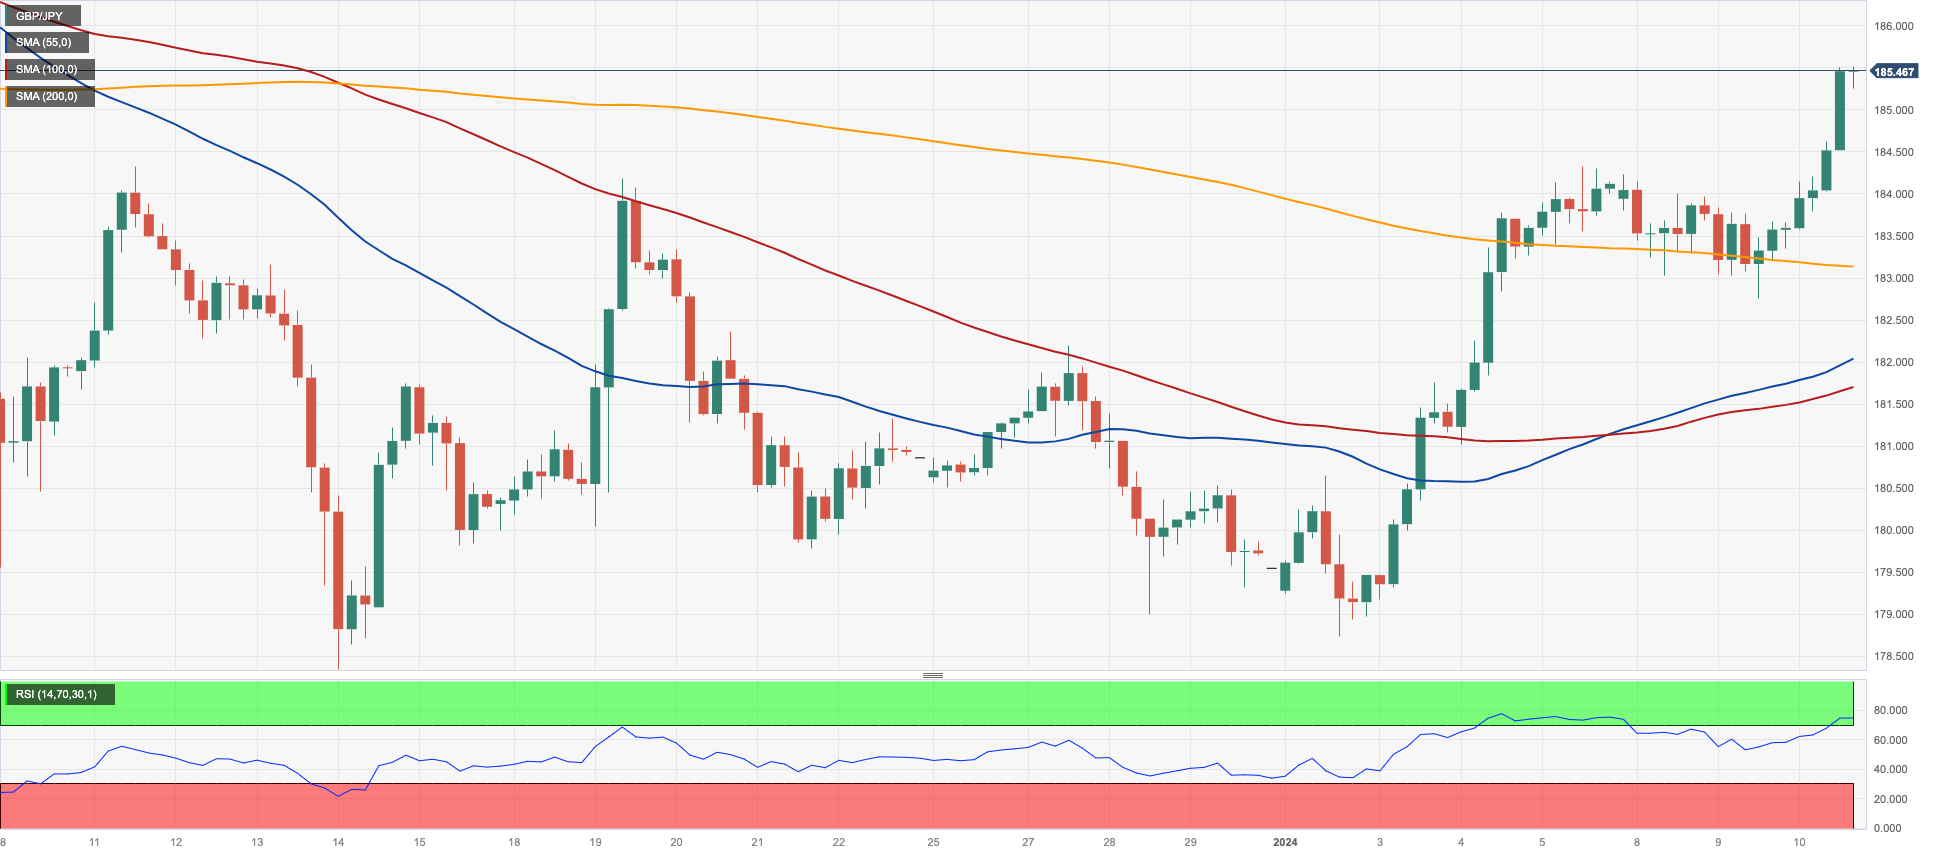
Further gains lifted GBP/JPY to a new five-week high around 185.50 on Wednesday.
In fact, the cross reversed two consecutive sessions of losses and rose sharply to levels last seen in early December against the backdrop of a broad-based optimism around the riskier assets.
The 2024 high of 185.51 (January 10) is immediately on the upside for GBP/JPY, followed by the 2023 top of 188.65 (November 24). The surpass of this level could put a test of the November 2015 peak of 188.80 (November 19) back on the radar ahead of the August 2015 high of 195.28 (August 18). On the downside, the loss of the 200-day SMA at 179.77 could prompt the cross to revisit the December 2023 bottom of 178.33 (December 14) prior to the October 2023 low of 178.03 (October 3) and the July 2023 low of 176.30 (July 28). If this level is breached, a deeper decline to the May 2023 bottom of 167.83 (May 11) might occur, ahead of the March 2023 low of 158.25 (March 24). The day-to-day RSI leapt above 60.
Resistance levels: 185.52 187.56 188.66 (4H chart)
Support levels: 182.75 182.07 178.74 (4H chart)
NASDAQ
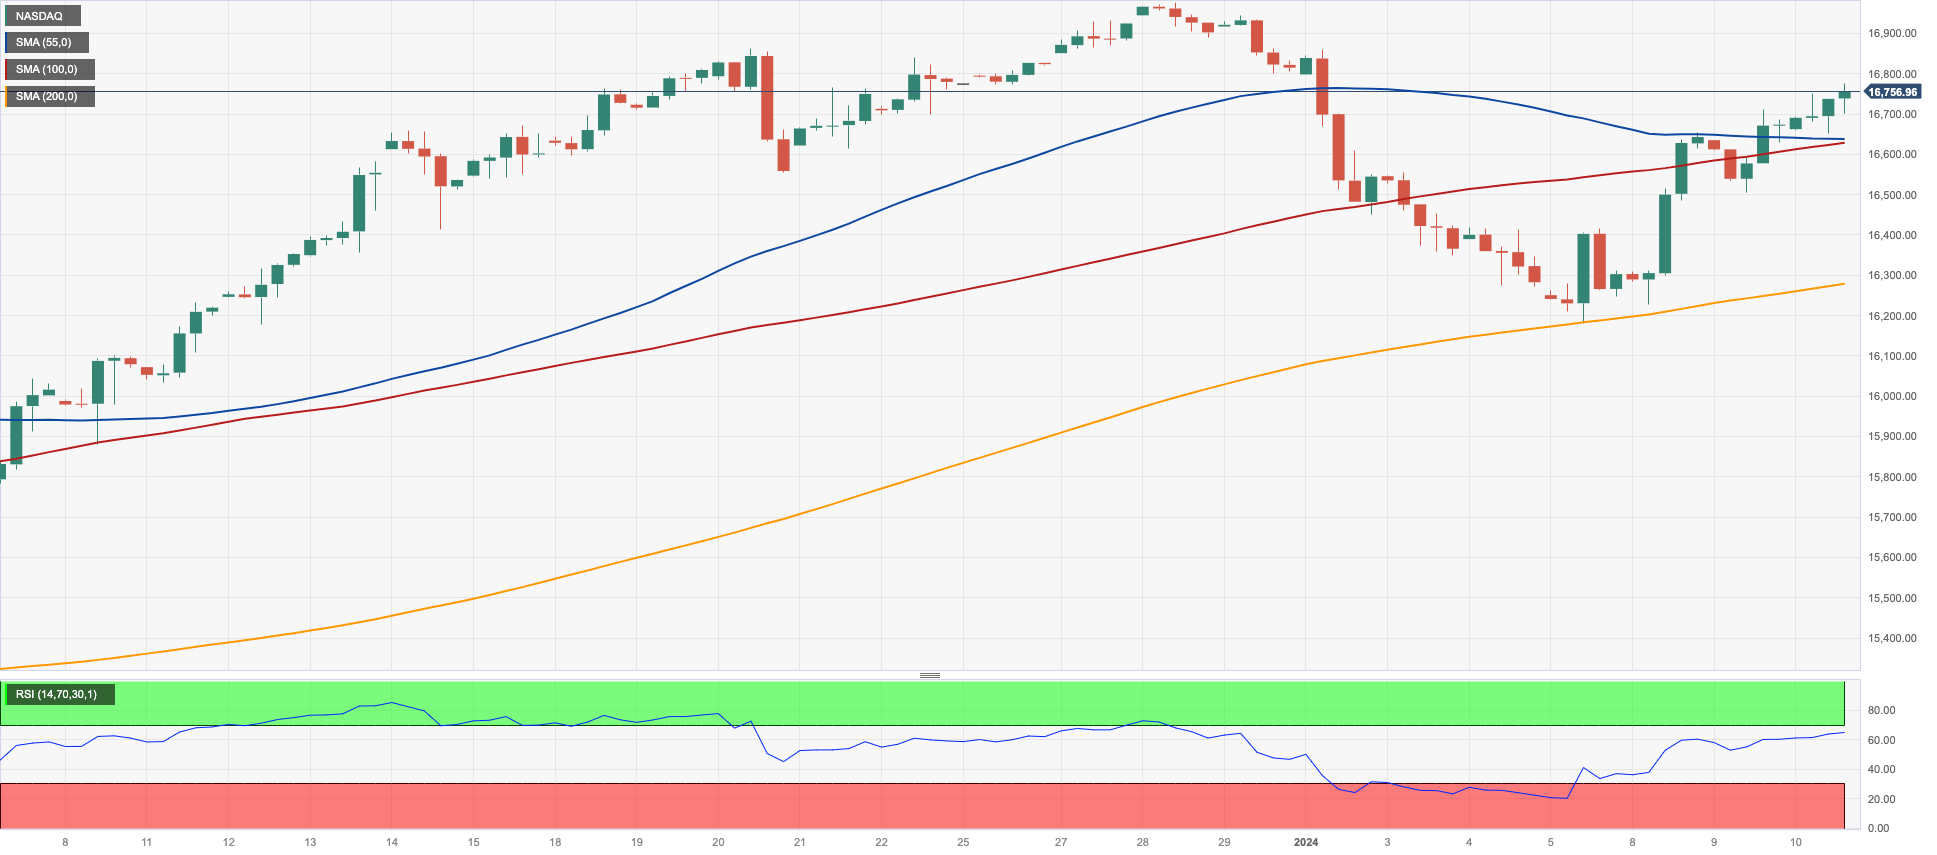
US tech equities tracked by the Nasdaq 100 clinched their fourth consecutive daily advance and surpassed the 16700 level on Wednesday.
The generalized optimism among traders amidst the risk-on mood, in combination with fresh weakness in the greenback and the lack of traction in US yields, all underpinned the move higher in the tech index.
Also bolstering the upside momentum in the Nasdaq 100 were the positive performances of megacaps Amazon, NVIDIA, Microsoft, and Meta.
The immediate upward goal for the Nasdaq 100 is the all-time high of 16969. (December 28 2023). Despite this, there is initial support at the January low of 16249 (January 5) before the December 2023 low of 15695 (December 4), which is followed by the critical 200-day SMA of 14866, which is followed by the October 2023 low of 14058. (October 26). After clearing the latter, the index may test the April 2023 bottom of 12724 (April 25), which is ahead of the March 2023 low of 11695 (March 13) and the 2023 low of 10696. (January 3). The daily RSI increased to the area beyond 61.
Top Gainers: Intuitive Surgical, Palo Alto Networks, Atlassian Corp Plc
Top Losers: Gilead, Walgreen Boots, Baker Hughes
Resistance levels: 16775 16969 (4H chart)
Support levels: 16249 15695 15481 (4H chart)
DOW JONES
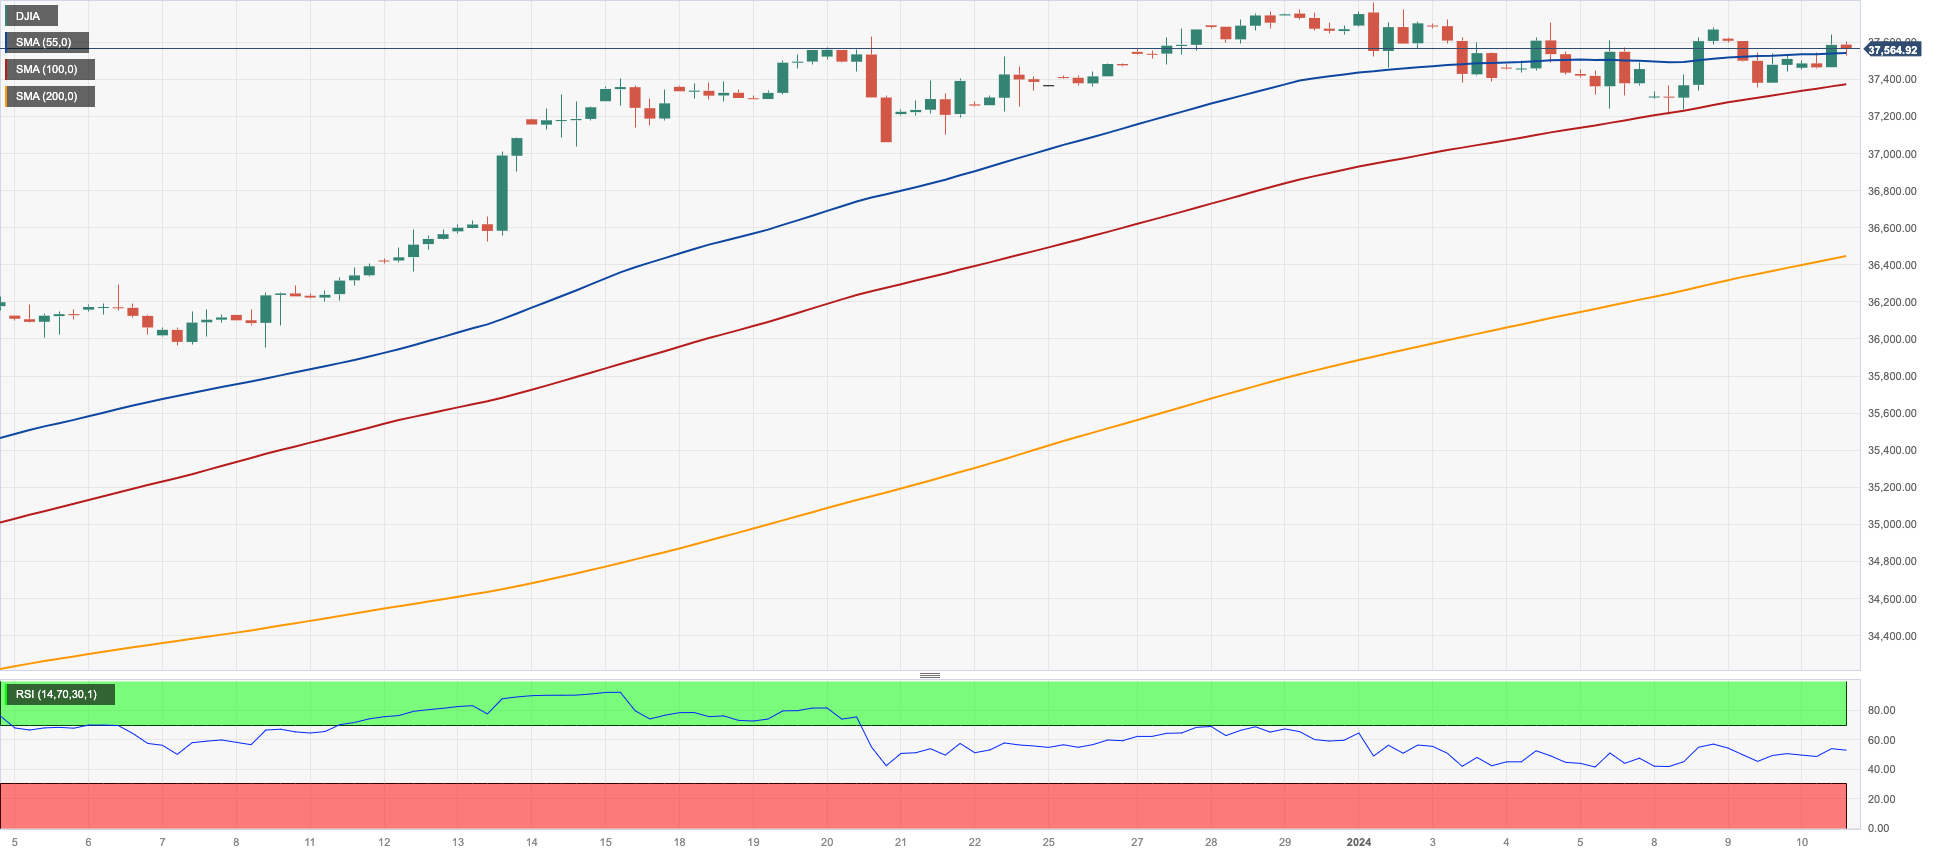
The benchmark stock index Dow Jones resumed the weekly upside and revisited the 37600 zone on Wednesday, rapidly leaving behind Tuesday’s inconclusive session.
The decent advance in US equities came amidst investors’ rising cautiousness ahead of the release of the US CPI on Thursday, as further disinflationary signs could reinforce speculation of interest rate cuts by the Fed as early as March.
In addition, prudence prior to the kick-off of the earnings season (Friday) also seems to have collaborated with the daily uptick in the index.
On the whole, the Dow Jones gained 0.18% to 37592, the S&P500 advanced 0.29% to 4769, and the tech-oriented Nasdaq Composite rose 0.49% to 14931.
If bulls push harder, the Dow will attempt to break over its all-time high of 37790 (January 2) sooner rather than later. The other way around, immediate support might be found at the so-far 2024 low of 37249 (January 8) ahead of the weekly low of 37073 (December 20 2023), which is prior to the December 2023 low of 36010 (December 5), as well as the important 200-day SMA at 34486. The weekly low of 33859 (November 7, 2023) comes next, followed by the October 2023 low of 32327 (October 27) and the 2023 low of 31429 (March 15). If this level is breached, the 2022 low of 28660 (October 13) may be jeopardized. The daily RSI looked stable around 66.
Top Performers: Home Depot, Microsoft, Boeing
Worst Performers: Walgreen Boots, American Express, Dow
Resistance levels: 37790 (4H chart)
Support levels: 37249 37073 36021 (4H chart)
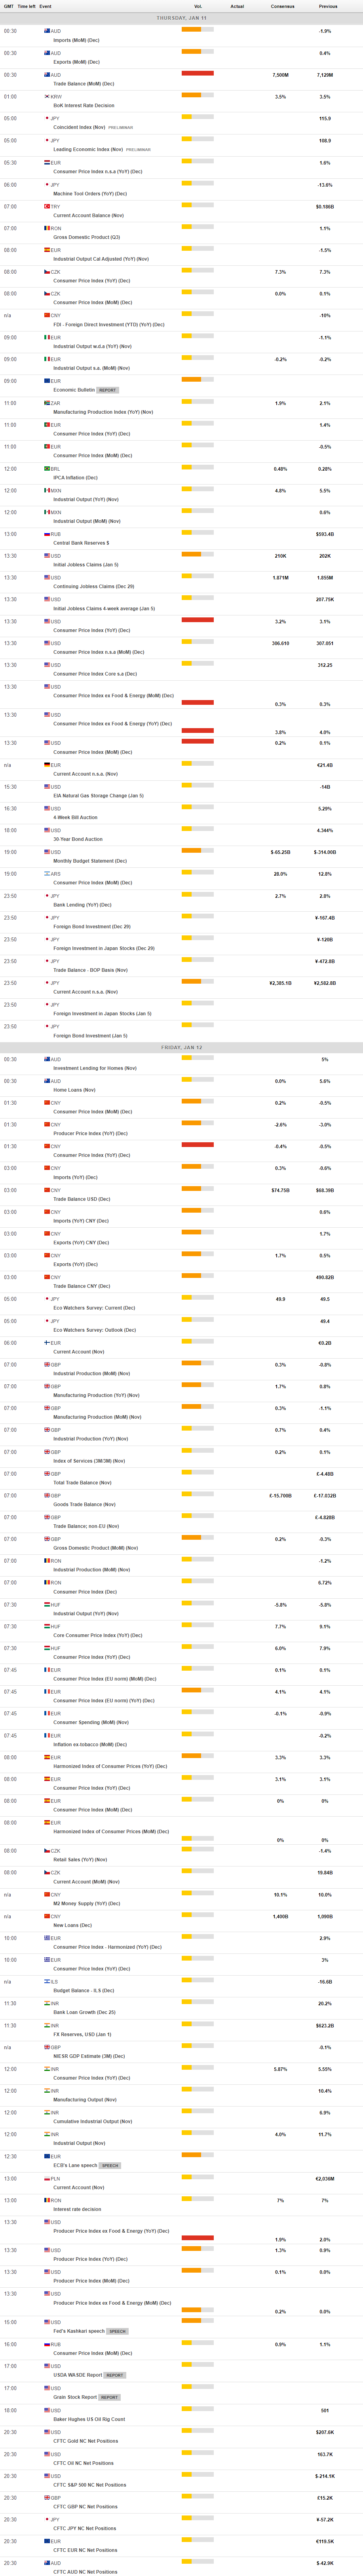
MACROECONOMIC EVENTS
All Information & Updates provided by:

All information relating to the financial markets available on this page has been prepared and issued by FXStreet (Forexstreet SL, Spain, Reg: B62498233) on the basis of publicly available information and all information believed to be reliable and does not conflict with Kuwaiti local laws, and all necessary care has been taken to before the company to ensure that the facts mentioned are correct from the source.
NCM Investment nor any of its directors or employees shall in any way be held responsible for the contents of this news, and the information contained on this page is intended only to provide clients with publicly available information and should not be construed as investment advice, report or analysis and/or constitute an offer or invitation to buy or sell financial instruments of any kind.
RISK WARNING: Forex and CFDs are highly risky leveraged products, as losses can exceed deposits. Please ensure you understand all the risks and take independent advice if necessary. NCM will segregate the clients based on the criteria of the regulator and its bylaws. NCM does not provide any advisory service; the material published does not constitute advice or a recommendation for a transaction in any financial instrument. NCM accepts no responsibility for any use of the content presented and any consequences of that use. Anyone acting on the information provided does so at their own risk.