
- Contact Us:
-

-

-

-


Daily Market Updates
12 Jan 2024
USDJPY
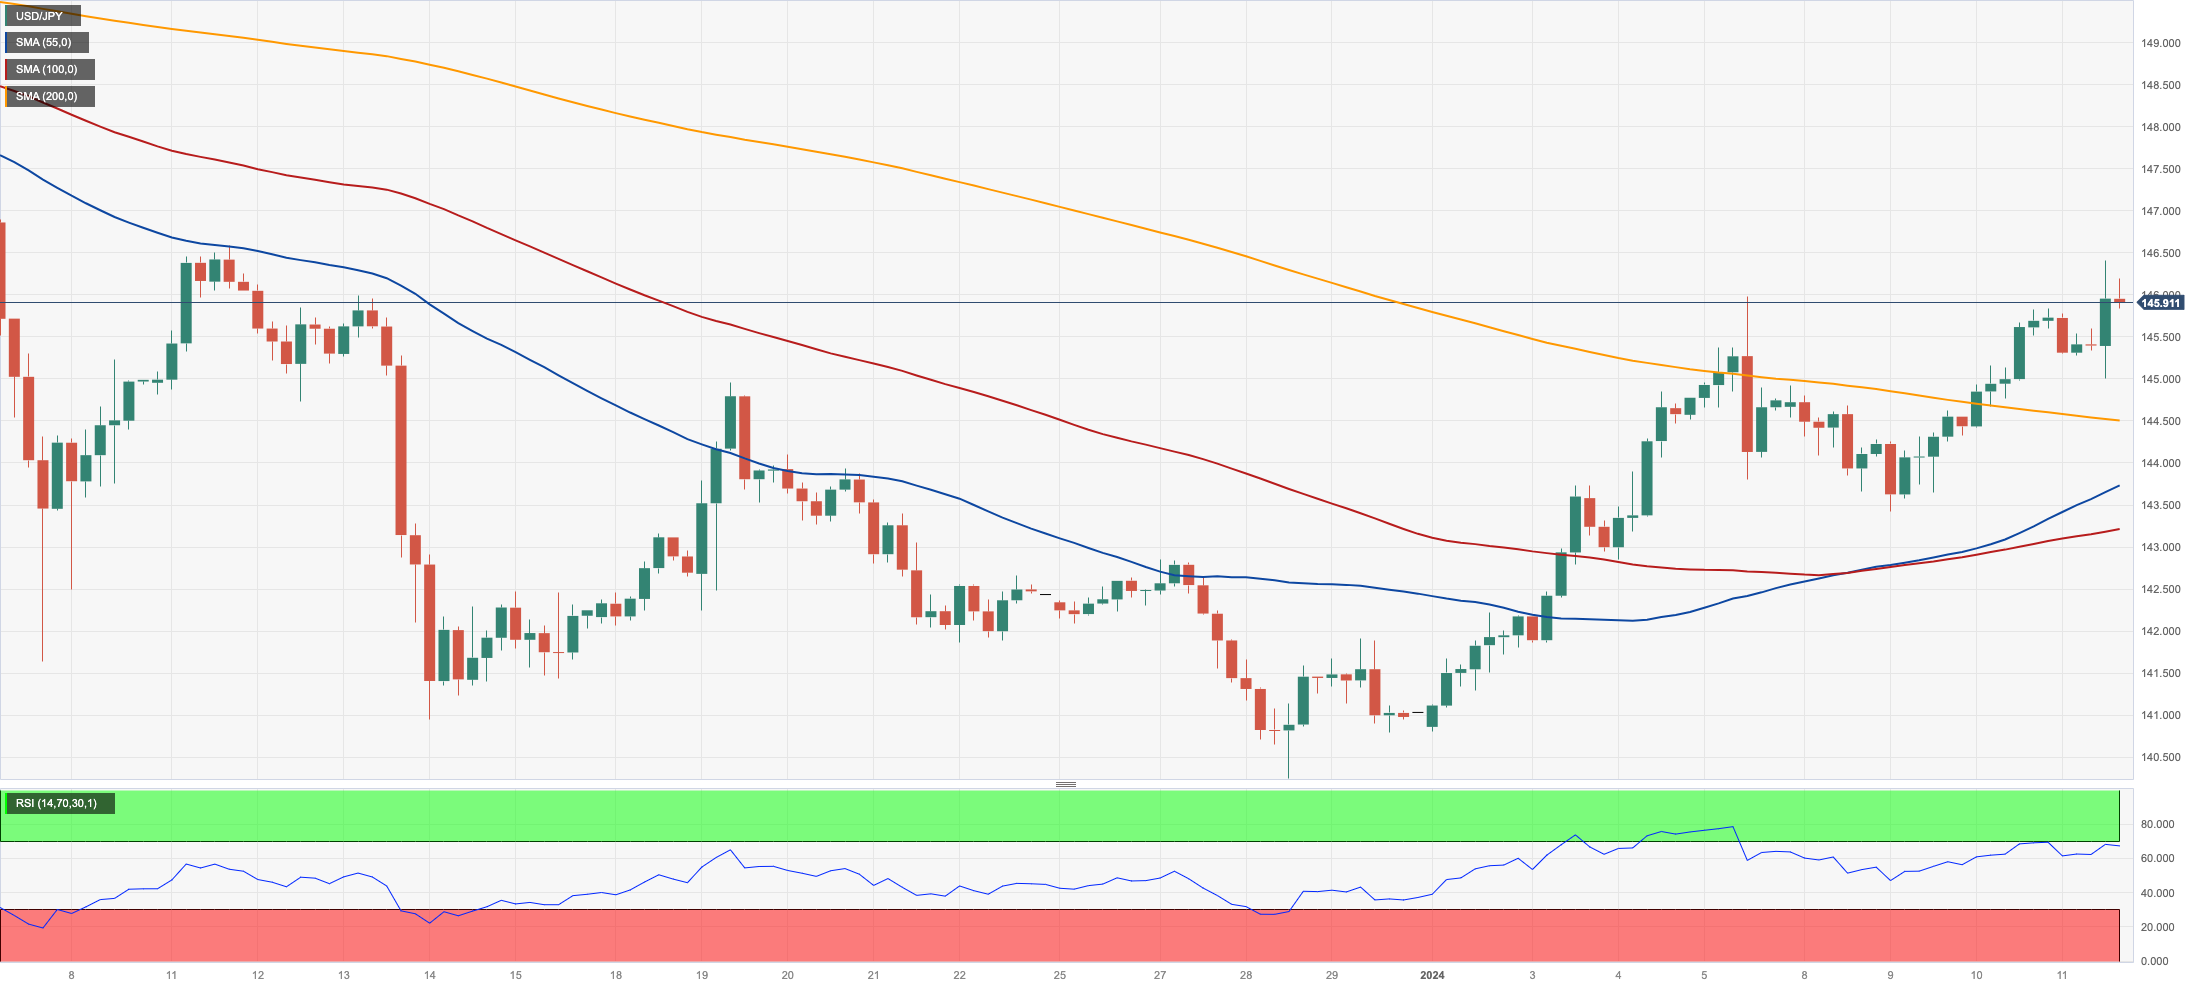
The marked rebound in the greenback motivated USD/JPY to advance to new four-week peaks beyond 146.00 the figure on Thursday, up for the third straight day.
The daily uptick in spot followed renewed strength in the buck, especially after US CPI came in above estimates in December, as well as the small uptick in yields in the belly and the long end of the curve as investors kicked back expectations of a Fed rate cut in March.
Meanwhile, in Japan, JGB 10-year yields managed to regain some balance and flirt with the 0.60% zone.
In the Japanese docket, preliminary November readings saw the Coincident Index ease to 114.5 and the Leading Economic Index recede to 107.7.
If the current upward trend continues, USD/JPY will face the next up-barrier at the 2024 high of 146.41 (January 11) before encountering the transitory 55-day SMA of 146.73. The crucial 150.00 level appears north of here, ahead of the 2023 top of 151.90 (November 13), the 2022 peak of 151.94 (October 21), and the round number of 152.00. If the pair goes below the 200-day SMA at 14.42, it may challenge the December 2023 low of 140.24 (December 28) before hitting the round milestone of 140.00. The July 2023 low of 137.23 (July 14) emerges south of here, followed by the March 2023 low of 129.63. (March 24). The daily RSI approached the 57 yardstick.
Resistance levels: 146.41 146.58 147.49 (4H chart)
Support levels: 144.78 143.42 140.24 (4H chart)
GBPUSD
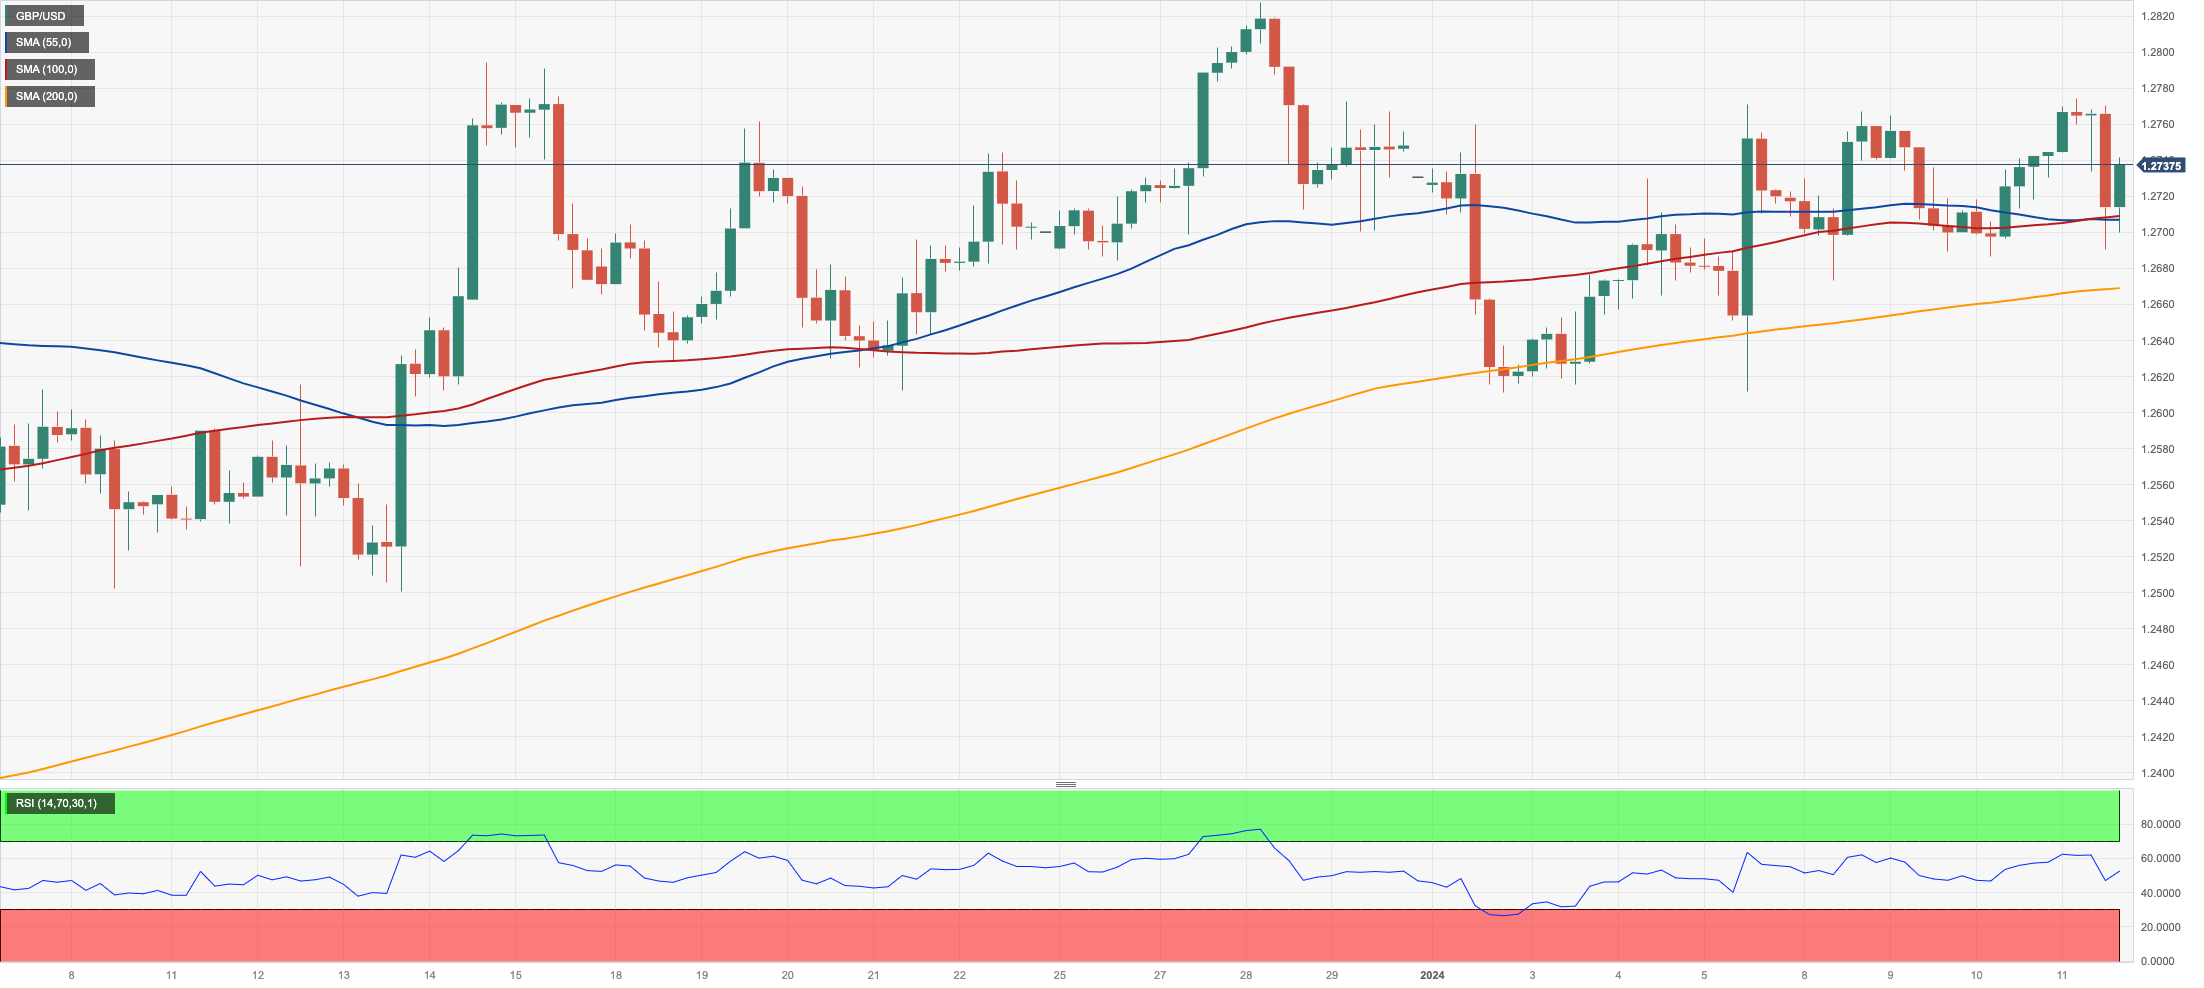
GBP/USD traded in a volatile fashion and closed around Wednesday’s levels near 1.2740 on Thursday.
Indeed, Cable briefly pierced the 1.2700 key support on the back of the resurgence of demand for the greenback as investors continued to reprice the likelihood of the Fed’s rate cuts in Q2, particularly in response to the surprising tick higher of US inflation in the last month of 2023.
In the UK money market, 10-year gilt yields added to the weekly recovery and traded at shouting distance from 3.85%.
There were no data releases scheduled across the Channel on Thursday.
If GBP/USD leave behind the current consolidative mood, it may revisit the December 2023 high of 1.2827 (December 28), followed by the weekly top of 1.2995 (July 27 2023), which is just over the critical 1.3000 mark. On the other hand, a break below the so-far 2024 low of 1.2610 (January 2) might send the pair probing the 200-day SMA at 1.2539 before the December 2023 bottom of 1.2500 (December 13), which looks to be supported by the temporary 55-day SMA's closeness. Extra weakness could prompt Cable to begin a move to the weekly low of 1.2187 (November 10, 2023), which comes before the October 2023 low of 1.2037 (October 3), the important 1.2000 mark, and the 2023 bottom of 1.1802 (November 10, 2023). The everyday RSI looked stable around 57
Resistance levels: 1.2771 1.2827 1.2995 (4H chart)
Support levels: 1.2654 1.2610 1.2500 (4H chart)
GOLD
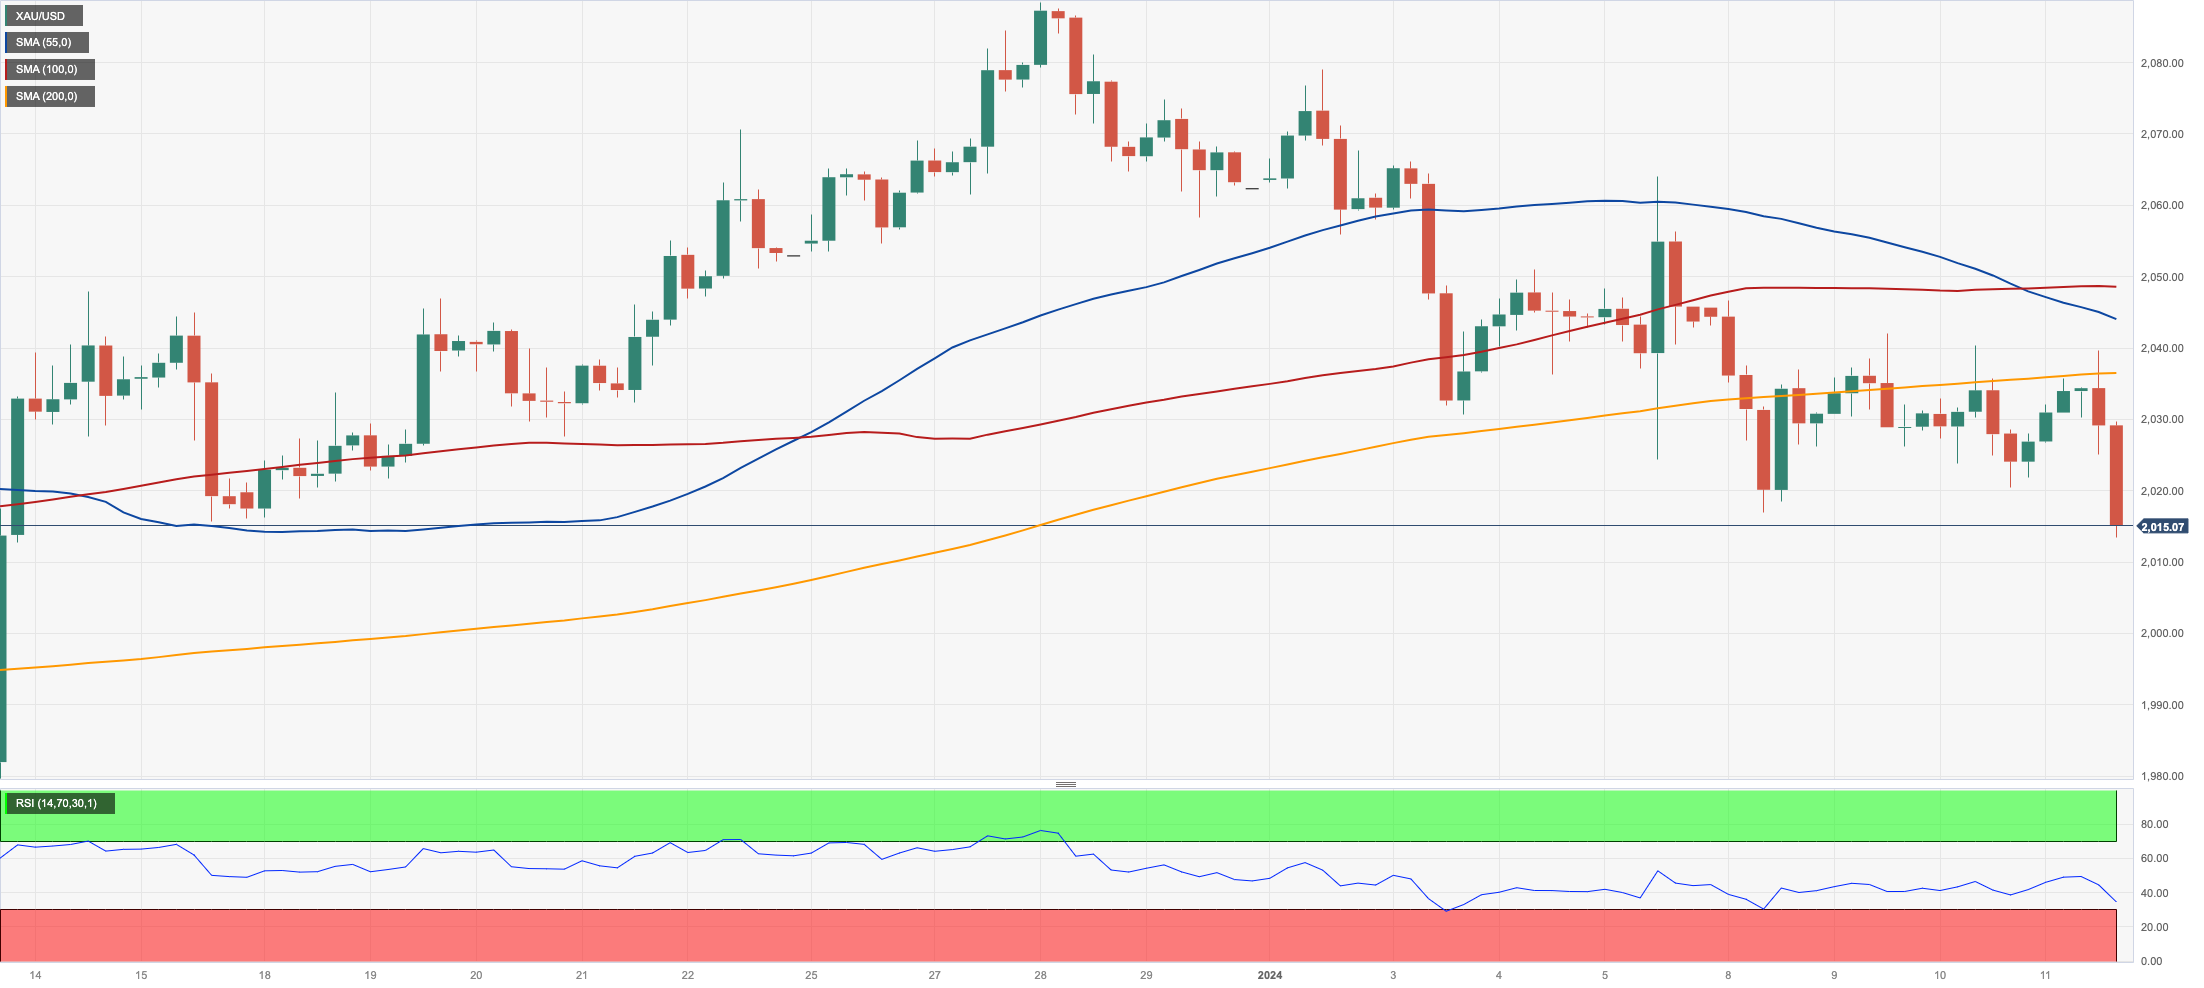
Extra demand for the greenback, along with further advances in the belly and the short end of the US yield curve, weighed on the precious metal on Thursday.
Indeed, the dollar gathered extra attention soon after higher-than-expected US inflation figures at the end of last year cast doubts about the possibility that the Fed might start trimming its interest rates as soon as March.
That said, the troy ounce of the yellow metal retreated to new four-week lows near the $2010 mark on Thursday.
The 2024 low of $2013 (January 11) appears underpinned by the intermediate 55-day SMA. The breakdown of this region might encourage bears to drag gold prices to the critical conflict zone around $2000 prior to the December 2023 low of $1973 (December 13), seconded by the 200-day SMA of $1963 and the November 2023 low of $1931 (November 13). Down from here, the October 2023 bottom of $1810 (October 6), the 2023 low of $1804 (February 28), and, lastly, the important $1800 support zone may be seen. Just the opposite, the next level of resistance is found at the weekly top of $2088 (December 28), just before the all-time peak of $2150. (December 4, 2023).
Resistance levels: $2064 $2078 $2088 (4H chart)
Support levels: $2013 $1973 $1965 (4H chart)
CRUDE WTI
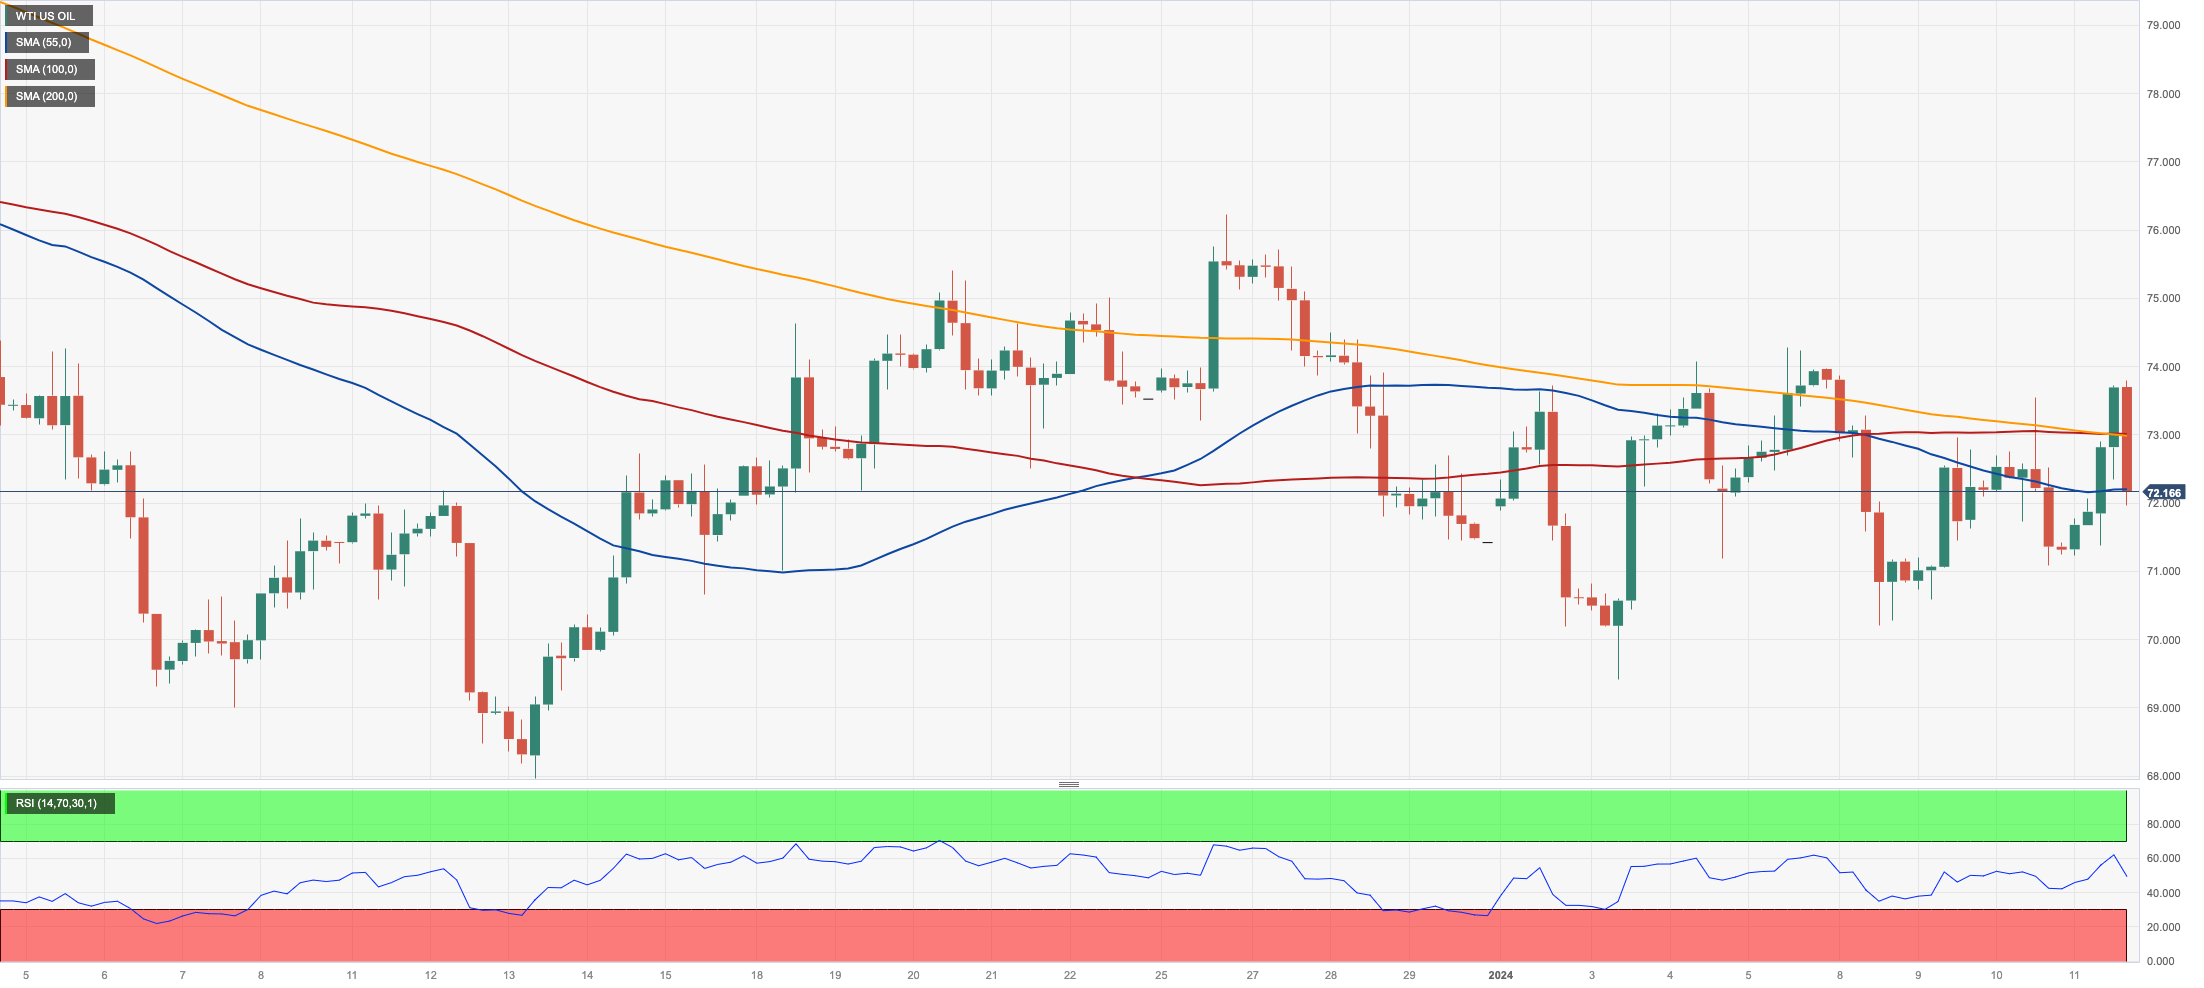
Crude oil prices regained some shine lost in the previous session and rose to the vicinity of the $74.00 mark per barrel of West Texas Intermediate (WTI) on Thursday.
The recovery in WTI prices came on the back of the deteriorating geopolitical landscape, where the Red Sea and the Israel-Hamas conflict remain at the centre of the debate.
Somehow tempering the upside bias in the commodity appeared the likelihood that the Fed might keep its restrictive stance for longer before starting to cut rates, particularly following the December uptick in US inflation.
Also on the negative side remained rising US crude oil production and the unexpected weekly build in US crude oil inventories, as per the latest EIA weekly report.
The weekly high of $76.14 (December 26 2023) is the next objective for WTI, followed by the important 200-day SMA at $77.84, the vital $80.00 barrier, and the November 2023 top of $80.15 (November 3). Further gains from here may propel the market back to its weekly peak of $89.83 (October 18 2023), ahead of the 2023 high of $94.99 (September 28 2023) and the August 2022 top of $97.65 (August 30), all before the psychological $100.00 mark. On the opposite side, a break below the 2024 low of $69.31 (January 3) would allow a further decline to the December 2023 low of $67.74 (December 13), ahead of the June 2023 low of $66.85 (June 12) and the 2023 bottom of $63.61.
Resistance levels: $74.20 $76.14 $79.56 (4H chart)
Support levels: $70.10 $69.25 $67.68 (4H chart)
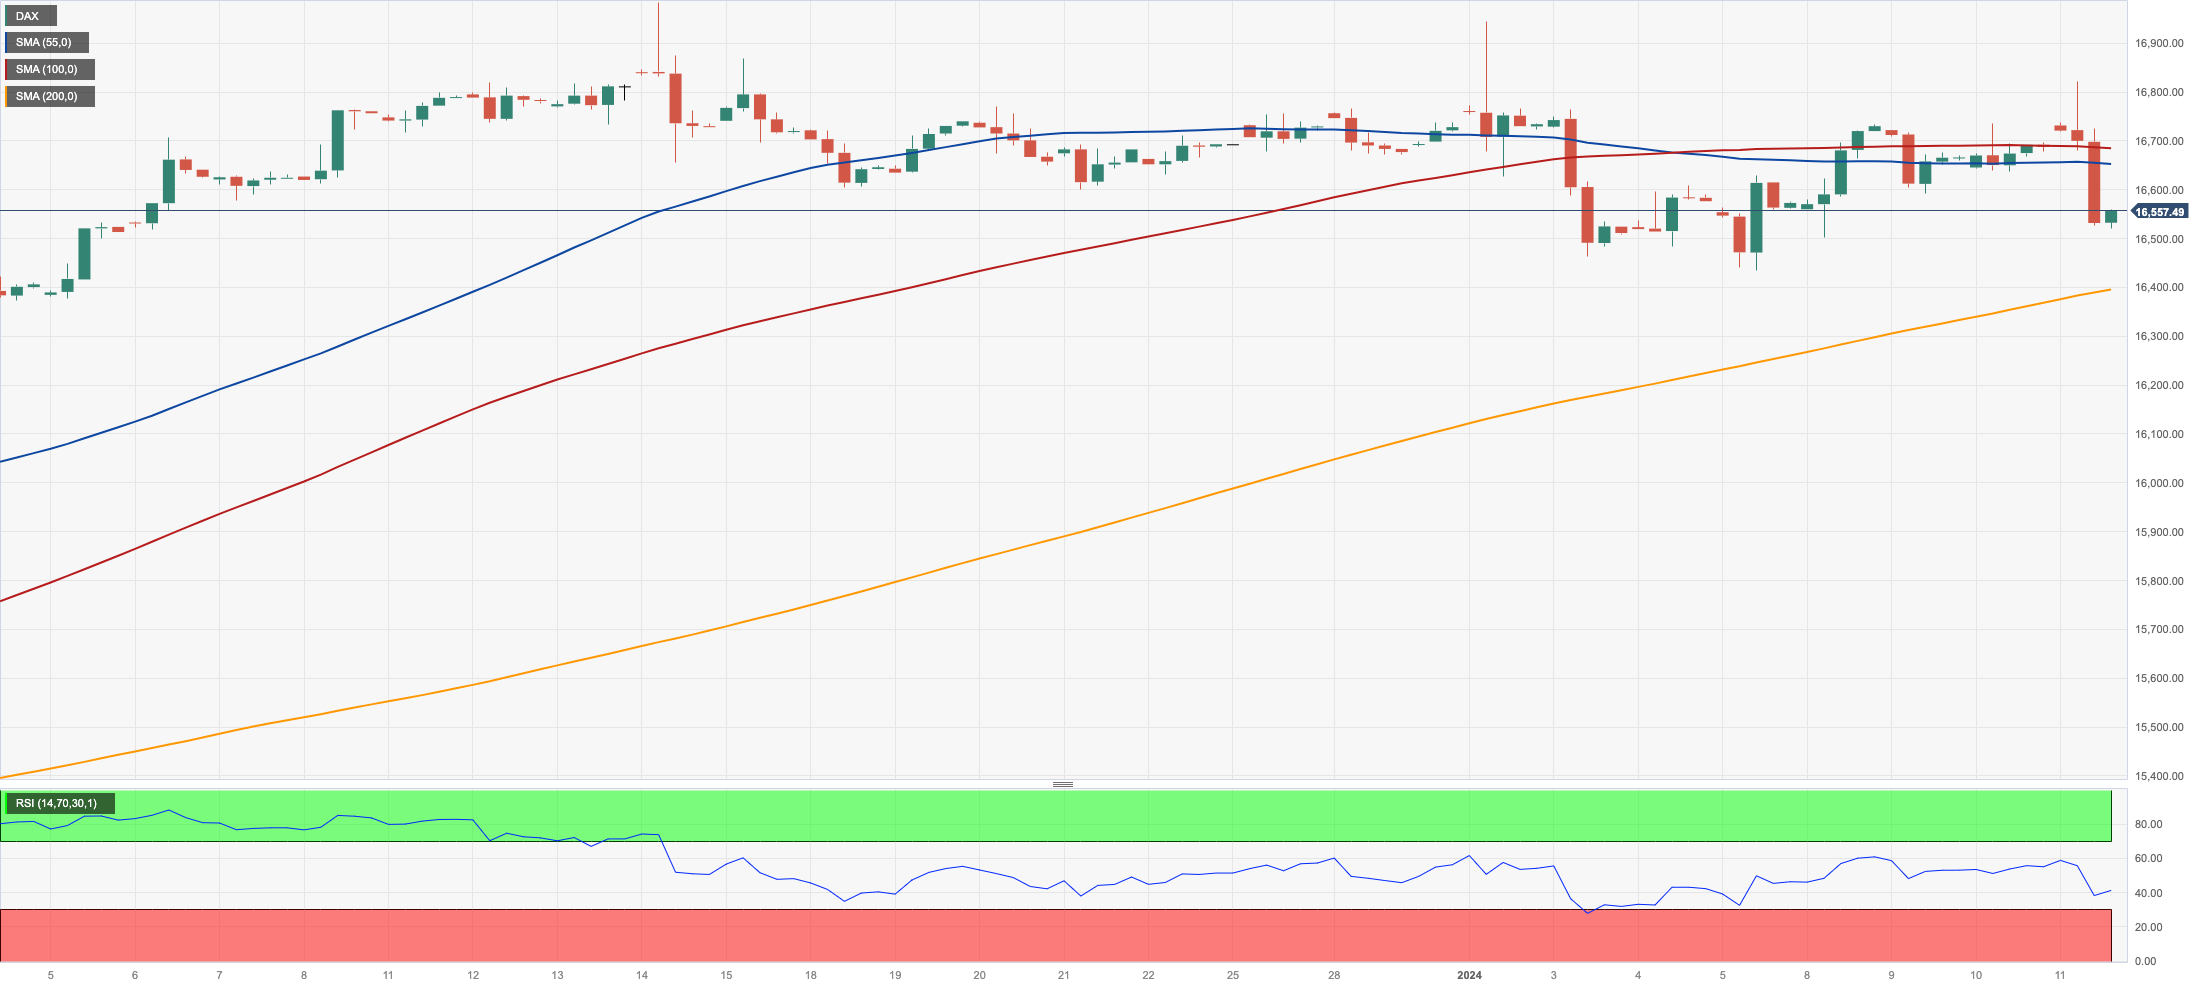
GER40
Germany’s benchmark DAX40 retreated to three-day lows near the 16500 zone on Thursday.
The resumption of the downward trend in German equities followed the broad-based sour mood after the rebound of US inflation figures in December, which somewhat put to the test the ongoing speculation of the first interest rate cut by the Fed to come as soon as March.
The corrective decline in the index was accompanied by a slight drop in 10-year bund yields to the 2.20% region.
Domestically, the Current Account surplus increased to €30.8B in November.
Further gains might propel the DAX40 to an annual high of 16963 (January 2) before reaching an all-time top of 17003. (December 14). However, immediate conflict appears at the so-far 2024 low of 16448 (January 5), which is prior to the weekly low of 15915 (November 28), as well as the critical 200-day SMA of 15867. The October 2023 bottom of 14630 (October 23) corresponds to the March 2023 low of 14458. (March 20). The daily RSI deflated to the 50 zone.
Best Performers: Rheinmetall AG, Henkel VZO, Beiersdorf AG
Worst Performers: Deutsche Bank AG, RWE AG ST, Bayer
Resistance levels: 16839 16963 17003 (4H chart)
Support levels: 16448 15915 15837 (4H chart)
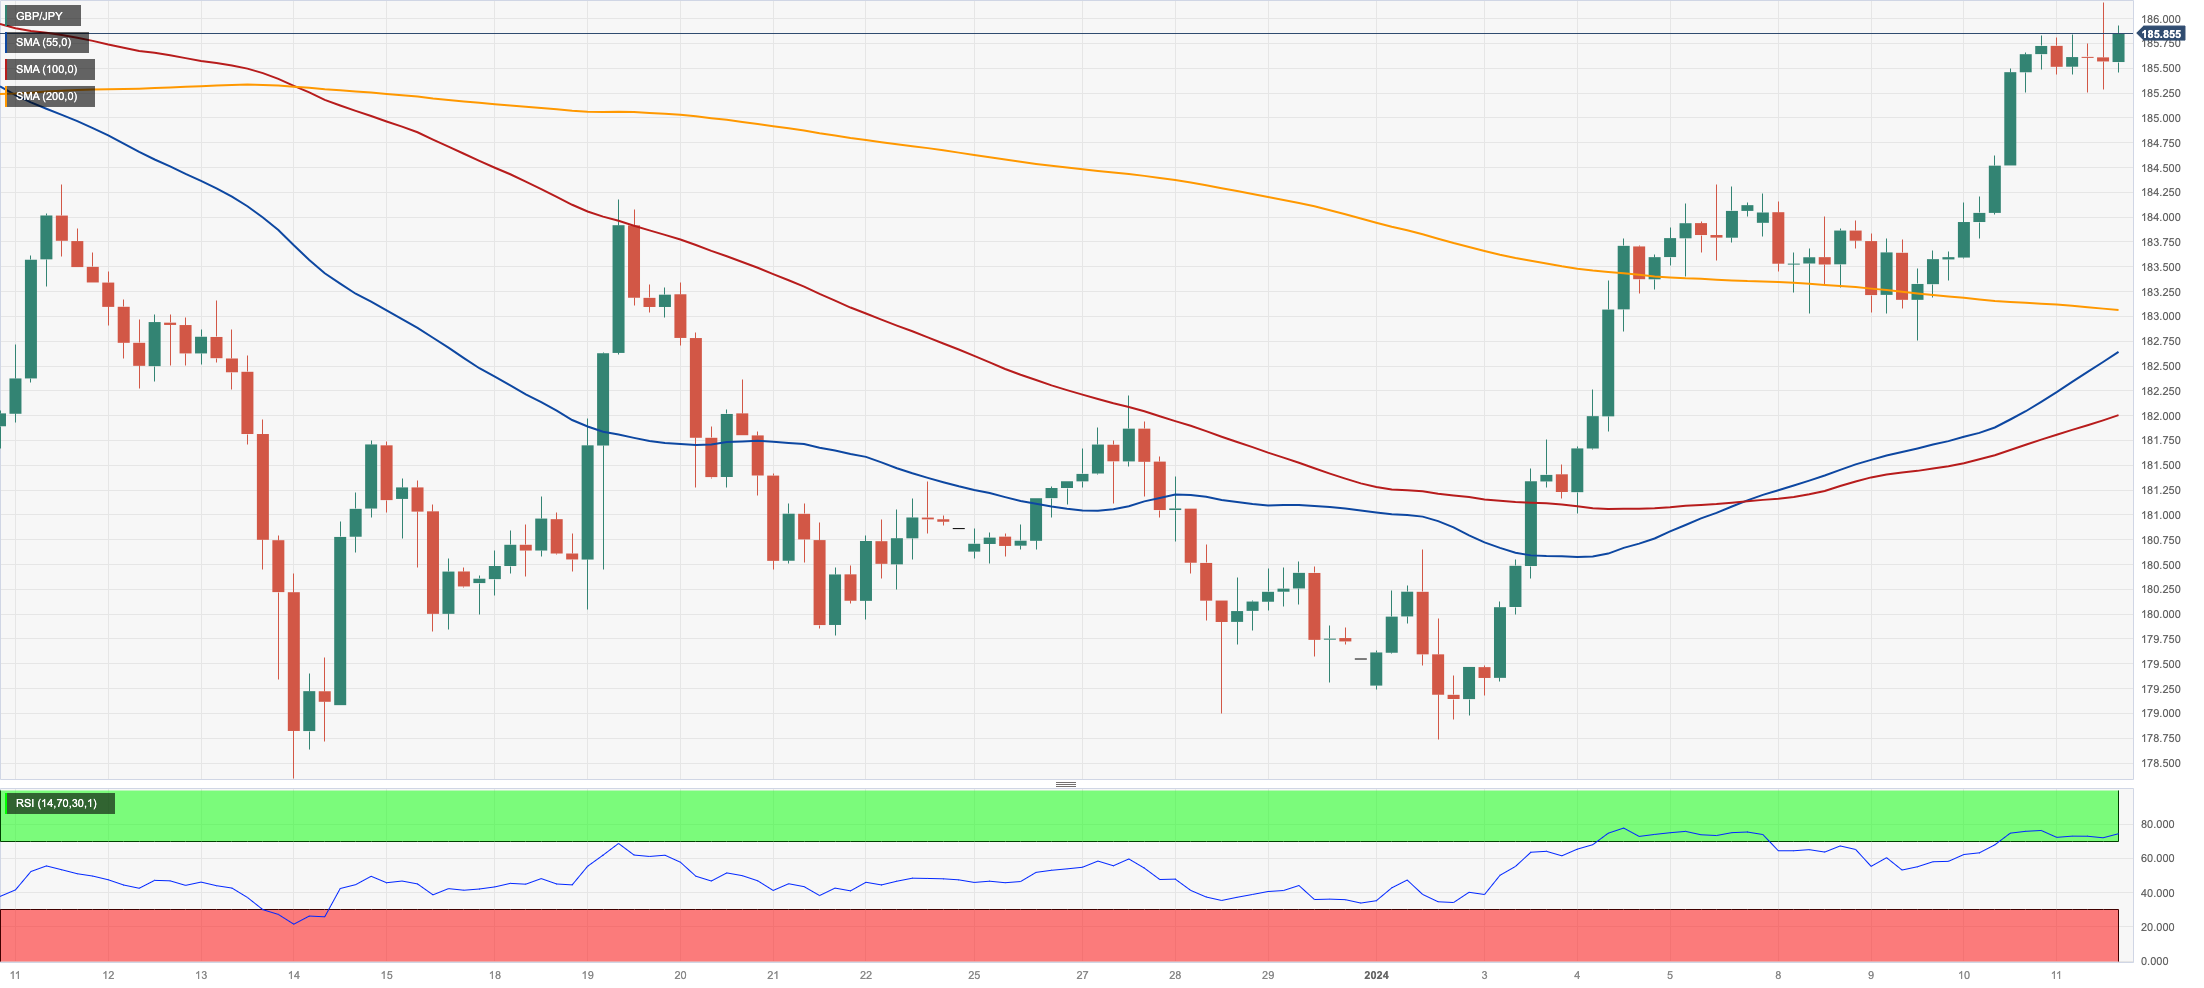
GBPJPY
After hitting a new five-month high just above the 186.00 hurdle, GBP/JPY corrected modestly lower and ended Thursday’s session slightly in the red territory.
In fact, the pullback in the cross came on the back of the renewed buying pressure in the greenback, which in turn kept the price action in the risk-linked galaxy depressed.
The change of heart around the dollar came pari passu investors’ repricing of interest rate cuts by the Federal Reserve, all after US inflation figures surprised to the upside in December.
The 2024 high of 186.16 (January 11) is the first target for GBP/JPY, followed by the 2023 top of 188.65 (November 24). The surpass of this level might reintroduce a challenge of the November 2015 peak of 188.80 (November 19) ahead of the August 2015 high of 195.28 (August 18). On the downside, if the cross breaks below the 200-day SMA at 179.89 it could then dispute the December 2023 bottom of 178.33 (December 14) prior to the October 2023 low of 178.03 (October 3) and the July 2023 low of 176.30). South from here, a deeper drop to the May 2023 low of 167.84 (May 11) is possible, ahead of the March 2023 low of 158.26 (March 24). The daily RSI eased to the proximity of 60.
Resistance levels: 186.16 187.56 188.66 (4H chart)
Support levels: 182.75 182.07 178.74 (4H chart)
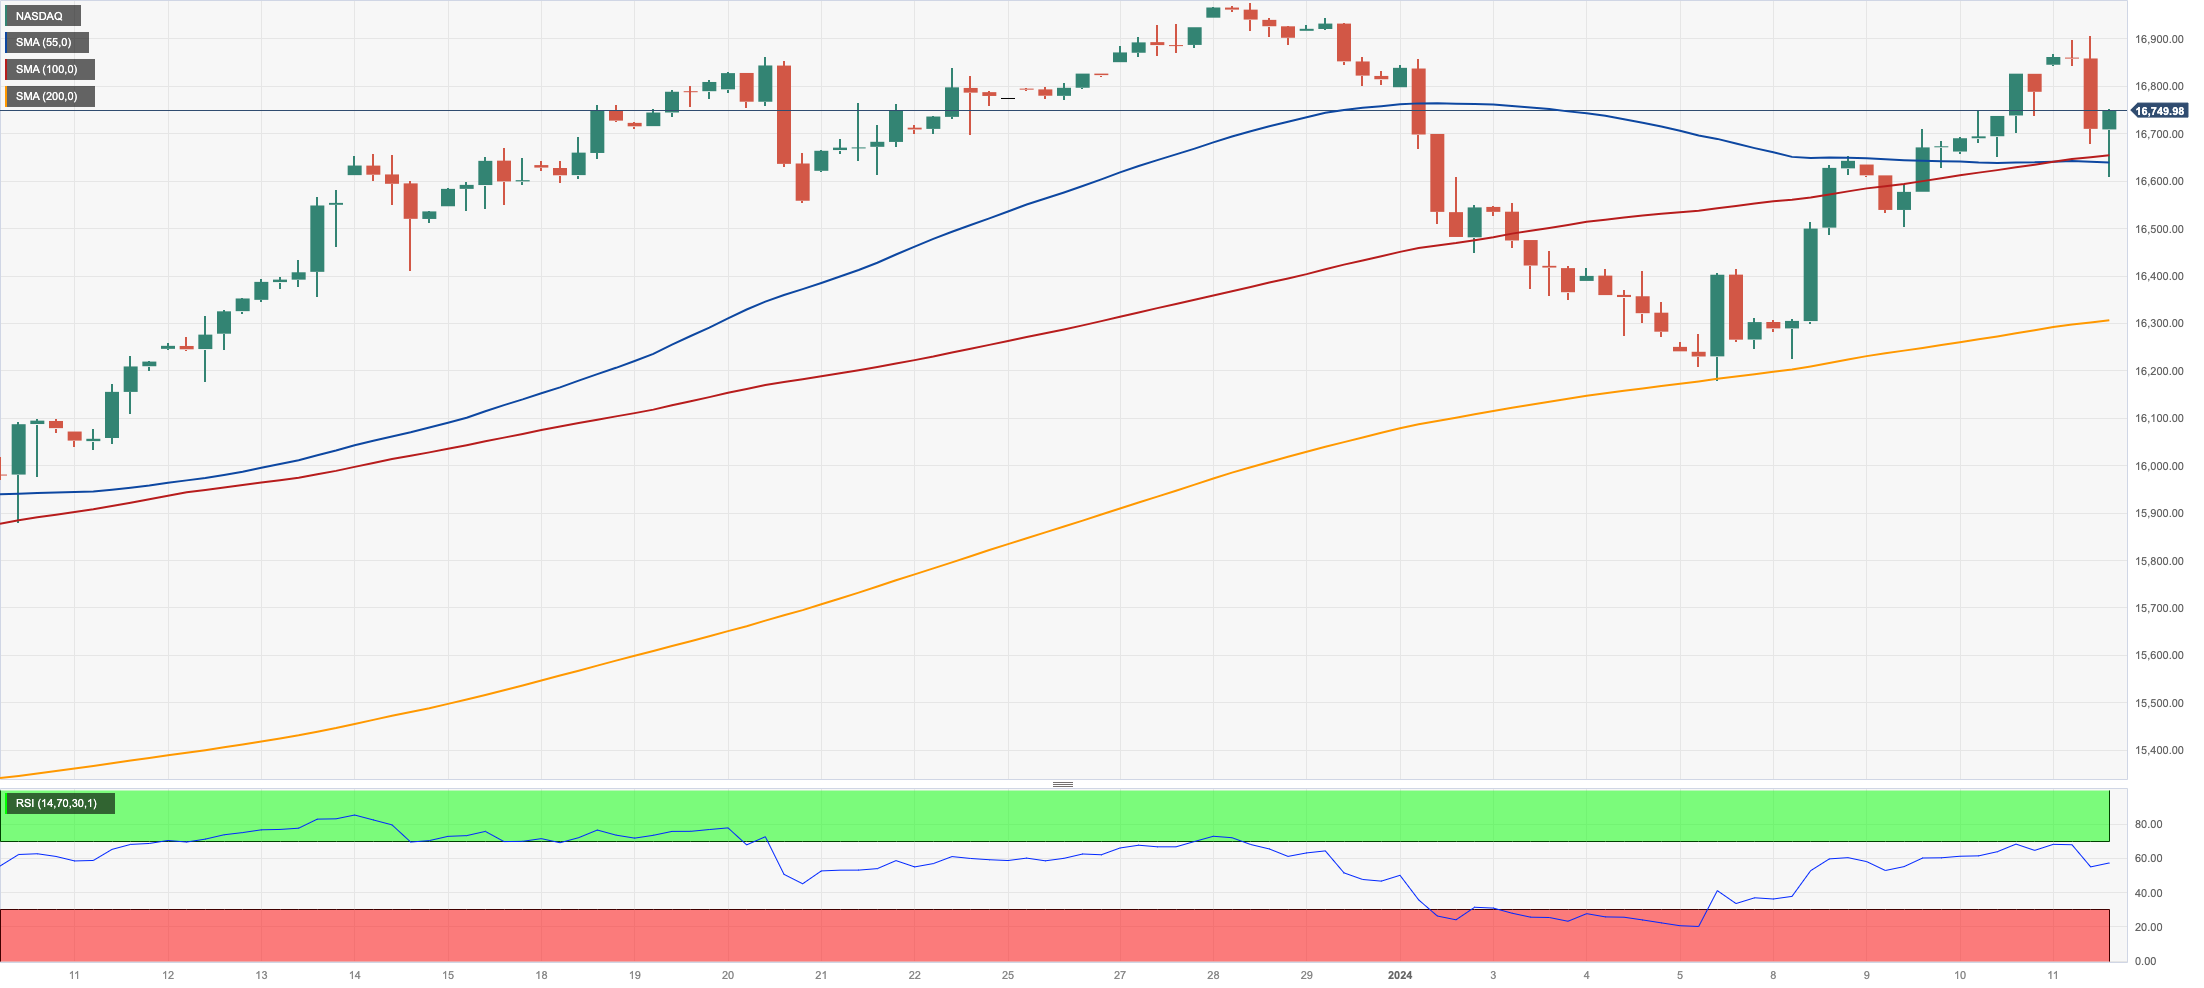
NASDAQ
The likelihood that the Fed might keep its restrictive stance for longer than anticipated was reinvigorated after US inflation figures unexpectedly rose more than estimated at the end of 2023.
Against that backdrop, the US tech sector gave away part of the recent four-day advance and forced the reference Nasdaq 100 to return to negative territory after hitting multi-session peaks near 16900 on Thursday.
On another front, Microsoft briefly surpassed i-Phone maker Apple in terms of market capitalization, making it the highest-valued publicly traded company globally during Thursday's trading session.
The Nasdaq 100's immediate upward target is the 2024 top of 16898 (January 11) prior to the all-time peak of 16969 (December 28 2023). The other way around, there is initial support at the January low of 16249 (January 5), which is followed by the December 2023 low of 15695 (December 4) and the important 200-day SMA of 14906. The loss of this region could pave the way for a move to the October 2023 low of 14058 (October 26) ahead of the April 2023 low of 12724 (April 25), the March 2023 low of 11695 (March 13) and the 2023 low of 10696 (January 3). The day-to-day RSI receded to the sub-60 region.
Top Gainers: Marvell, Netflix, Palo Alto Networks
Top Losers: Warner Bros Discovery, Biogen, Tesla
Resistance levels: 16898 16969 (4H chart)
Support levels: 16249 15695 15511 (4H chart)
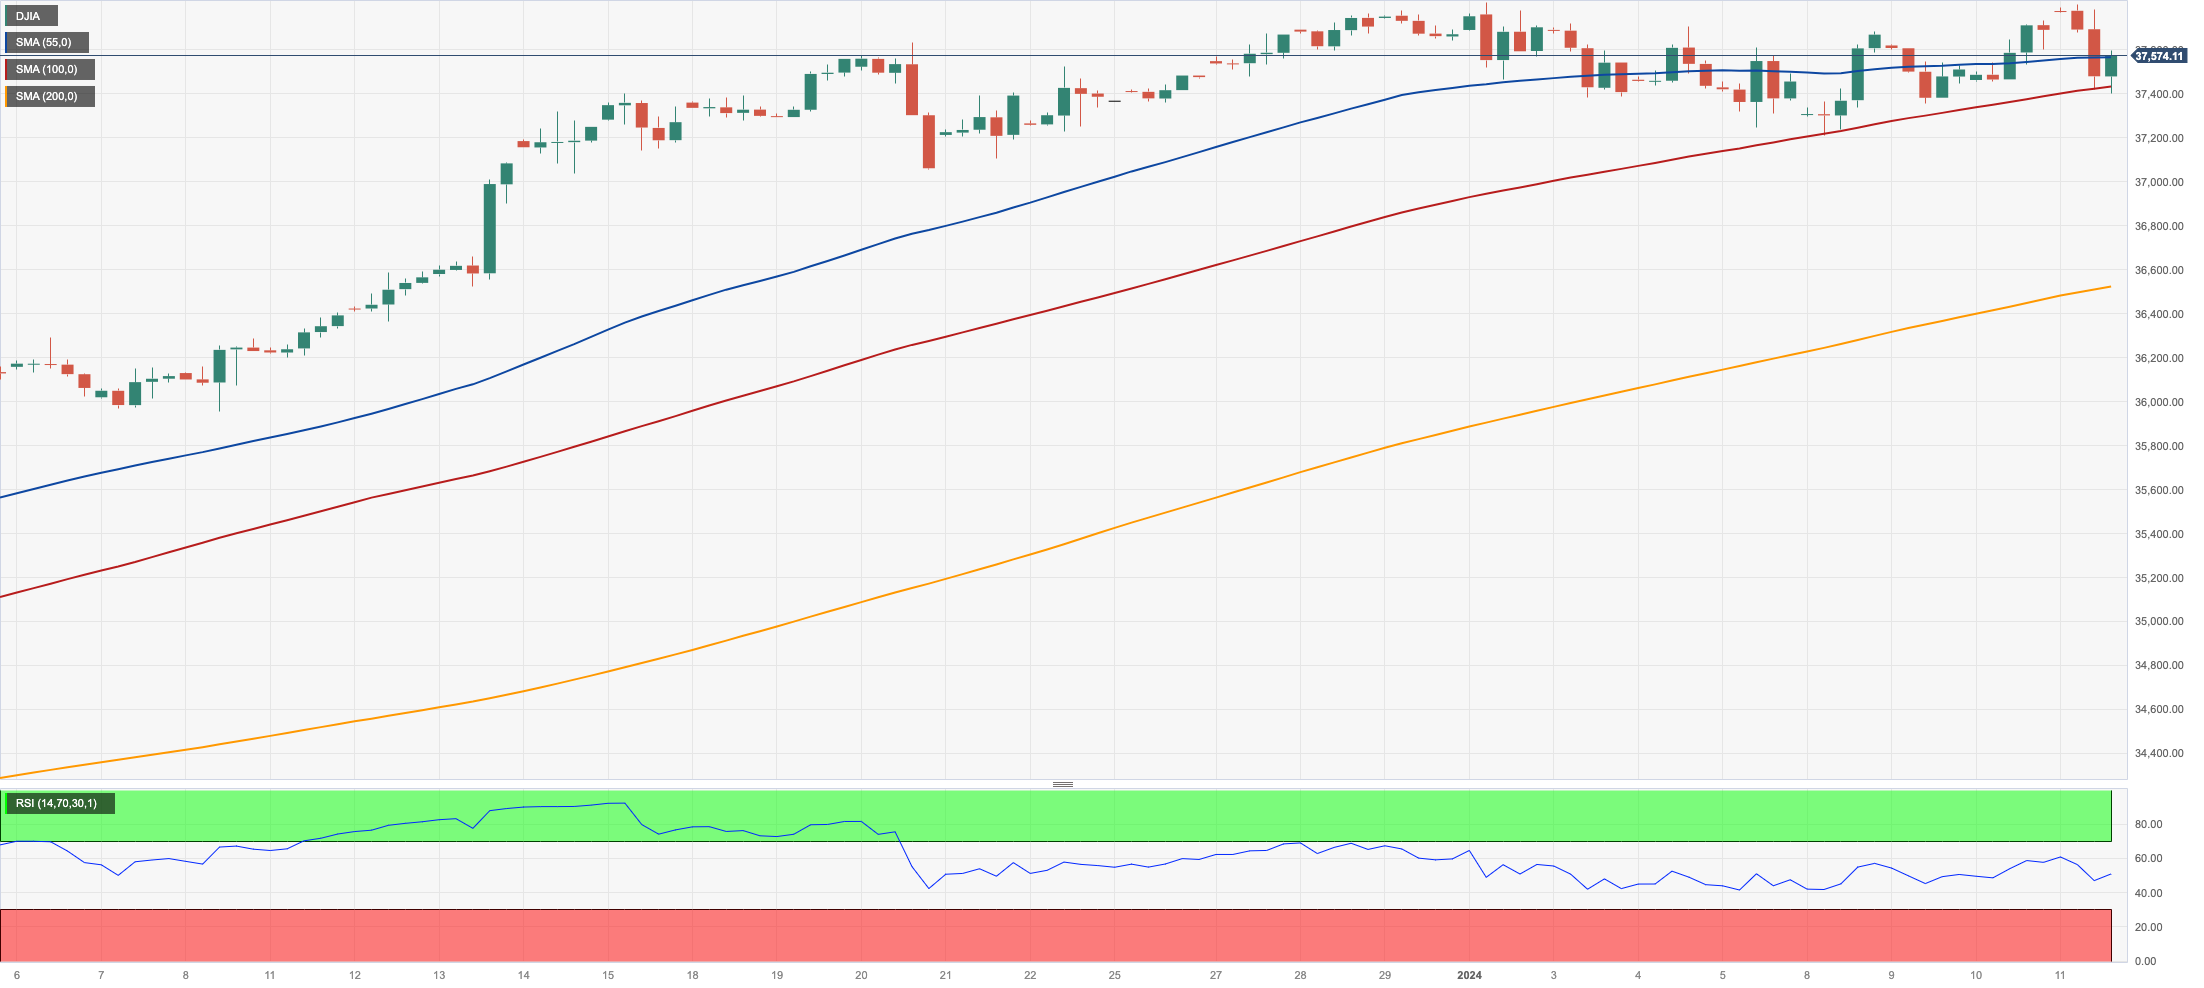
DOW JONES
US stocks tracked by the Dow Jones clinched a new all-time top just past the 37800 level on Thursday.
The move, however, fizzled out in tandem with the recovery in the greenback, all in response to investors’ repricing of interest rate cuts by the Fed in Q2 after higher-than-expected US inflation in December.
Also contributing to the sour sentiment emerged rising cautiousness ahead of the start of the earnings season on Friday.
All in all, the Dow Jones retreated 0.27% to 37595, the S&P500 dropped 0.35% to 4766, and the tech-heavy Nasdaq Composite deflated 0.34% to 14917.
If bulls keep pushing, the Dow will try to break over its all-time high of 37801 (January 11) sooner rather than later. Immediate support might be located at the so-far 2024 low of 37249 (January 8), which is ahead of the weekly low of 37073 (December 20 2023), and the December 2023 low of 36010 (December 5). Further losses expose the crucial 200-day SMA at 34513 before the weekly low of 33859 (November 7, 2023), the October 2023 low of 32327 (October 27) and the 2023 low of 31429 (March 15). The 2022 low of 28660 (October 13) may be threatened if this level is crossed. The daily RSI declined below 65.
Top Performers: Salesforce Inc, Nike, Chevron
Worst Performers: Walgreen Boots, Verizon, Boeing
Resistance levels: 37801 (4H chart)
Support levels: 37249 37073 36021 (4H chart)
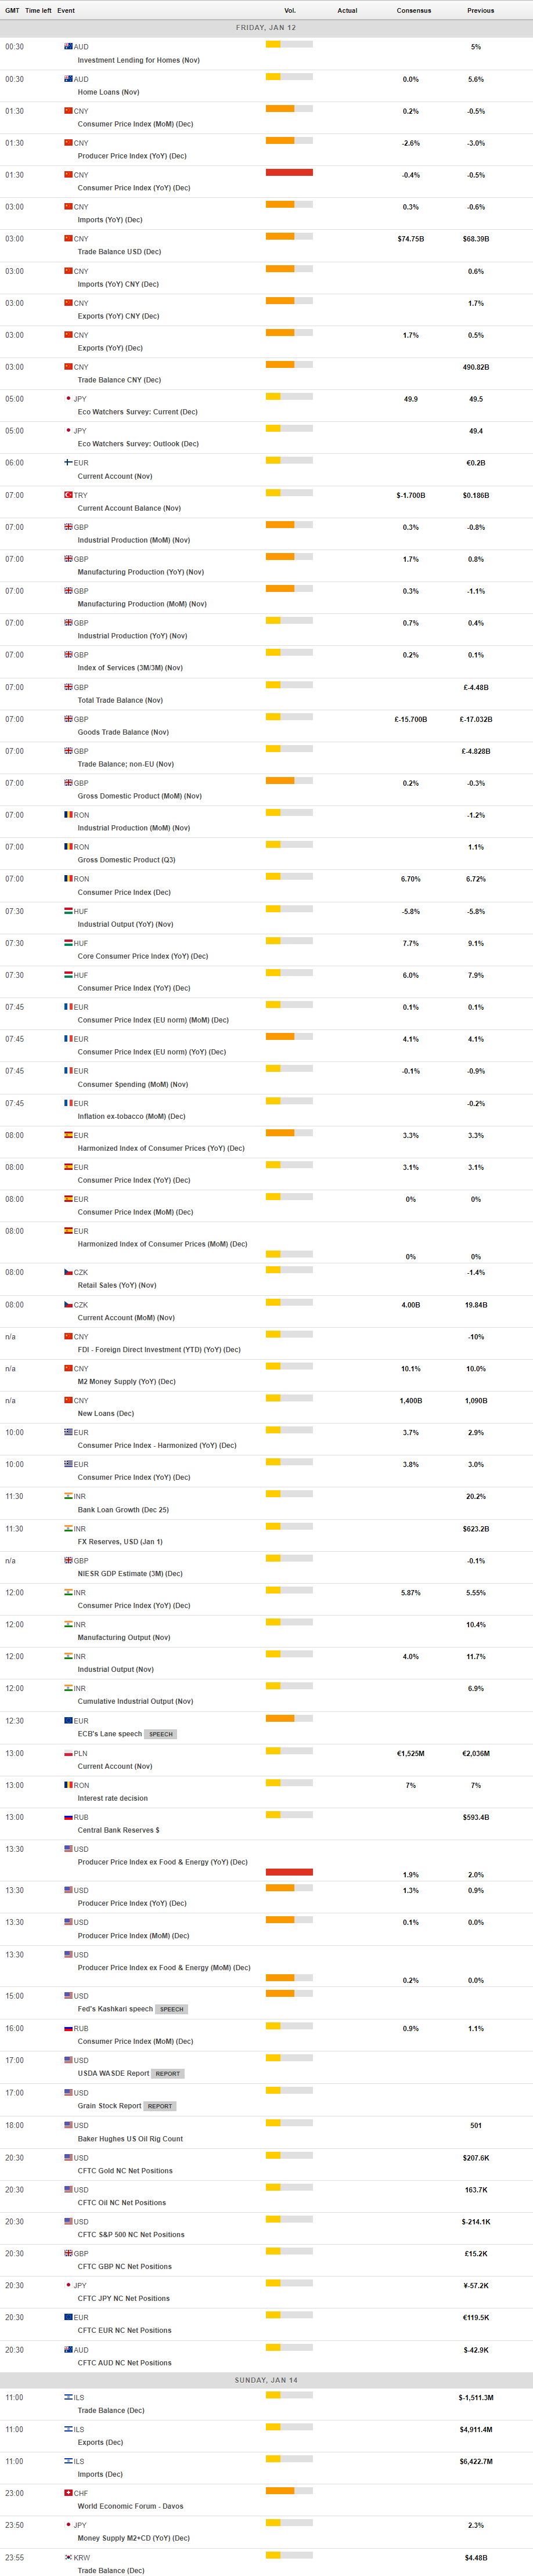
MACROECONOMIC EVENTS
All Information & Updates provided by:

All information relating to the financial markets available on this page has been prepared and issued by FXStreet (Forexstreet SL, Spain, Reg: B62498233) on the basis of publicly available information and all information believed to be reliable and does not conflict with Kuwaiti local laws, and all necessary care has been taken to before the company to ensure that the facts mentioned are correct from the source.
NCM Investment nor any of its directors or employees shall in any way be held responsible for the contents of this news, and the information contained on this page is intended only to provide clients with publicly available information and should not be construed as investment advice, report or analysis and/or constitute an offer or invitation to buy or sell financial instruments of any kind.
RISK WARNING: Forex and CFDs are highly risky leveraged products, as losses can exceed deposits. Please ensure you understand all the risks and take independent advice if necessary. NCM will segregate the clients based on the criteria of the regulator and its bylaws. NCM does not provide any advisory service; the material published does not constitute advice or a recommendation for a transaction in any financial instrument. NCM accepts no responsibility for any use of the content presented and any consequences of that use. Anyone acting on the information provided does so at their own risk.