
- Contact Us:
-

-

-

-


Daily Market Updates
16 Jan 2024
EURUSD
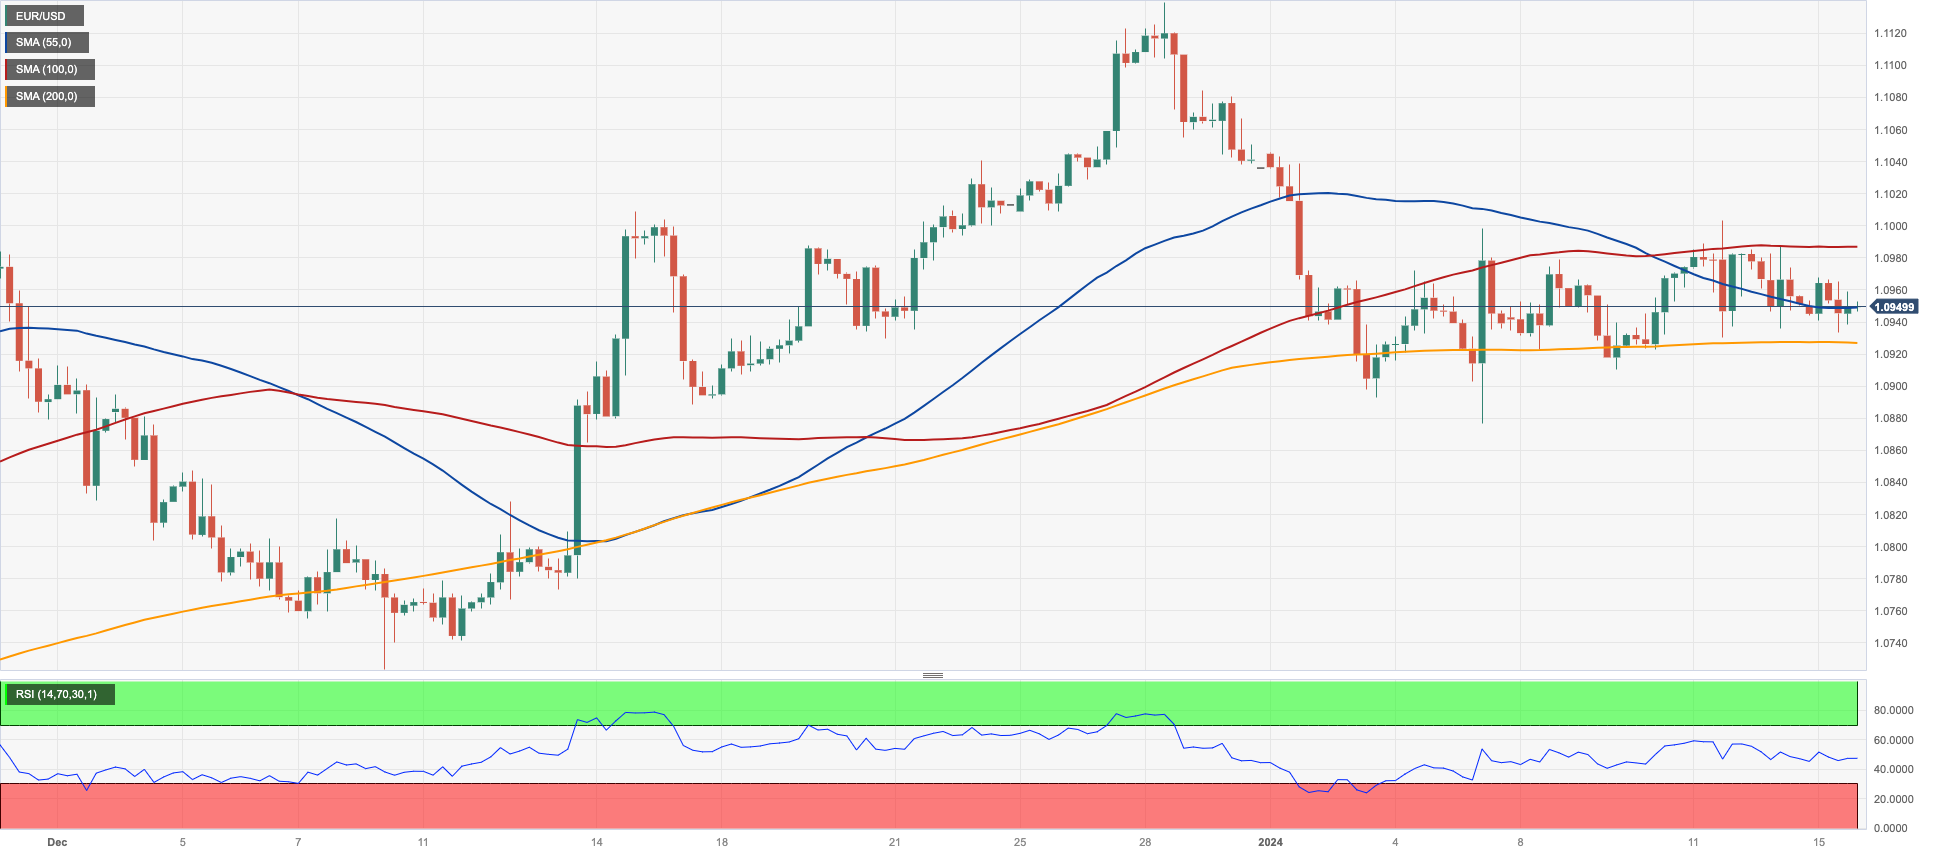
The continuation of the upside bias in the greenback maintained the risk complex under further pressure, prompting EUR/USD to start the week in a vacillating tone around 1.0950.
The USD Index (DXY), which tracks the greenback vs. a bundle of its main competitors, rose to two-day highs near the 102.70 zone in a context of scarce volatility and reduced trade conditions due to the Marin Luther King Jr. holiday in the US.
Furthermore, the US dollar kept the auspicious start of the new trading year, entering its third consecutive week in positive territory so far.
In the meantime, the European currency paid no attention to comments from ECB Board members Holzmann and Herodotou, who concurred in their views that any chatter on interest rate cuts appears at least premature. Holzmann even suggested that rate reductions could be off the table in 2024.
A very light day data-wise in the euro region, where Germany’s Full-Year GDP Growth showed a 0.3% contraction in 2023. In the broader euro area, the trade surplus widened to €20.3B in November, and Industrial Production contracted 6.8% from a year earlier.
The weekly top of 1.0998 (January 5, 11) precedes the December 2023 peak of 1.1139 (December 27), which is also supported by the 200-week SMA at 1.1151, both of which precede the 2023 high of 1.1275 (July 18). Instead, if the 2024 low of 1.0892 (January 3) is breached, EUR/USD could revisit the key 200-day SMA of 1.0847 seconded by the transitory 100-day SMA of 1.0768 and the December 2023 bottom of 1.0723 (December 8). Further down comes the weekly low of 1.0495 (October 13, 2023), ahead of the 2023 low of 1.0448 (October 3) and the round level of 1.0400. The RSI looks stable around 51 on a daily basis.
Resistance levels: 1.0998 1.1009 1.1139 (4H chart)
Support levels: 1.0927 1.0876 1.0723 (4H chart)
USDJPY
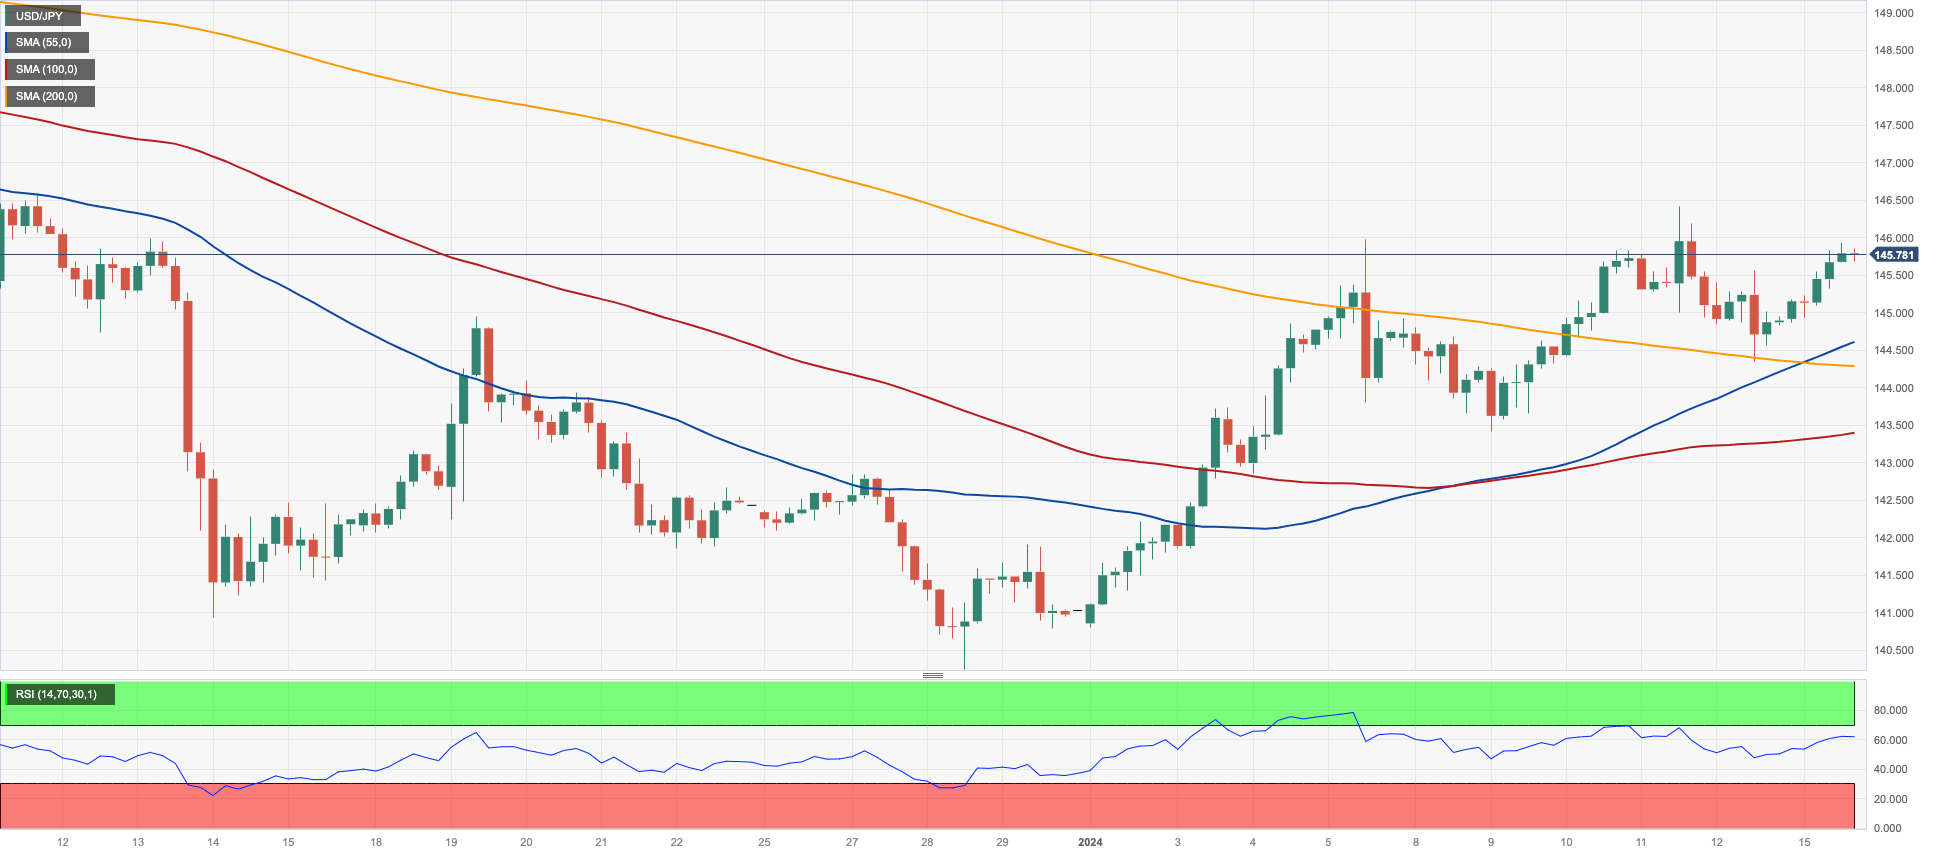
USD/JPY set aside two consecutive daily pullbacks and rose markedly at the beginning of the week, briefly approaching the key 146.00 barrier.
Further recovery in the buck in combination with the slight downtick in JGB 10-year yields appear to have been sufficient to spark a positive kick-off the week in the pair.
The Japanese docket was empty on Monday, although the release of Producer Prices should grab all the attention on Tuesday.
Immediately to the upside for USD/JPY aligns the 2024 high of 146.41 (January 11), which appears reinforced by the transitory 55-day SMA of 146.55. The key level of 150.00 appears to the north of here, ahead of the 2023 top of 151.90 (November 13), the 2022 peak of 151.94 (October 21), and the round number of 152.00. Having said that, if the pair goes below the 200-day SMA of 143.63, it may hit the December 2023 low of 140.24 (December 28) before reaching the round milestone of 140.00. The July 2023 low of 137.23 (July 14) emerges south of here, followed by the March 2023 low of 129.63 (March 24). The daily RSI leapt near the 57 level.
Resistance levels: 146.41 146.58 147.49 (4H chart)
Support levels: 144.34 143.42 140.24 (4H chart)
GBPUSD
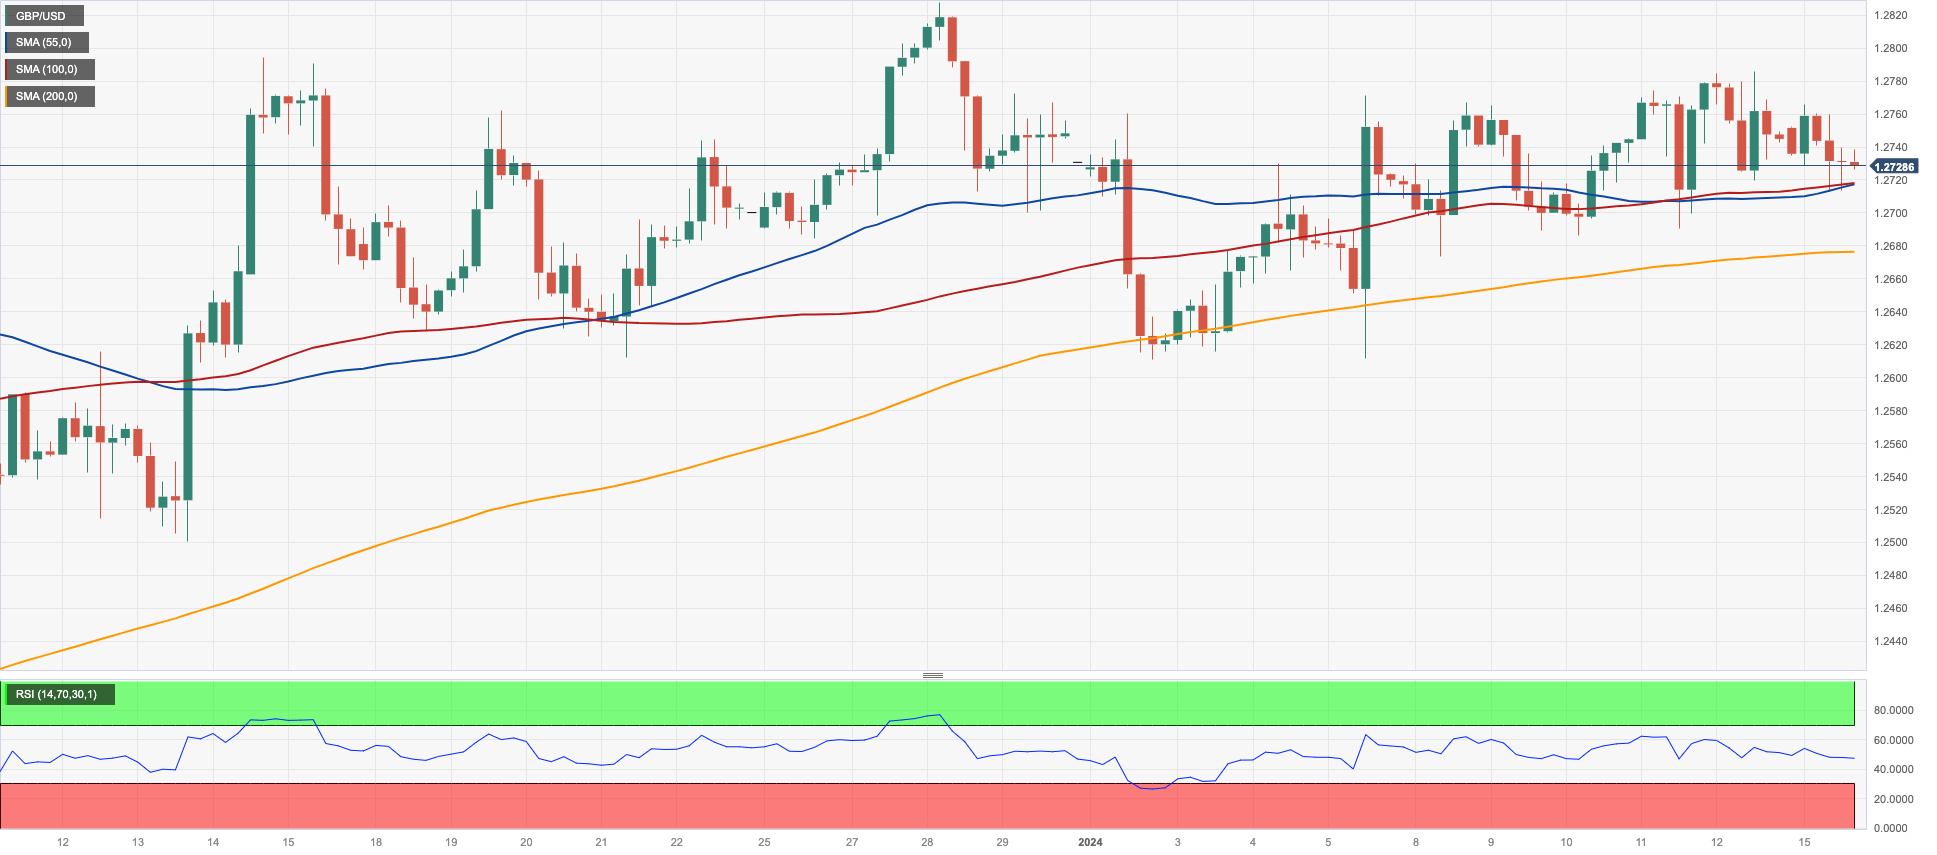
GBP/USD added to Friday’s corrective decline and approached the key 1.2700 neighbourhood on Monday.
The second drop in a row in Cable came on the back of the persistent rebound in the greenback across the board despite the inactivity in the US markets due to the Martin Luther King Jr. holiday.
In the UK money market, 10-year gilt yields hovered around 3.80% amidst a marginal trading range.
There were no data releases scheduled across the Channel on Monday.
If GBP/USD reverses the ongoing leg lower, it may revisit the December 2023 top of 1.2827 (December 28), prior to the weekly peak of 1.2995 (July 27 2023), which is just over the key 1.3000 threshold. On the other hand, a break below the so-far 2024 low of 1.2610 (January 2), might send the pair probing the 200-day SMA at 1.2542 before the December 2023 bottom of 1.2500 (December 13). Extra weakness may push Cable to begin a move to the weekly low of 1.2187 (November 10, 2023), which comes before the October 2023 low of 1.2037 (October 3), the crucial 1.2000 level, and the 2023 bottom of 1.1802 (November 10, 2023). The everyday RSI eased to the 55 neighbourhood.
Resistance levels: 1.2785 1.2827 1.2995 (4H chart)
Support levels: 1.2672 1.2610 1.2500 (4H chart)
GOLD
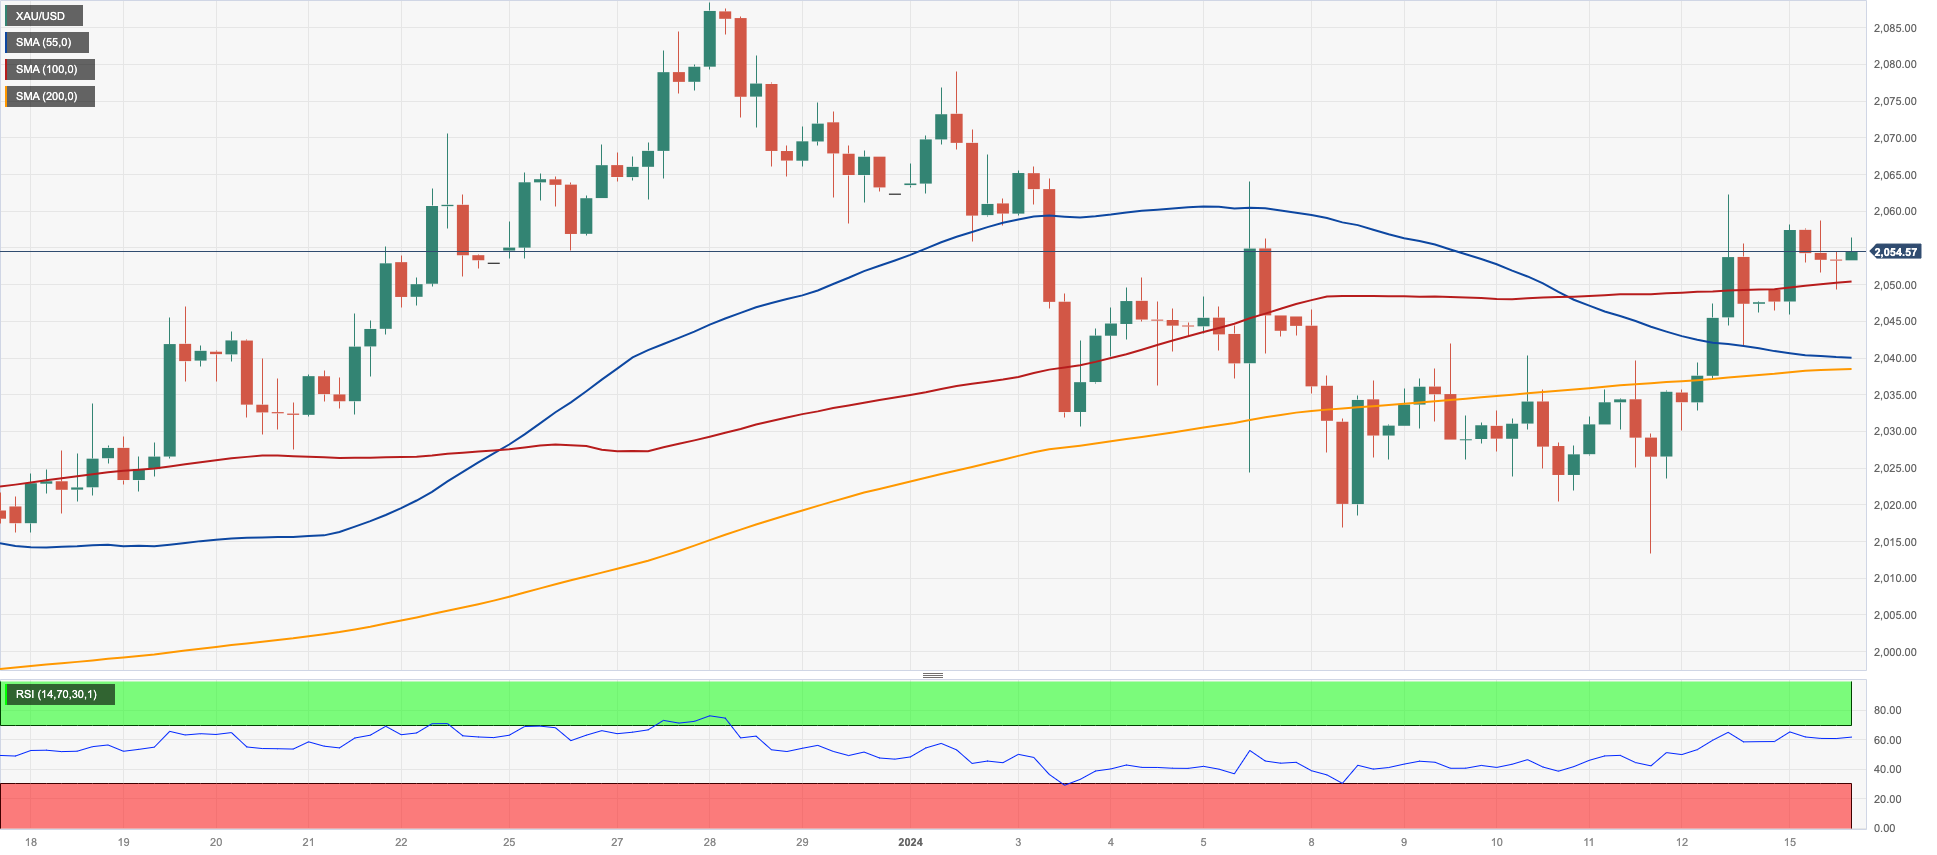
Gold prices advanced further and flirted with the $2060 region per troy ounce on Monday.
Indeed, bullion rose for the third consecutive session on the back of increasing concerns around the Israel-Hamas conflict as well as the Red Sea crisis, all bolstering flows into the safe haven universe.
Further buying around the precious metal came on the back of persistent speculation of interest rate cuts by the Federal Reserve at some point in Q2. Currently, the probability of rate cuts in March stands at around 70%, according to CME Group’s FedWatch Tool.
The continuation of the rebound should prompt gold to challenge the weekly top of $2088 (December 28), before the all-time peak of $2150 (4 December 2023). The other way around, there is immediate support at the 2024 low of $2013 (January 11), an area also underpinned by the transitory 55-day SMA. The breakdown of this region may inspire bears to push gold prices to the critical conflict zone around $2000 before the December 2023 bottom of $1973 (December 13), which is ahead of the 200-day SMA of $1963 and the November 2023 low of $1931 (November 13). Extra losses might cause the October 2023 bottom of $1810 (October 6) to be revisited before the 2023 low of $1804 (February 28) and, eventually, the key $1800 support zone.
Resistance levels: $2062 $2078 $2088 (4H chart)
Support levels: $2013 $1973 $1965 (4H chart)
CRUDE WTI
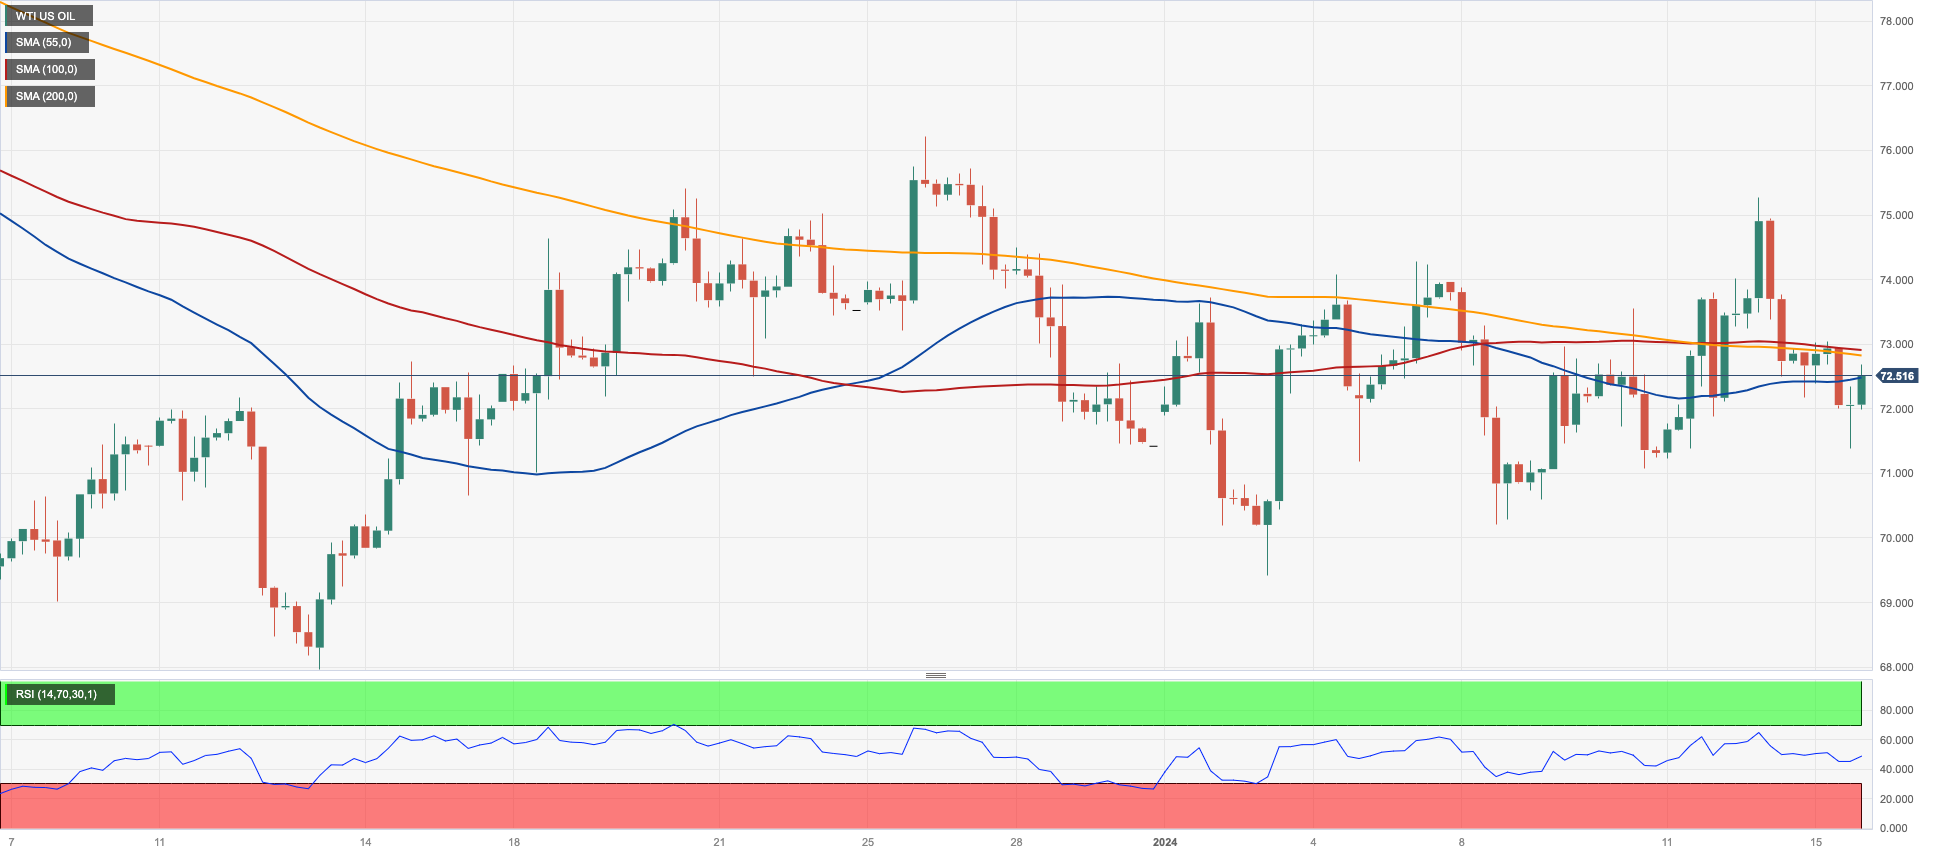
Prices of the West Texas Intermediate (WTI) kicked off the new trading week in an inconclusive session following Friday’s volatile session and small losses.
In fact, crude oil prices remained unable to gather fresh upside traction despite persistent geopolitical jitters in the Red Sea, while shipping companies continued to avoid routes through that conflicting region after recent US and UK attacks on Houthi targets in Yemen.
Somewhat limiting the downside in crude oil prices emerged further protests in Libya, which threatened to close extra oil facilities while the major Sharara oilfield remains shut.
The next goal for WTI is the weekly high of $76.14 (December 26 2023), followed by the crucial 200-day SMA at $77.76, the critical $80.00 barrier, and the November 2023 top of $80.15 (November 3). Further gains from here may lead the market back to its weekly peak of $89.83 (October 18 2023), ahead of the 2023 high of $94.99 (September 28 2023) and the August 2022 top of $97.65 (August 30), all before the psychological $100.00 level. The other way around, a breakdown of the 2024 low of $69.31 (January 3) would open the door to a further slide to the December 2023 low of $67.74 (December 13), prior to the June 2023 low of $66.85 (June 12) and the 2023 bottom of $63.61.
Resistance levels: $75.21 $76.14 $79.56 (4H chart)
Support levels: $70.10 $69.25 $67.68 (4H chart)
GER40
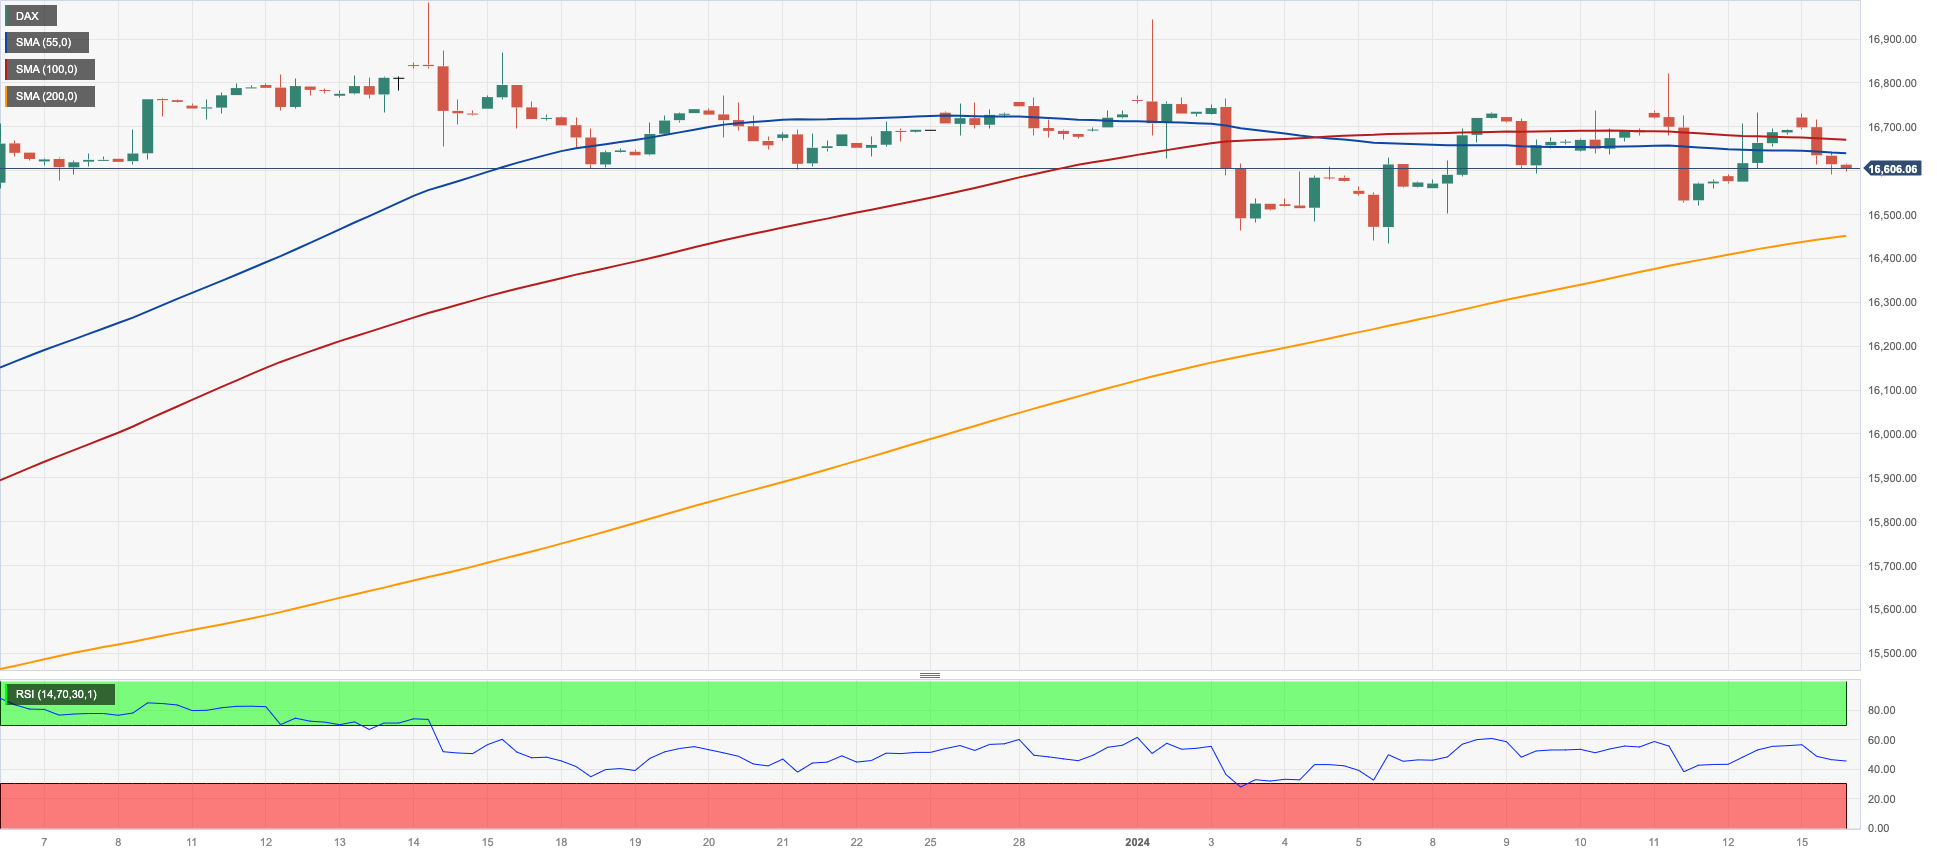
A negative start to a new trading week saw the German reference DAX40 reverse Friday’s uptick and refocus on the downside, briefly revisiting the 16600 zone on Monday.
The broad-based decline in European equities came on the back of comments from ECB Board members Holzmann, Nagel, and Herodotou, who deemed current market chatter around potential rate cuts by the central bank premature.
So far, the probability of a rate cut in March hovers around 20%, while investors see 150 bps rate cuts this year.
The downtick in the benchmark index came in contrast to a bounce to 2.20% in the 10-year bund yields.
The return of the bullish scenario might propel the DAX40 to an annual high of 16963 (January 2) before hitting an all-time top of 17003 (December 14). On the opposite side, there is immediate contention at the so-far 2024 low of 16448 (January 5), which precedes the weekly low of 15915 (November 28) and the critical 200-day SMA of 15878. Further down comes the October 2023 low of 14630 (October 23), which precedes the March 2023 low of 14458 (March 20). The daily RSI eased below 54.
Best Performers: Continental AG, Munich Re Group, Commerzbank
Worst Performers: Fresenius SE, Beiersdorf AG, Zalando SE
Resistance levels: 16839 16963 17003 (4H chart)
Support levels: 16541 16448 15915 (4H chart)
GBPJPY
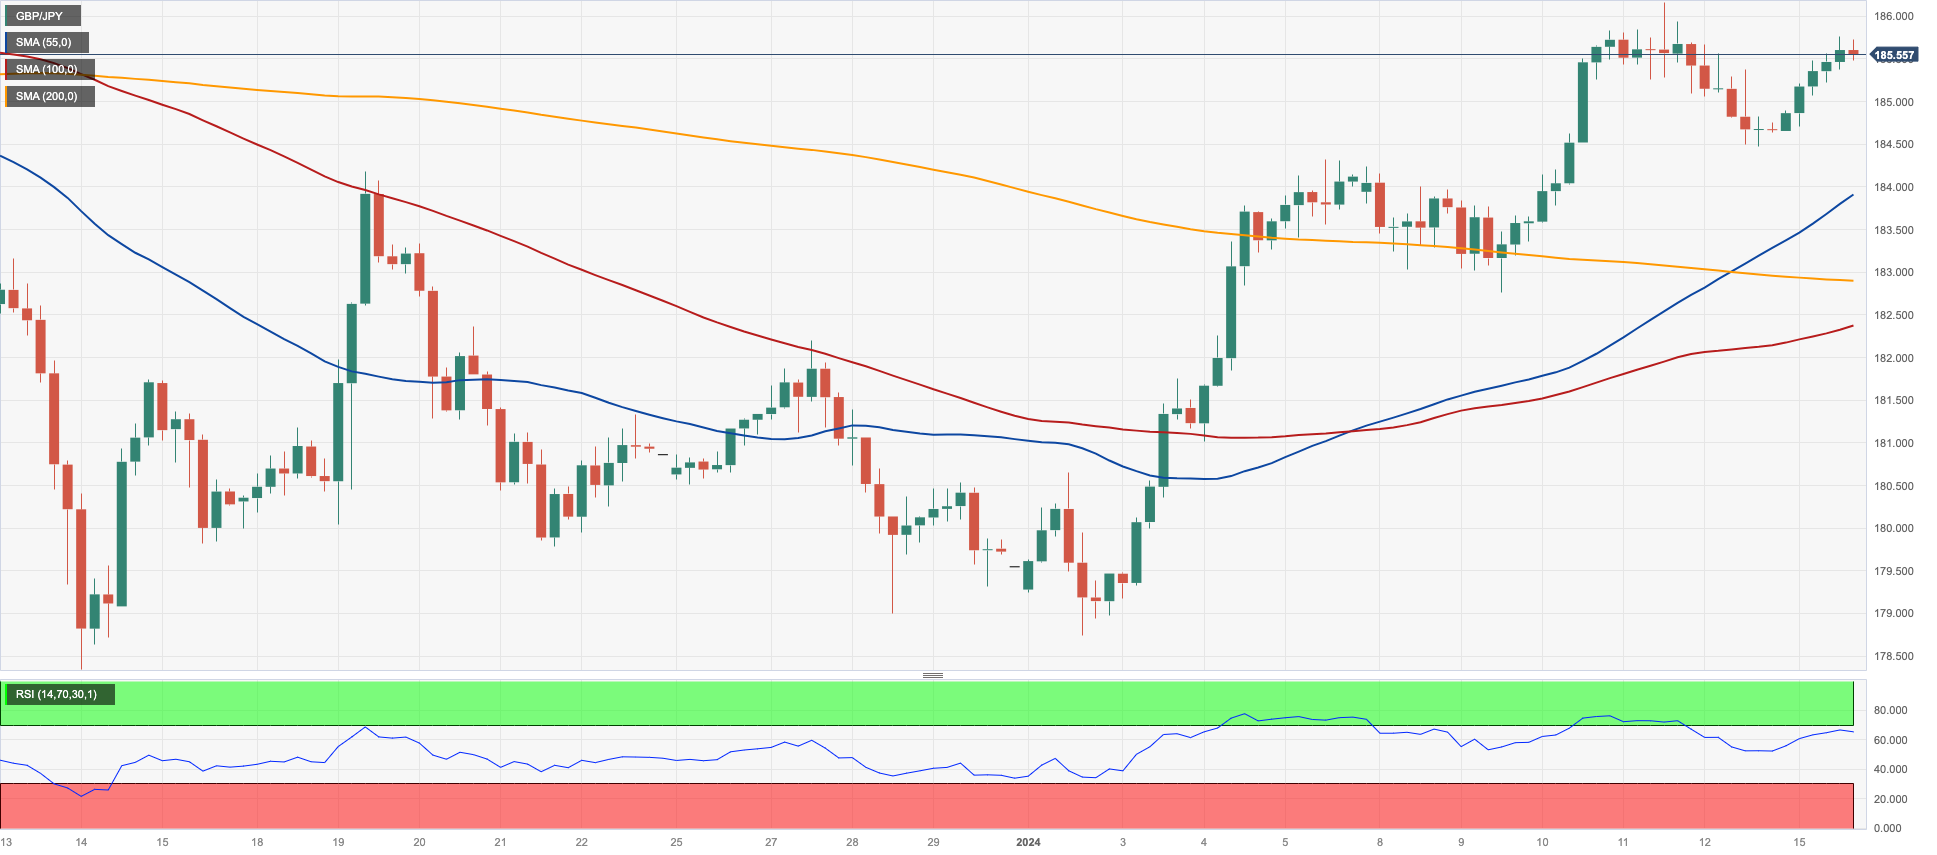
The resurgence of selling pressure in the Japanese currency sponsored the daily recovery in GBP/JPY, which managed to leave behind a two-day negative streak at the beginning of the week.
In fact, the cross regained some balance and advanced to the vicinity of the 186.00 barrier, although a move beyond this region appeared elusive so far.
Following Monday’s price action, the cross entered its third consecutive week of gains, extending the auspicious start of the year and re-shifting its focus to the 2023 peaks near 188.70 recorded in late November.
The initial target for GBP/JPY is the 2024 high of 186.16 (January 11), followed by the 2023 top of 188.65 (November 24). A breakout of this level might rekindle a challenge to the November 2015 peak of 188.80 (November 19), which comes ahead of the August 2015 high of 195.28 (August 18). On the contrary, if the cross goes below the 200-day SMA at 180.09, it may test the December 2023 low of 178.33 (December 14), prior to the October 2023 low of 178.03 (October 3) and the July 2023 low of 176.30. A deeper drop to the May 2023 low of 167.84 (May 11), ahead of the March 2023 low of 158.26 (March 24), is expected from here. The daily RSI improved past 59.
Resistance levels: 186.16 187.56 188.66 (4H chart)
Support levels: 184.47 182.75 178.74 (4H chart)
NASDAQ
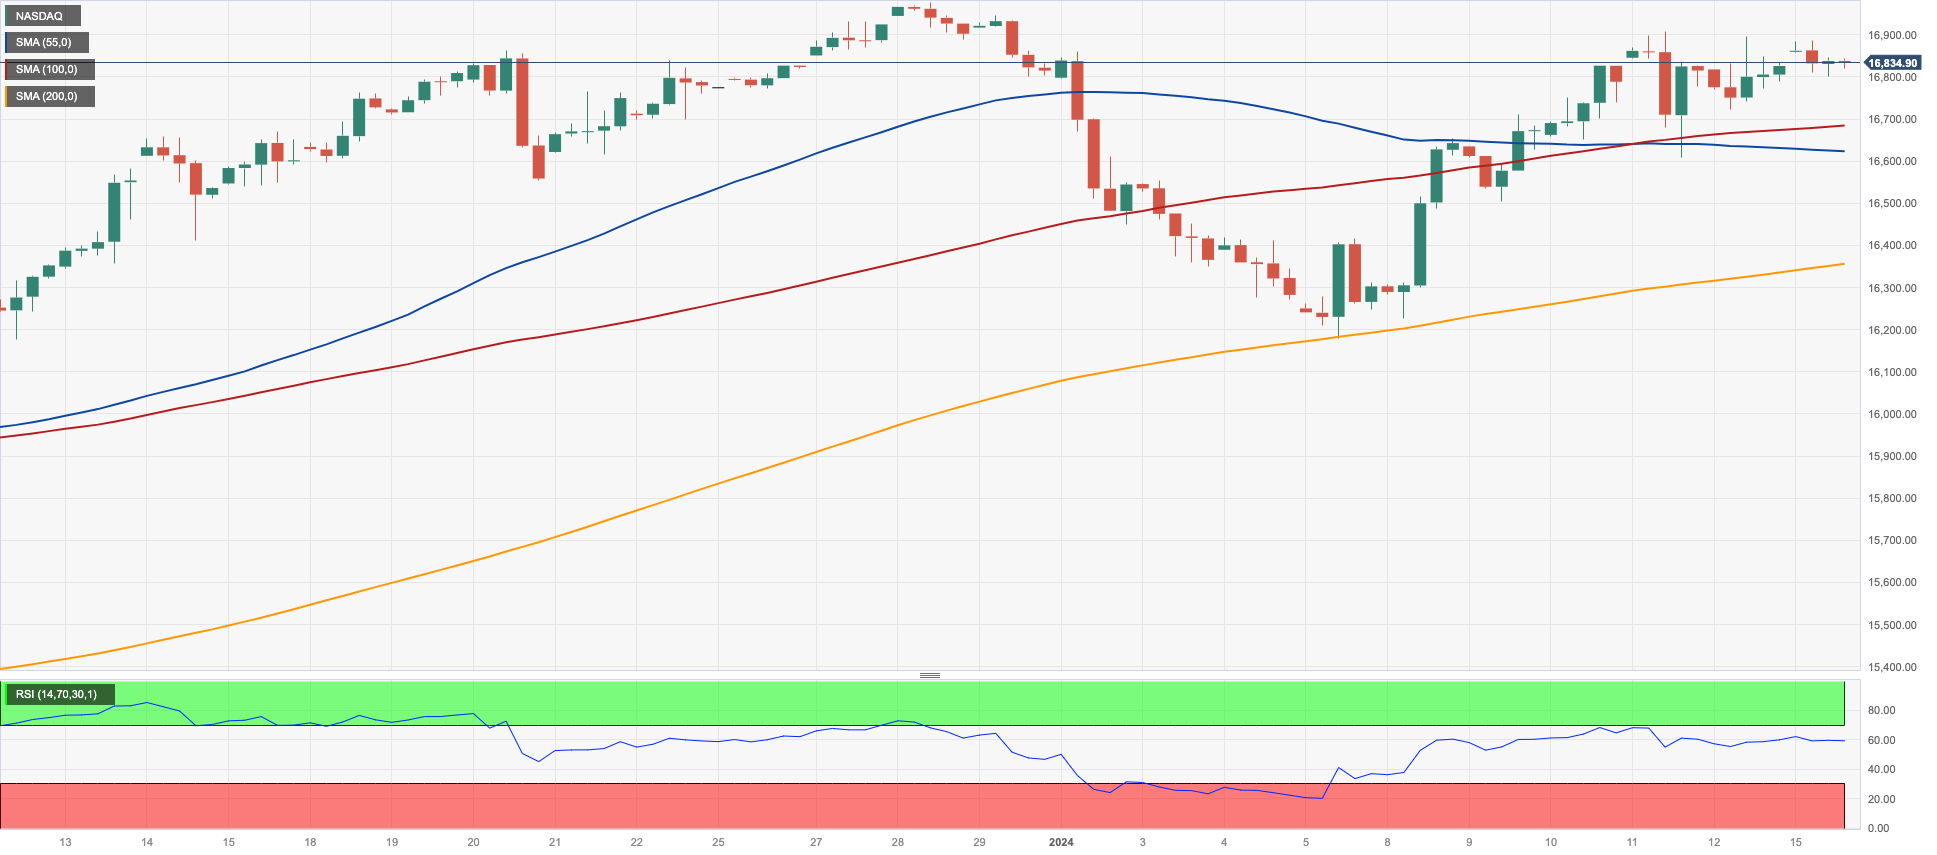
The Nasdaq 100, a prominent tech reference, demonstrated resilience by maintaining its daily gains and extending its bullish trend for the sixth consecutive session on Friday. As a result, the index regained its positive momentum for the week, rebounding from a slow start to the new year.
The modest increase in the tech sector can be attributed to ongoing speculation about potential interest rate cuts by the Federal Reserve. This sentiment was further reinforced by the unexpected decline in US Producer Prices during the month of December.
Additionally, the lack of clear direction in the dollar, mixed US yields, and the strong performance of Meta Platforms, the parent company of Google, all contributed to the upward movement of the Nasdaq 100 at the end of last week.
The Nasdaq 100's immediate upward target is the 2024 high of 16900 (January 12), which comes before the all-time top of 16969 (December 28 2023). In contrast, the January low of 16249 (January 5) serves as the initial level of support, followed by the December 2023 low of 15695 (December 4) and the critical 200-day SMA of 14927. The loss of this region might pave the way for a move to the October 2023 low of 14058 (October 26), which coincides with the April 2023 low of 12724 (April 25), the March 2023 low of 11695 (March 13), and the 2023 low of 10696 (January 3). The RSI for the day settled near 63.
Top Gainers: MercadoLibre, Cognizant A, Coca-Cola European
Top Losers: Tesla, IDEXX Labs, DexCom
Resistance levels: 16900 16969 (4H chart)
Support levels: 16249 15695 15532 (4H chart)
DOW JONES
US markets remained closed due to the Martin Luther King Jr. holiday on Monday.
A glimpse at the developments in the final session of last week saw the US stockyard benchmark Dow Jones clock a new record high near the 37820 zone. Despite the broader weekly consolidation in sentiment, the indicator managed to invert losses observed at the start of the year and end the week in a constructive tone.
Nonetheless, that initial advance encountered pressures as the propensity to sell reemerged, notably subsequent to reports distributed by US lenders JPMorgan Chase, Bank of America, and Wells Fargo failing to uplift spirits among traders on the initiation of the Q4 earnings season.
So far, the unanticipated downtrend in monthly US Producer Price appears to have bolstered perceptions that disinflationary pressures retain their entrenchment, which in turn props up conjectures of reductions to interest rates by the Fed at some point in the spring.
On the final session of business, the Dow Jones deflated 0.31% to 37592, the S&P500 gained 0.08% to 4783, and the tech-centric Nasdaq Composite dropped 0.04% to 14963.
If bulls manage to break above the so-far monthly consolidation, the Dow will try to break over its all-time top of 37825 (January 12) sooner rather than later. Instead, immediate support may be located at the 2024 low of 37249 (January 8), prior to the weekly low of 37073 (December 20, 2023) and the December 2023 low of 36010 (December 5). Further losses put the 200-day SMA of 34539 into play before the weekly low of 33859 (November 7, 2023), the October 2023 low of 32327 (October 27), and the 2023 low of 31429 (March 15). The daily RSI retreated to around 64.
Top Performers: Verizon, IBM, Chevron
Worst Performers: UnitedHealth, Boeing, Walgreen Boots
Resistance levels: 37825 (4H chart)
Support levels: 37249 37073 36021 (4H chart)
MACROECONOMIC EVENTS
All Information & Updates provided by:

All information relating to the financial markets available on this page has been prepared and issued by FXStreet (Forexstreet SL, Spain, Reg: B62498233) on the basis of publicly available information and all information believed to be reliable and does not conflict with Kuwaiti local laws, and all necessary care has been taken to before the company to ensure that the facts mentioned are correct from the source.
NCM Investment nor any of its directors or employees shall in any way be held responsible for the contents of this news, and the information contained on this page is intended only to provide clients with publicly available information and should not be construed as investment advice, report or analysis and/or constitute an offer or invitation to buy or sell financial instruments of any kind.
RISK WARNING: Forex and CFDs are highly risky leveraged products, as losses can exceed deposits. Please ensure you understand all the risks and take independent advice if necessary. NCM will segregate the clients based on the criteria of the regulator and its bylaws. NCM does not provide any advisory service; the material published does not constitute advice or a recommendation for a transaction in any financial instrument. NCM accepts no responsibility for any use of the content presented and any consequences of that use. Anyone acting on the information provided does so at their own risk.