
- Contact Us:
-

-

-

-


Daily Market Updates
17 Jan 2024
EURUSD
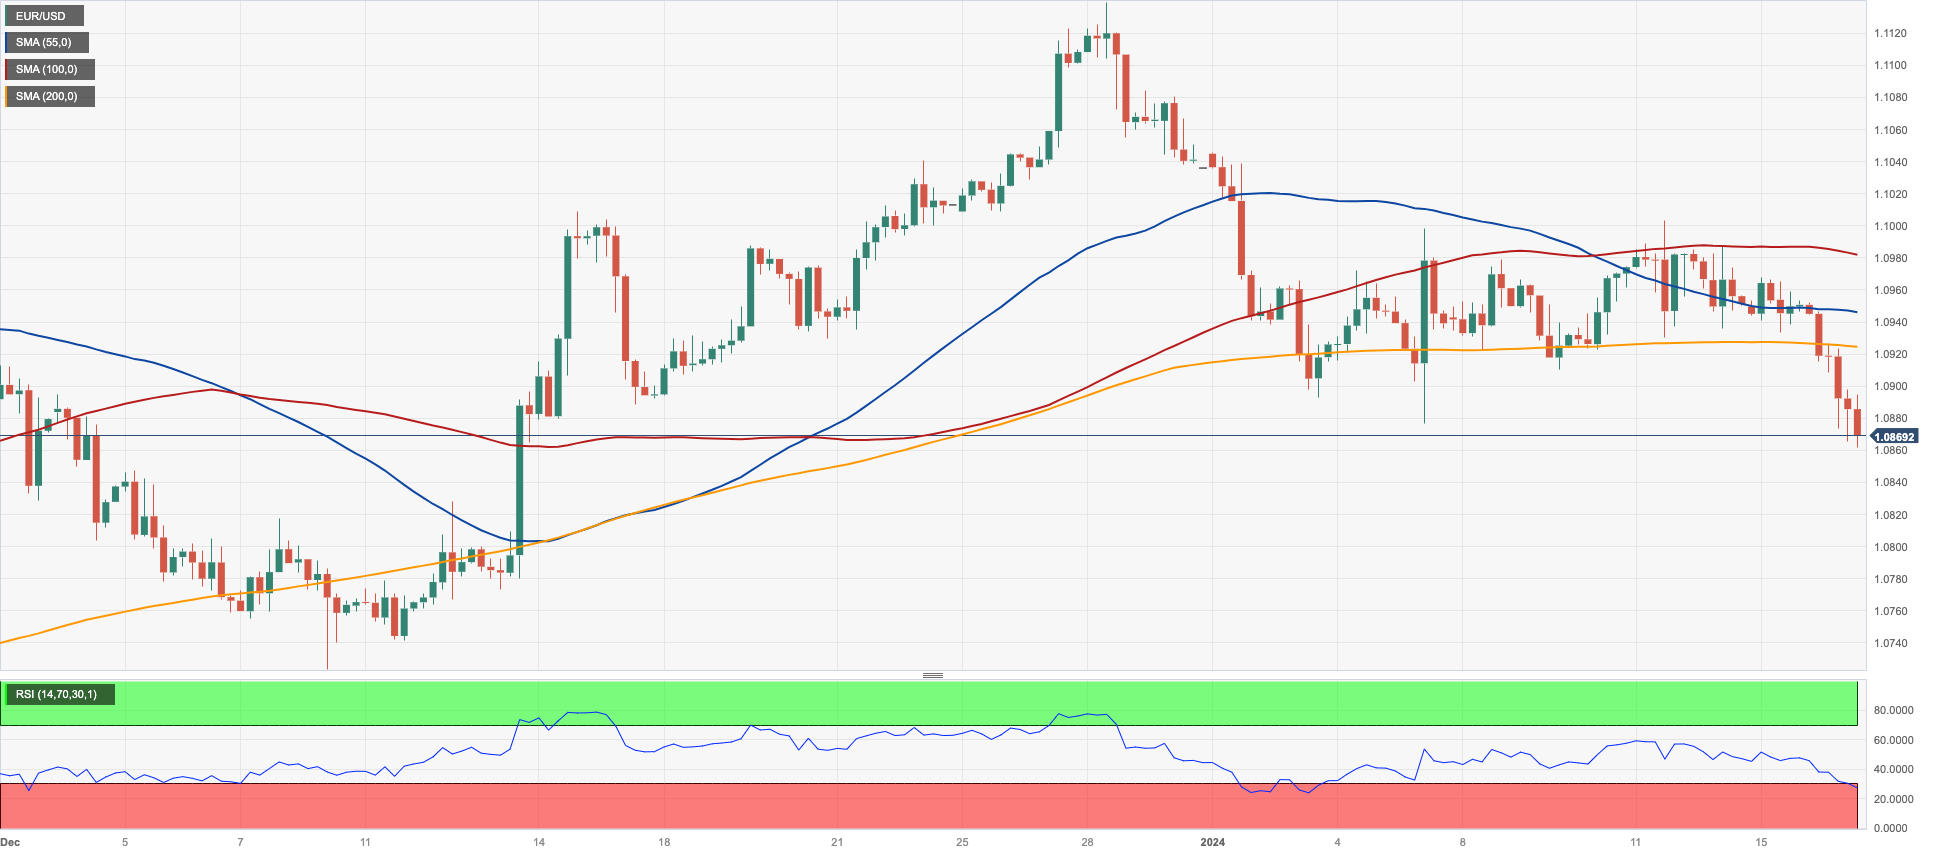
The marked recovery in the greenback kept the appetite for the risk complex subdued on turnaround Tuesday, motivating EUR/USD to exacerbate its decline and drop to five-month lows in the 1.0870/65 band.
On the other hand, the USD Index (DXY) extended its leg higher and left behind the 103.00 hurdle to print a new five-week high, re-shifting its focus to a potential visit to the 200-day SMA near 103.40.
In fact, the greenback gathered extra pace as US markets returned to normal activity following Monday’s holiday, while the rebound in US yields across the curve also collaborated with the uptick in the index, particularly after FOMC’s Waller reported that the data in the last few months has enabled the Fed to contemplate a policy rate cut in 2024. He expressed increased confidence that they are close to achieving sustainable 2% inflation. Waller's perspective aligns with the projections of Fed policymakers, indicating a consensus for three 25-bps rate cuts in 2024.
Another source of weakness around the European currency came after the ECB’s November Consumer Inflation Expectations declined markedly to 3.2% (from 4.0%). However, ECB policymakers still leant towards the prudent side, in contrast with investors’ views of more than 120 bps rate cuts for the current year.
On this, Board member Valimaki reported that a soft landing for the economy remains the baseline, but risks are tilted towards the downside. He emphasized the importance of not rushing into rate cuts, stating that it's preferable to wait a bit longer than to exit prematurely. His colleague Villeroy stated that a solid inflation outlook of around 2% is necessary for considering a rate cut. He mentioned that the ECB is more patient than the markets when it comes to rate cuts. Additionally, Nagel mentioned that they will monitor the impact of the US elections on the market while emphasizing that there is still a long way to go in terms of achieving the desired inflation, and the decision on policy will be based on waiting for relevant data. Towards the end of the NA session, Simkus suggested that the first interest rate cut could come at some point during the summer.
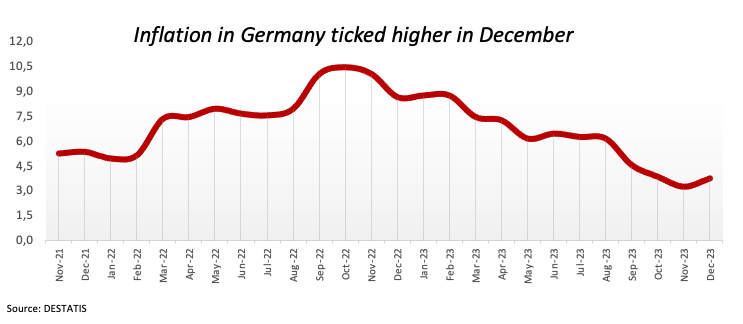
In the euro docket, final inflation figures in Germany showed the CPI rising 0.1% MoM in December and 3.7% over the last twelve months.
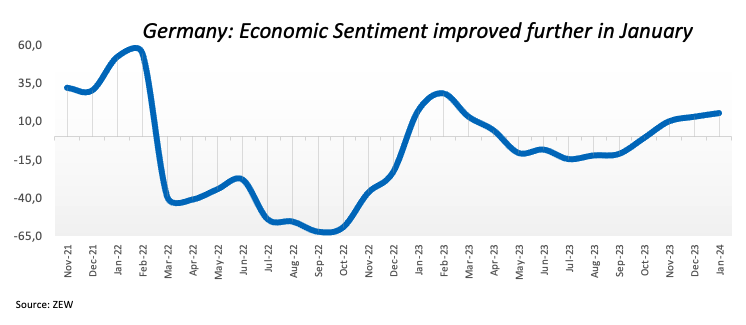
In addition, the Economic Sentiment tracked by the ZEW institute improved to 15.2 in Germany and 22.7 in the broader Euroland for the month of January.
Across the ocean, the NY Empire State Manufacturing Index worsened sharply to -43.7 in the current month.
If sellers break below the 2024 low of 1.0861 (January 16), EUR/USD could put the key 200-day SMA of 1.0847 to the test ahead of the transitory 100-day SMA of 1.0768. The loss of this region paves the way for a probable drop to the December 2023 bottom of 1.0723 (December 8) seconded by the weekly low of 1.0495 (October 13, 2023), the 2023 low of 1.0448 (October 3) and the round level of 1.0400. On the upside, there is initial resistance at the weekly top of 1.0998 (January 5, 11) before the December 2023 peak of 1.1139 (December 27), which is also supported by the 200-week SMA at 1.1151, and both come before the 2023 high of 1.1275 (July 18). On a daily basis, the RSI deflated to the 44 zone.
Resistance levels: 1.0998 1.1009 1.1139 (4H chart)
Support levels: 1.0861 1.0723 1.0656 (4H chart)
USDJPY
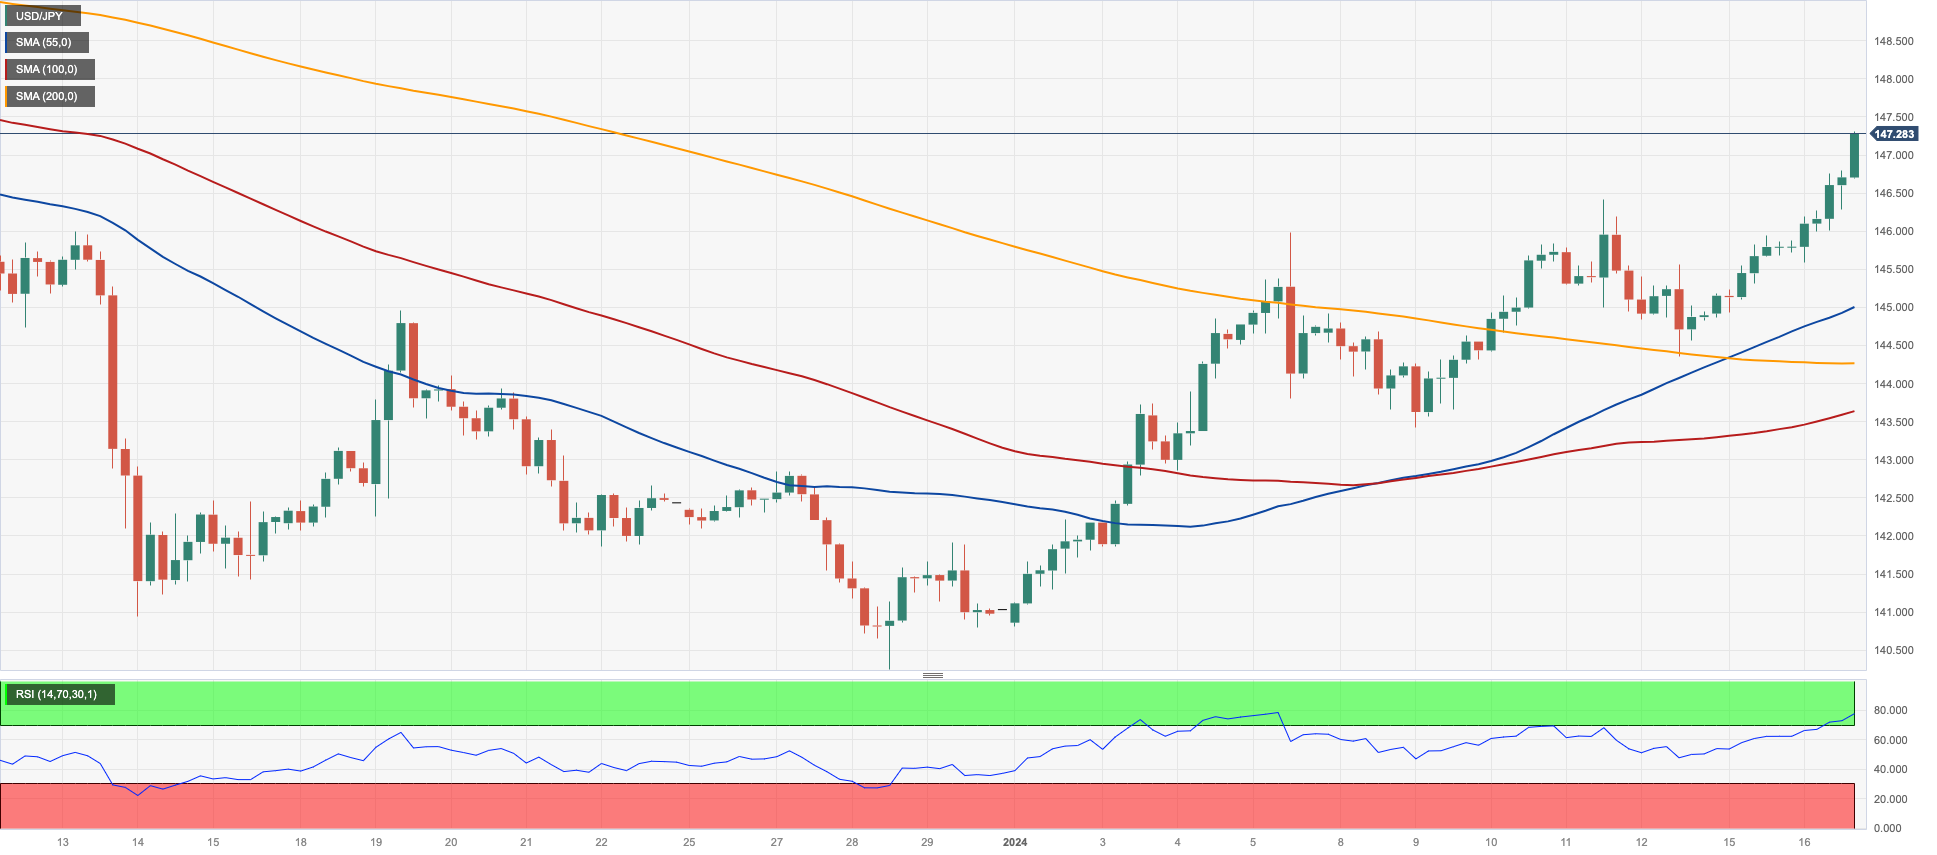
The continuation of the upside momentum in the greenback encouraged USD/JPY to add to the promising start of the week, advancing to new five-week highs past 147.00 the figure on turnaround Tuesday.
Extra gains in the pair were also underpinned by the robust bounce in US yields across various maturities as US markets returned to their usual trading activity after the MLK holiday.
In the Japanese money market, JGB 10-year yields regained balance and rose north of 0.60% following two daily drops in a row.
In the calendar, Producer Prices in Japan rose 0.3% MoM in December and came in flat over the last twelve months.
Following a new YTD top at 147.19 (January 16), next on the upside for USD/JPY comes the transitory 100-day SMA of 147.40 ahead of the critical level of 150.00 and the 2023 peak of 151.90 (November 13). Further up aligns the 2022 high of 151.94 (October 21) closely followed by the round number of 152.00. Instead, if the pair falls below the 200-day SMA of 143.70, it could revisit the December 2023 low of 140.24 (December 28) before reaching the round milestone of 140.00. The July 2023 low of 137.23 (July 14) appears south of here, seconded by the March 2023 low of 129.63 (March 24). The daily RSI increased to the vicinity of 63.
Resistance levels: 147.31 148.52 149.67 (4H chart)
Support levels: 144.34 143.42 140.24 (4H chart)
GBPUSD
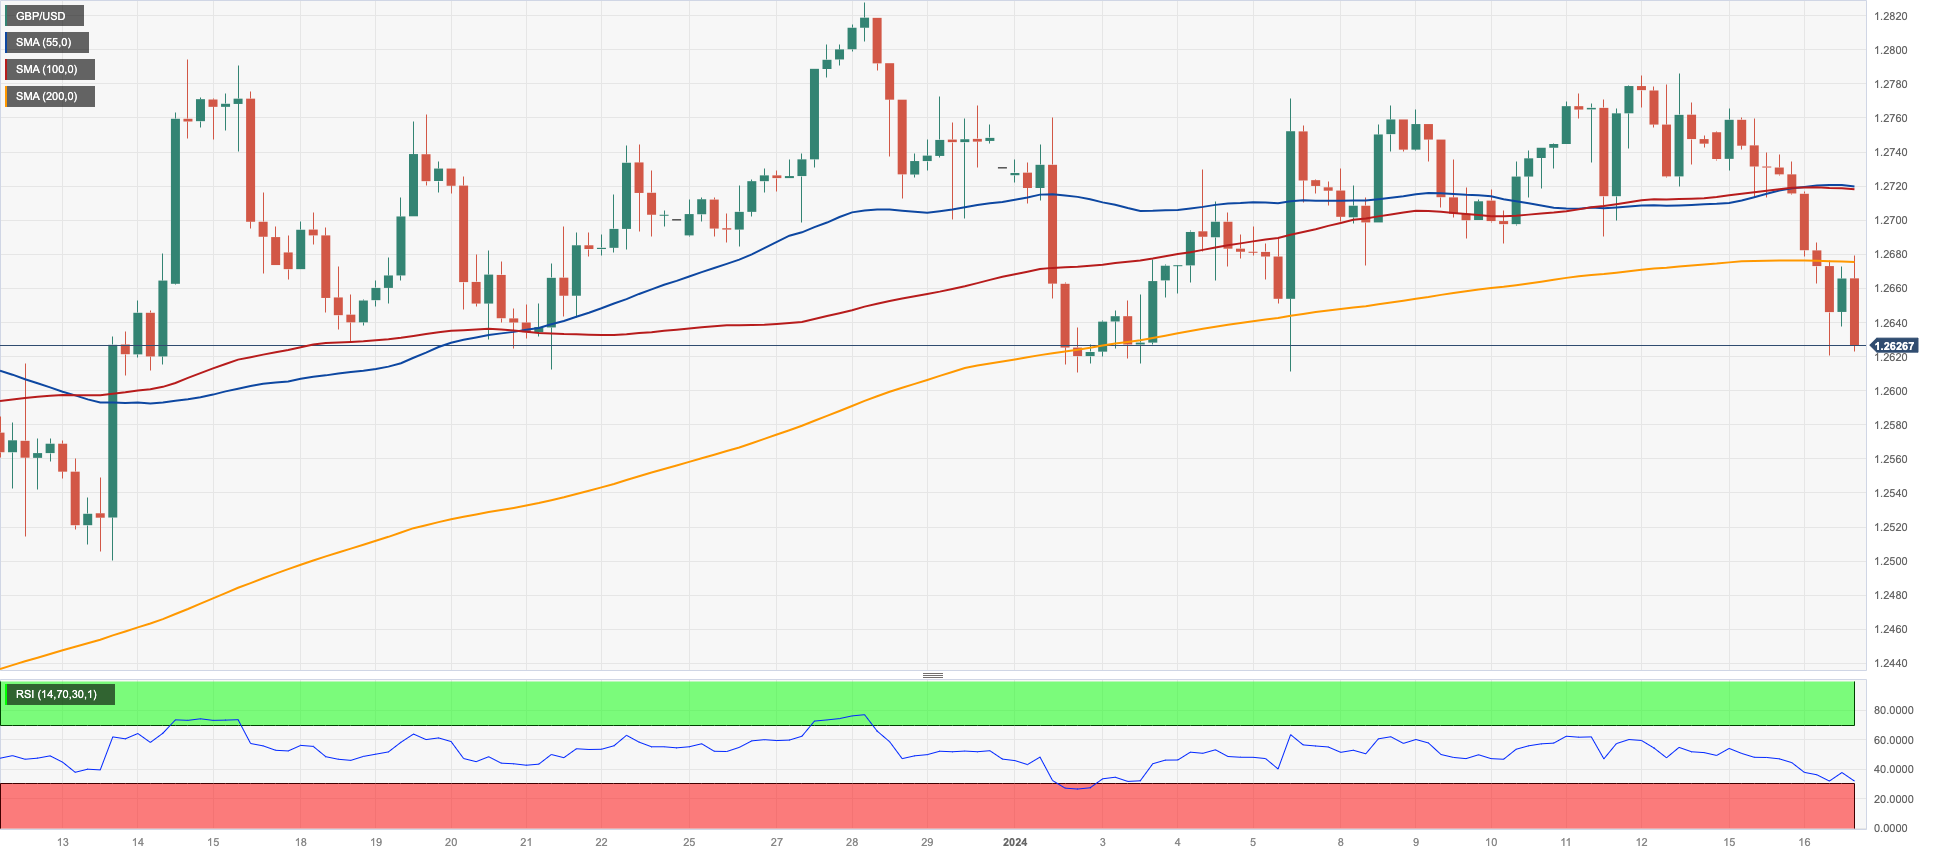
GBP/USD kept the bearish tone well in place for the third session in a row on Tuesday, this time slipping back to the 1.2620 region, or multi-day lows.
In the meantime, the daily downtick in Cable came in response to the broad-based strength in the greenback along with the marked rebound in US yields vs. a small decline in UK 10-year gilt yields, which remained around 3.80%.
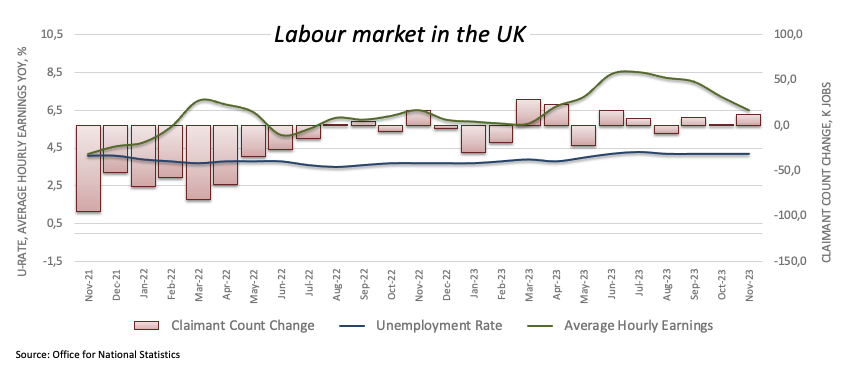
Furthermore, the positive readings from the UK labour market report also failed to lend some support to the quid after the jobless rate held steady at 4.2% in November, Employment Change increased by 73K individuals, Claimant Count Change rose by 11.7K people in December, and Average Earnings inc. Bonus rose 6.5% in the year to November.
If the GBP/USD continues to fall, it may revisit the so-far 2024 low of 1.2610 (January 2) prior to the 200-day SMA at 1.2543 and the December 2023 bottom of 1.2500 (December 13). Extra weakness may bring Cable to the weekly low of 1.2187 (November 10, 2023), which comes ahead of the October 2023 low of 1.2037 (October 3), the critical 1.2000 mark, and the 2023 bottom of 1.1802 (November 10, 2023). On the contrary, immediate up-barrier emerges at the December 2023 peak of 1.2827 (December 28), before the weekly high of 1.2995 (July 27 2023), which just precede the crucial 1.3000 level. The day-to-day RSI dropped below the 50 threshold.
Resistance levels: 1.2785 1.2827 1.2995 (4H chart)
Support levels: 1.2620 1.2610 1.2500 (4H chart)
GOLD
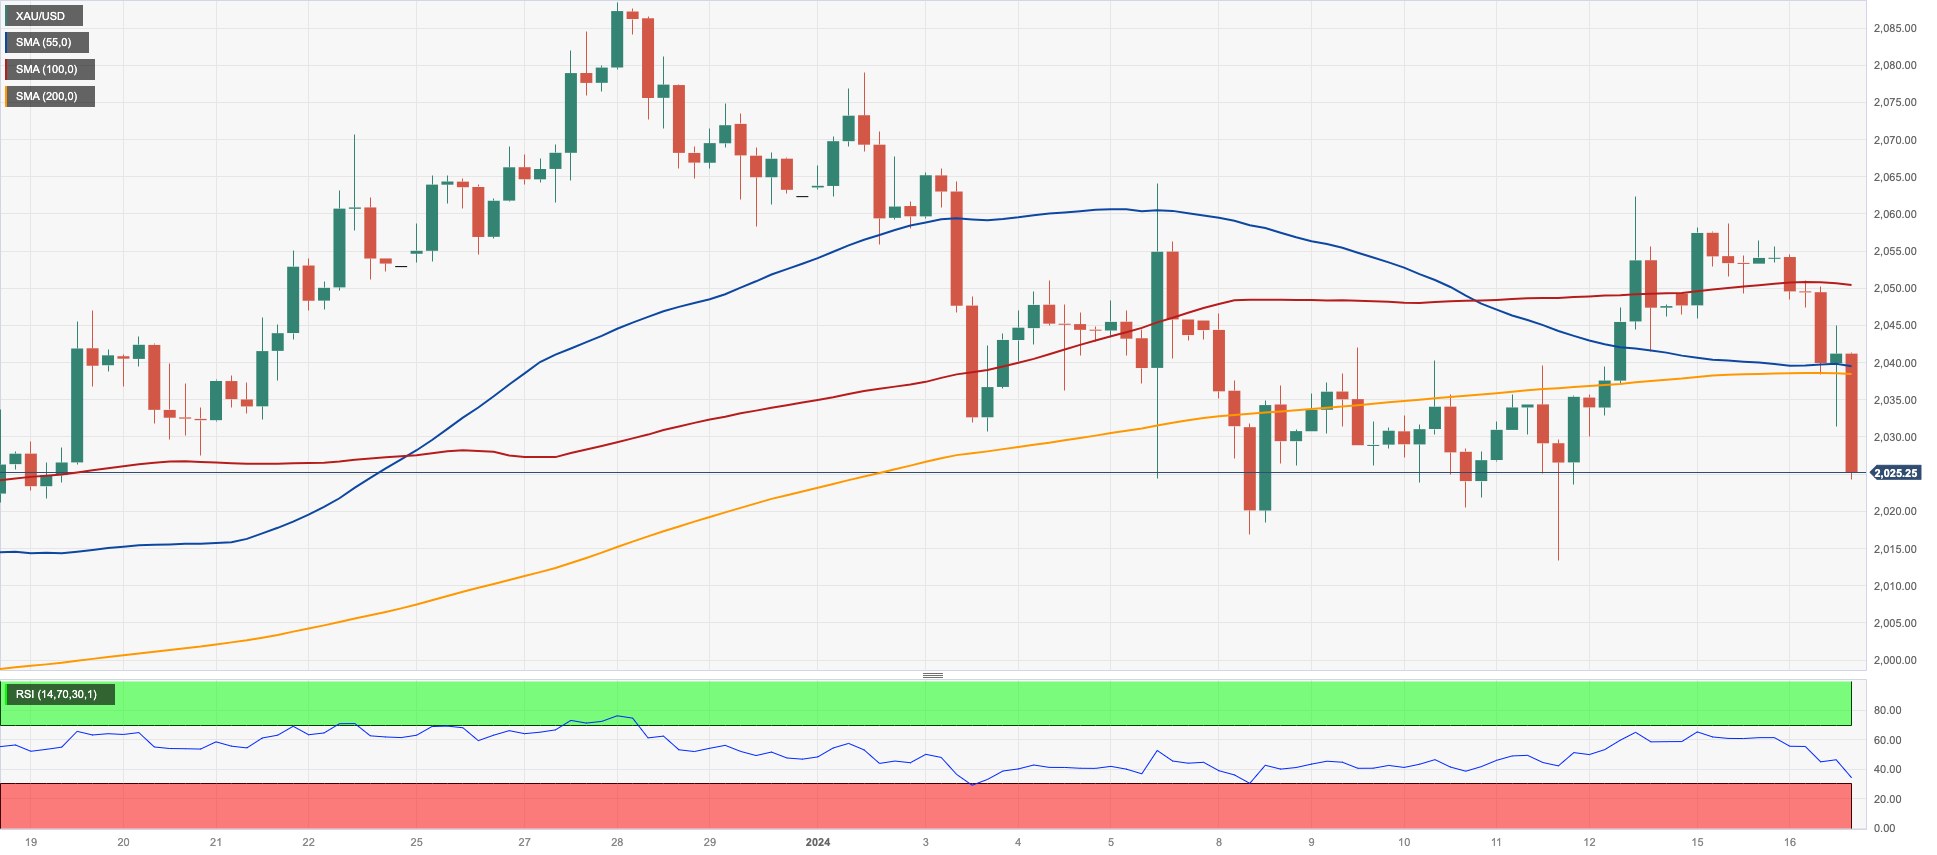
Prices of the troy ounce of the yellow metal retreated markedly and revisited the $2030 region on Tuesday.
The intense pullback came after three consecutive daily gains and was triggered by the firm tone surrounding the greenback and the equally strong bounce in US yields across the curve, all amidst the declining probability of an interest rate cut by the Fed in March.
On the latter, and according to CME Group’s FedWatch Tool, the probability of such a scenario is now seen at nearly 60%, down from around 80% the previous day.
If bears regain the upper hand, gold might revisit the 2024 low of $2013 (January 11), which is also supported by the transitory 55-day SMA. The breach of this region may drive sellers to push prices to the important conflict zone around $2000 before the December 2023 bottom of $1973 (December 13), which is ahead of the 200-day moving average of $1963 and the November 2023 low of $1931 (November 13). Further losses might lead the October 2023 bottom of $1810 (October 6) to be retested before the 2023 low of $1804 (February 28) and, finally, the critical $1800 level. By contrast, the weekly high of $2088 (December 28) emerges as the initial target prior to the all-time top of $2150 (4 December 2023).
Resistance levels: $2062 $2078 $2088 (4H chart)
Support levels: $2013 $1973 $1965 (4H chart)
CRUDE WTI
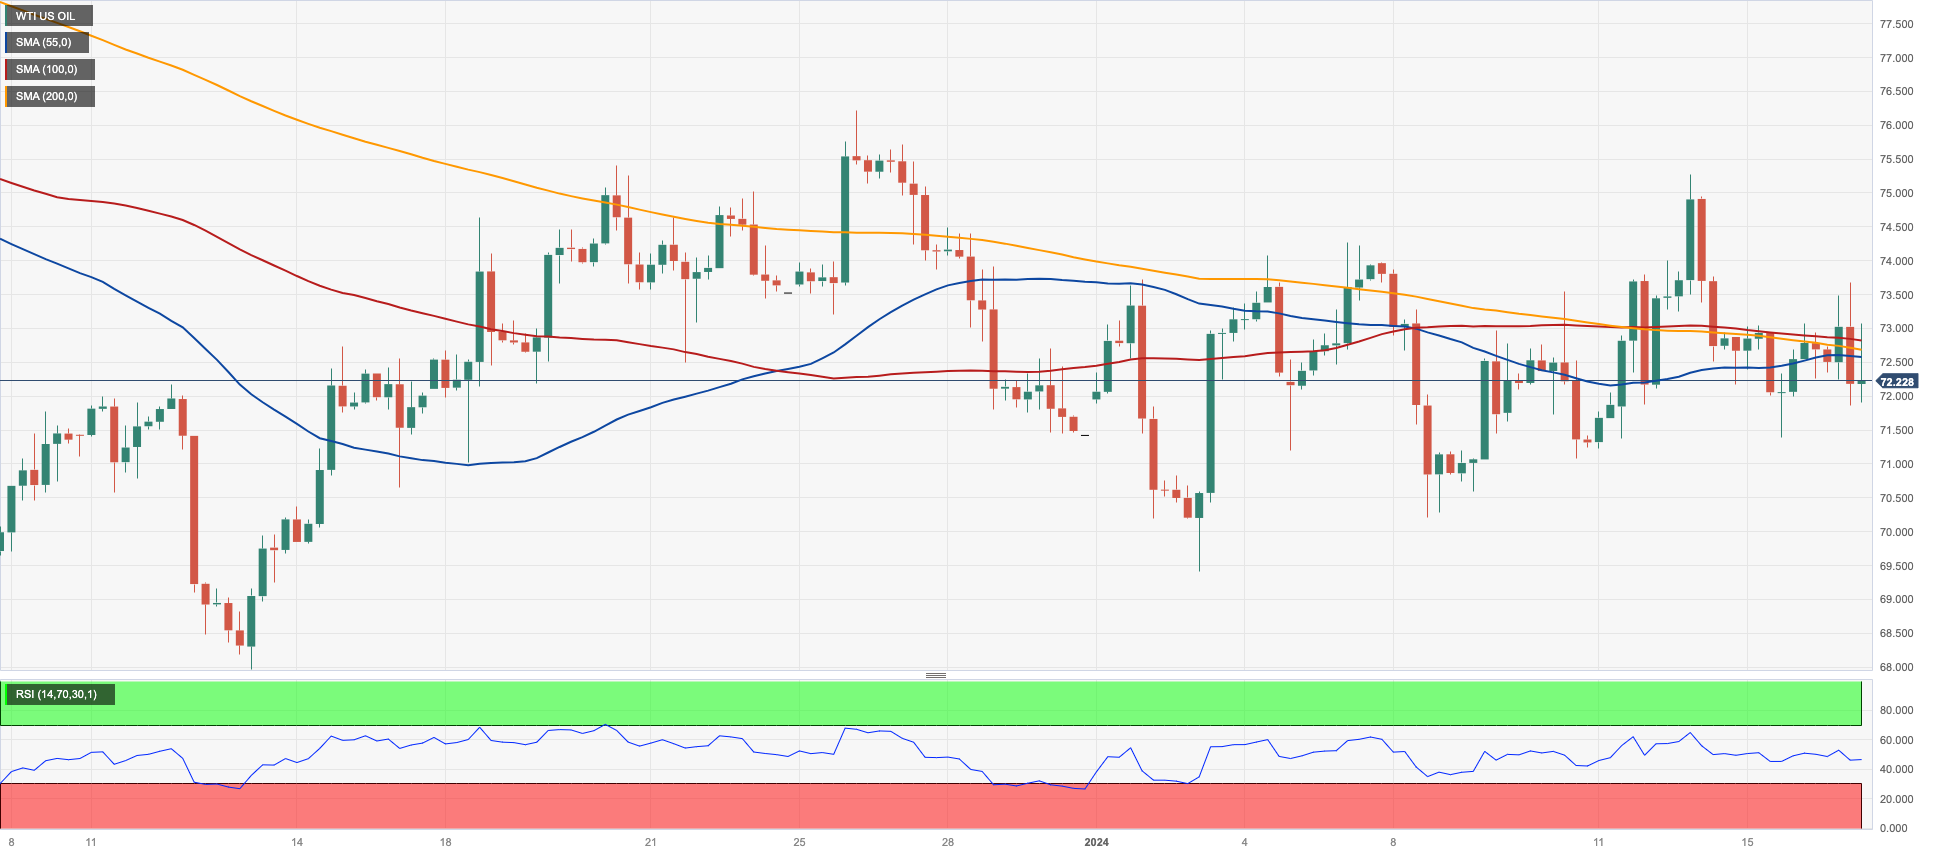
WTI prices remained on the defensive on Tuesday, this time breaking below the $72.00 mark per barrel amidst a persistently sour mood around the commodity.
Indeed, dwindling expectations of interest rate cuts by the Fed in March in combination with the stronger dollar and the perceived tighter-for-longer stance from the ECB all helped offsetting geopolitical concerns, mainly stemming from the Red Sea.
The weekly high of $76.14 (December 26 2023) is the next target for WTI, followed by the important 200-day SMA at $77.72, the vital $80.00 barrier, and the November 2023 top of $80.15 (November 3). Further increases from here may propel the market back to its weekly peak of $89.83 (October 18 2023), ahead of the 2023 high of $94.99 (September 28 2023) and the August 2022 top of $97.65 (August 30), all before the psychological $100.00 level. In the other direction, a breach of the 2024 low of $69.31 (January 3) would allow for a further decline to the December 2023 low of $67.74 (December 13), which precedes the June 2023 low of $66.85 (June 12) and the 2023 bottom of $63.61.
Resistance levels: $75.21 $76.14 $79.56 (4H chart)
Support levels: $70.10 $69.25 $67.68 (4H chart)
GER40
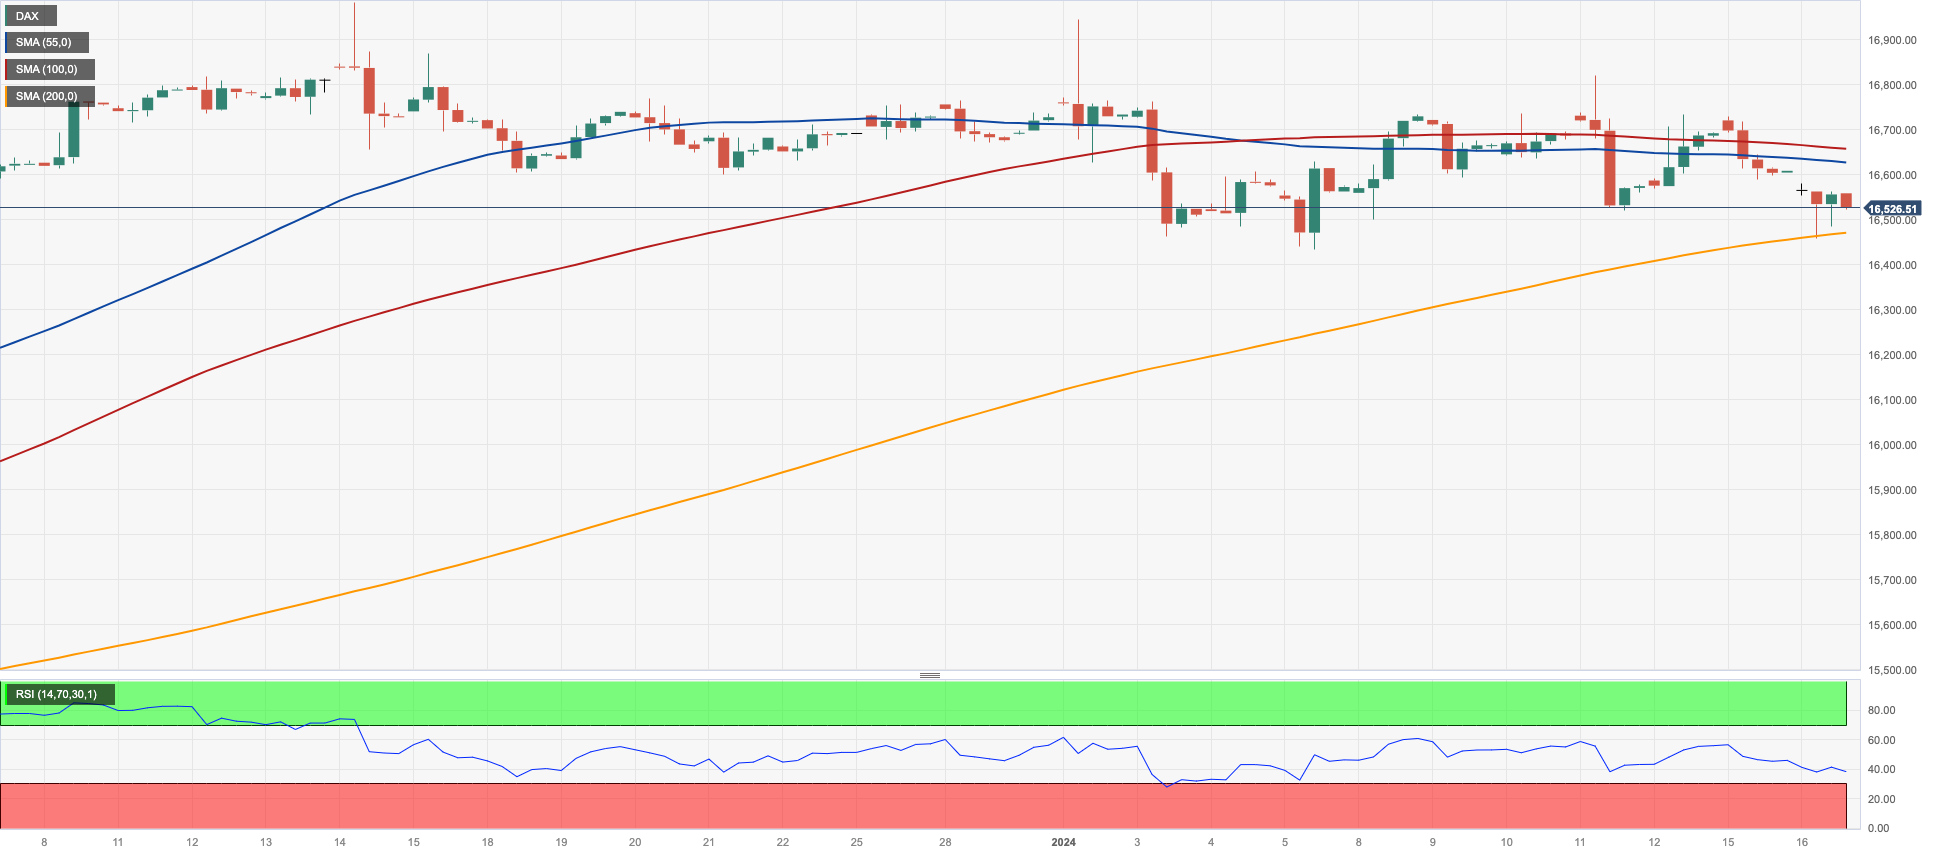
Germany’s stock index DAX40 extended the sour sentiment and added to Monday’s losses, trading at shouting distance from the so-far YTD lows around the 16500 region on Tuesday.
In fact, the generalized selling pressure in the European markets came in response to investors’ repricing of the timing of the potential interest rate cut by the ECB.
Furthermore, Tuesday’s comments from ECB policymakers showed a stark contrast with markets’ expectations of a reduction of interest rates by the ECB in Q2.
In addition, the sharp uptick in the greenback, coupled with the move higher in yields across the board, favoured the downbeat mood among traders on Tuesday.
Immediately to the downside for the DAX40 comes the so-far 2024 low of 16448 (January 5) ahead of the weekly low of 15915 (November 28), which appears propped up by the crucial 200-day SMA of 15883. The October 2023 low of 14630 (October 23) follows next, prior to the March 2023 low of 14458 (March 20). Just the opposite, the initial up-barrier aligns at the YTD high of 16963 (January 2) before the all-time peak of 17003 (December 14). The daily RSI dipped below 51.
Best Performers: Qiagen, Merck, Rheinmetall AG
Worst Performers: Commerzbank, Siemens Energy AG, Zalando SE
Resistance levels: 16839 16963 17003 (4H chart)
Support levels: 16476 16448 15915 (4H chart)
GBPJPY
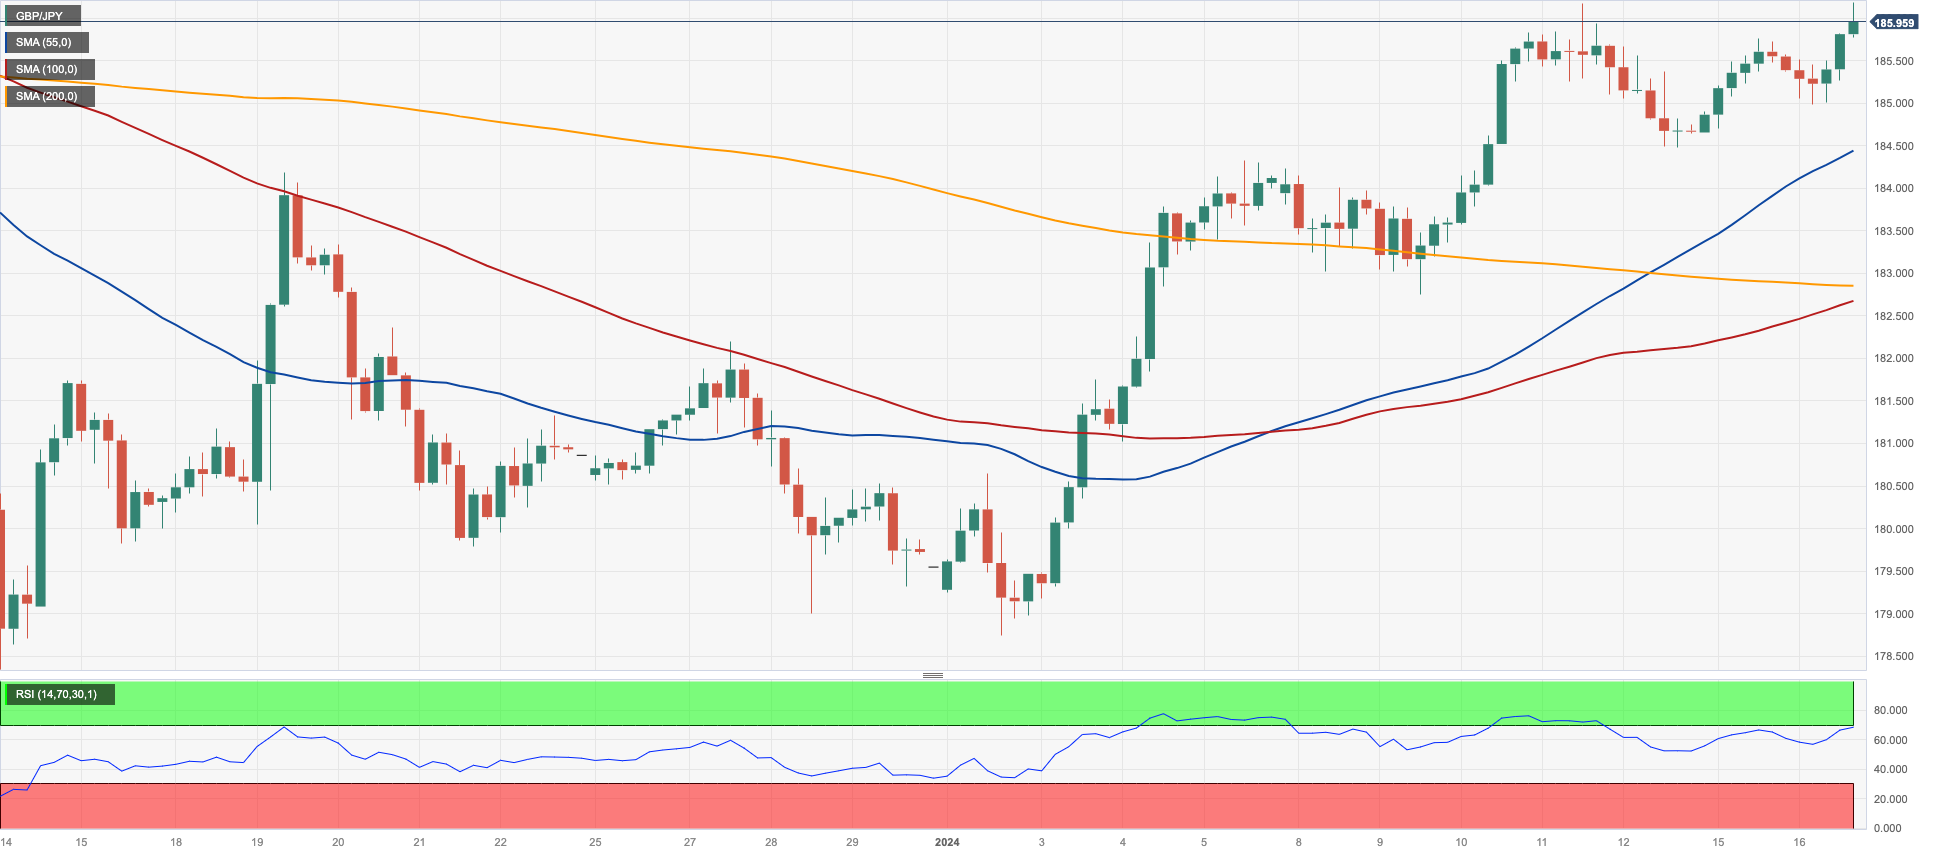
GBP/JPY added to Monday’s uptick and climbed to a new 2024 top near 186.20, an area last visited in early December, on Tuesday.
The intense depreciation of the Japanese currency kept favouring the weekly upside in the cross despite the appetite for risky assets, which lost further traction against the backdrop of the better tone in the US dollar.
The initial objective for GBP/JPY is the 2024 high of 186.18 (January 16), followed by the 2023 top of 188.65 (November 24). A break above this level might spark a challenge to the November 2015 peak of 188.80 (November 19), ahead of the August 2015 high of 195.28 (August 18). Having said that, if the cross drops below the 200-day SMA at 180.20, it may test the December 2023 bottom of 178.33 (December 14), which precedes the October 2023 low of 178.03 (October 3) and the July 2023 low of 176.30. From here, a further decline to the May 2023 bottom of 167.84 (May 11), ahead of the March 2023 low of 158.26 (March 24), is projected. The daily RSI increased past 61.
Resistance levels: 186.18 187.56 188.66 (4H chart)
Support levels: 184.47 182.75 178.74 (4H chart)
NASDAQ
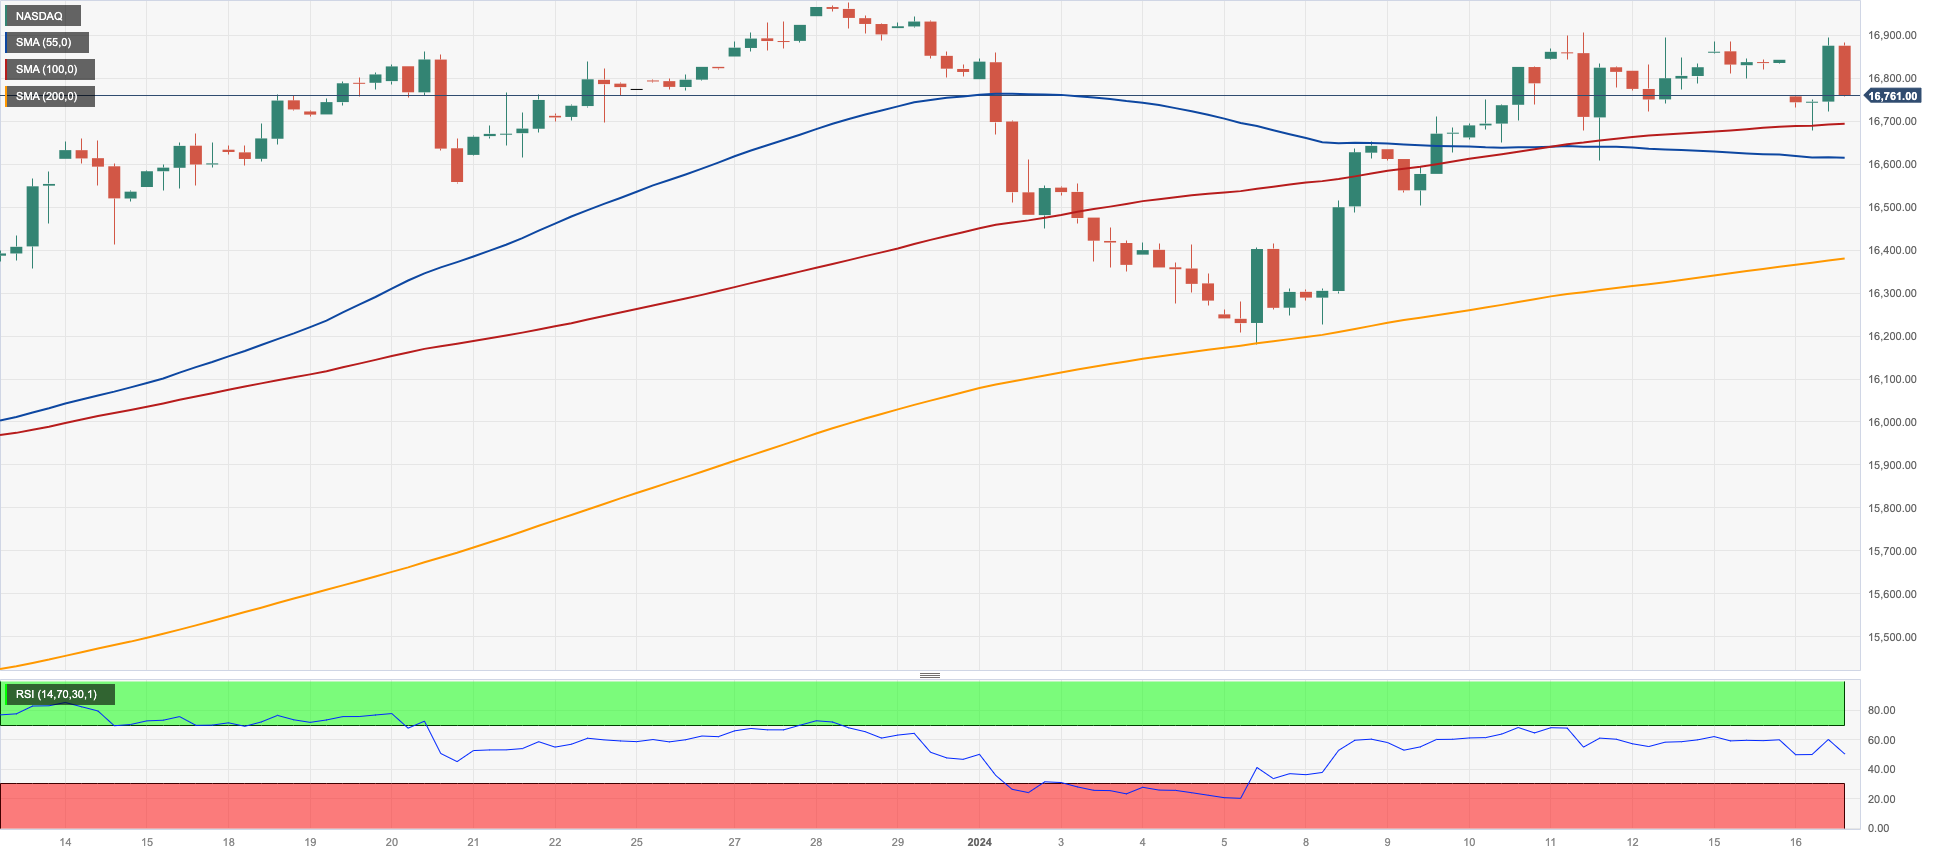
In line with the rest of US stock markets, the tech reference Nasdaq 100 charted modest losses, reversing at the same time a six-day positive streak.
The daily knee-jerk in the index came in response to the strong pick-up in the greenback in combination with the equally robust bounce in US yields across different timeframes, all amidst investors’ repricing of interest rate cuts by the Fed later in the year.
Furthermore, the pullback in the tech sector came despite the solid performances of giants AMD and NVIDIA against the backdrop of fresh demand for AI-linked assets.
The Nasdaq 100's immediate upward objective is the 2024 high of 16900 (January 12), which precedes the record peak of 16969 (December 28 2023). The other way around, the January low of 16249 (January 5) provides the first level of support, followed by the December 2023 low of 15695 (December 4) and the crucial 200-day SMA of 14947. The loss of this region may lead to a move to the October 2023 low of 14058 (October 26), which comes ahead of the April 2023 low of 12724 (April 25), the March 2023 low of 11695 (March 13), and the 2023 low of 10696 (January 3). The RSI for the day receded to the sub-62 zone.
Top Gainers: AMD, O’Reilly Automotive, NVIDIA
Top Losers: ANSYS, Moderna, The Trade Desk
Resistance levels: 16900 16969 (4H chart)
Support levels: 16249 15695 15532 (4H chart)
DOW JONES
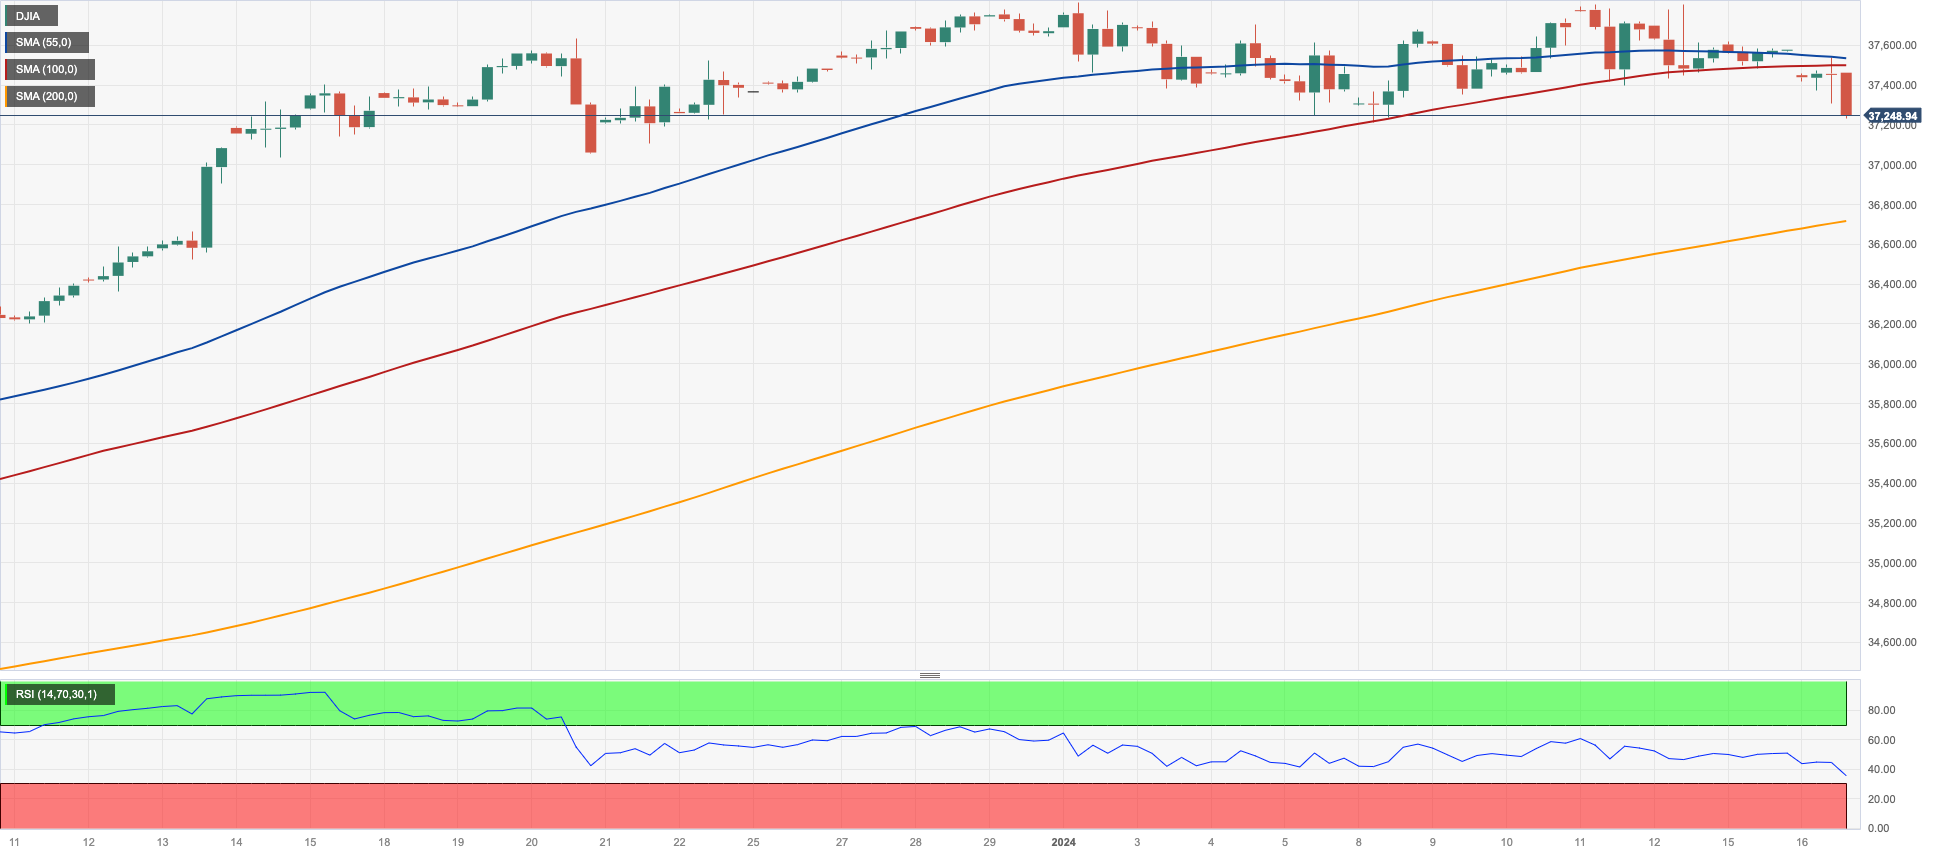
US equities extended Friday’s bearish tone in the first trading session of the week following MLK’s holiday on Monday.
In fact, interest rate jitters sparked fresh selling pressure in US stocks, dragging the benchmark Dow Jones to multi-day lows around the 37300 zone on Tuesday.
According to FOMC’s C. Waller, there is a belief that the Fed will have the ability to reduce interest rates this year, as long as inflation does not experience a significant rebound or remains at elevated levels. However, he cautioned that the timing and extent of these rate cuts will be contingent upon the incoming data and economic indicators.
Also adding to the negative mood among investors, the dollar extended its march north to fresh YTD highs, and US yields rebounded across the curve.
On the whole, the Dow Jones dropped 0.64% to 37352, the S&P500 deflated 0.44% to 4762, and the tech-focused Nasdaq Composite retreated 0.39% to 14913.
Extra losses might prompt the Dow Jones to dispute the 2024 low of 37249 (January 8), which comes before the weekly low of 37073 (December 20, 2023) and the December 2023 low of 36010 (December 5). Further losses bring the 200-day SMA at 34562 into play before the weekly low of 33859 (November 7, 2023), the October 2023 low of 32327 (October 27), and the 2023 low of 31429. (March 15). On the flip side, if bulls can break above the current monthly consolidation, the Dow will attempt to retest its all-time high of 37825 (January 12). The everyday RSI dropped to roughly 56.
Top Performers: Verizon, Walt Disney, Home Depot
Worst Performers: Boeing, Nike, Chevron
Resistance levels: 37825 (4H chart)
Support levels: 37249 37073 36021 (4H chart)
MACROECONOMIC EVENTS
All Information & Updates provided by:

All information relating to the financial markets available on this page has been prepared and issued by FXStreet (Forexstreet SL, Spain, Reg: B62498233) on the basis of publicly available information and all information believed to be reliable and does not conflict with Kuwaiti local laws, and all necessary care has been taken to before the company to ensure that the facts mentioned are correct from the source.
NCM Investment nor any of its directors or employees shall in any way be held responsible for the contents of this news, and the information contained on this page is intended only to provide clients with publicly available information and should not be construed as investment advice, report or analysis and/or constitute an offer or invitation to buy or sell financial instruments of any kind.
RISK WARNING: Forex and CFDs are highly risky leveraged products, as losses can exceed deposits. Please ensure you understand all the risks and take independent advice if necessary. NCM will segregate the clients based on the criteria of the regulator and its bylaws. NCM does not provide any advisory service; the material published does not constitute advice or a recommendation for a transaction in any financial instrument. NCM accepts no responsibility for any use of the content presented and any consequences of that use. Anyone acting on the information provided does so at their own risk.