
- Contact Us:
-

-

-

-


Daily Market Updates
18 Jan 2024
EURUSD
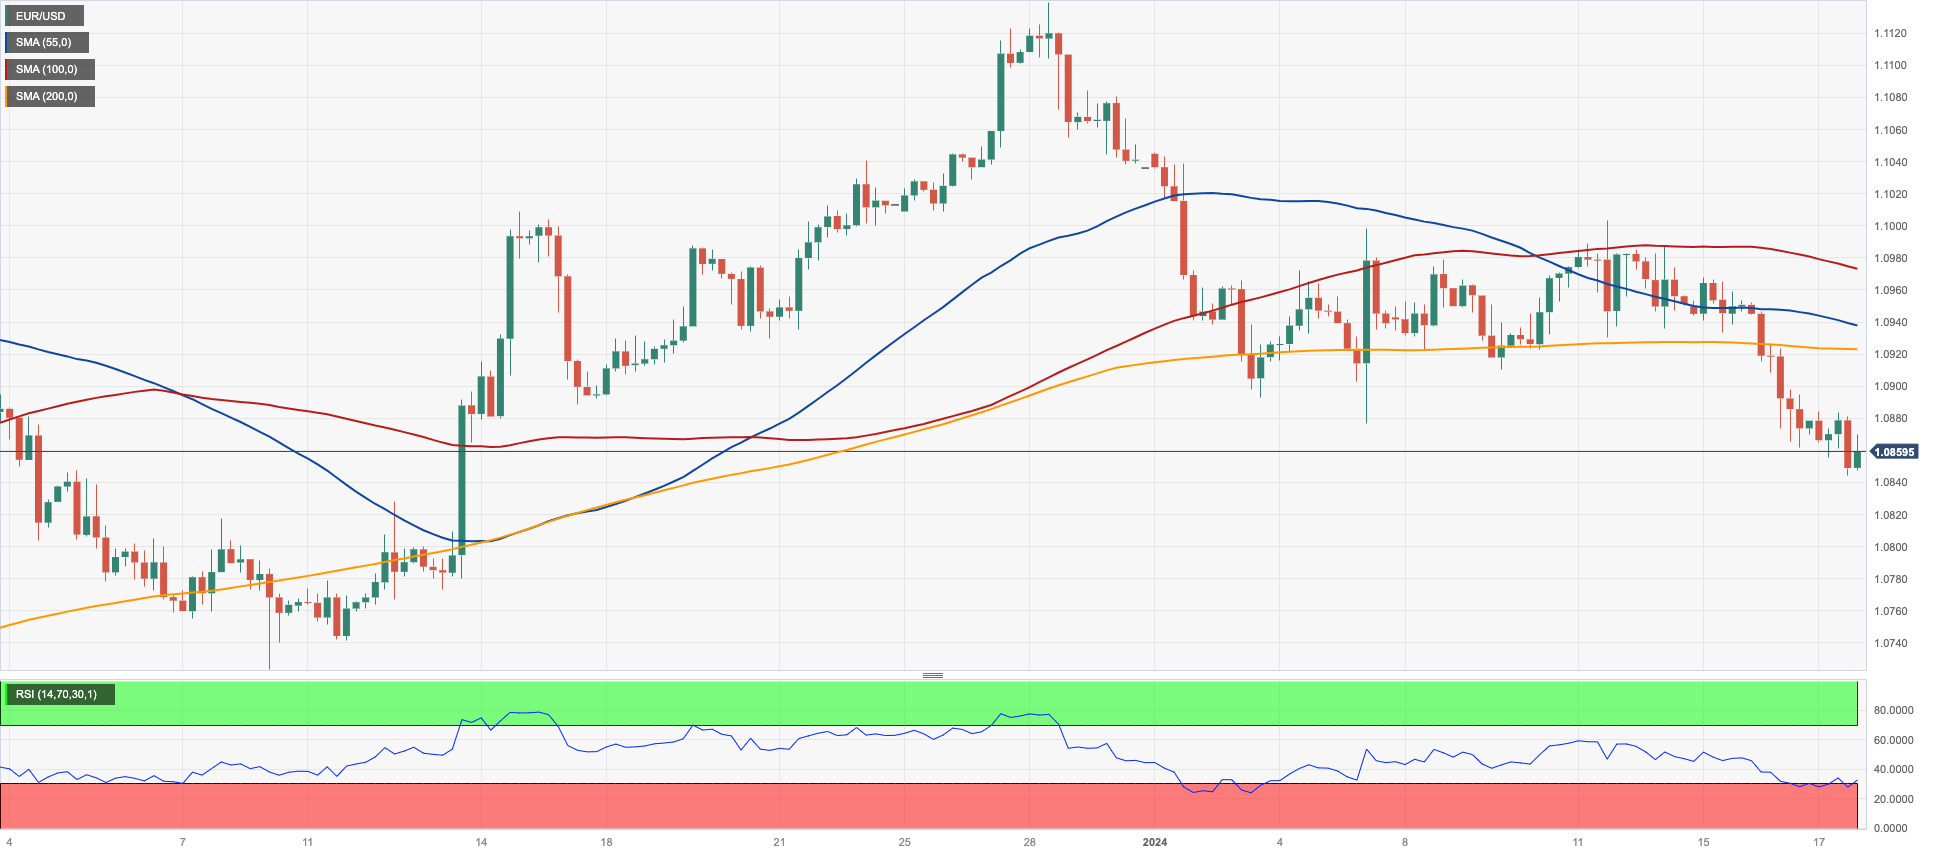
The intense recovery in the greenback sponsored the fifth consecutive daily drop in EUR/USD, which this time printed new five-week lows in the 1.0845/40 band on Wednesday.
That said, the USD Index (DXY) extended its march north to new 2024 highs near 103.70, breaking above the critical 200-day SMA (103.44) and thus opening the door to extra gains in the relatively short term. The greenback also saw its upside bias reinvigorated following stronger-than-expected Retail Sales in December, which kicked further down the road expectations of a rate cut by the Fed in March.
The move lower in spot was also accompanied by further advances in US and German yields.
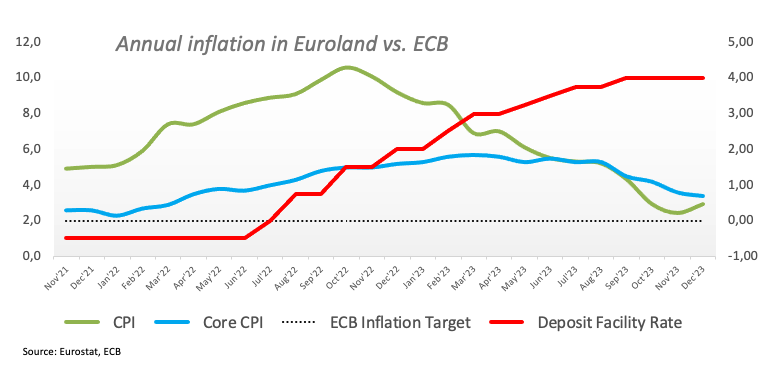
Meanwhile, statements from ECB officials continued to be reported: Knot stated that markets were preemptively anticipating cuts and stressed the importance of several factors aligning for a 2% inflation target in 2025. He pointed out that increased market easing would decrease the likelihood of a cut. Knot's colleague, Vasle, reported a significant disparity in his rate expectations compared to the market. He underscored the premature nature of anticipating a cut at the start of the second quarter and emphasized the importance of monitoring fiscal policy to support disinflation. Early on Wednesday, President Lagarde suggested a potential rate cut at some point during the summer.
Data-wise, in the euro bloc, final inflation figures matched the preliminary readings: the headline CPI rose 2.9% YoY and the Core CPI gained 3.4% over the last twelve months.
In the US, Mortgage Applications expanded 10.4% in the week to January 12 and Retail Sales expanded at a monthly 0.6% in December. Additional data saw Industrial Production increase 0.1% MoM in December, Business Inventories contracted 0.1% in November and the NAHB Housing Market Index improved to 44 in January.
If sellers breach below the 2024 low of 1.0844 (January 17), an area coincident with the critical 200-day SMA, EUR/USD could extend the weakness to the transitory 100-day SMA of 1.0767 ahead of the December 2023 bottom of 1.0723 (December 8). The loss of this region exposes a deeper pullback to the weekly low of 1.0495 (October 13, 2023), seconded by the 2023 low of 1.0448 (October 3), and the round level of 1.0400. On the upside, there is initial resistance at the weekly top of 1.0998 (January 5, 11) before the December 2023 peak of 1.1139 (December 27), which is also supported by the 200-week SMA at 1.1150 and comes before the 2023 high of 1.1275 (July 18). The daily RSI dropped to the 41 zone.
Resistance levels: 1.0921 1.0971 1.0998 (4H chart)
Support levels: 1.0844 1.0723 1.0656 (4H chart)
USDJPY
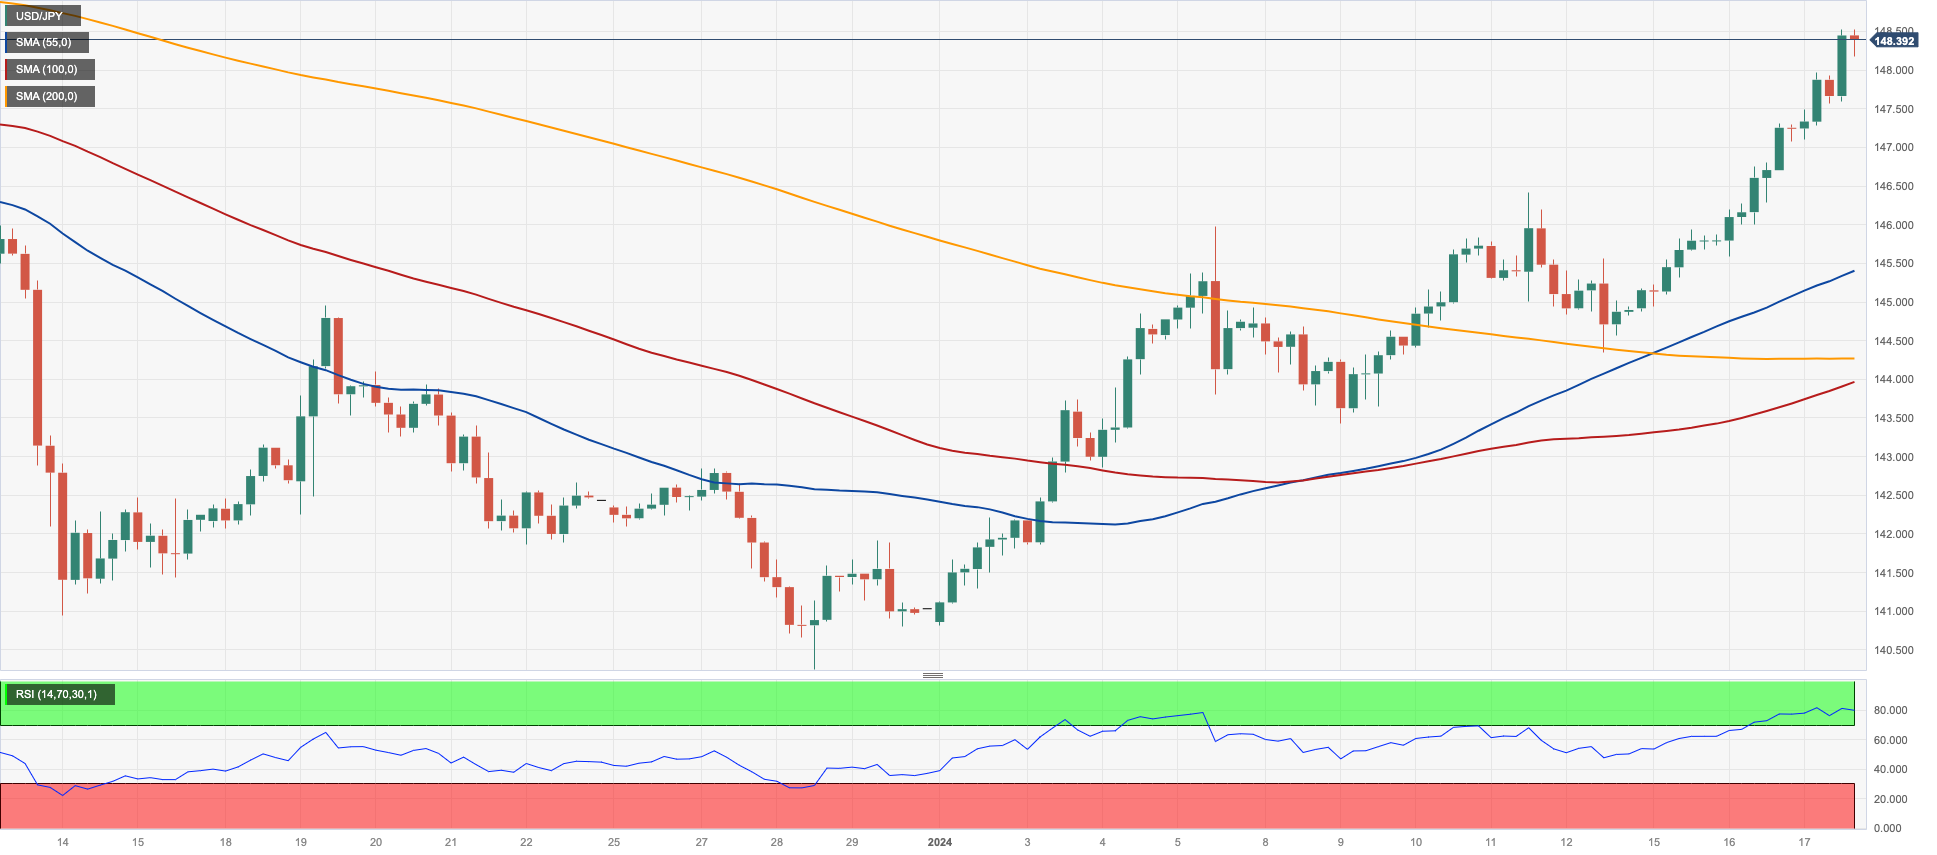
USD/JPY advanced for the third straight session, this time breaking above the 148.00 hurdle to print a new two-month peak around 148.50 on Wednesday.
Once again, dynamics around the greenback—in the form of retreating rate cut bets and extra gains—in combination with the extra rebound in US yields across different timeframes contributed to the upward bias in spot.
In the Japanese bond market, JGB 10-year yields also added to Tuesday’s uptick, surpassing 0.62%.
In Japan, the Reuters Tankan Index worsened to 6 in January (from 12).
Following a fresh YTD high at 148.52 (January 17), the next upside target for USD/JPY now is the key level of 150.00 seconded by the 2023 top of 151.90 (November 13). Further up, the 2022 peak of 151.94 (October 21) is closely followed by the round number of 152.0. Instead, if the pair goes below the 200-day SMA of 143.77, it might confront the December 2023 low of 140.24 (December 28) before reaching the round milestone of 140.00. The July 2023 low of 137.23 (July 14) shows south of here, followed by the March 2023 low of 129.63 (March 24). The daily RSI climbed to around 67.
Resistance levels: 148.52 149.67 151.43 (4H chart)
Support levels: 144.34 143.42 140.24 (4H chart)
GBPUSD
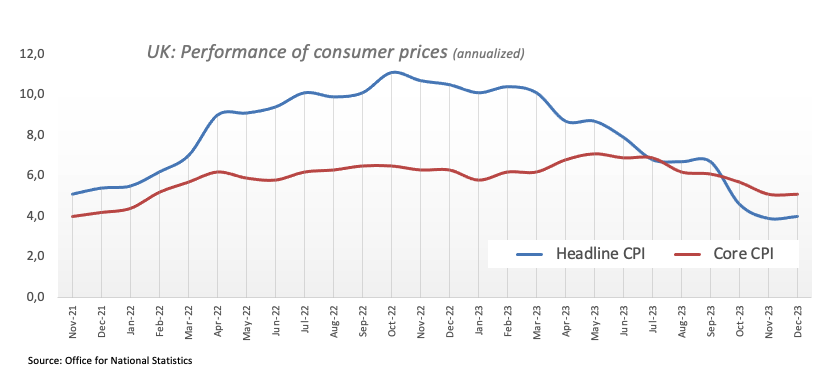
Despite the so-far unabated upward bias in the greenback, the British pound managed to leave behind initial losses and gather fresh traction vs. the greenback soon after UK inflation figures came in stronger than predicted in December.
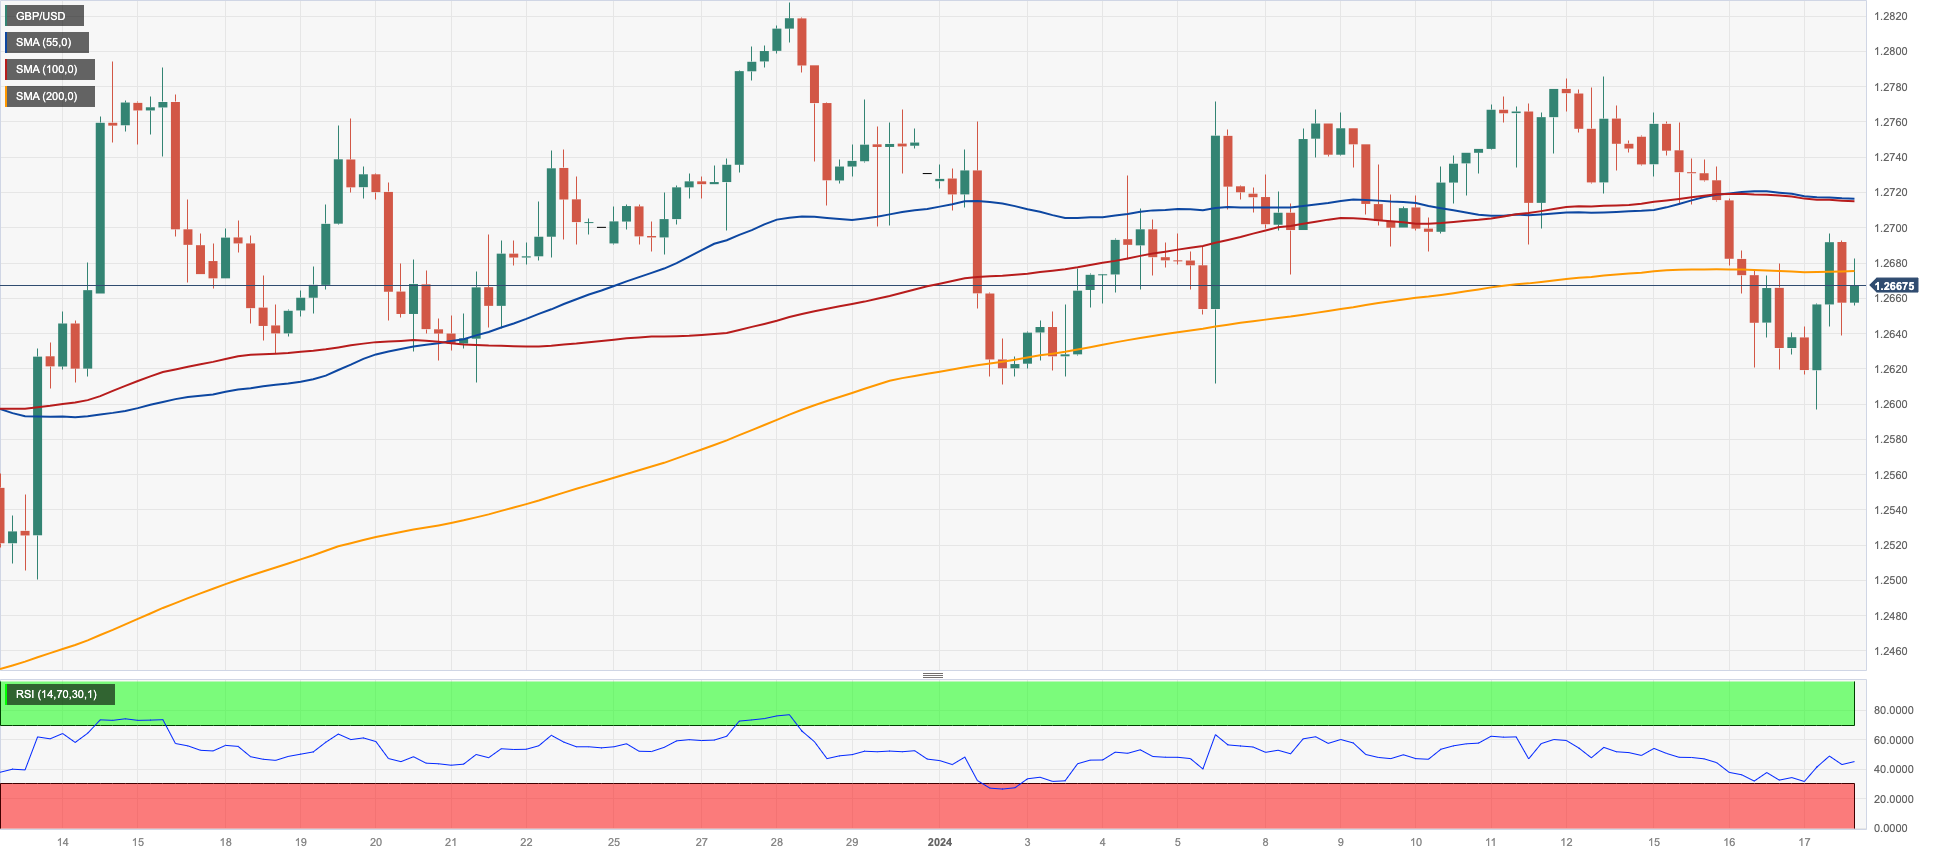
Indeed, GBP/USD rebounded to the vicinity of the key 1.2700 the figure amidst investors’ repricing of further tightening by the BoE. That initial move, however, ran out of steam towards the end of the session, leaving spot hovering around the 1.2660 zone.
Across the Channel, inflation figures saw the headline CPI rise more than expected, at an annualized 4.0% in December and 5.1% when it came to the Core CPI. On a monthly basis, consumer prices rose 0.4%.
If the GBP/USD falls further, it may revisit the so-far 2024 low of 1.2596 (January 17), prior to the key 200-day SMA at 1.2544 and the December 2023 bottom of 1.2500 (December 13). Extra weakening may push Cable to the weekly low of 1.2187 (November 10, 2023), ahead of the October 2023 low of 1.2037 (October 3), the key 1.2000 level, and the 2023 bottom of 1.1802 (November 10, 2023). On the contrary, an immediate up-barrier appears at the December 2023 top of 1.2827 (December 28), prior to the weekly peak of 1.2995 (July 27, 2023), which is just before the critical 1.3000 level. The day-to-day RSI climbed to the proximity of 50.
Resistance levels: 1.2785 1.2827 1.2995 (4H chart)
Support levels: 1.2596 1.2500 1.2448 (4H chart)
GOLD
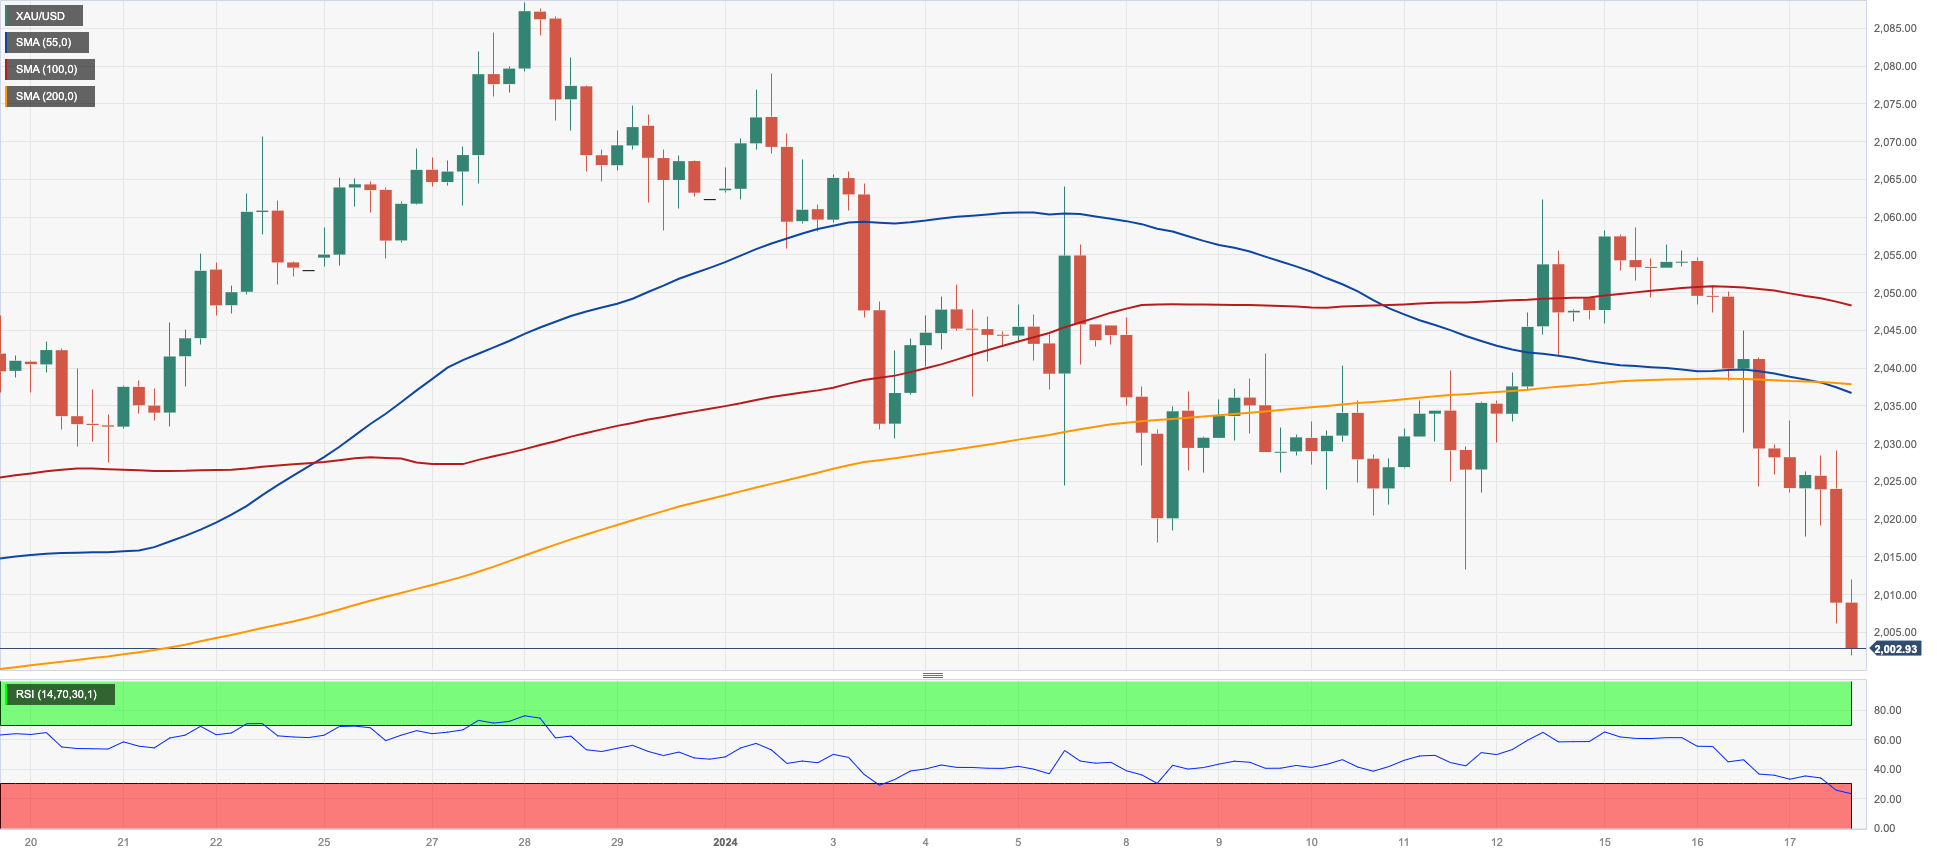
Further weakness dragged gold prices to the proximity of the key contention zone near $2000 per troy ounce on Wednesday.
In fact, the bearish tone remained well in place around the precious metal on the back of further advance in the greenback and higher US yields across the board, all amidst declining bets of a reduction of interest rates by the Fed in March.
According to CME Group’s FedWatch Tool, the probability of a rate cut at the March 20 meeting shrank to nearly 52%, down from around 80% at the beginning of the week.
The 2024 bottom of $2003 (January 17) appears reinforced by the significant contention zone around $2000. The breakdown of this region could pave the way for a move to the December 2023 bottom of $1973 (December 13), ahead of the 200-day SMA of $1963 and the November 2023 low of $1931 (November 13). Further losses may cause the October 2023 bottom of $1810 (October 6) to be retested before the 2023 low of $1804 (February 28) and, eventually, the key $1800 level. In the opposite direction, the weekly high of $2088 (December 28) appears as the first objective before hitting the all-time top of $2150 (4 December 2023).
Resistance levels: $2062 $2078 $2088 (4H chart)
Support levels: $2001 $1973 $1965 (4H chart)
CRUDE WTI
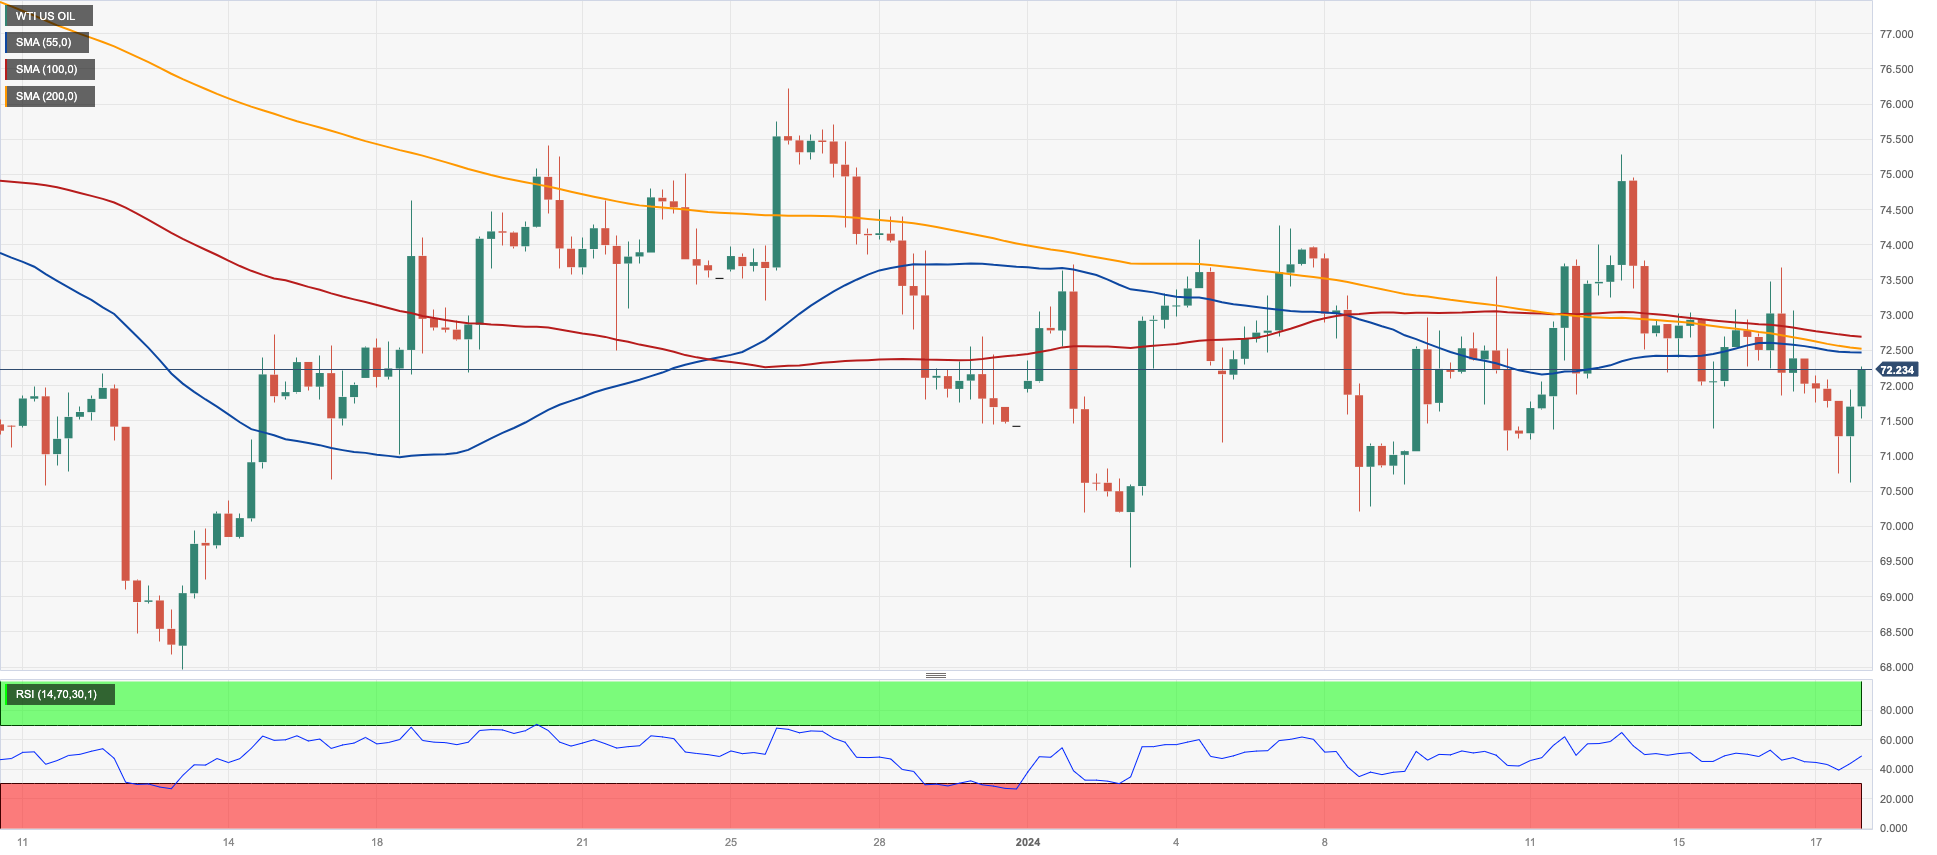
Prices of the American benchmark for sweet light crude oil reversed their so-far bearish performance, managing to bounce off the key support around the $70.00 mark per barrel and retake the $72.00 level and above towards the end of the NA session.
The slight uptick in the commodity came in line with the upbeat assessment of the OPEC report, after the cartel reaffirmed its projection for substantial growth in global oil demand in 2024, maintaining its previous forecast. Additionally, in an unexpected move, OPEC made an early prediction that 2025 will witness a significant and robust rise in oil consumption, primarily driven by China and the Middle East.
Limiting the upside in crude oil prices emerged disheartening prints from the Chinese docket recorded during early trade in combination with the stronger dollar and diminishing bets on interest rate cuts by the Fed in Q2.
Next on the downside for WTI comes the 2024 low of $69.31 (January 3) prior to the December 2023 low of $67.74 (December 13), which comes before the June 2023 low of $66.85 (June 12) and the 2023 low of $63.61. Having said that, the next up-barrier is seen at the weekly peak of $76.14 (December 26, 2023), followed by the significant 200-day SMA at $77.67, the crucial $80.00 barrier, and the November 2023 high of $80.15 (November 3). Further gains from here may take the market back to its weekly top of $89.83 (October 18, 2023), ahead of the 2023 peak of $94.99 (September 28, 2023) and the August 2022 high of $97.65 (August 30), all before reaching the crucial $100.00 barrier.
Resistance levels: $75.21 $76.14 $79.56 (4H chart)
Support levels: $70.10 $69.25 $67.68 (4H chart)
GER40
The persistence of the downward bias in European stocks sponsored the third session in a row of losses in the German reference DAX40 on Wednesday.
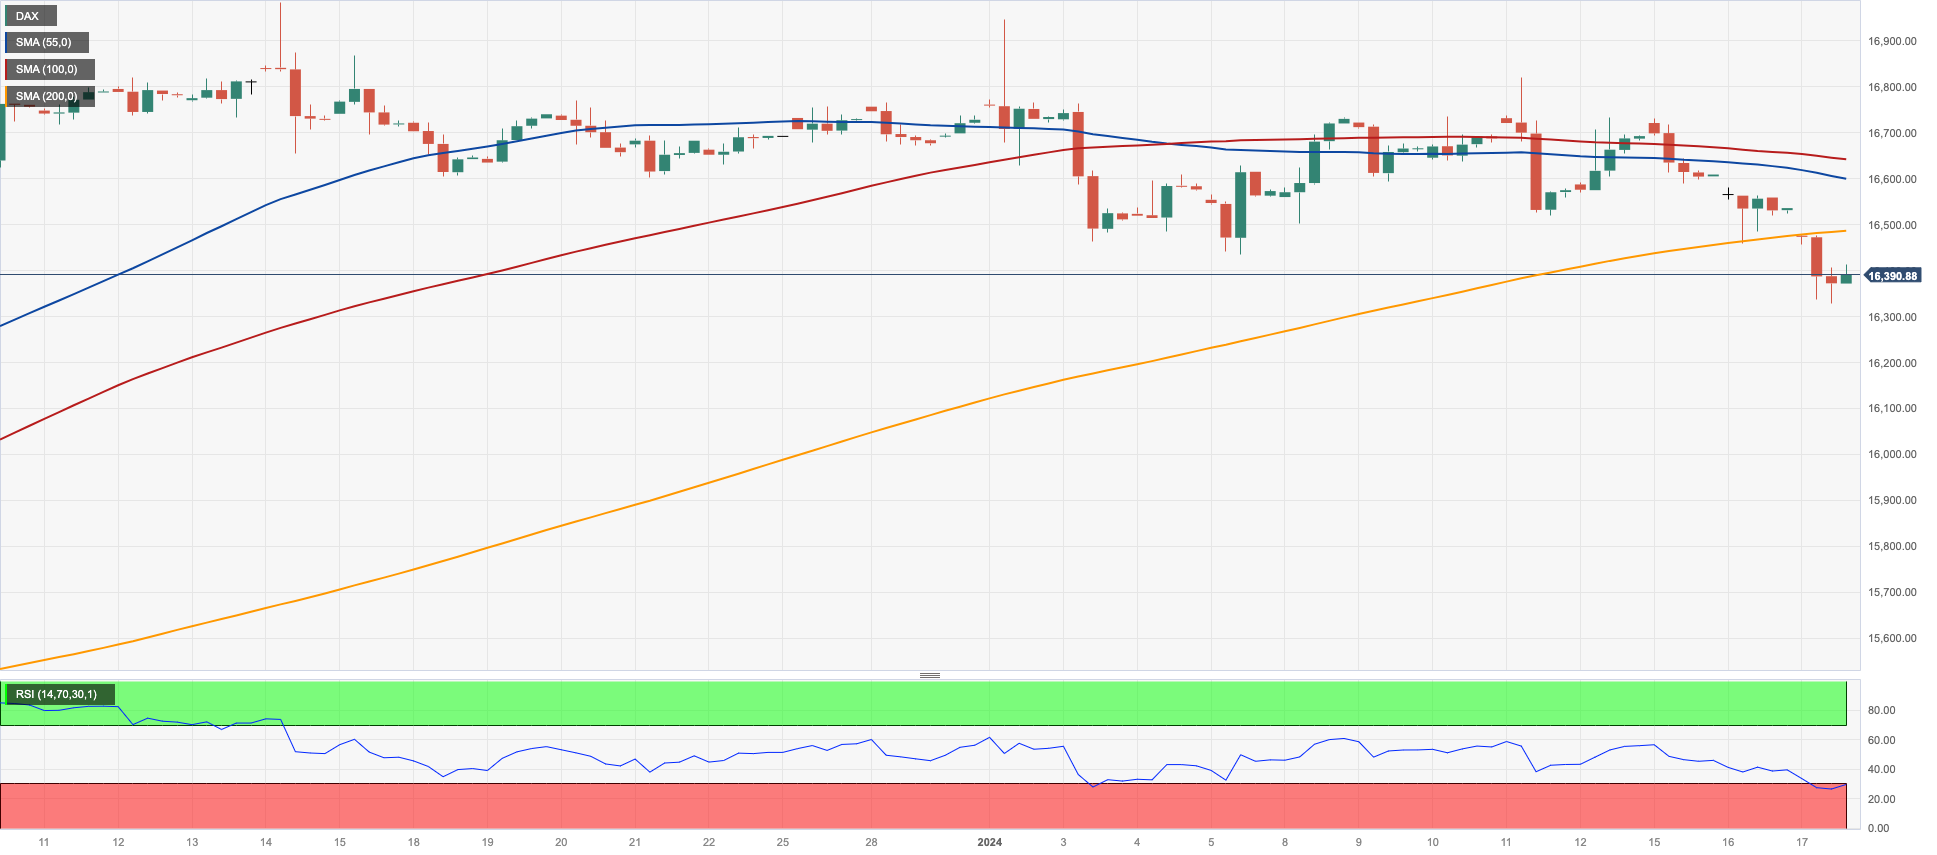
Indeed, the index retreated to seven-week lows around the 16300 zone as investors continued to factor in the likelihood that the ECB might keep its current restrictive stance for longer than anticipated (as per the latest comments by ECB officials, including President Lagarde).
Contributing to the above, market participants also see the BoE refraining from trimming its policy rate for the time being, especially after UK inflation figures rebounded in December.
In addition, disheartening prints from the Chinese calendar maintained the gloomy outlook on the country and its still-absent economic rebound.
The extra pullback in the index came in tandem with fresh six-week tops in German 10-year bund yields, which poked at 2.30% midweek.
Immediately to the downside for the DAX40 is the so-far 2024 low of 16345 (January 17), ahead of the weekly low of 15915 (November 28), which looks to be supported by the critical 200-day SMA of 15887. The October 2023 low of 14630 (October 23) comes next, before the March 2023 low of 14458 (March 20). In contrast, the initial up-barrier aligns with the YTD high of 16963 (January 2) before the all-time top of 17003 (December 14). The everyday RSI dropped below 45.
Best Performers: Munich Re Group, Rheinmetall AG, Commerzbank
Worst Performers: Zalando SE, Adidas, Siemens Energy AG
Resistance levels: 16839 16963 17003 (4H chart)
Support levels: 16345 15960 15915 (4H chart)
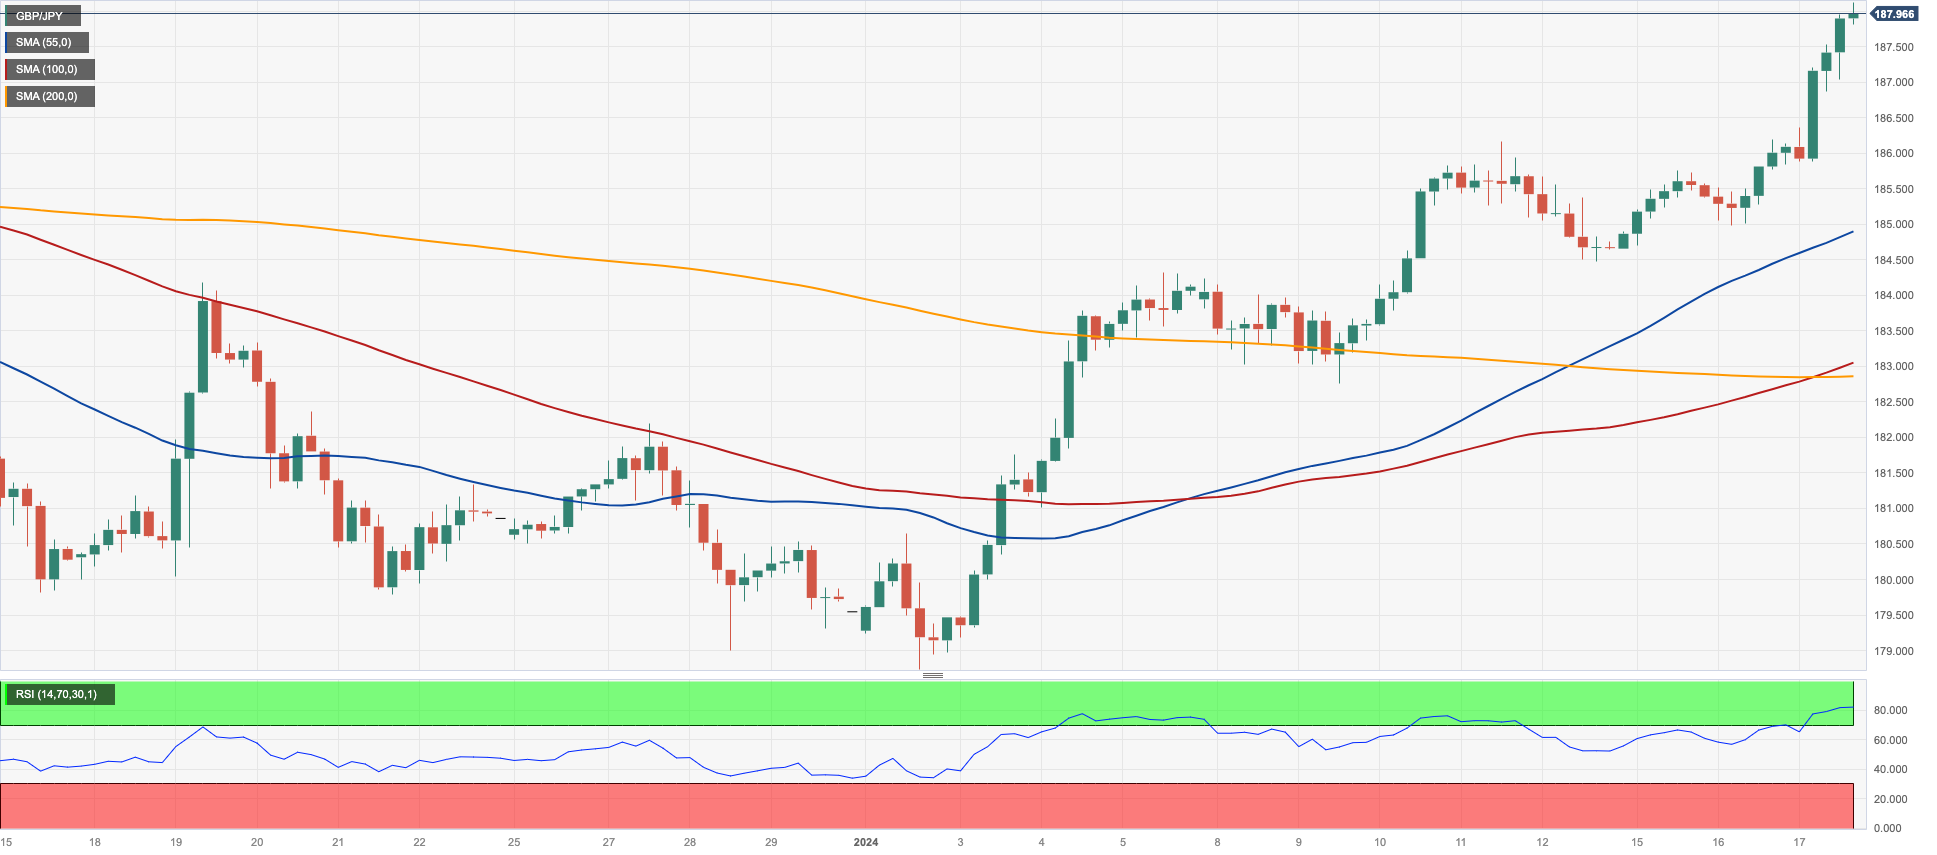
GBPJPY
Further weakness in the Japanese currency in combination with the firm CPI-driven upside bias in the British pound lifted GBP/JPY to a fresh YTD high just past 188.00 the figure on Wednesday.
Indeed, the Japanese yen depreciated further in response to the strong upside momentum in the greenback, while the sterling gathered renewed buying interest after UK inflation figures tracked by the CPI and Core CPI came in above consensus in December.
GBP/JPY printed a new 2024 high at 188.12 (January 17). A move above this level could open the door to a potential test of the 2023 top of 188.65 (November 24) ahead of the November 2015 peak of 188.80 (November 19). Up from here comes the August 2015 high of 195.28 (August 18). The other way around, there is interim contention at the 55-day and 100-day SMAs at 184.28 and 183.58, respectively, ahead of the more relevant 200-day SMA at 180.31. The breach of the latter exposes the December 2023 low of 178.33 (December 14), which comes before the October 2023 low of 178.03 (October 3) and the July 2023 low of 176.30. From here, a further slide to the May 2023 bottom of 167.84 (May 11), ahead of the March 2023 low of 158.26 (March 24), is expected. The daily RSI rose to the vicinity of 67.
Resistance levels: 188.12 188.66 188.81 (4H chart)
Support levels: 184.47 182.75 178.74 (4H chart)
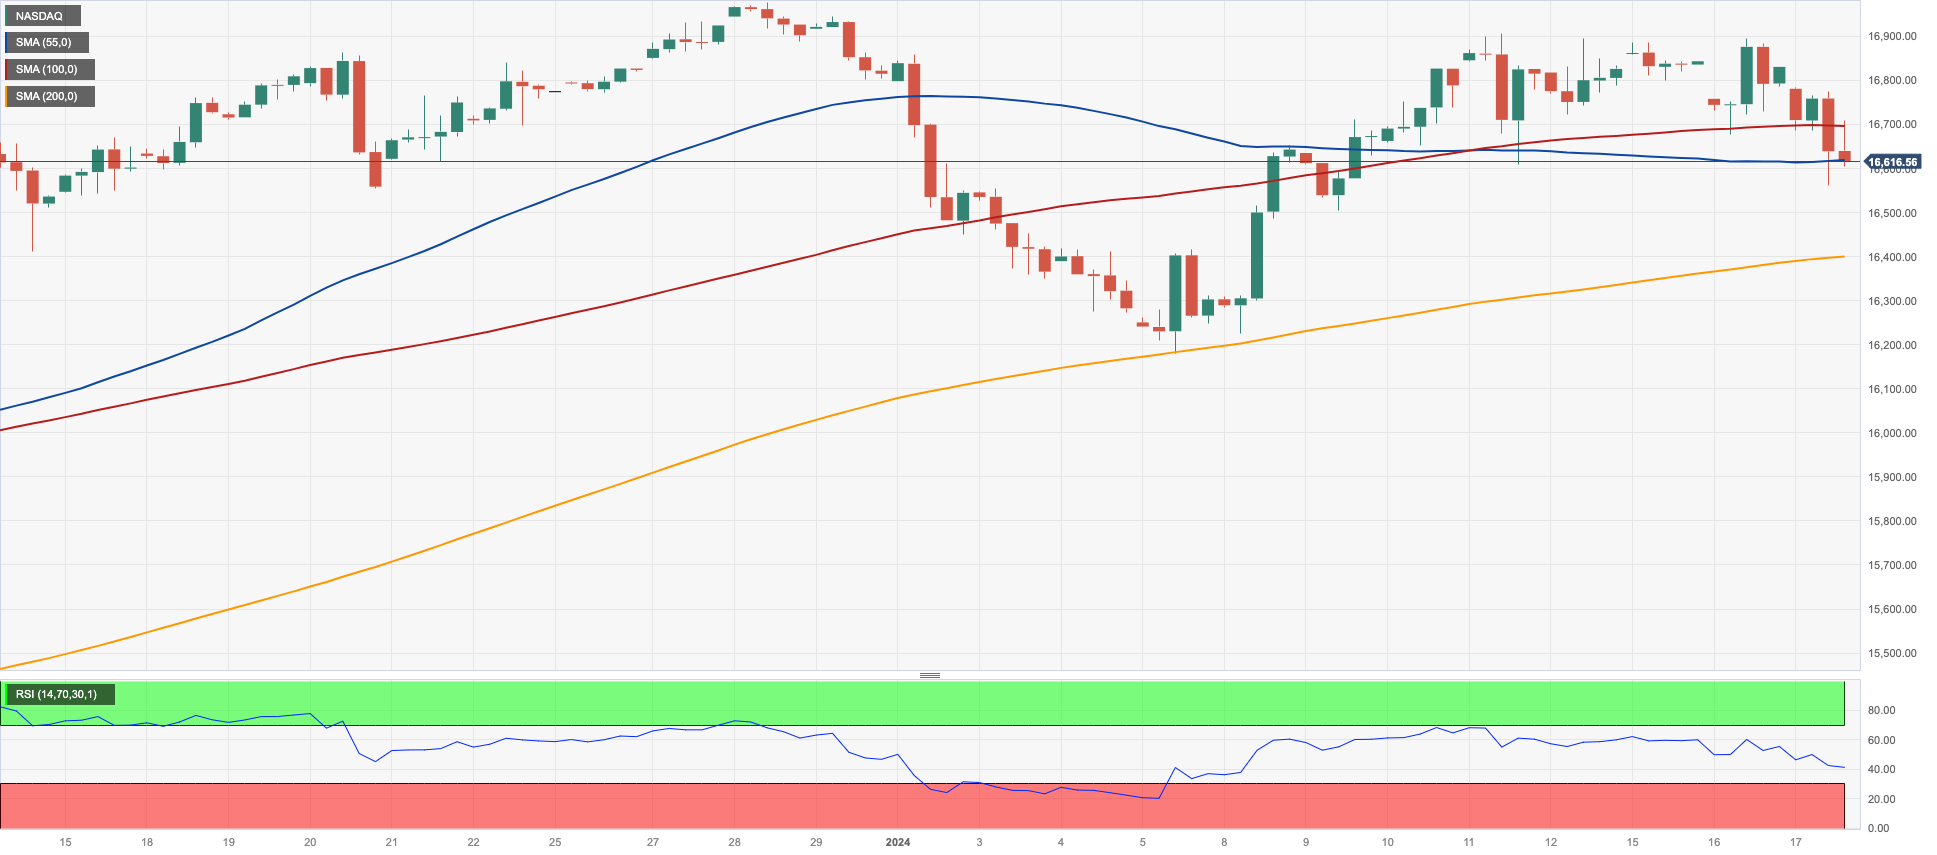
NASDAQ
Tech equities gauged by the benchmark Nasdaq 100 added to the weekly leg lower and dropped for the second session in a row on Wednesday, this time testing multi-day lows near the 16500 zone.
Once again, shrinking bets on a potential rate cut by the Fed in Q2 lend further wings to US yields across the curve and bolster another firm performance of the greenback, all undermining the mood around rate-sensitive stocks and megacaps.
The Nasdaq 100's immediate upward target is the 2024 peak of 16900 (January 12), which precedes the record high of 16969 (December 28 2023). In reverse, the January low of 16249 (January 5) serves as the initial level of support, followed by the December 2023 low of 15695 (December 4) and the critical 200-day SMA of 14966. The loss of this area may cause a move to the October 2023 low of 14058 (October 26), which comes ahead of the April 2023 low of 12724 (April 25), the March 2023 low of 11695 (March 13), and the 2023 low of 10696 (January 3). The RSI for the day dropped to the sub-55 range.
Top Gainers: Datadog, T-Mobile US, Kraft Heinz
Top Losers: CrowdStrike Holdings, Moderna, Zscaler
Resistance levels: 16900 16969 (4H chart)
Support levels: 16561 16249 15695 (4H chart)
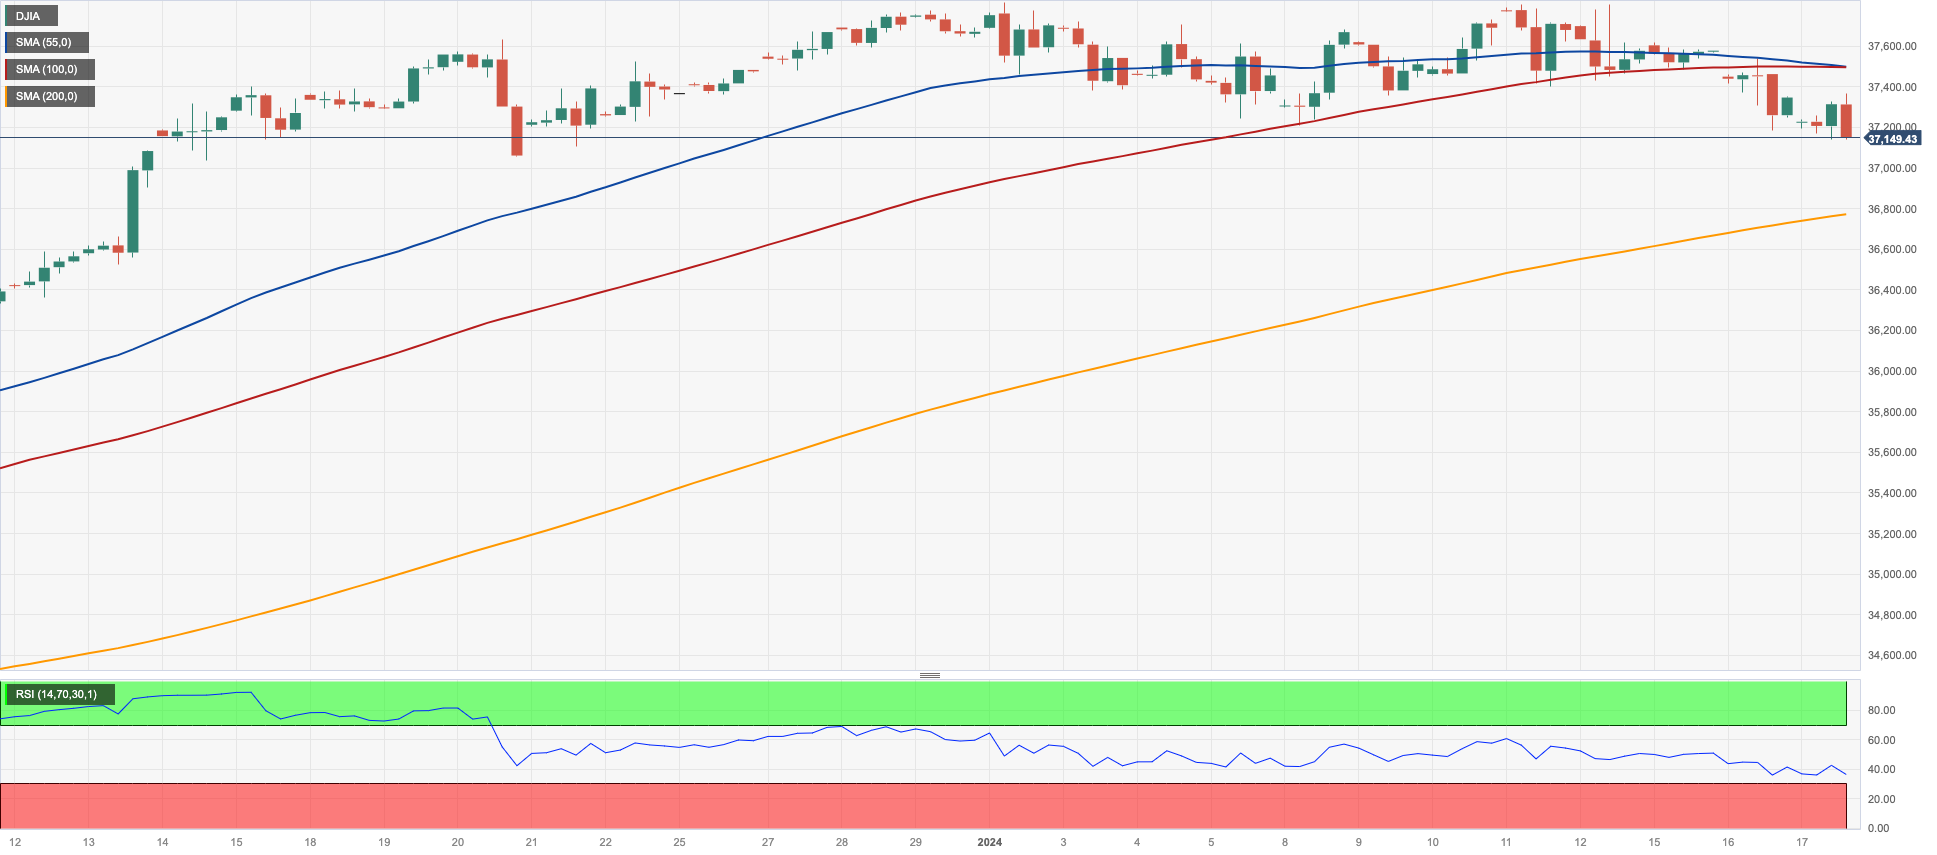
DOW JONES
The corrective decline in US stocks measured by the Dow Jones extended for the third consecutive session on Wednesday. That said, the index clinched a new 2024 low around 37190, an area last visited in mid-December.
Indeed, the selling mood prevailed among market participants against the backdrop of further trimming of the probability that the Fed might cut rates in March, particularly after the strong print from US Retail Sales during December.
Also adding to the sour sentiment, another set of Chinese results from key fundamentals disappointed expectations, keeping the uncertainty around an economic rebound in that country well in place.
Overall, the Dow Jones retreated 0.43% to 37201, the S&P500 dropped 0.92% to 4721, and the tech-centric Nasdaq Composite deflated 1.03% to 14790.
Extra losses may cause the Dow Jones to challenge the 2024 low of 37249 (January 8), which occurs before the weekly low of 37073 (December 20, 2023) and the December 2023 low of 36010. (December 5). Further losses put the 200-day SMA at 34562 in play before the weekly low of 33859 (November 7, 2023), the October 2023 low of 32327 (October 27), and the 2023 low of 31429. (March 15). On the flip hand, if bulls can break above the present monthly consolidation, the Dow will try to retest its all-time high of 37825. (January 12). The daily RSI declined to around 56.
Top Performers: UnitedHealth, Boeing, Travelers
Worst Performers: Caterpillar, Walgreen Boots, Intel
Resistance levels: 37825 (4H chart)
Support levels: 37132 37073 36021 (4H chart)
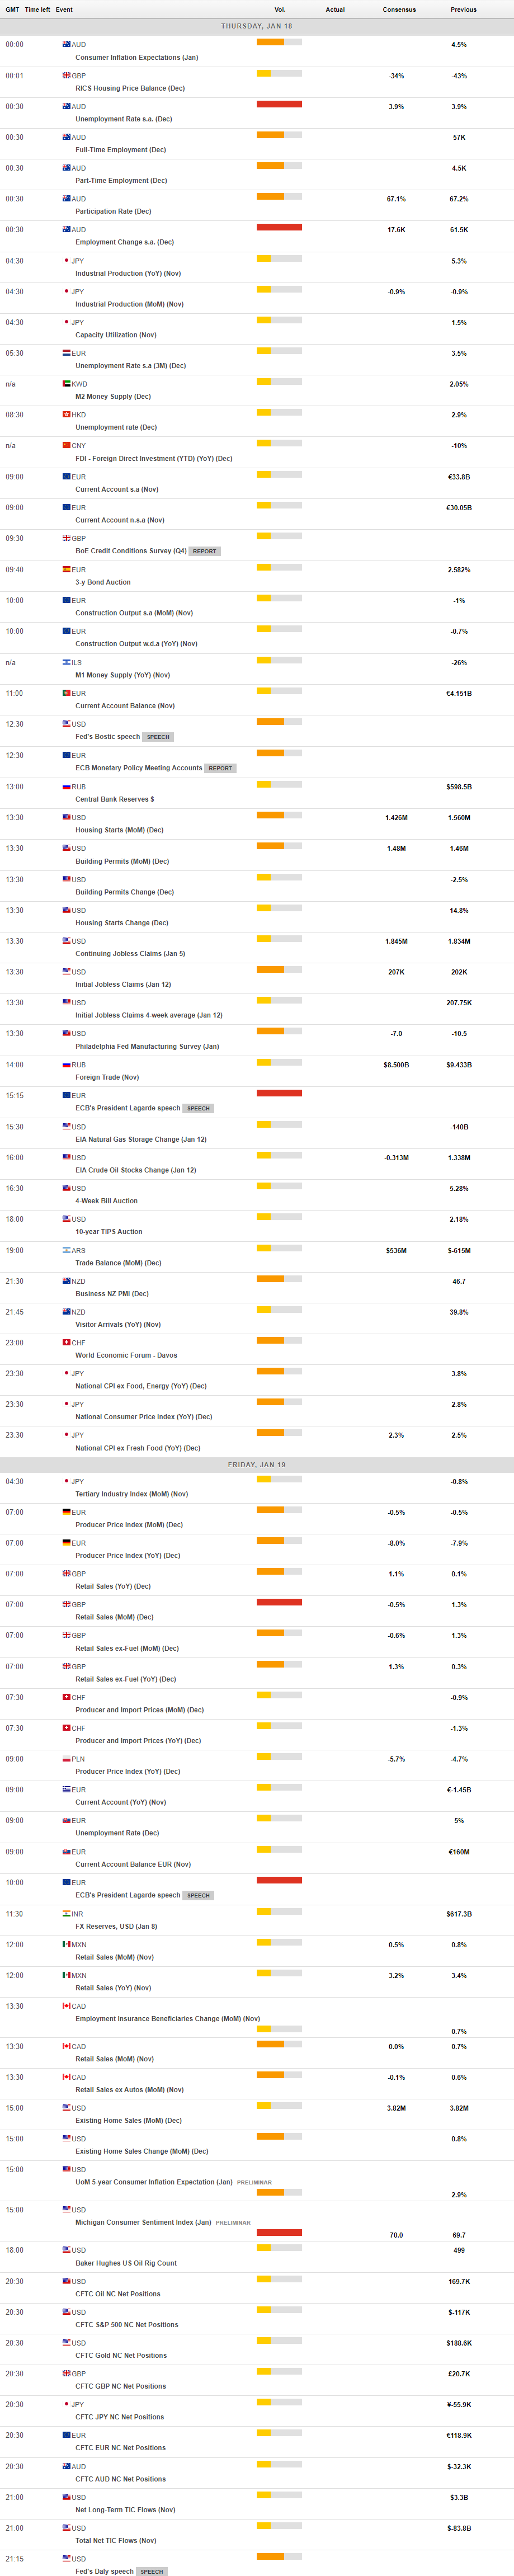
MACROECONOMIC EVENTS
All Information & Updates provided by:

All information relating to the financial markets available on this page has been prepared and issued by FXStreet (Forexstreet SL, Spain, Reg: B62498233) on the basis of publicly available information and all information believed to be reliable and does not conflict with Kuwaiti local laws, and all necessary care has been taken to before the company to ensure that the facts mentioned are correct from the source.
NCM Investment nor any of its directors or employees shall in any way be held responsible for the contents of this news, and the information contained on this page is intended only to provide clients with publicly available information and should not be construed as investment advice, report or analysis and/or constitute an offer or invitation to buy or sell financial instruments of any kind.
RISK WARNING: Forex and CFDs are highly risky leveraged products, as losses can exceed deposits. Please ensure you understand all the risks and take independent advice if necessary. NCM will segregate the clients based on the criteria of the regulator and its bylaws. NCM does not provide any advisory service; the material published does not constitute advice or a recommendation for a transaction in any financial instrument. NCM accepts no responsibility for any use of the content presented and any consequences of that use. Anyone acting on the information provided does so at their own risk.