
- Contact Us:
-

-

-

-


Daily Market Updates
19 Jan 2024
EURUSD
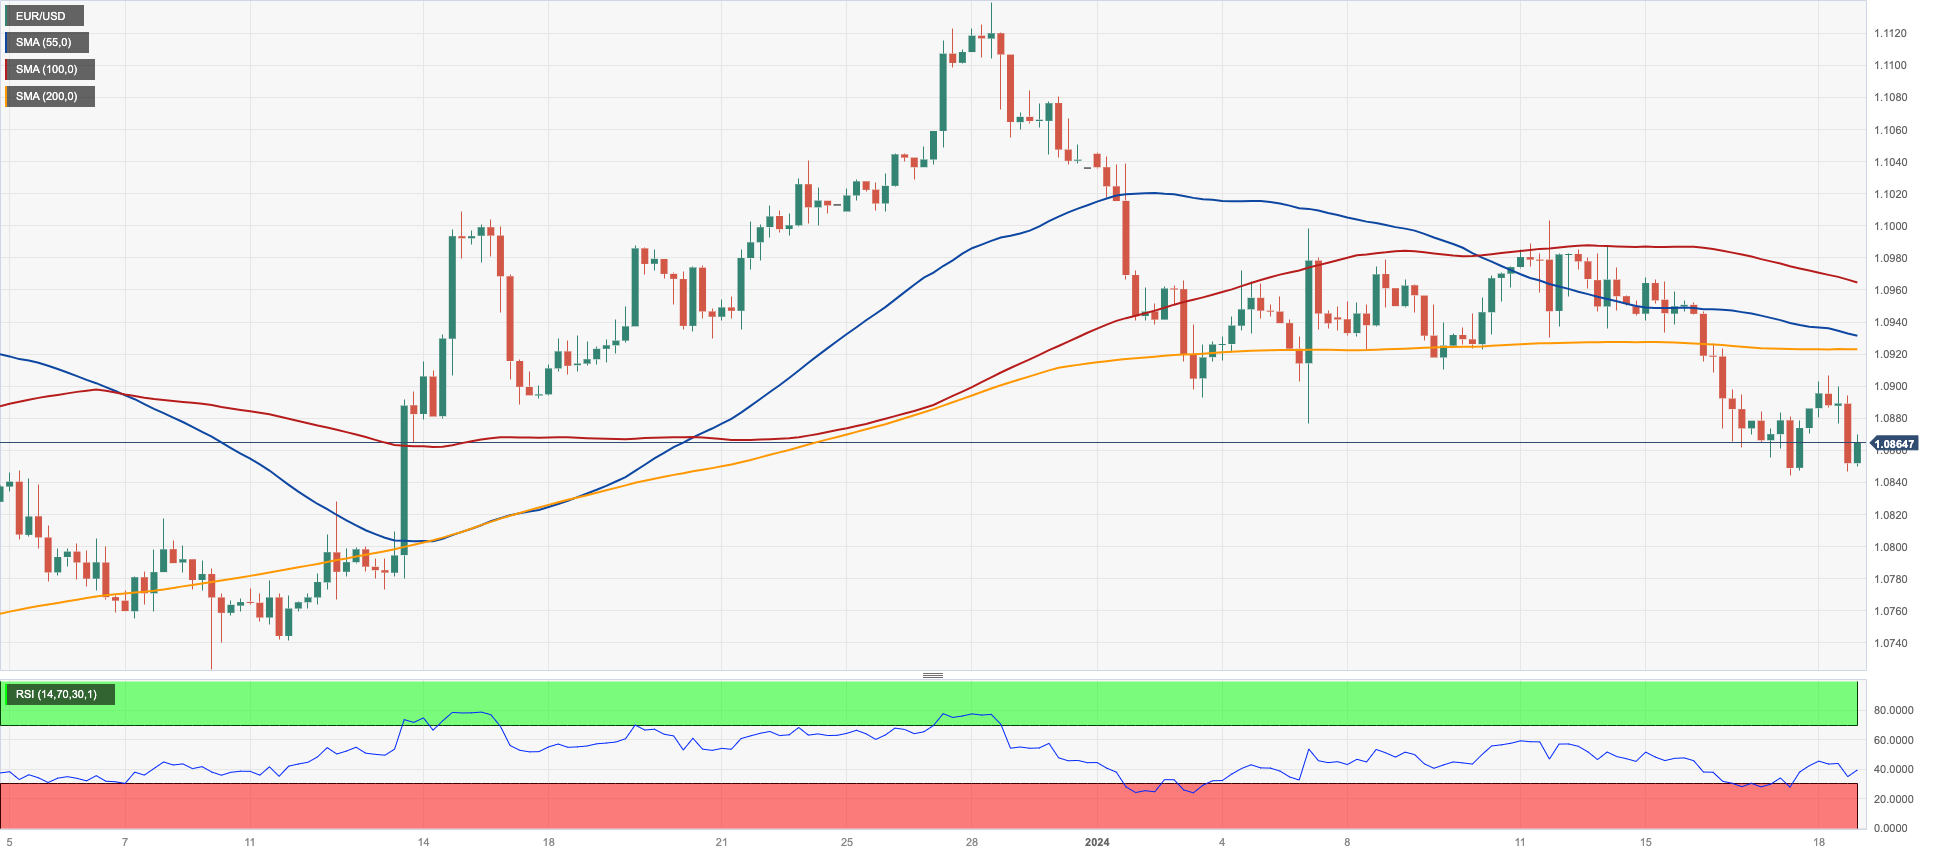
A slight advance in the greenback prompted EUR/USD to quickly leave behind Wednesday’s bullish attempt and shift its focus to the downside once again, although the pair this time managed well to trade just above the key 200-day SMA (1.0845).
In the meantime, the greenback charted humble gains following the inconclusive price action recorded in the previous session, despite having climbed to new yearly peaks near 103.70 when tracked by the USD Index (DXY). Once again, firm readings from US data releases propped up the so-far unabated mood in the buck.
Furthermore, the daily decline in spot came in tandem with some loss of upside momentum in US and German yields, in a context where the tighter-for-longer narrative around the Federal Reserve and the ECB continued to prevail.
Speaking about the ECB, the Accounts of the December gathering suggested that the rate path is in line with reaching the inflation target in the second half of 2025, with a fall in inflation and a sustained wage turnaround. Members are more confident in achieving the 2% inflation target, but caution is needed as inflation may pick up in the near term.
In the US docket, Initial Claims rose by 187K in the week to January 13 and the Philly Fed Manufacturing Index improved to -10.6 for the current month. In addition, the housing sector was in the spotlight after Building Permits expanded by 1.9% in December (1.495M units) and Housing Starts contracted at a monthly 4.3% in the same month (1.46M units).
If sellers break below the 2024 low of 1.0844 (January 17), which coincides with the key 200-day SMA, EUR/USD may continue the downturn to the transitory 100-day SMA of 1.0768 ahead of the December 2023 bottom of 1.0723 (December 8). The loss of this area reveals a deeper retreat to the weekly low of 1.0495 (October 13, 2023), which is followed by the 2023 low of 1.0448 (October 3), and the round level of 1.0400. On the upside, there is initial resistance at the weekly high of 1.0998 (January 5, 11) before the December 2023 top of 1.1139 (December 27), which is also supported by the 200-week SMA at 1.1150 and comes before the 2023 peak of 1.1275 (July 18). The daily RSI fell to the sub-42 zone.
Resistance levels: 1.0906 1.0928 1.0998 (4H chart)
Support levels: 1.0844 1.0723 1.0656 (4H chart)
USDJPY
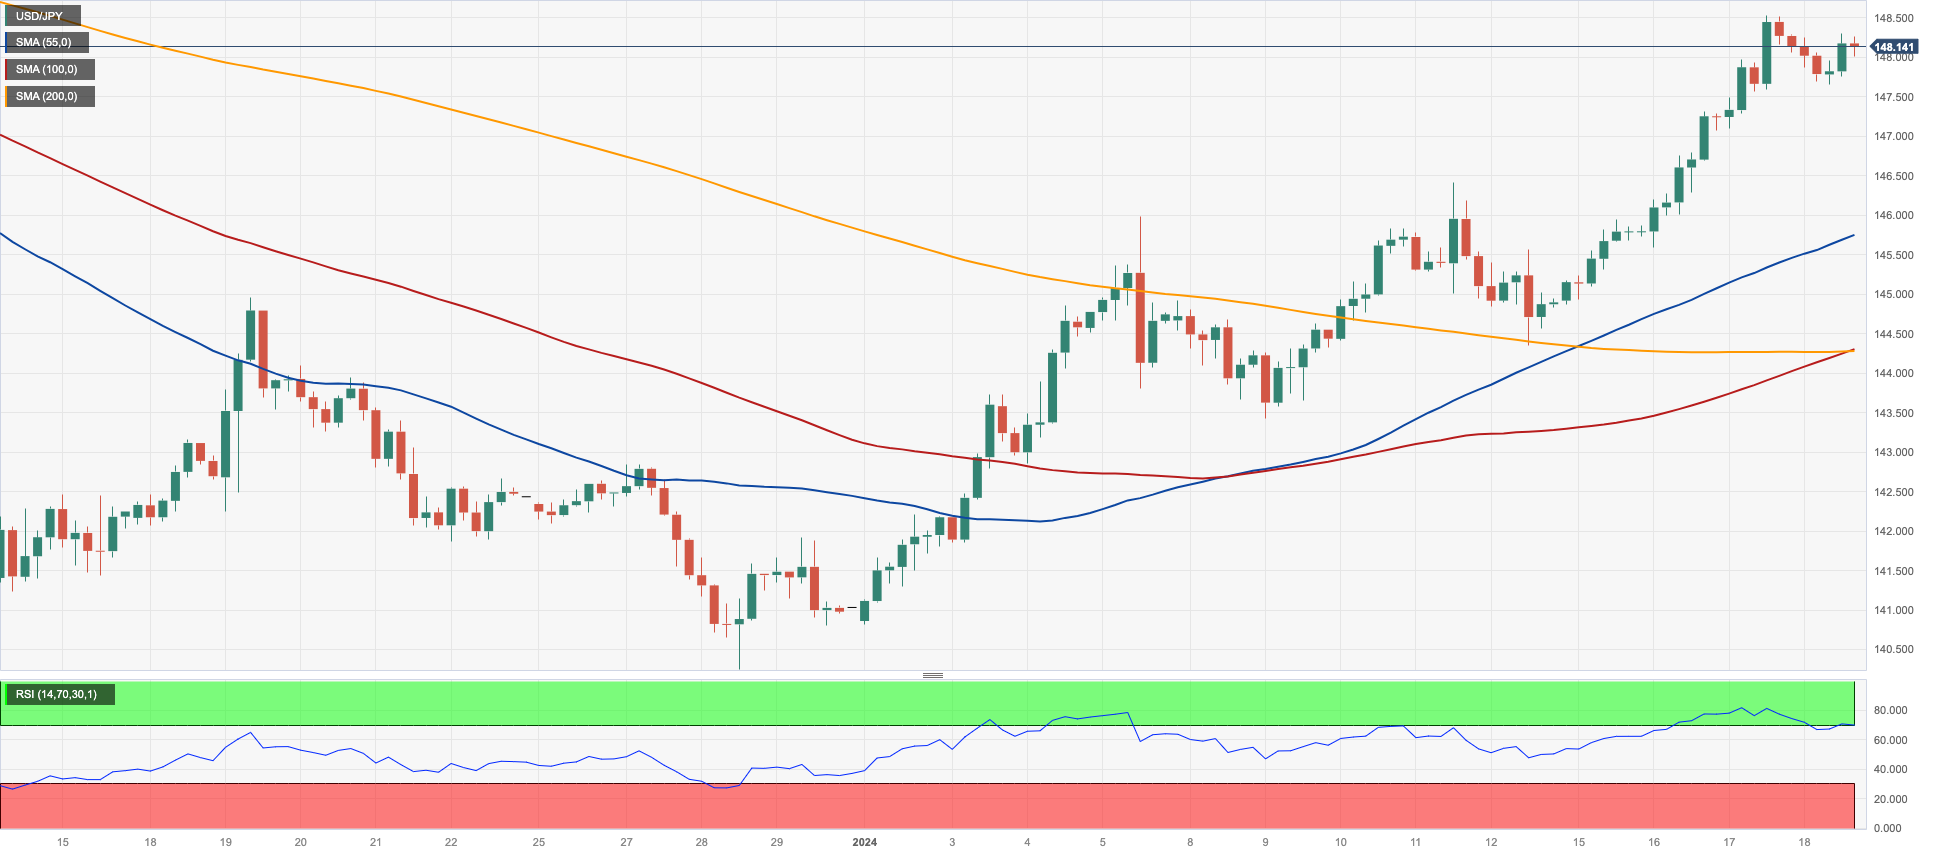
USD/JPY alternated gains with losses just above the 148.00 barrier and a tad below Wednesday’s yearly peaks around 148.50.
Price action in spot came in tandem with the continuation of the yearly recovery in the greenback, although the mixed performance of US yields across the curve seems to have curtailed the pair’s upside potential somewhat vs. a strong bounce in JGB 10-year yields, reaching 0.66% for the first time since mid-December.
In the domestic docket, final Industrial Production contracted by 1.4% in the year to November, while Machinery Orders dropped by 5% over the last twelve months and Foreign Bond Investment rose ¥1642.8B in the week to January 13.
Following a new YTD high at 148.52 (January 17), the next upward goal for USD/JPY is the important level of 150.00, followed by the 2023 top of 151.90 (November 13). Further up, the 2022 peak of 151.94 (October 21) is soon followed by the round number of 152.0. Instead, if the pair falls below the 200-day SMA of 143.84, it might hit the December 2023 low of 140.24 (December 28) before the round milestone of 140.00. The July 2023 low of 137.23 (July 14) appears south of here, while the loss of this region should not see any support of note until the key 130.00 threshold prior to the March 2023 low of 129.63 (March 24). The daily RSI settled slightly above 66.
Resistance levels: 148.52 149.67 151.43 (4H chart)
Support levels: 147.65 144.34 143.42 (4H chart)
GBPUSD
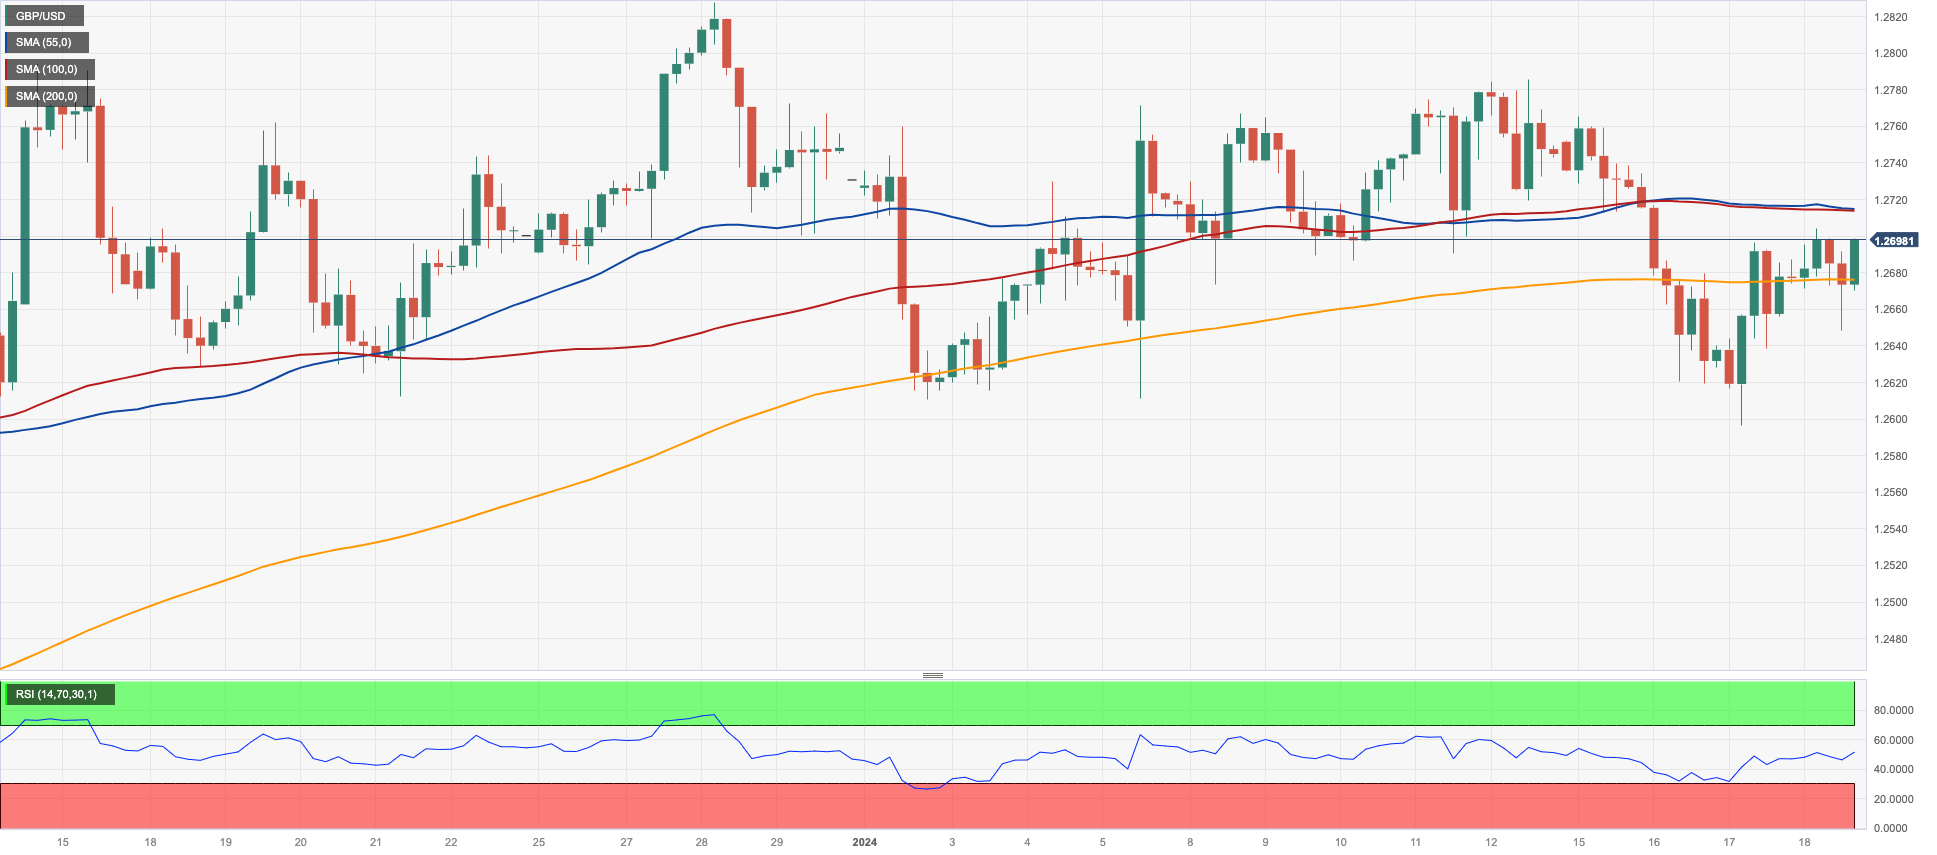
GBP/USD edged higher and surpassed the 1.2700 barrier, extending its rebound from yearly lows just below the 1.2600 support in the previous session.
In fact, Cable rose to two-day highs despite the slight advance in the dollar as investors continued to factor in the likelihood that the BoE could keep its restrictive stance for longer than anticipated, particularly in response to the pick-up in December inflation figures.
The UK docket was empty on Thursday, ahead of the release of key Retail Sales prints on Friday.
If sellers regain the initiative, GBP/USD could very well revisit the so-far 2024 low of 1.2596 (January 17), before the critical 200-day SMA at 1.2546 and the December 2023 bottom of 1.2500 (December 13). Extra weakness may send Cable to the weekly low of 1.2187 (November 10, 2023), ahead of the October 2023 low of 1.2037 (October 3), the critical 1.2000 mark, and the 2023 bottom of 1.1802 (November 10, 2023). On the contrary, an immediate up-barrier arises at the December 2023 top of 1.2827 (December 28), prior to the weekly peak of 1.2995 (July 27, 2023), which is just shy of the important 1.3000 level. The day-to-day RSI rose past 52.
Resistance levels: 1.2703 1.2785 1.2827 (4H chart)
Support levels: 1.2596 1.2500 1.2448 (4H chart)
GOLD
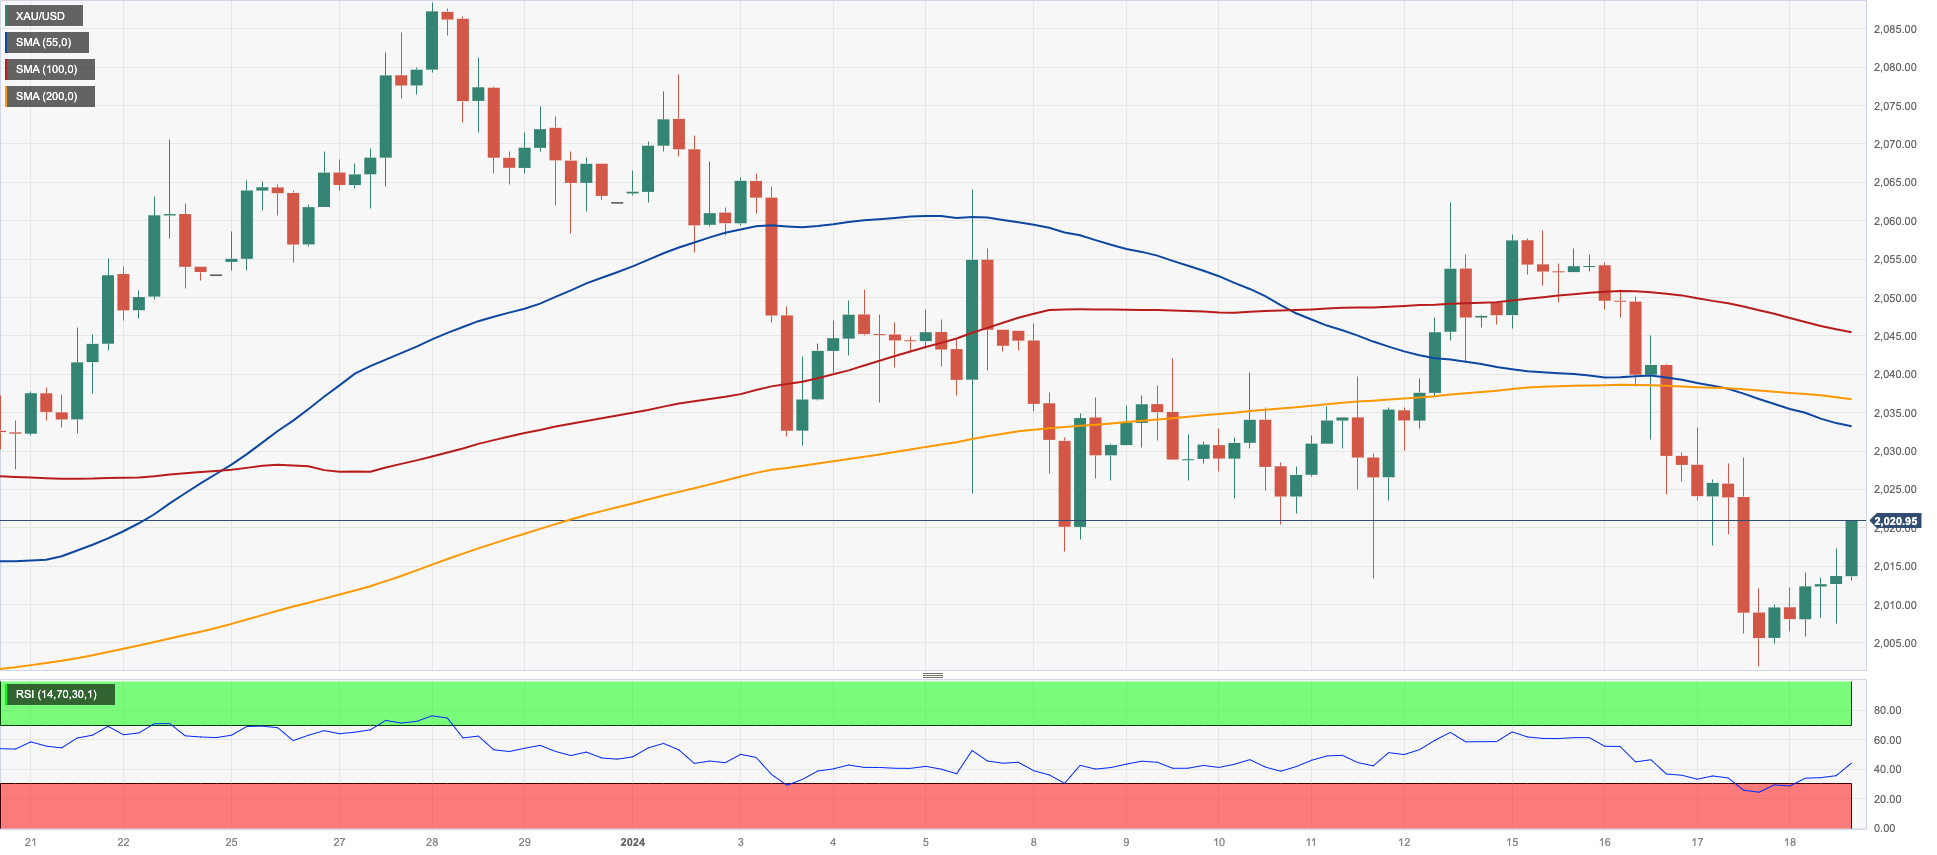
Gold prices ticked higher and left behind two sessions in a row of losses, extending the bounce off Wednesday’s YTD lows near the key $2000 mark per troy ounce to the $2020 zone on Thursday.
Furthermore, the uptick in the yellow metal came despite another decent advance in the greenback, although mixed US yields appear to have bolstered the rebound in the metal.
Also supporting the upbeat tone in the precious metal emerged unabated geopolitical concerns stemming from the Israel-Hamas conflict and the Red Sea crisis.
The 2024 low of $2001 (January 17) looks to be supported by a major conflict zone around $2000. The collapse of this region might pave the way for a move to the December 2023 bottom of $1973 (December 13), ahead of the 200-day SMA of $1963 and the November 2023 low of $1931 (November 13). Further losses may lead the October 2023 bottom of $1810 (October 6) to be retested, followed by the 2023 low of $1804 (February 28) and, finally, the $1800 region. In the other direction, the weekly high of $2088 (December 28) looks to be the first target before reaching the all-time high of $2150. (4 December 2023).
Resistance levels: $2062 $2078 $2088 (4H chart)
Support levels: $2001 $1973 $1965 (4H chart)
CRUDE WTI
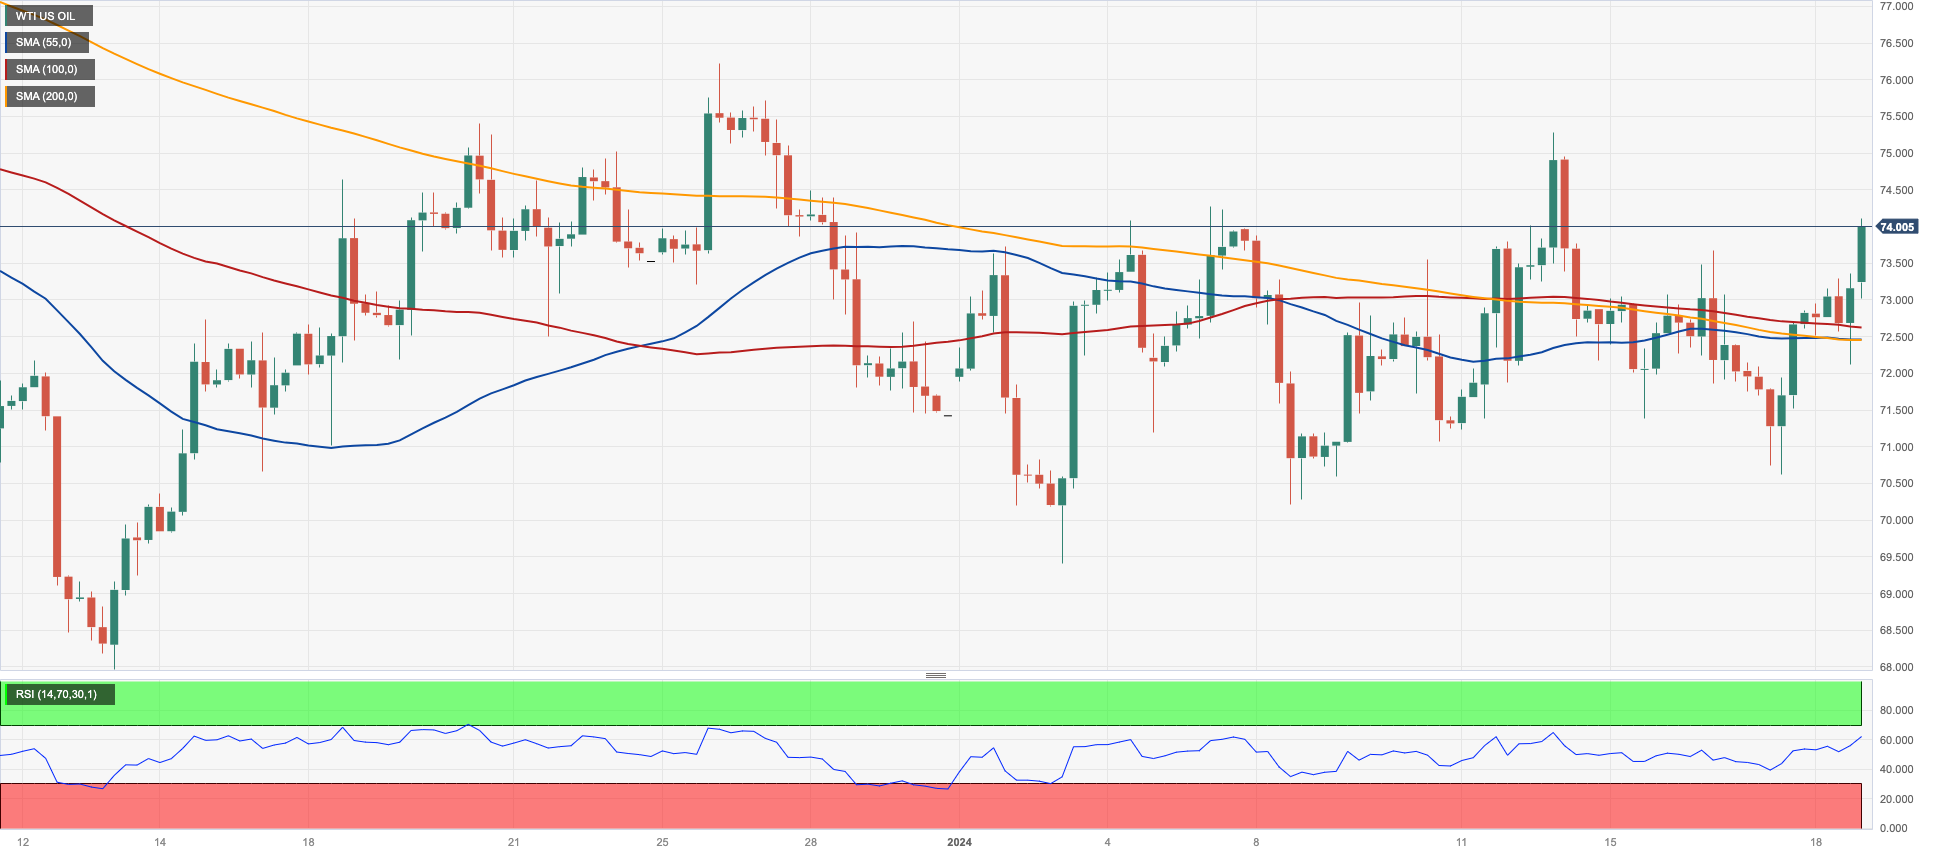
WTI prices rose to weekly highs just past the $74.00 mark per barrel on Thursday, building on gains recorded in the previous session.
Crude oil extended its upside bias following an upbeat report from the IEA, after the agency increased its 2024 demand growth projection by 180 kbpd. The IEA also anticipated that world supply growth in 2024 would surpass demand growth. The IEA suggested that if OPEC+ unwinds cuts, the industry could see a supply surplus in Q2.
In addition, a larger-than-expected drop in US crude oil supplies, as per the EIA’s report, also helped with the upbeat sentiment around the commodity. On this, the EIA reported that US crude oil inventories shrank by 2.492M barrels in the week to January 12, while supplies at Cushing dropped by 2.099M barrels, Weekly Distillate Stocks increased by 2.370M barrels, and gasoline stockpiles went up by 3.083M barrels.
Finally, risks that the ongoing geopolitical effervescence could spread further continued to materialize after Pakistan’s strikes into Iran, which added to the already hot zone in the Middle East and the tankers’ crisis in the Red Sea.
Immediately to the upside for WTI aligns the weekly top of $76.14 (December 26, 2023), followed by the critical 200-day SMA at $77.65, the crucial $80.00 barrier, and the November 2023 peak of $80.15. (November 3). Further advances from here may propel the market back to its weekly high of $89.83 (October 18, 2023), followed by the 2023 top of $94.99 (September 28, 2023) and the August 2022 peak of $97.65 (August 30), all before hitting the critical $100.00 level. Having said that, the next support comes at the 2024 low of $69.31 (January 3), followed by the December 2023 low of $67.74 (December 13), which comes before the June 2023 bottom of $66.85 (June 12) and the 2023 low of $63.61.
Resistance levels: $75.21 $76.14 $79.56 (4H chart)
Support levels: $70.59 $69.25 $67.68 (4H chart)
GER40
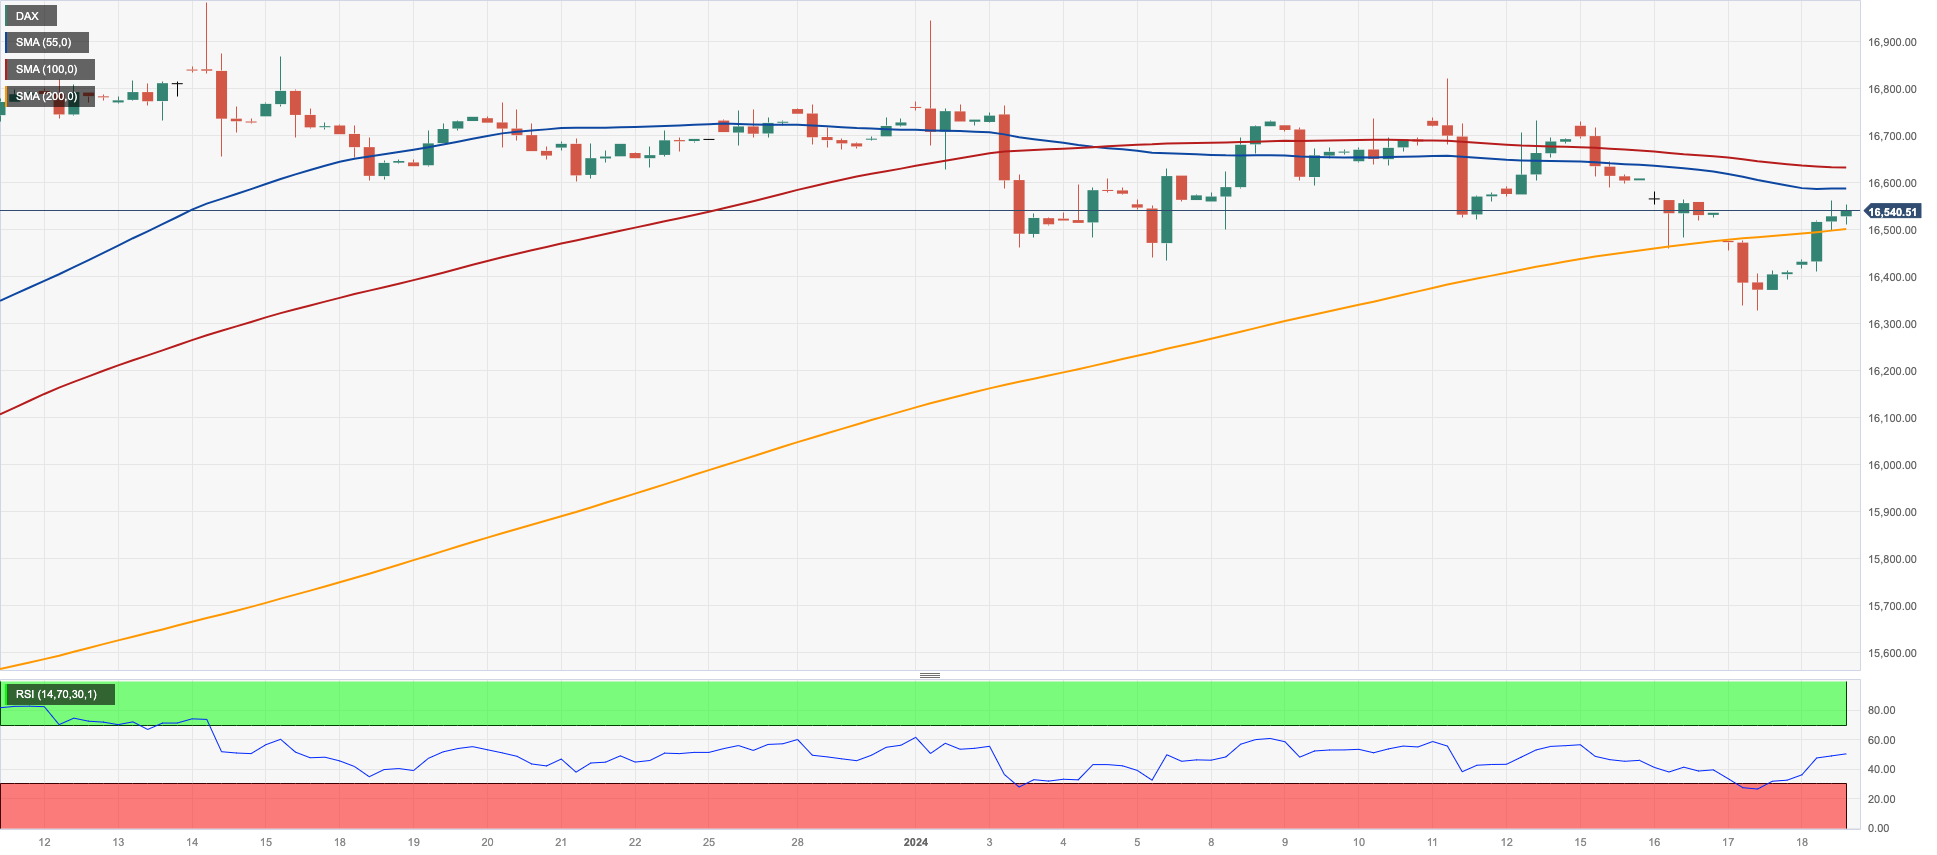
Germany’s stock index, the DAX40, rose markedly on Thursday, leaving behind a three-session negative streak.
Hopes of positive corporate earnings reports in combination with the resurgence of the tighter-for-longer narrative from ECB policymakers—in line with some Fed officials—underpinned the constructive tone in European markets on Thursday.
In addition, another uptick in German 10-year bund yields accompanied the daily rebound in the index.
Immediately to the downside for the DAX40 is the so-far 2024 low of 16345 (January 17), ahead of the weekly low of 15915 (November 28), which appears to be supported by the key 200-day SMA of 15892. The October 2023 low of 14630 (October 23) follows next, before the March 2023 low of 14458 (March 20). Just the opposite, the initial up-barrier correlates with the YTD high of 16963 (January 2) prior to the all-time top of 17003 (December 14). The daily RSI climbed neaer 51.
Best Performers: Infineon, Siemens Energy AG, Rheinmetall AG
Worst Performers: Bayer, E.ON SE, Qiagen
Resistance levels: 16839 16963 17003 (4H chart)
Support levels: 16345 15960 15915 (4H chart)
GBPJPY
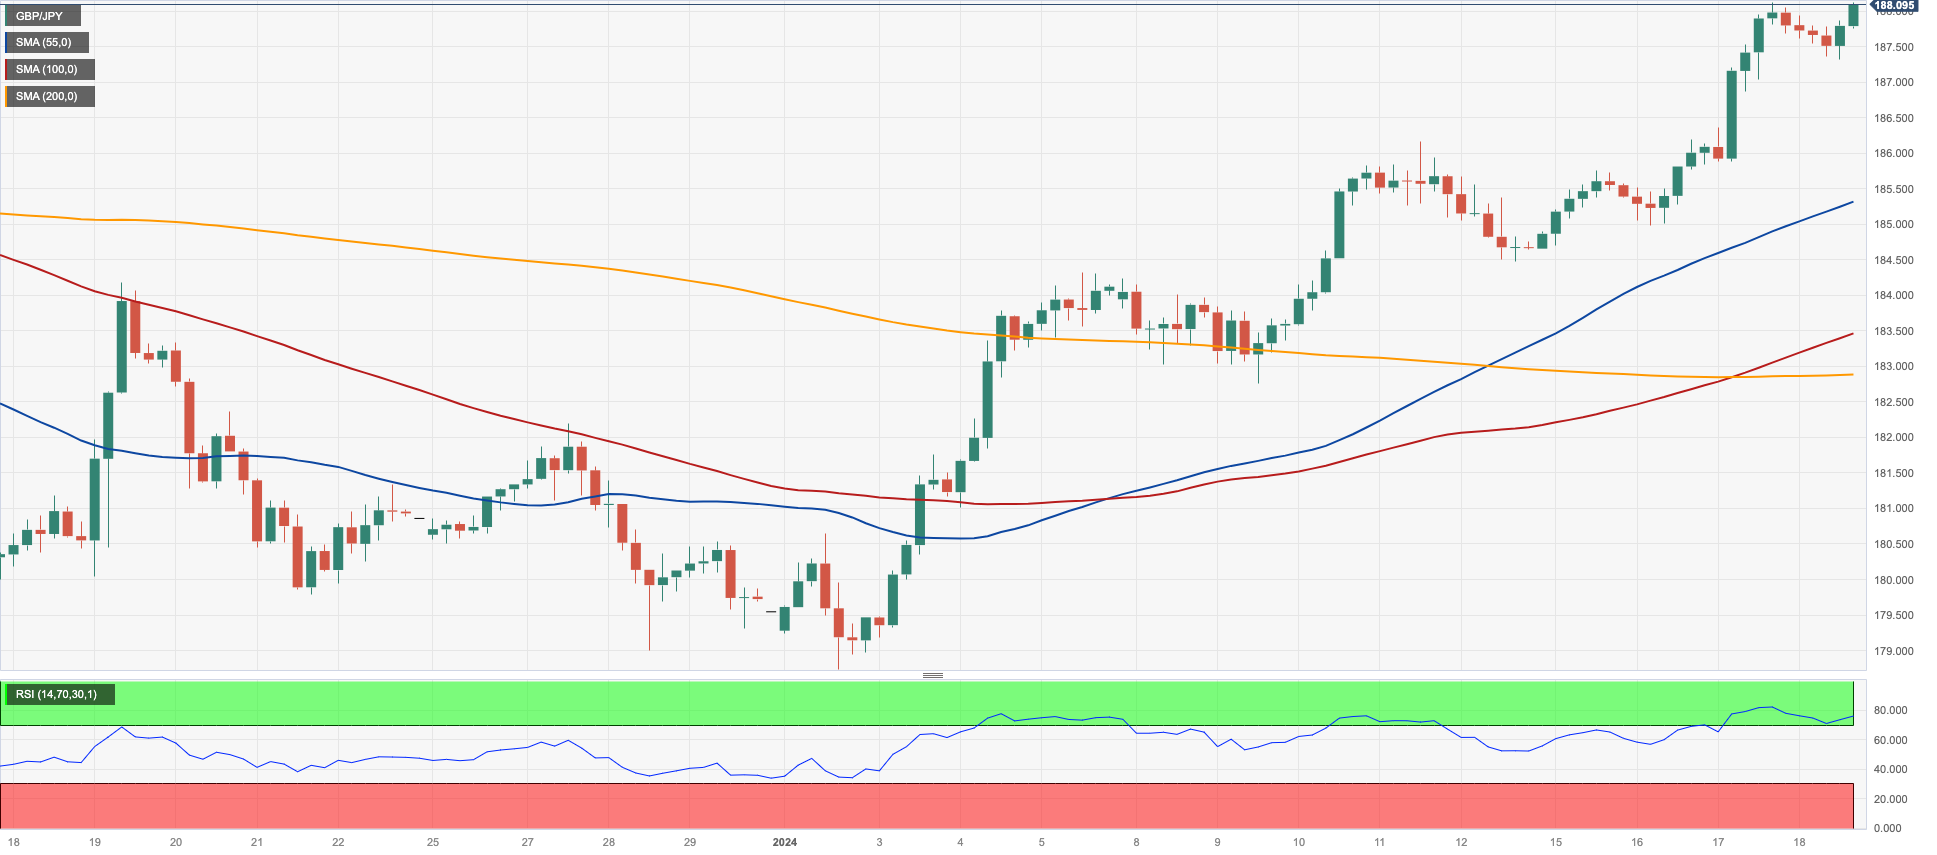
The irresolute price action in the Japanese currency contributed to the decent uptick in GBP/JPY to fresh yearly peaks in the 188.10/15 band on Thursday.
That said, the cross advanced for the third consecutive day, paving the way for a probable visit to the 2023 peak of 188.65 in case the buying pressure persists in the short term.
GBP/JPY reached a new 2024 high of 188.12 (January 17). A rise above this level might open the door for a possible test of the 2023 top of 188.65 (November 24), closely followed by the November 2015 peak of 188.80 (November 19). Up from here comes the August 2015 high of 195.28 (August 18). In the opposite direction, there is temporary support at the 55-day and 100-day SMAs of 184.26 and 183.54, respectively, ahead of the more significant 200-day SMA of 180.34. The breach of the latter reveals the December 2023 low of 178.33 (December 14), which is prior to the October 2023 low of 178.03 (October 3) and the July 2023 low of 176.30. From here, a further drop to the May 2023 low of 167.84 (May 11), ahead of the March 2023 low of 158.26 (March 24), is expected. The daily RSI rose above 67.
Resistance levels: 188.13 188.66 188.81 (4H chart)
Support levels: 184.47 182.75 178.74 (4H chart)
NASDAQ
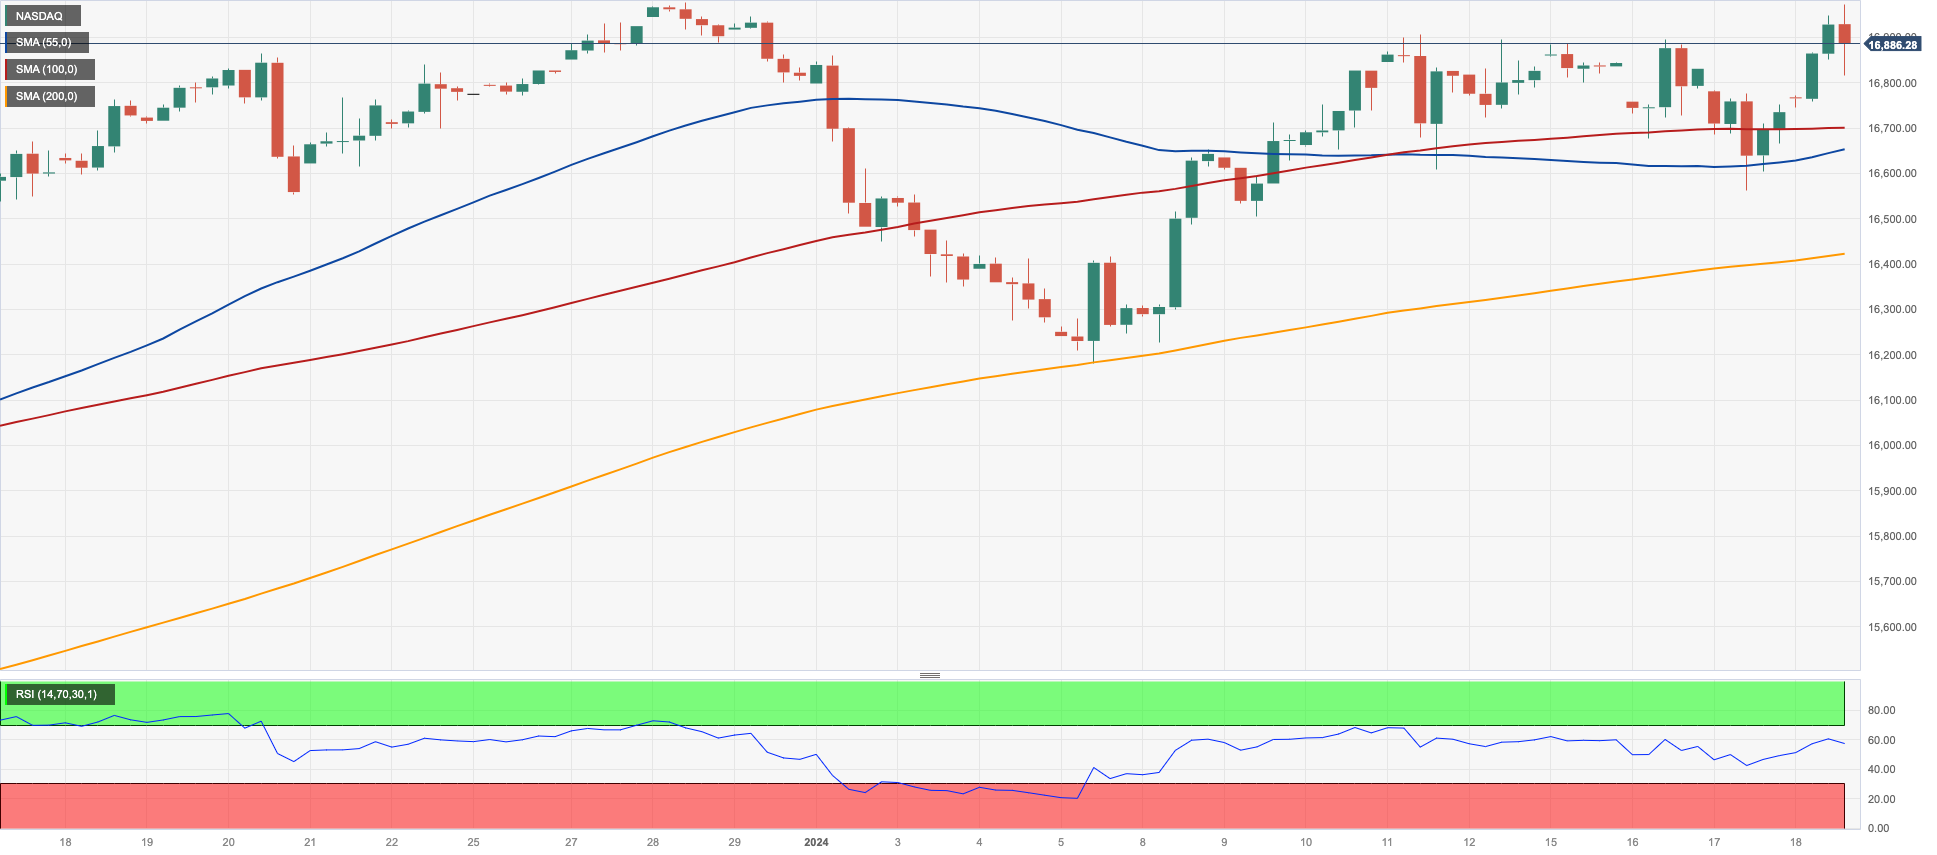
US tech equities regained composure and motivated the benchmark Nasdaq 100 to reverse two consecutive sessions of losses and print marked gains on Thursday, clinching at the same time a new record high around 16970.
In fact, solid performance from megacaps and AI-related stocks boosted the sentiment and drove the index higher, while alternating developments in US yields and mixed results from earnings reports also collaborated with the uptick in the index.
The Nasdaq 100's immediate upward objective is the all-time top of 16970 (January 18). The other way around, the January low of 16249 (January 5) provides the first level of support, followed by the December 2023 low of 15695 (December 4) and the important 200-day SMA of 14985. The breakdown of this region may induce a move towards the October 2023 low of 14058 (October 26), which comes ahead of the April 2023 low of 12724 (April 25), the March 2023 low of 11695 (March 13), and the 2023 low of 10696 (January 3). The RSI for the day leapt past 61.
Top Gainers: Fastenal, Marvell, KLA Corp
Top Losers: MongoDB, Synopsys, Dollar Tree
Resistance levels: 16970 (4H chart)
Support levels: 16561 16249 15695 (4H chart)
DOW JONES
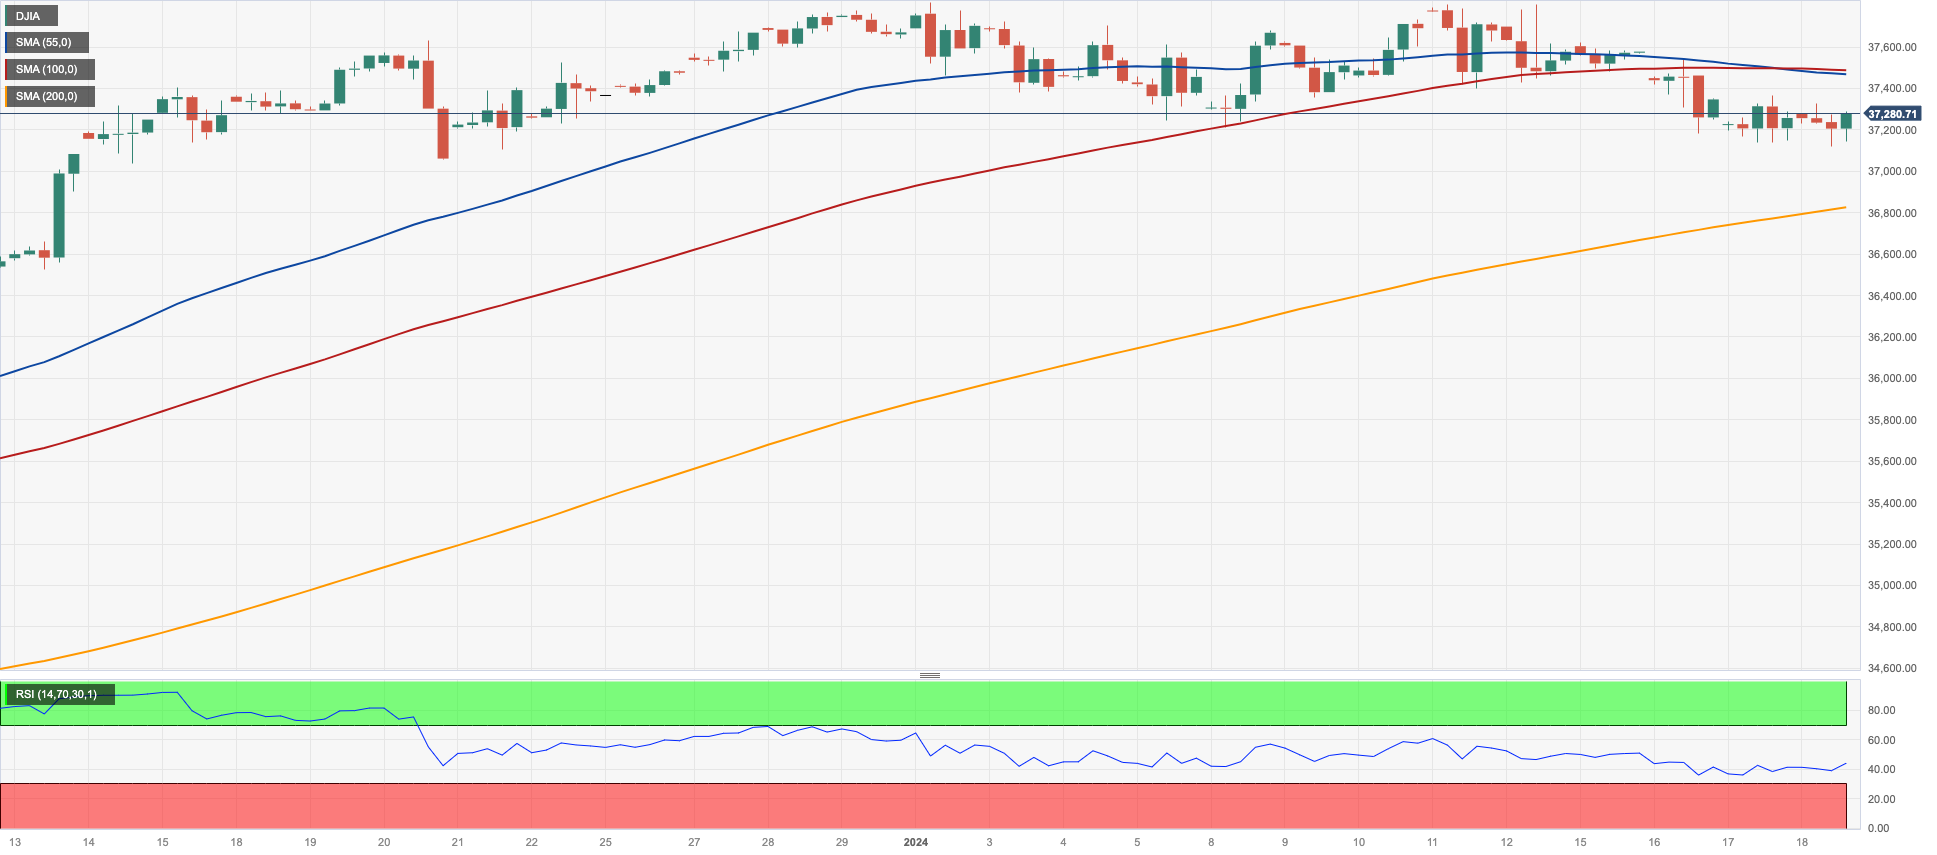
The stocks reference Dow Jones reversed its downward trend and halted a three-day negative move on Thursday, rebounding from a new 2024 low near 37100 to reclaim the area beyond 37300 towards the end of the session.
The daily uptick in the Dow was accompanied by steady prudence ahead of the release of further corporate earnings reports, while shrinking bets on a potential interest rate cut by the Fed in Q2 initially weighed on investors’ sentiment.
On the latter, R. Bostic (Atlanta) mentioned that he is willing to initiate rate cuts before July if there is "convincing" evidence that inflation is slowing more rapidly than he expects. However, he reiterated that the baseline is for rate reductions to commence in Q3, emphasizing the need for caution to avoid cutting too early and risking renewed demand and price pressures. He suggested that, given the uncertainty, it would be unwise for the Fed to "lock in" any approach at this point.
All in all, the Dow Jones rose 0.11% to 37307, the S&P500 gained 0.06% to 4742, and the tech-focused Nasdaq Composite advanced 0.47% to 14917.
Extra losses might push the Dow Jones to approach the 2024 bottom of 37122 (January 18), which comes before the weekly low of 37073 (December 20, 2023) and the December 2023 low of 36010 (December 5). Further losses put the 200-day SMA at 34604 in play, ahead of the weekly low of 33859 (November 7, 2023), the October 2023 low of 32327 (October 27), and the 2023 low of 31429 (March 15). On the other side, if bulls can break above the current monthly consolidation, the Dow may attempt to retest its all-time high of 37825 (January 12). The daily RSI bounced to 55.
Top Performers: Boeing, Apple, Walt Disney
Worst Performers: UnitedHealth, Walgreen Boots, American Express
Resistance levels: 37825 (4H chart)
Support levels: 37122 37073 36021 (4H chart)
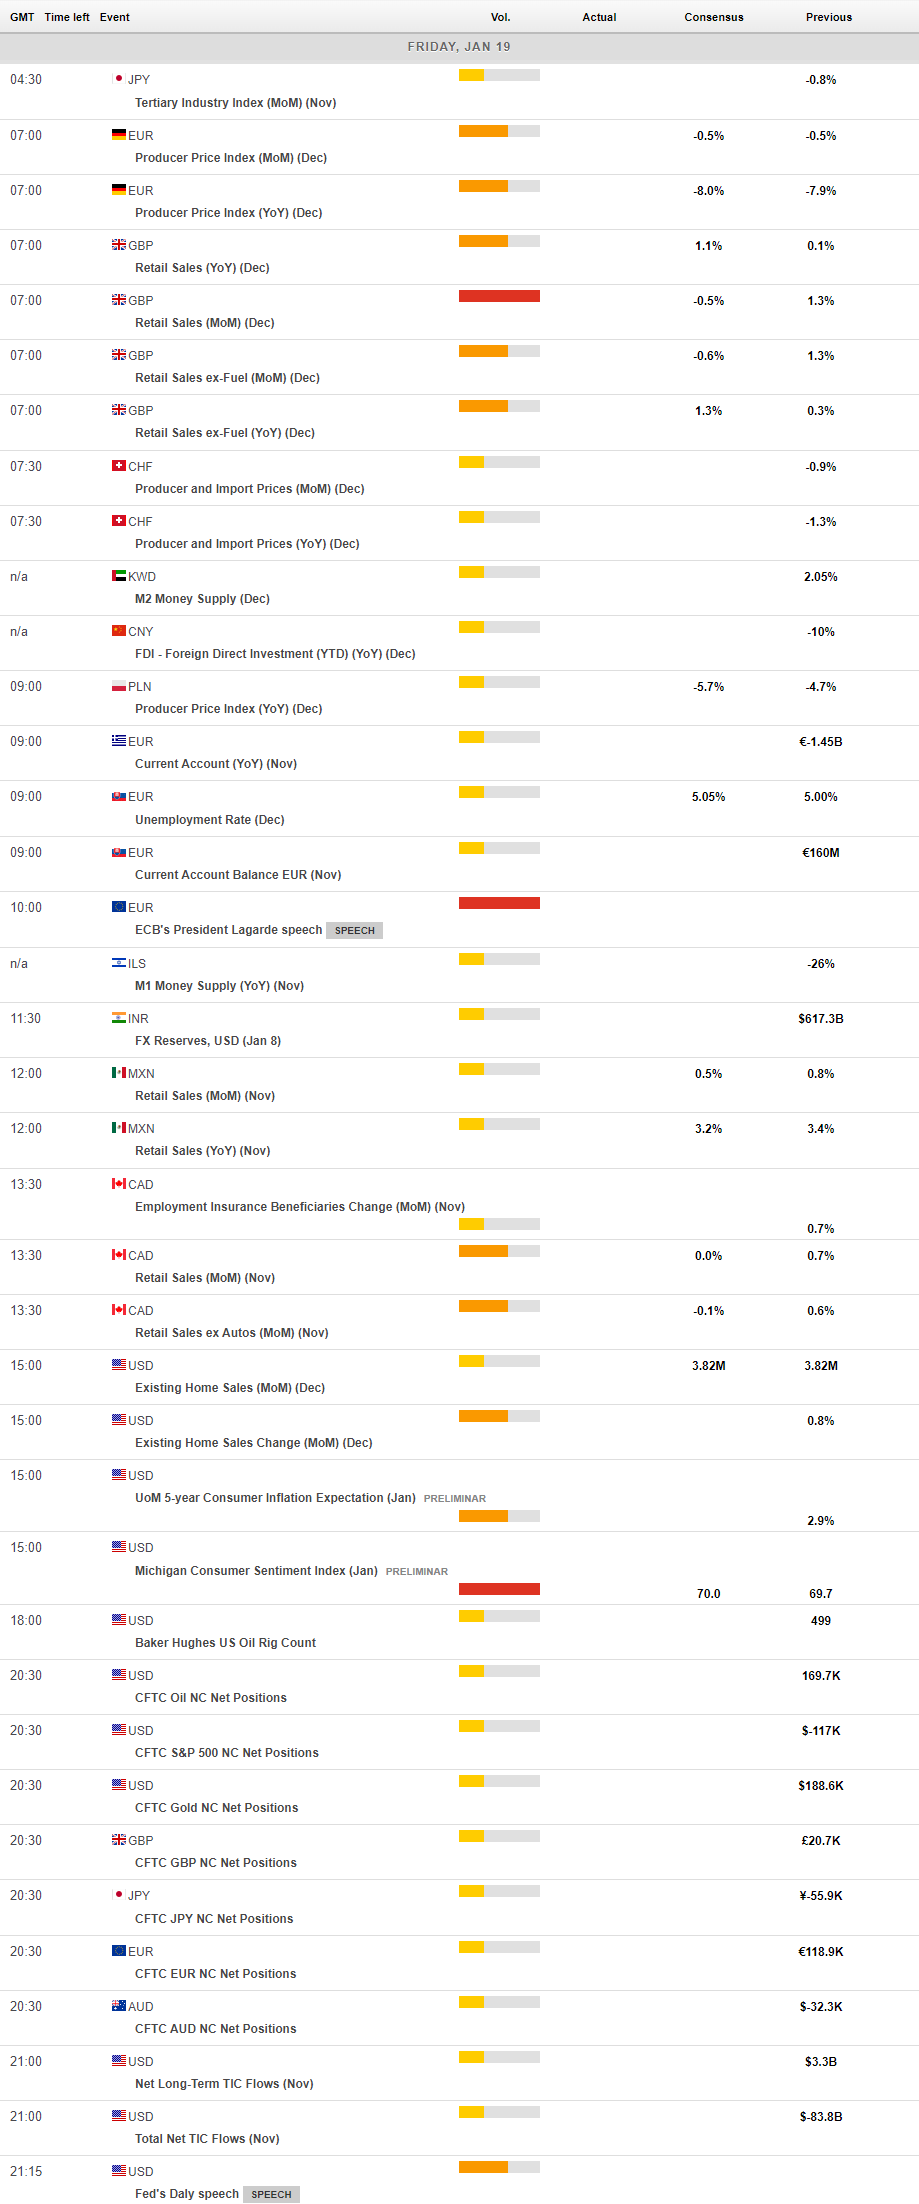
MACROECONOMIC EVENTS
All Information & Updates provided by:

All information relating to the financial markets available on this page has been prepared and issued by FXStreet (Forexstreet SL, Spain, Reg: B62498233) on the basis of publicly available information and all information believed to be reliable and does not conflict with Kuwaiti local laws, and all necessary care has been taken to before the company to ensure that the facts mentioned are correct from the source.
NCM Investment nor any of its directors or employees shall in any way be held responsible for the contents of this news, and the information contained on this page is intended only to provide clients with publicly available information and should not be construed as investment advice, report or analysis and/or constitute an offer or invitation to buy or sell financial instruments of any kind.
RISK WARNING: Forex and CFDs are highly risky leveraged products, as losses can exceed deposits. Please ensure you understand all the risks and take independent advice if necessary. NCM will segregate the clients based on the criteria of the regulator and its bylaws. NCM does not provide any advisory service; the material published does not constitute advice or a recommendation for a transaction in any financial instrument. NCM accepts no responsibility for any use of the content presented and any consequences of that use. Anyone acting on the information provided does so at their own risk.