
- Contact Us:
-

-

-

-


Daily Market Updates
22 Jan 2024
EURUSD
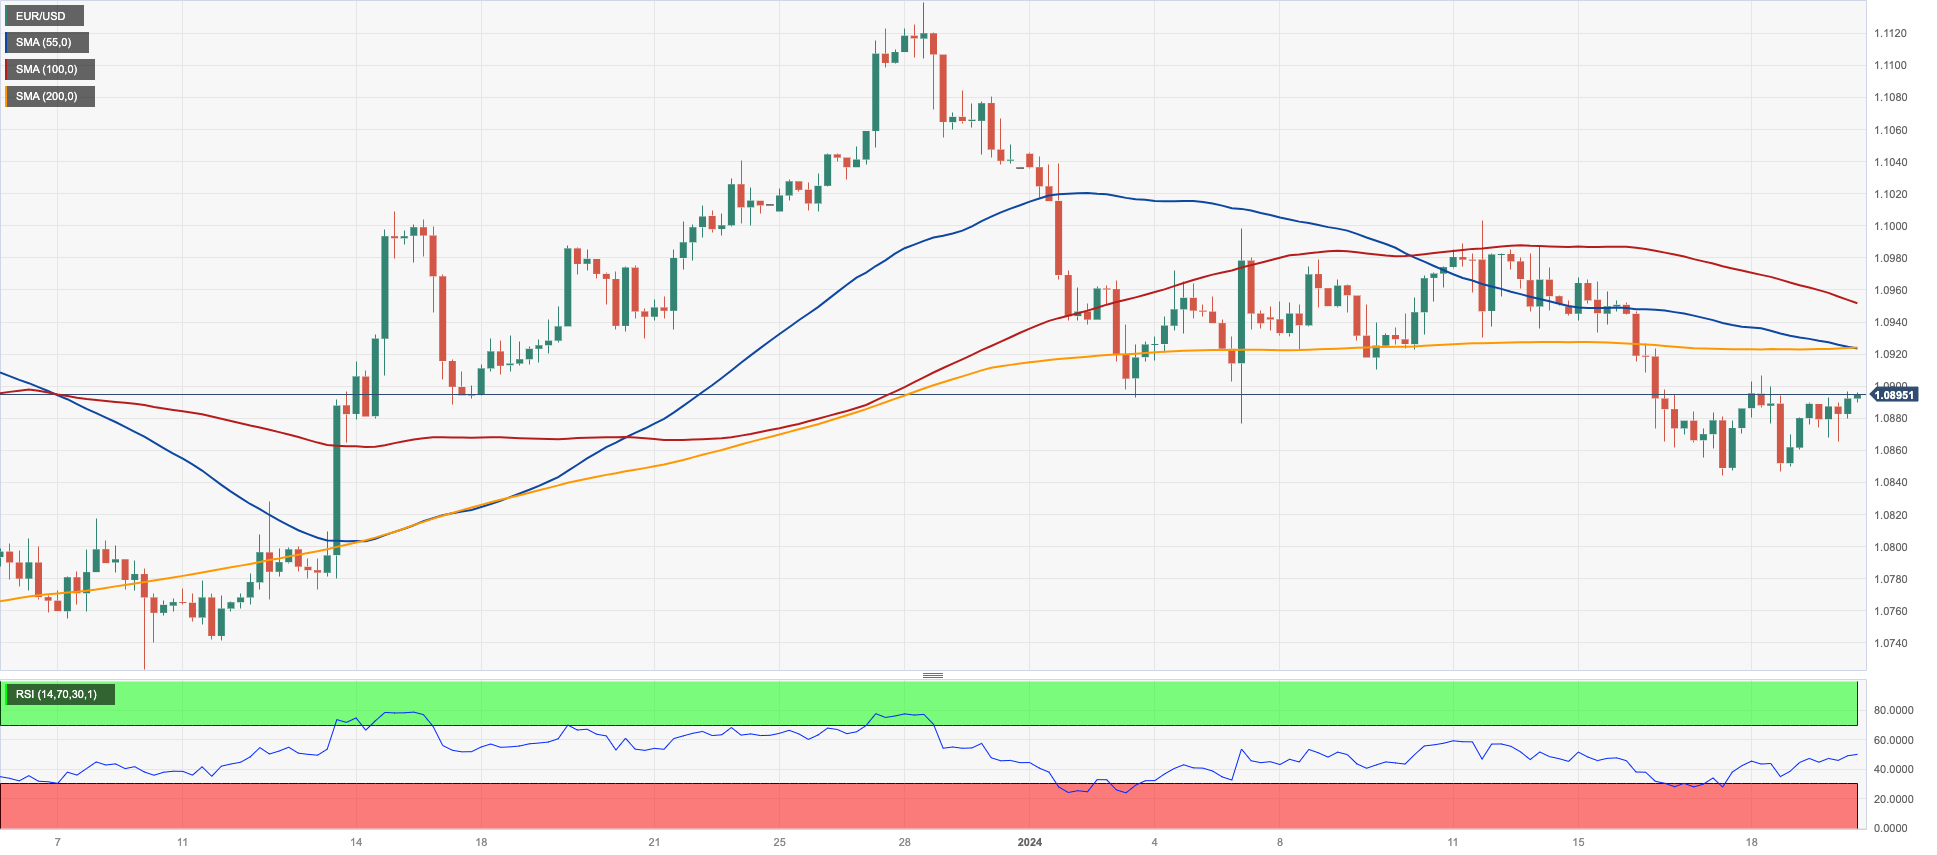
Despite the decent advance to the boundaries of 1.0900 the figure on Friday, EUR/USD ended the week well in the negative territory. Spot, at least, managed to bounce off five-week lows near 1.0840 (January 17–18) and leave behind part of the strong bearish tone seen in the first half of the week.
On the USD side of the equation, the greenback closed its third consecutive week of gains, propelling the USD Index (DXY) well beyond the 103.00 barrier and always accompanied by the equally robust bounce in US yields across different timeframes throughout the week.
The continuation of the strength in the buck came along with further investors' repricing of a potential interest rate cut by the Federal Reserve, which is now seen trimming its FFTR in May (from March).
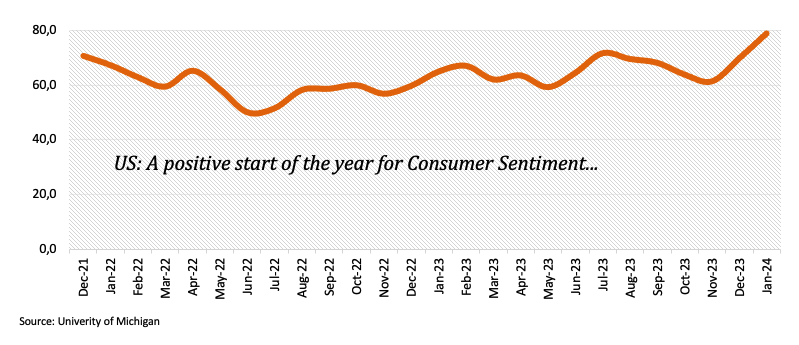
Data-wise, in the US, the preliminary Michigan Consumer Sentiment came in at 78.8 in January (from 69.7).
If sellers break below the 2024 low of 1.0844 (January 17), which corresponds with the crucial 200-day SMA, EUR/USD may continue to fall to the transitory 100-day SMA of 1.0769, ahead of the December 2023 bottom of 1.0723 (December 8). The loss of this region indicates a steeper decline to the weekly low of 1.0495 (October 13, 2023), followed by the 2023 low of 1.0448 (October 3) and the round level of 1.0400. On the upside, there is initial resistance at the weekly high of 1.0998 (January 5, 11) before reaching the December 2023 top of 1.1139 (December 27), which is also supported by the 200-week SMA at 1.1150 and comes before the 2023 peak of 1.1275 (July 18). The daily RSI rebounded past 45.
Resistance levels: 1.0906 1.0954 1.0998 (4H chart)
Support levels: 1.0844 1.0723 1.0656 (4H chart)
USDJPY
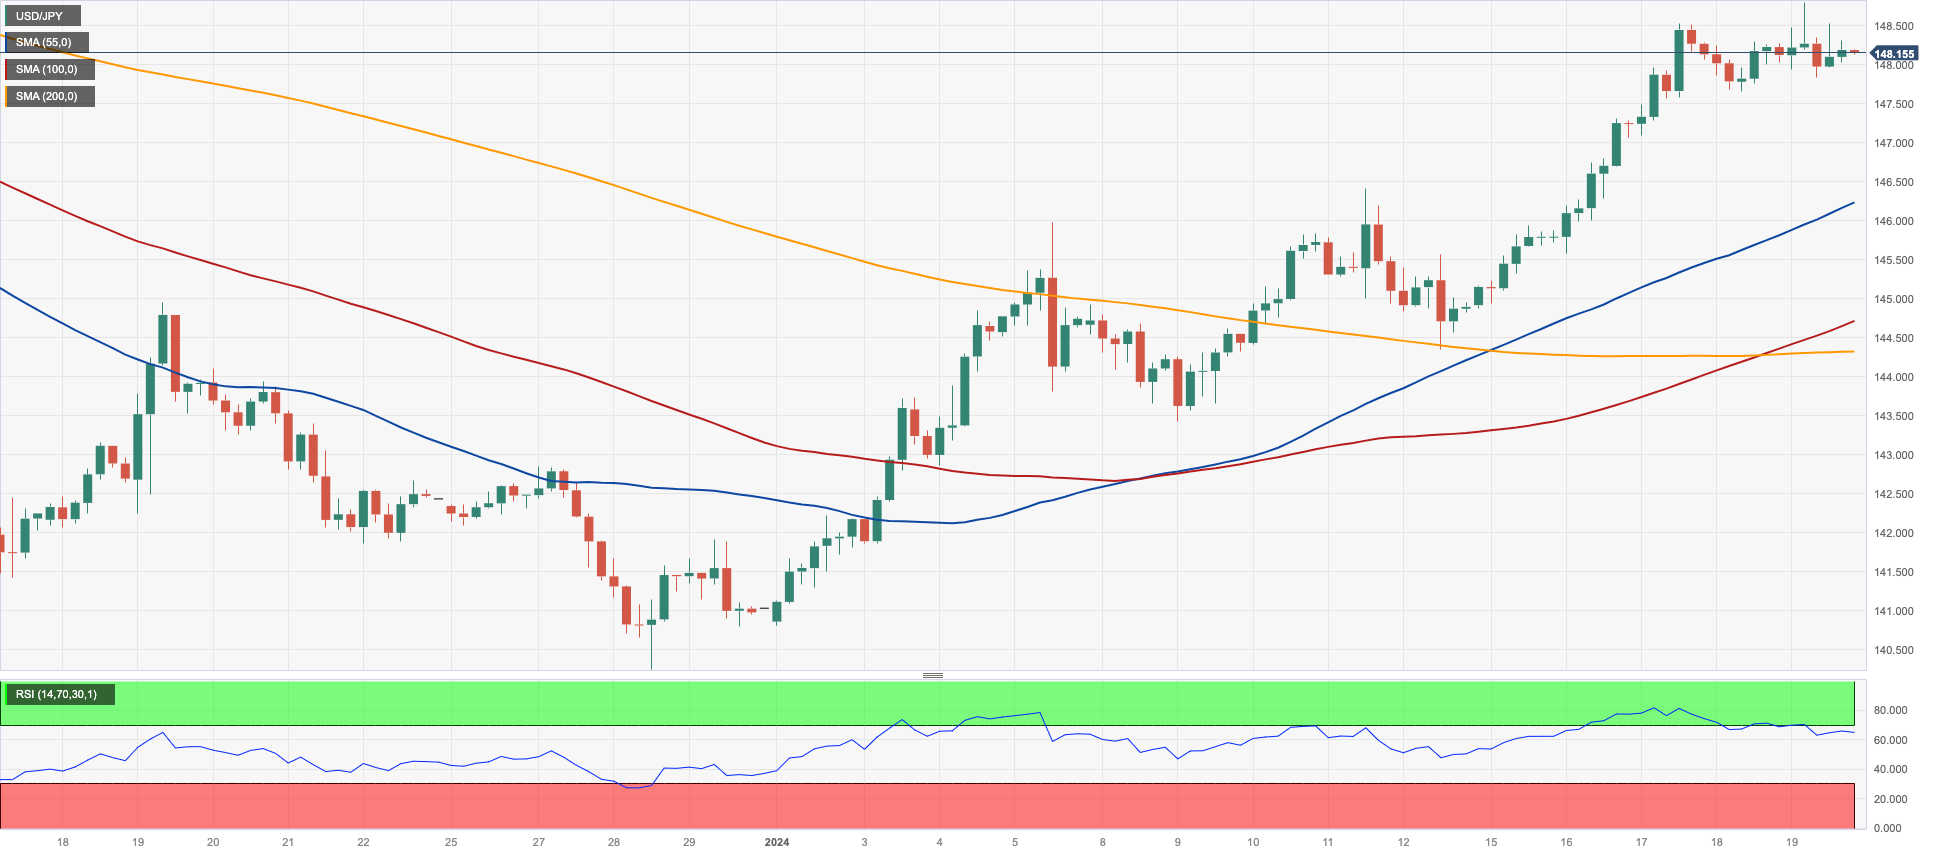
USD/JPY maintained its weekly constructive bias well in place for the fifth session in a row on Friday, this time advancing to a fresh 2024 peak around 148.80, although ending around Thursday’s close around 148.10.
Despite the late loss of upside momentum in the greenback, rising US yields mainly in the short end of the curve helped in the pair’s decline along with the resurgence of some appetite for the risk complex, which eventually put the Japanese yen under extra pressure.
Meanwhile, in the Japanese debt market, JGB 10-year yields saw another positive session, extending the move to levels last visited in mid-December around 0.67%.
Following a new year-to-date high of 148.80 (January 18), the next upward aim for USD/JPY is the crucial milestone of 150.00, seconded by the 2023 top of 151.90 (November 13). Further up, the 2022 peak of 151.94 (October 21) is quickly followed by the round number of 152.00. Instead, if the pair goes below the 200-day SMA of 143.92, it might spark a deeper correction to the December 2023 low of 140.24 (December 28) before reaching the round milestone of 140.00. The July 2023 low of 137.23 (July 14) appears south of here, but the loss of this area should not find any significant support until the important 130.00 level, which comes ahead of the March 2023 low of 129.63 (March 24). The daily RSI receded below 66.
Resistance levels: 148.80 149.67 151.43 (4H chart)
Support levels: 147.65 146.19 144.34 (4H chart)
GBPUSD
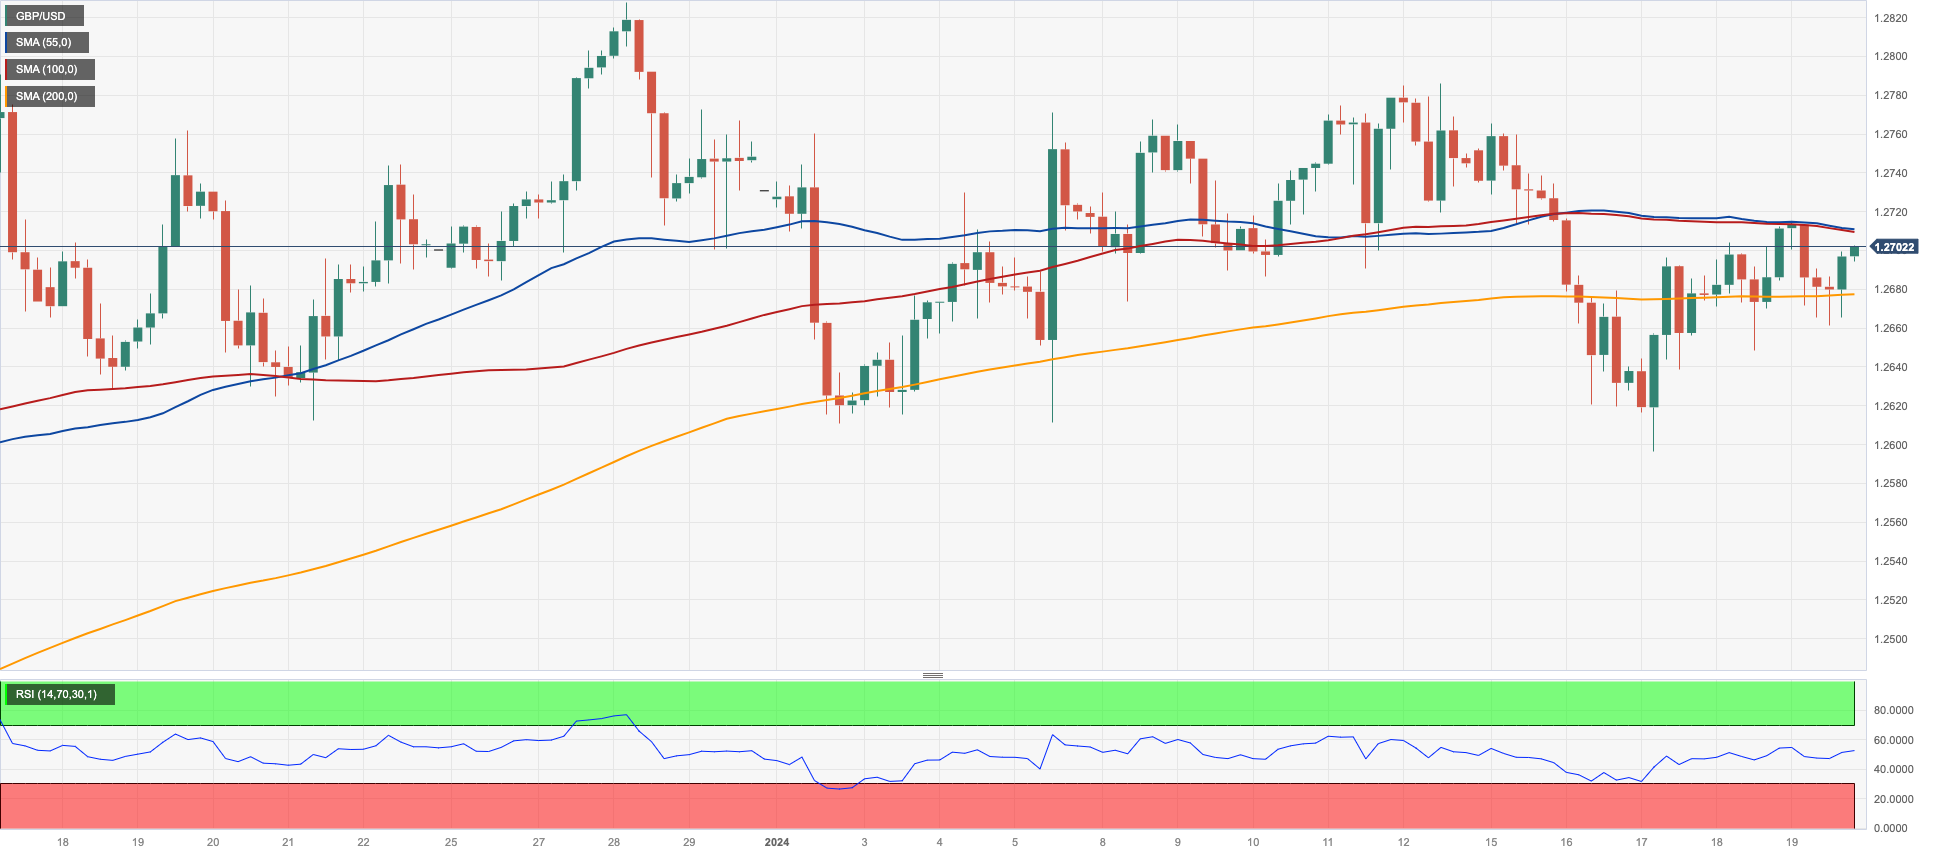
Following two daily advances in a row, GBP/USD faced some selling pressure soon after trespassing the key 1.2700 barrier at the end of the week.
In fact, the British pound gave away some of its recent gains despite the humble pullback in the greenback. The renewed downward bias in Cable seems to have been triggered by disheartening prints from UK Retail Sales, which contracted 2.4% in the year to December and 2.1% when it came to sales excluding fuel.
In the UK bond market, 10-year gilt yields retreated marginally following Thursday’s losses, while a decent resistance appears to have emerged around 4.00% so far.
If sellers recover the initiative, GBP/USD may revisit the so-far 2024 low of 1.2596 (January 17), before the important 200-day SMA at 1.2547 and the December 2023 bottom of 1.2500 (December 13). Extra weakening may push Cable to the weekly low of 1.2187 (November 10, 2023), ahead of the October 2023 low of 1.2037 (October 3), the key 1.2000 level, and the 2023 bottom of 1.1802 (November 10, 2023). On the contrary, an immediate up-barrier emerges at the December 2023 top of 1.2827 (December 28), prior to the weekly peak of 1.2995 (July 27, 2023), which is just shy of the critical 1.3000 level. The day-to-day RSI deflated to the 52 zone.
Resistance levels: 1.2714 1.2785 1.2827 (4H chart)
Support levels: 1.2647 1.2596 1.2500 (4H chart)
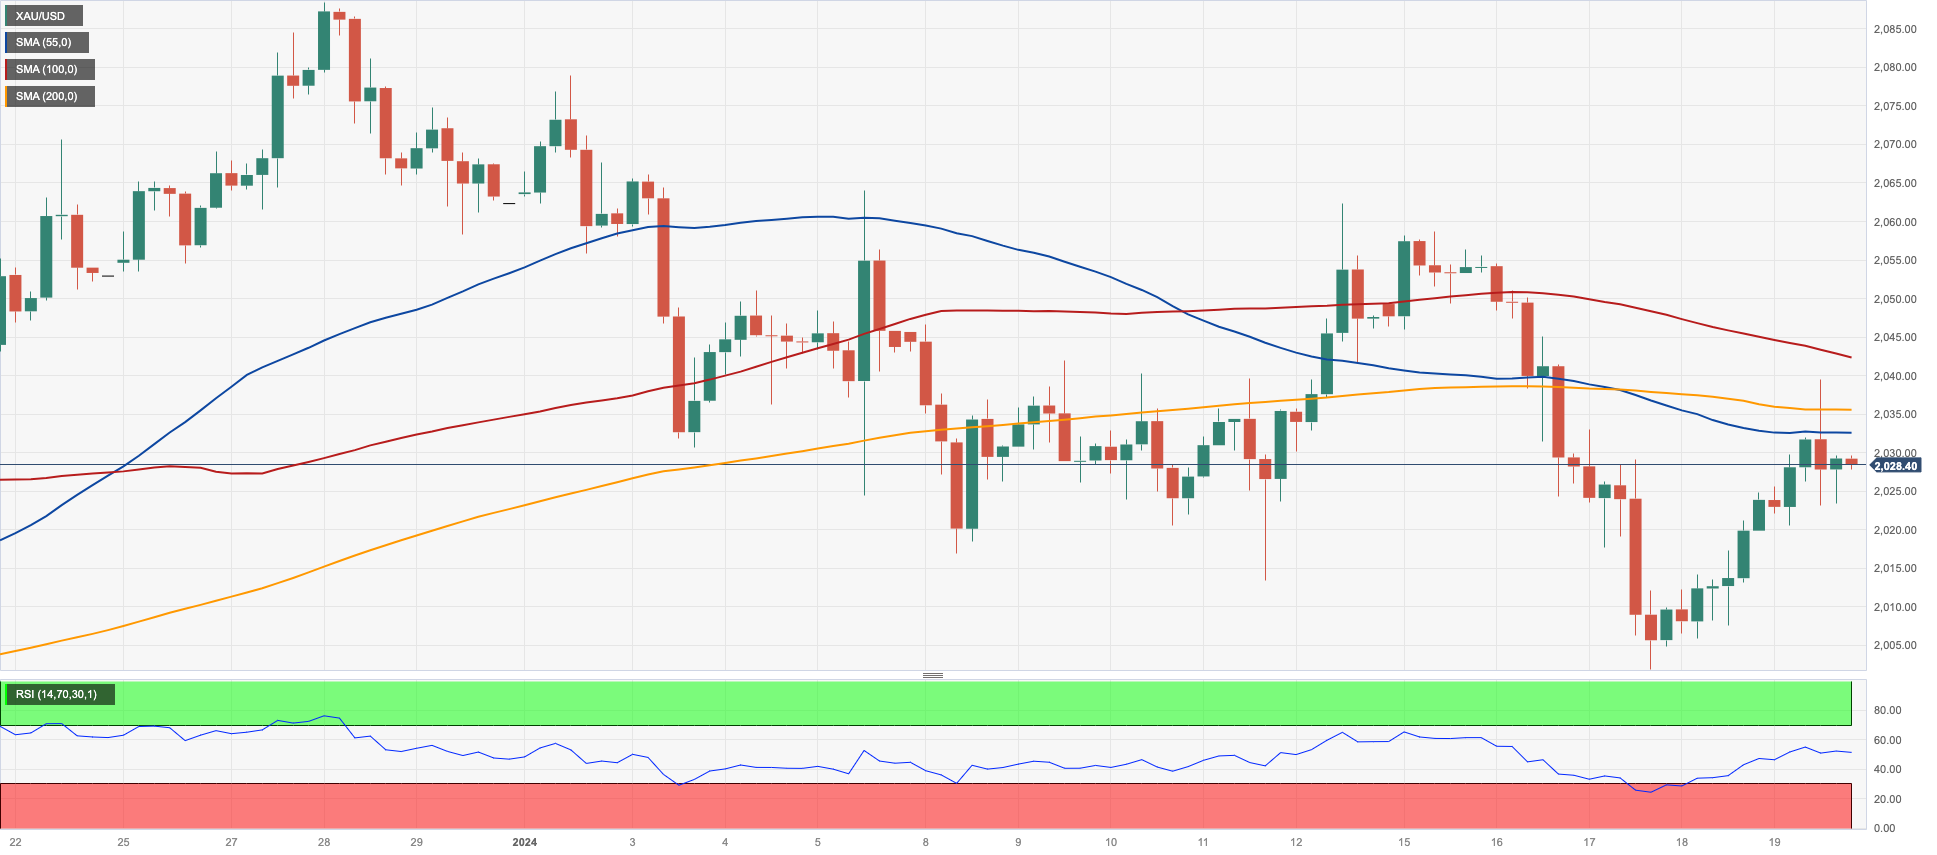
GOLD
Prices of the yellow metal edged higher and added to the positive tone seen in the latter part of the week on Friday.
Indeed, geopolitical concerns remained far from abated and continued to lend support to gold amidst investors’ flight-to-safe mode.
Further bolstering the upside bias in bullion came the renewed selling stance from the greenback and some loss of upside momentum in US yields on the longer end of the curve.
The so-far 2024 low of $2001 strengthens the important conflict zone around $2000 for the foreseeable time. If this area gives way, it may lead to a further slide to the December 2023 low of $1973, followed by the 200-day SMA of $1963 and the November 2023 low of $1931. In the case of more losses, the price may retest the October 2023 low of $1810, followed by the 2023 low of $1804 and maybe the $1800 zone. Having said that, the initial up-barrier aligns at the weekly peak of $2088 (December 28). Beyond there, the next aim is the all-time high of $2150 (December 4, 2023).
Resistance levels: $2039 $2062 $2078 (4H chart)
Support levels: $2001 $1973 $1965 (4H chart)
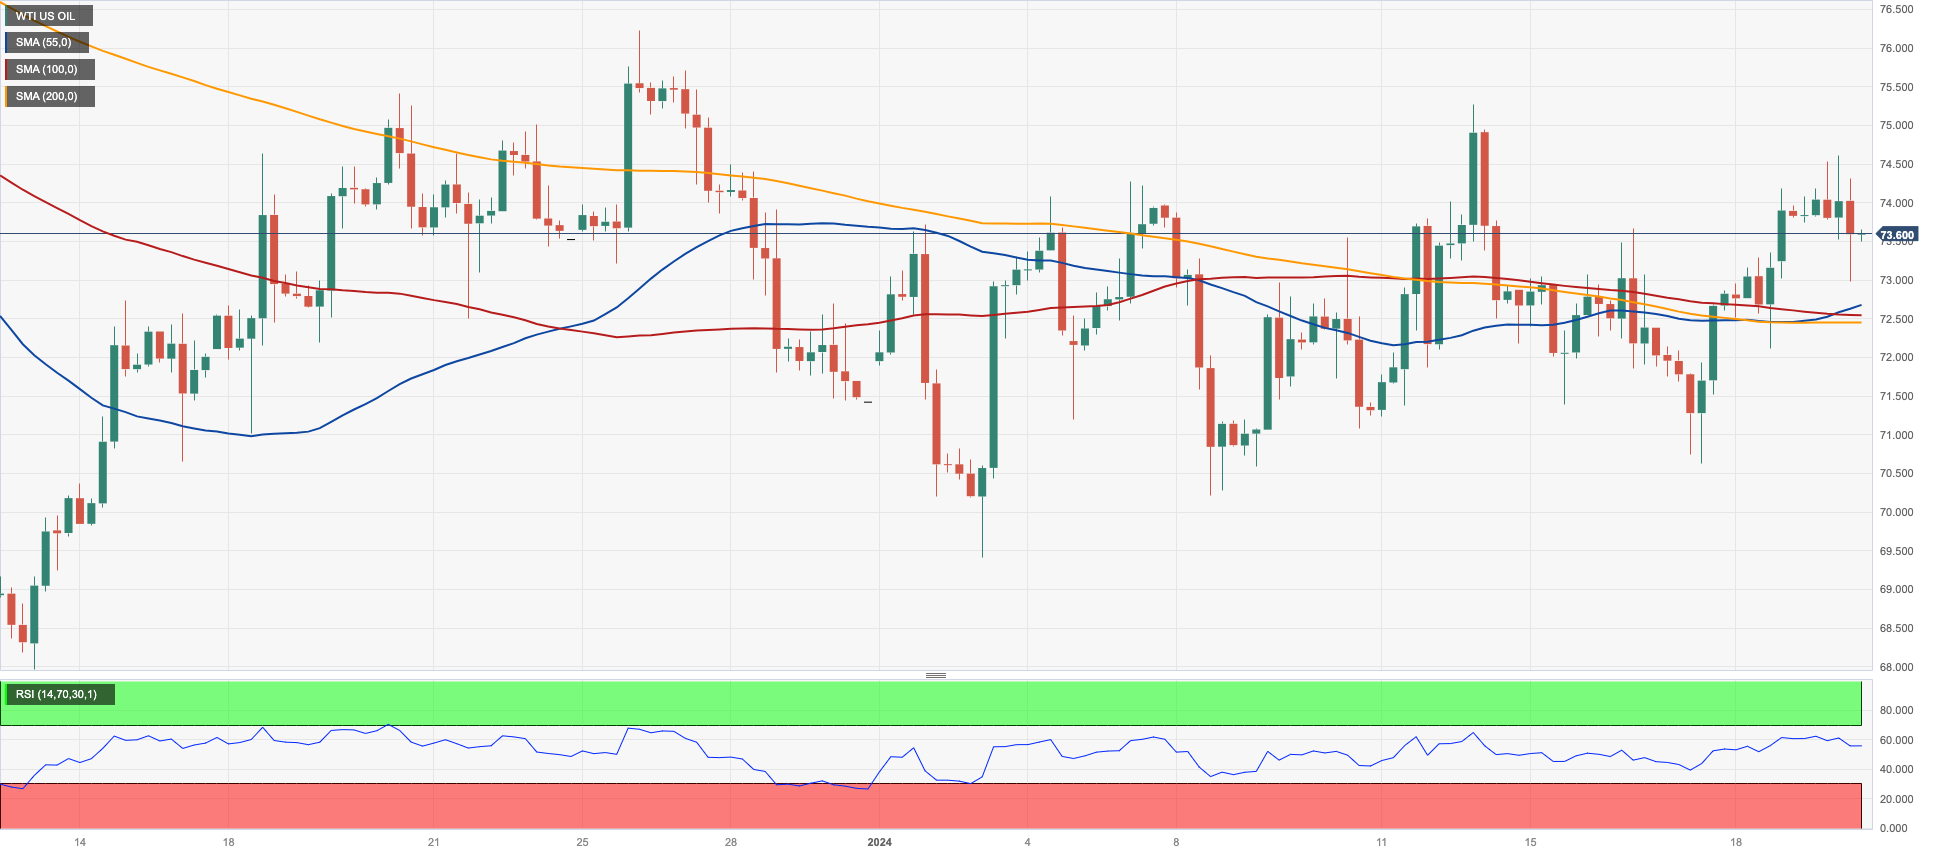
CRUDE WTI
Prices of WTI partially faded two consecutive daily advances and retreated modestly on Friday, revisiting the boundaries of the $73.00 mark per barrel.
Despite this pullback, crude oil prices managed to close a positive week, although they remained so far stuck within the ongoing multi-week consolidative phase.
Price action around WTI followed increasing geopolitical concerns in the Middle East, the Red Sea crisis, and the rising (and worrying) participation of Iran in current conflicts. In addition, discouraging prints from Chinese indicators also kept crude oil prices subdued.
Looking back, the upbeat report from the IEA released earlier in the week and the
larger-than-expected drop in US crude oil supplies (-2.492M barrels), as per the EIA’s report, also helped with the upbeat sentiment around the commodity.
Closing the docket, the US Oil Rig Count went down by 2 in the week to January 19, totaling 497 active oil rigs, said driller Baker Hughes.
Immediately to the upside for WTI is the weekly high of $76.14 (December 26, 2023), followed by the significant 200-day SMA at $77.61, the $80.00 barrier, and the November 2023 top of $80.15 (November 3). Further gains from here may take the market back to its weekly peak of $89.83 (October 18, 2023), ahead of the 2023 high of $94.99 (September 28, 2023) and the August 2022 top of $97.65 (August 30), all before reaching the important $100.00 threshold. The other way around, the next support is the 2024 low of $69.31 (January 3), followed by the December 2023 low of $67.74 (December 13), which comes before June 2023 bottom of $66.85 (June 12) and the 2023 low of $63.61.
Resistance levels: $75.21 $76.14 $79.56 (4H chart)
Support levels: $70.59 $69.25 $67.68 (4H chart)
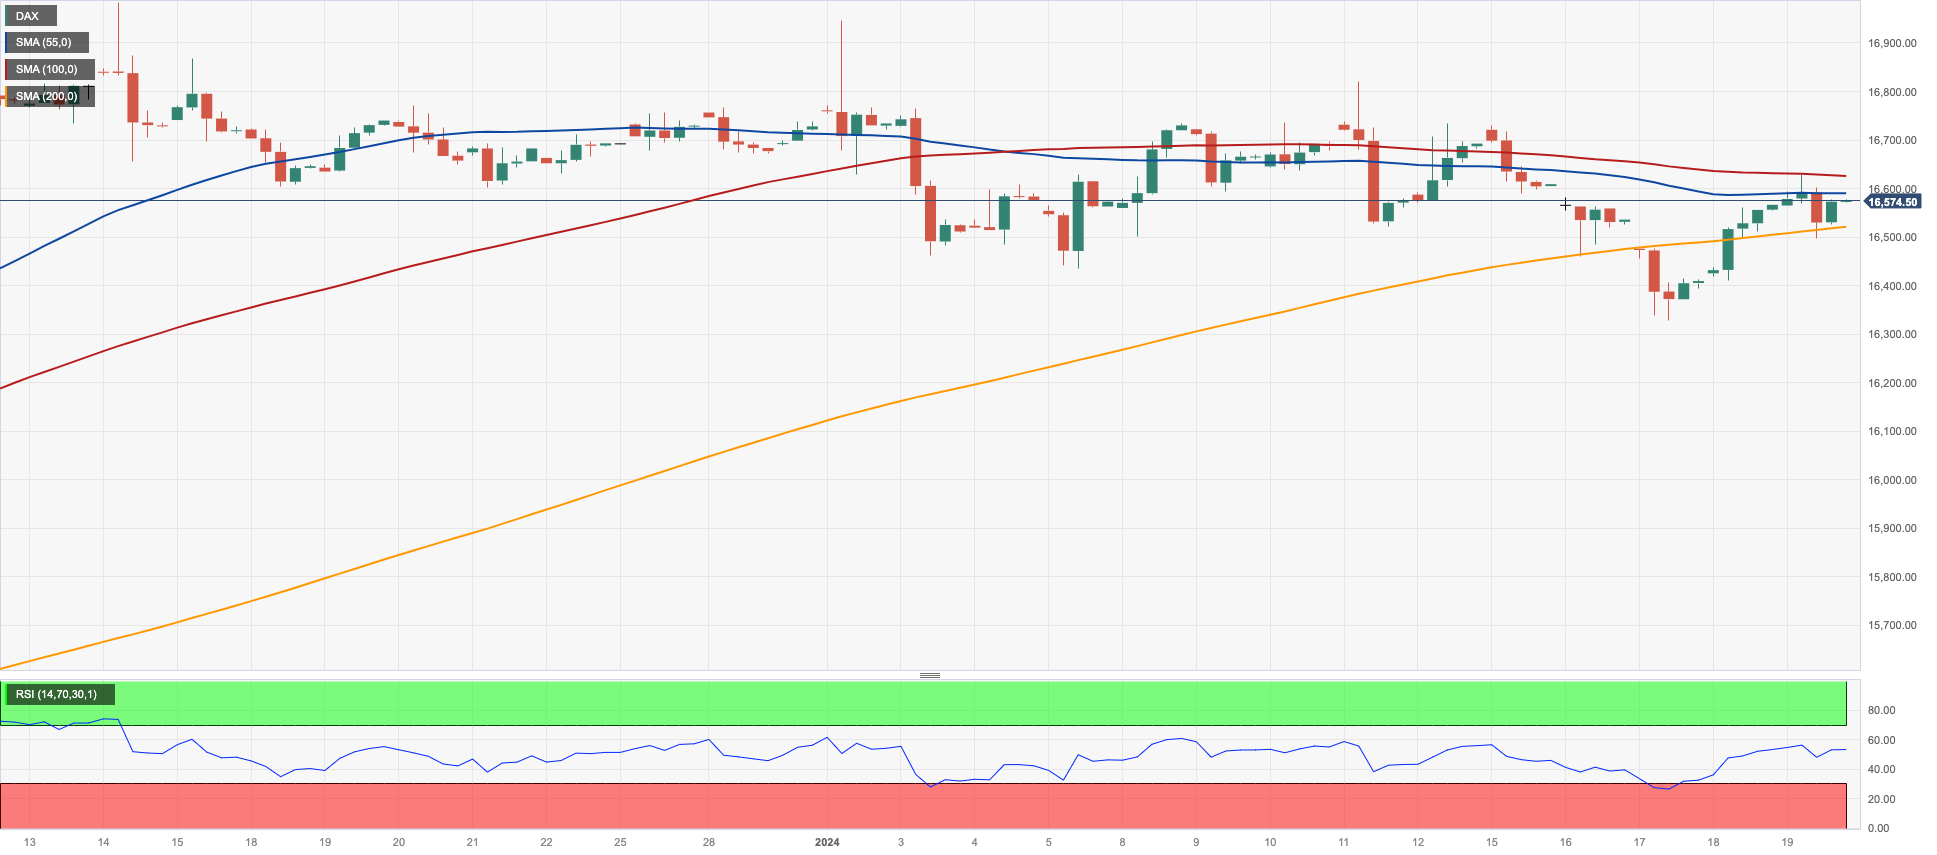
GER40
The German DAX40 receded marginally on Friday, closing the week with marked gains and extending further the rangebound theme in place since early December.
In fact, the index ended the session around the 16500 region as sellers regained the upper hand on the back of diminishing bets on an interest rate cut by the ECB before the summer.
In addition, geopolitical jitters and steady uncertainty around the still-absent economic bounce in China added to the generalized sour mood among market participants at the end of the week.
Meanwhile, in Germany, 10-year bund yields followed their European peers and retreated to 2.30% after four consecutive daily gains.
The DAX40's immediate downward target is the so-far 2024 low of 16345 (January 17), ahead of the weekly low of 15915 (November 28), which looks to be supported by the important 200-day SMA of 15897. The October 2023 low of 14630 (October 23) comes next, before the March 2023 low of 14458 (March 20). In contrast, the initial up-barrier corresponds with the YTD high of 16963 (January 2) prior to the all-time top of 17003 (December 14). The daily RSI eased marginally to the vicinity of 50.
Best Performers: RWE AG ST, E.ON SE, SAP
Worst Performers: Porsche, Commerzbank, Siemens Healthineers
Resistance levels: 16647 16839 16963 (4H chart)
Support levels: 16345 15996 15915 (4H chart)
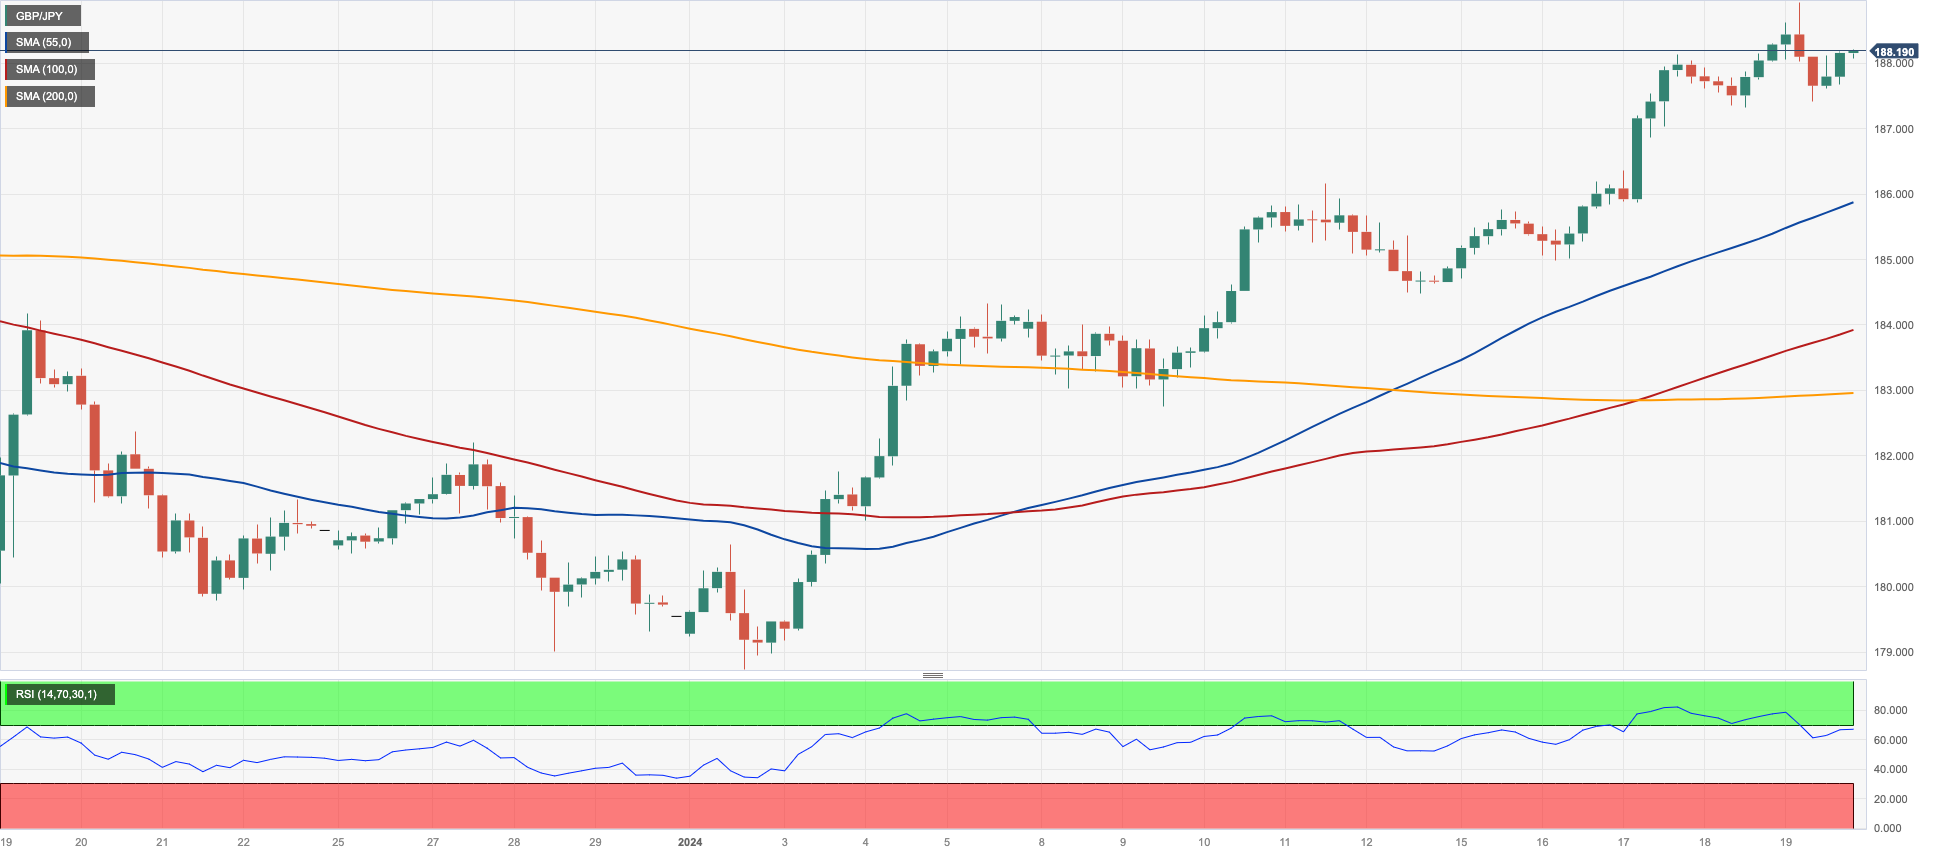
GBPJPY
GBP/JPY ended Friday’s session around the previous day’s closing levels in the low 188.00s after hitting a new high just below the 190.00 hurdle, an area last seen in August 2015.
While the slight selling pressure in the Japanese currency initially supported the move higher in the cross, the persistent downside bias in the British pound eventually weighed on the price action.
GBP/JPY hit a new 2024 top of 188.93 (January 18). A climb over this level might lead to a likely challenge of the round number of 190.00 prior to the August 2015 peak of 195.28 (August 18). In the opposite direction, there is brief support at the 55-day and 100-day SMAs of 184.44 and 183.64, respectively, ahead of the more important 200-day SMA of 180.53. The break of the latter exposes the December 2023 low of 178.33 (December 14), which comes before the October 2023 low of 178.03 (October 3) and the July 2023 low of 176.30. From here, another slide to the May 2023 low of 167.84 (May 11) should not be ruled out. The everyday RSI looked stable around 67.
Resistance levels: 188.93 189.99 195.28 (4H chart)
Support levels: 187.37 185.79 184.47 (4H chart)
NASDAQ
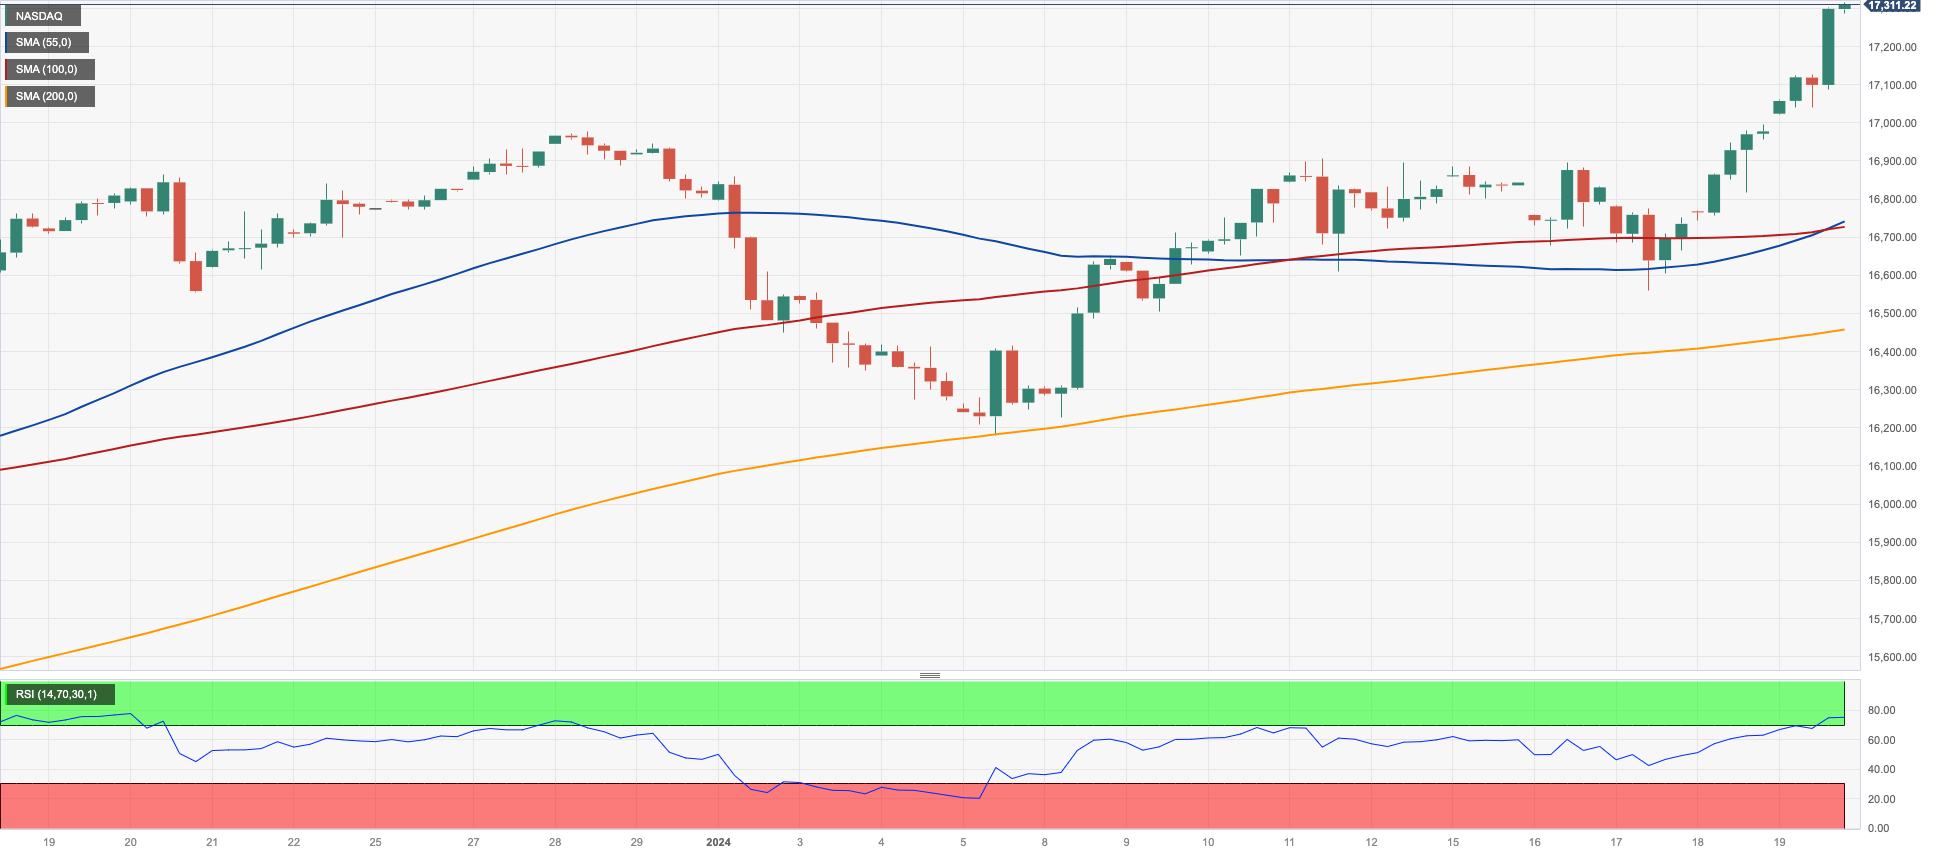
In line with the rest of its US peers, the tech reference Nasdaq 100 extended the ongoing recovery, clocking a new record high well north of the 17000 barrier on Friday.
The solid performance of AI-linked stocks, a retracement in the dollar, and mixed US yields across the curve also collaborated with the march north in the Nasdaq 100, while steady optimism ahead of upcoming earnings reports also helped with the mood.
The Nasdaq printed a new all-time top at 17314 on January 19. Corrective moves, on the other hand, should retarget the 2024 low of 16249 (January 5) prior to the December 2023 low of 15695 (December 4) and the critical 200-day SMA of 15006. A drop below this region might spark a retracement towards the October 2023 low of 14058 (October 26), which comes ahead of the April 2023 low of 12724 (April 25), the March 2023 low of 11695 (March 13), and the 2023 low of 10696 (January 3). The RSI for the day rose over 71, entering the overbought zone.
Top Gainers: AMD, PayPal Holdings Inc, Broadcom
Top Losers: Dollar Tree, PepsiCo, Fortinet
Resistance levels: 17301 (4H chart)
Support levels: 16561 16249 15695 (4H chart)
DOW JONES
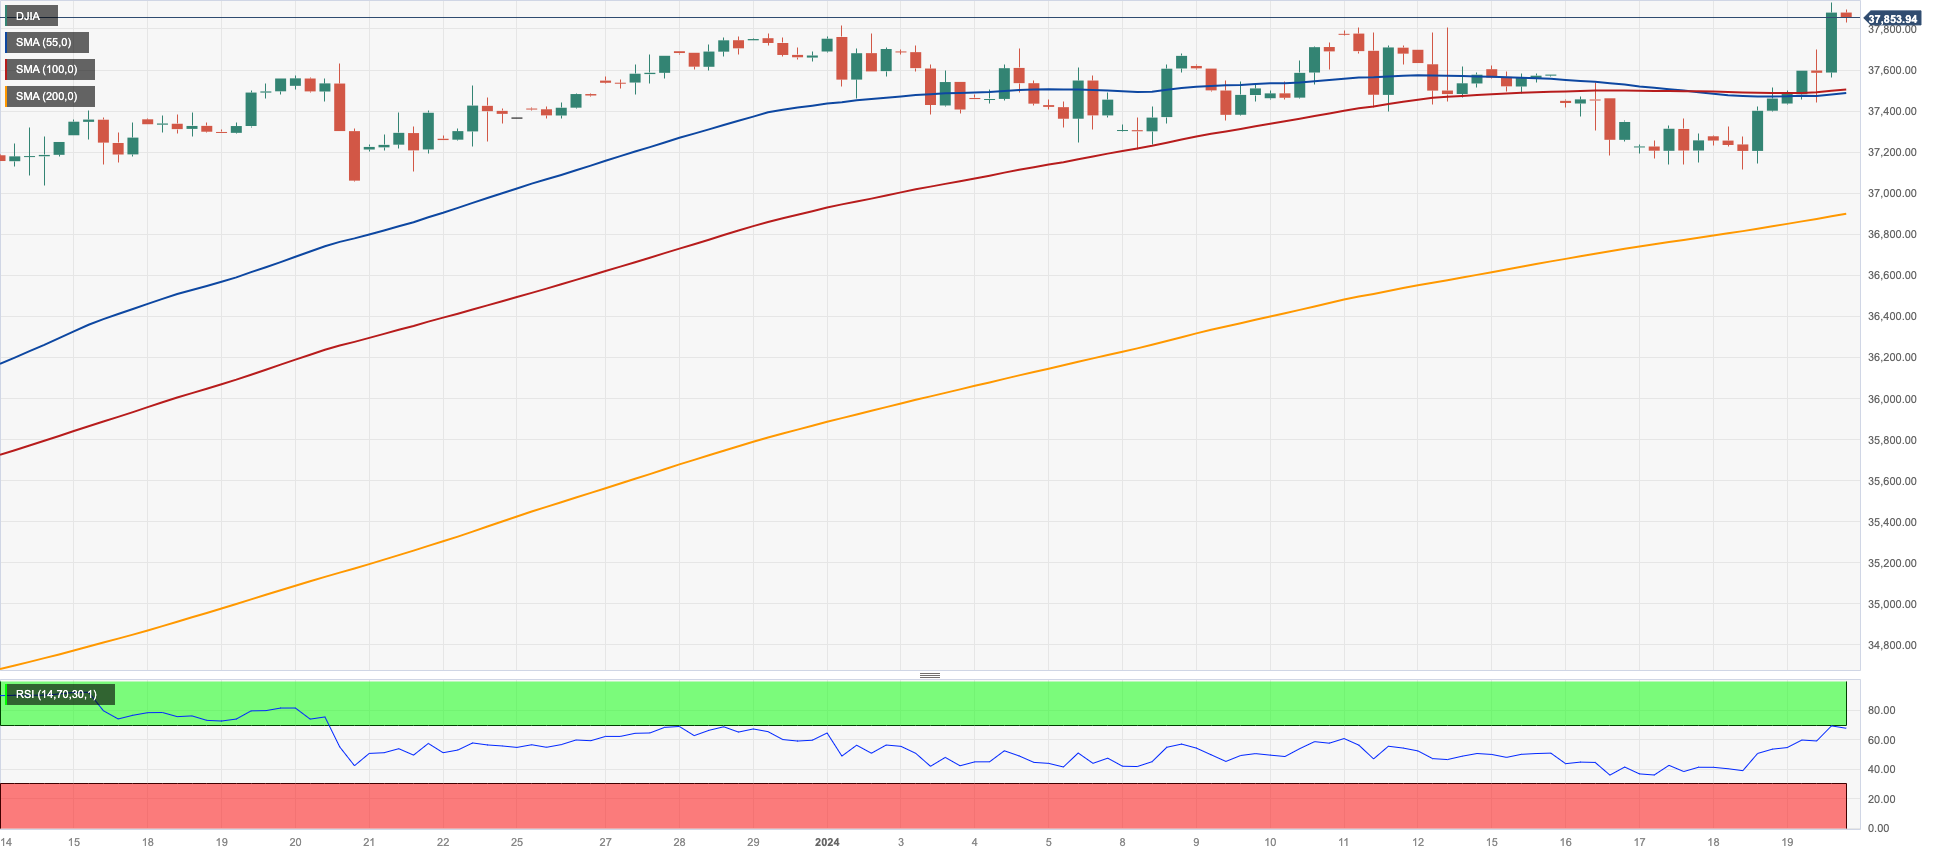
US stocks regained extra upside and pushed the key benchmarks Dow Jones and S&P500 to new all-time highs just below the 38000 mark and beyond 4800, respectively, on Friday.
The intense optimism among market participants has been fueled by positive prospects and increasing interest in the tech sector, especially AI-related equities.
In addition, the soft tone in the greenback, in combination with the re-emergence of the appetite for risk-associated assets and hopes of positive corporate earnings reports all contributed to the broad-based upbeat sentiment.
Back to the Fed, the probability of a March rate hike dwindled to 46% from over 80% at the beginning of the week, according to the FedWatch Tool gauged by CME Group.
At the end of the week, the Dow Jones advanced 0.11% to 37307, the S&P500 rose 0.06% to 4742, and the tech-heavy Nasdaq Composite gained 0.47% to 14917.
Extra gains could prompt the Dow Jones to challenge the round level of 38000, once the all-time high of 37933 (January 19) is cleared. On the flip side, bearish attempts should dispute the 2024 bottom of 37122 (January 18), which comes before the weekly low of 37073 (December 20, 2023) and the December 2023 low of 36010 (December 5). Further losses could put the 200-day SMA at 34627 into play, ahead of the weekly low of 33859 (November 7, 2023), the October 2023 low of 32327 (October 27), and the 2023 low of 31429 (March 15). The daily RSI rebounded north of 66.
Top Performers: Travelers, Intel, IBM
Worst Performers: UnitedHealth, Walgreen Boots, Walmart
Resistance levels: 37933 (4H chart)
Support levels: 37122 37073 36021 (4H chart)
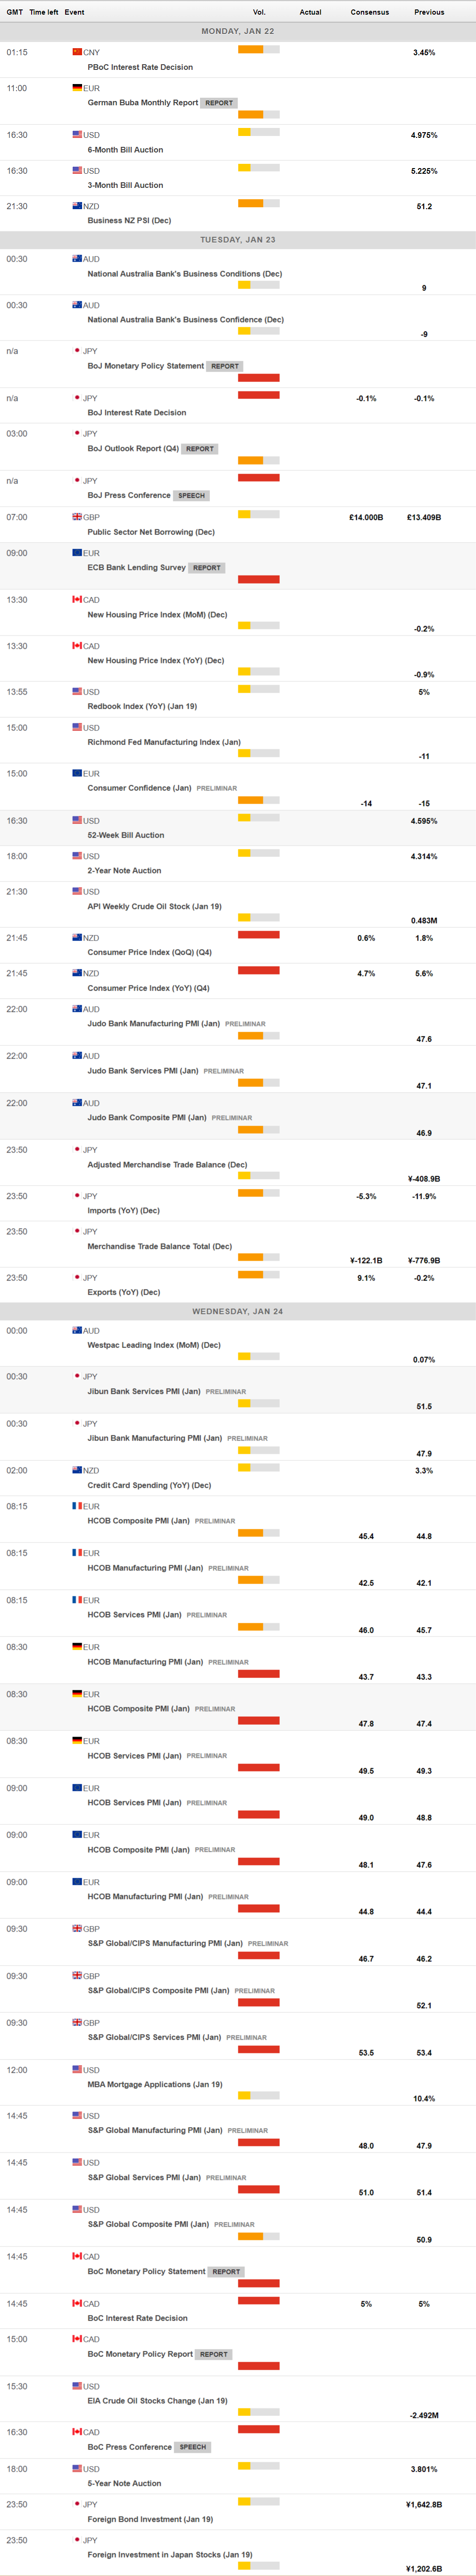
MACROECONOMIC EVENTS
All Information & Updates provided by:

All information relating to the financial markets available on this page has been prepared and issued by FXStreet (Forexstreet SL, Spain, Reg: B62498233) on the basis of publicly available information and all information believed to be reliable and does not conflict with Kuwaiti local laws, and all necessary care has been taken to before the company to ensure that the facts mentioned are correct from the source.
NCM Investment nor any of its directors or employees shall in any way be held responsible for the contents of this news, and the information contained on this page is intended only to provide clients with publicly available information and should not be construed as investment advice, report or analysis and/or constitute an offer or invitation to buy or sell financial instruments of any kind.
RISK WARNING: Forex and CFDs are highly risky leveraged products, as losses can exceed deposits. Please ensure you understand all the risks and take independent advice if necessary. NCM will segregate the clients based on the criteria of the regulator and its bylaws. NCM does not provide any advisory service; the material published does not constitute advice or a recommendation for a transaction in any financial instrument. NCM accepts no responsibility for any use of the content presented and any consequences of that use. Anyone acting on the information provided does so at their own risk.