
- Contact Us:
-

-

-

-


Daily Market Updates
23 Jan 2024
EURUSD
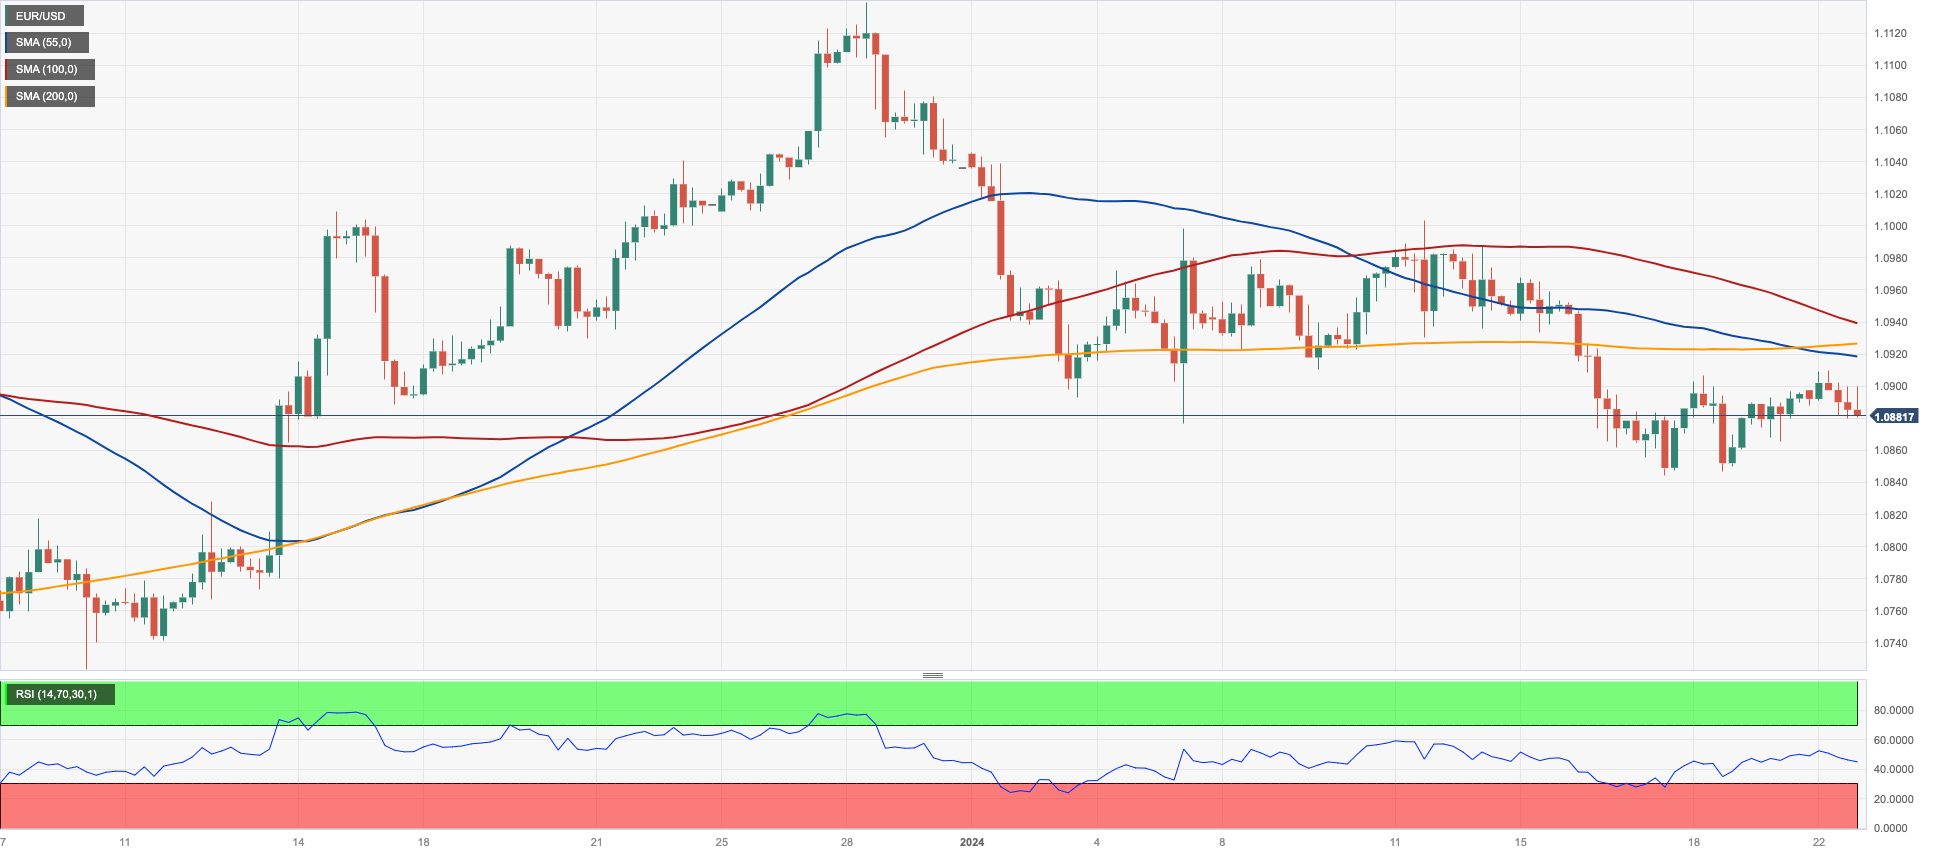
EUR/USD traded in an inconclusive fashion and maintained the slight negative tone at the beginning of the week, always against the backdrop of the equally vacillating mood in the greenback and diminishing US yields on both sides of the Atlantic.
The USD Index (DXY), in the meantime, remained flattish around Friday’s closing levels in the low 103.00s, as market participants remained prudent prior to key US data releases later in the week along with interest rate decisions by many major central banks.
There is nothing worth mentioning in the docket, just the 0.1% monthly contraction of the CB Leading Index in the US docket.
If sellers breach below the 2024 low of 1.0844 (January 17), which correlates with the important 200-day SMA, EUR/USD might continue to decline to the transitory 100-day SMA of 1.0770, ahead of the December 2023 bottom of 1.0723 (December 8). The loss of this area points to a faster slide to the weekly low of 1.0495 (October 13, 2023), followed by the 2023 low of 1.0448 (October 3) and the round level of 1.0400. On the upside, there is initial resistance at the weekly high of 1.0998 (January 5, 11) before the December 2023 top of 1.1139 (December 27), which is also supported by the 200-week SMA at 1.1150 and the 2023 peak of 1.1275 (July 18). The daily RSI dropped below 45.
Resistance levels: 1.0909 1.0945 1.0998 (4H chart)
Support levels: 1.0844 1.0723 1.0656 (4H chart)
USDJPY
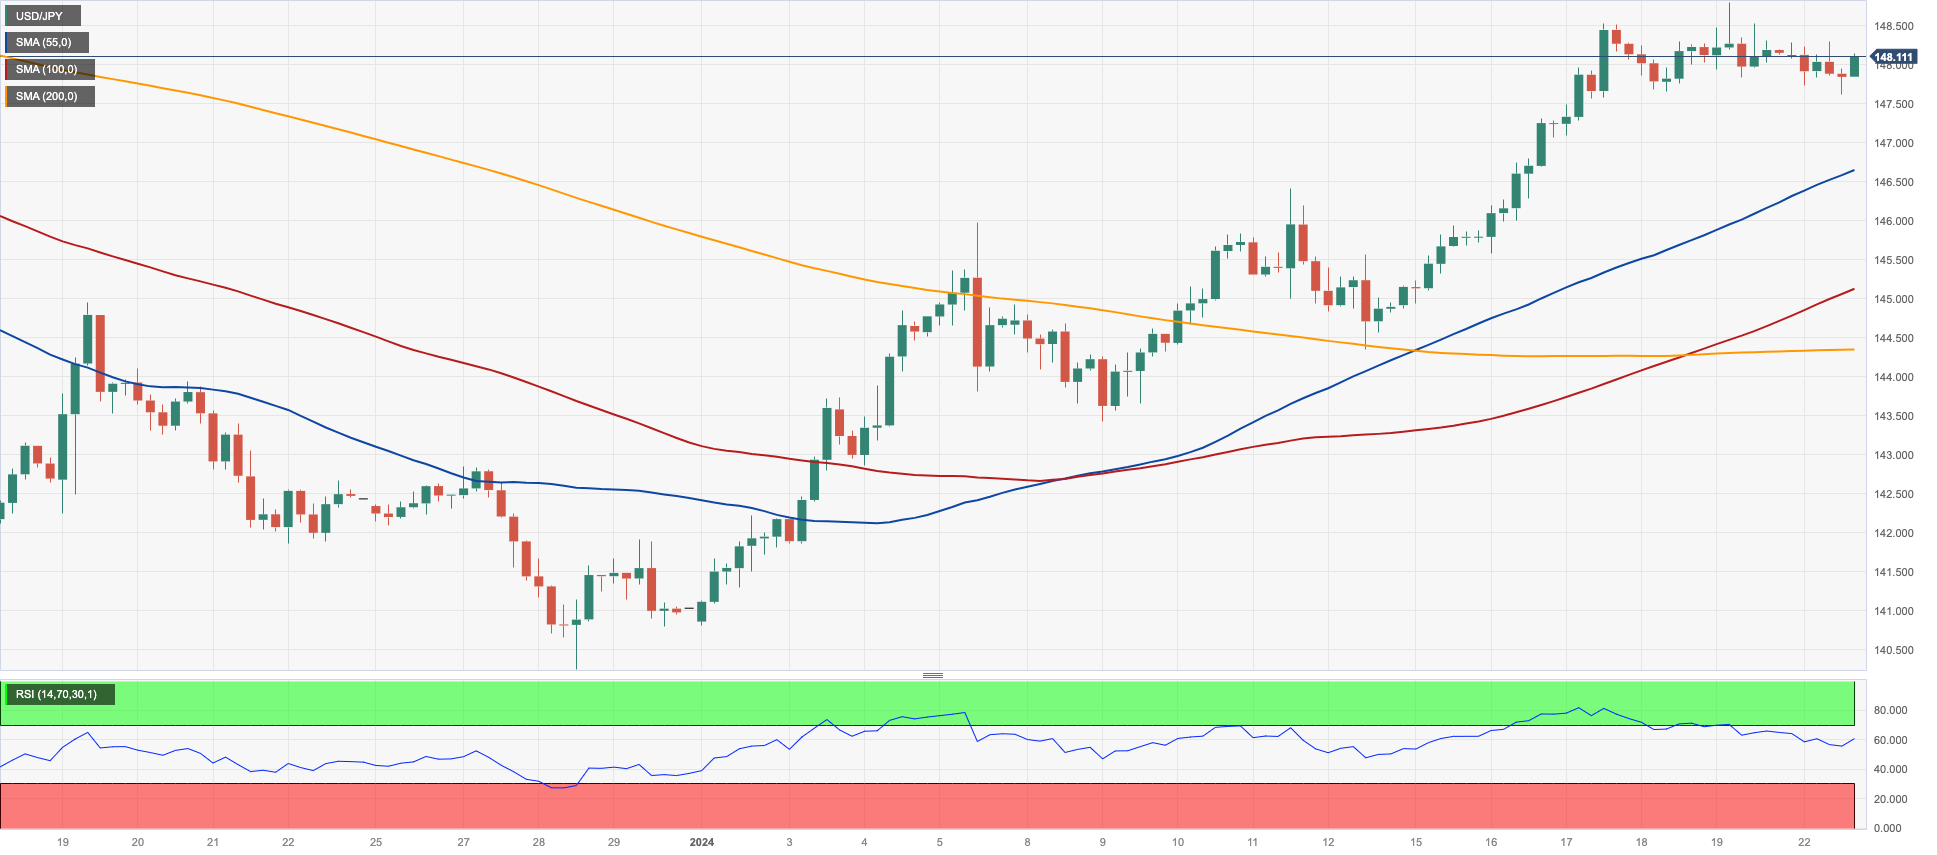
USD/JPY succumbed to the renewed selling pressure and retreated modestly after five consecutive sessions of gains, including a new 2024 peak around 148.80 recorded on January 19.
Price action around the pair included humble losses in the greenback against the backdrop of declining US yields across different timeframes.
In the Japanese money market, JGB 10-year gilts dropped to the 0.65% zone after four straight daily advances.
Absent releases in the domestic calendar, all the attention is expected to be on the BoJ interest rate decision on Tuesday, although consensus anticipates no surprises.
Following a new YTD high of 148.80 (January 18), the next upward target for USD/JPY is the critical milestone of 150.00, seconded by the 2023 top of 151.90 (November 13). Further up comes the 2022 peak of 151.94 (October 21) prior to the round number of 152.00. Instead, if the pair falls below the 200-day SMA of 143.99, it might trigger a deeper retracement to the December 2023 low of 140.24 (December 28), before reaching the round milestone of 140.00. The July 2023 low of 137.23 (July 14) appears south of here, but the loss of this region should not find much support until the critical 130.00 level, which arrives ahead of the March 2023 low of 129.63 (March 24). The daily RSI eased below 65.
Resistance levels: 148.80 149.67 151.43 (4H chart)
Support levels: 147.65 146.19 144.34 (4H chart)
GBPUSD
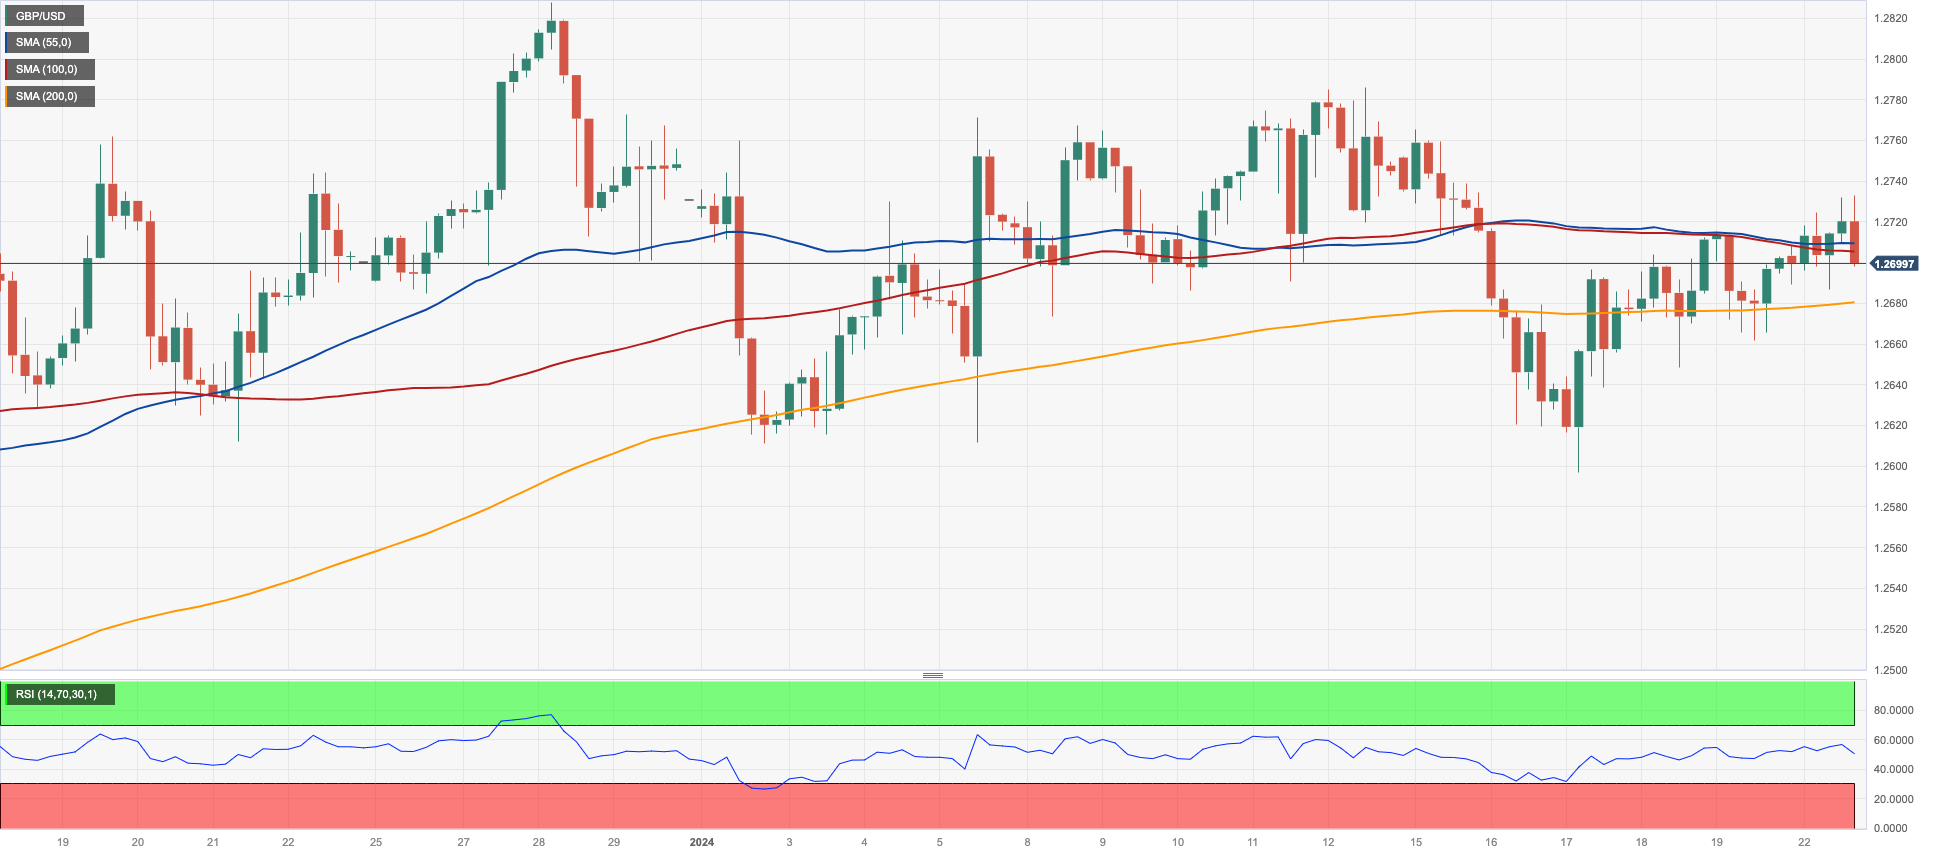
The British pound ended Monday’s session around Friday’s closing levels after a failed attempt to advance further north of 1.2730, or five-day highs at the beginning of the week.
In fact, Cable hovered retreated from the initial move to the 1.2730 zone on the back of the late tepid rebound in the greenback on Monday, while UK 10-year gilt yields remained in quite a narrow range around 3.90%.
There were no data releases scheduled in the UK docket on Monday.
Further upside could now see GBP/USD advance to the December 2023 high of 1.2827 (December 28), prior to the weekly top of 1.2995 (July 27, 2023), which is just shy of the important 1.3000 level. On the other hand, the pair might revisit the so-far 2024 low of 1.2596 (January 17), before the crucial 200-day SMA at 1.2548 and the December 2023 bottom of 1.2500 (December 13). Extra weakness may prompt Cable to revisit the weekly low of 1.2187 (November 10, 2023), ahead of the October 2023 low of 1.2037 (October 3), the critical 1.2000 mark, and the 2023 bottom of 1.1802 (November 10, 2023). The day-to-day RSI settled around 52.
Resistance levels: 1.2731 1.2785 1.2827 (4H chart)
Support levels: 1.2675 1.2647 1.2596 (4H chart)
GOLD
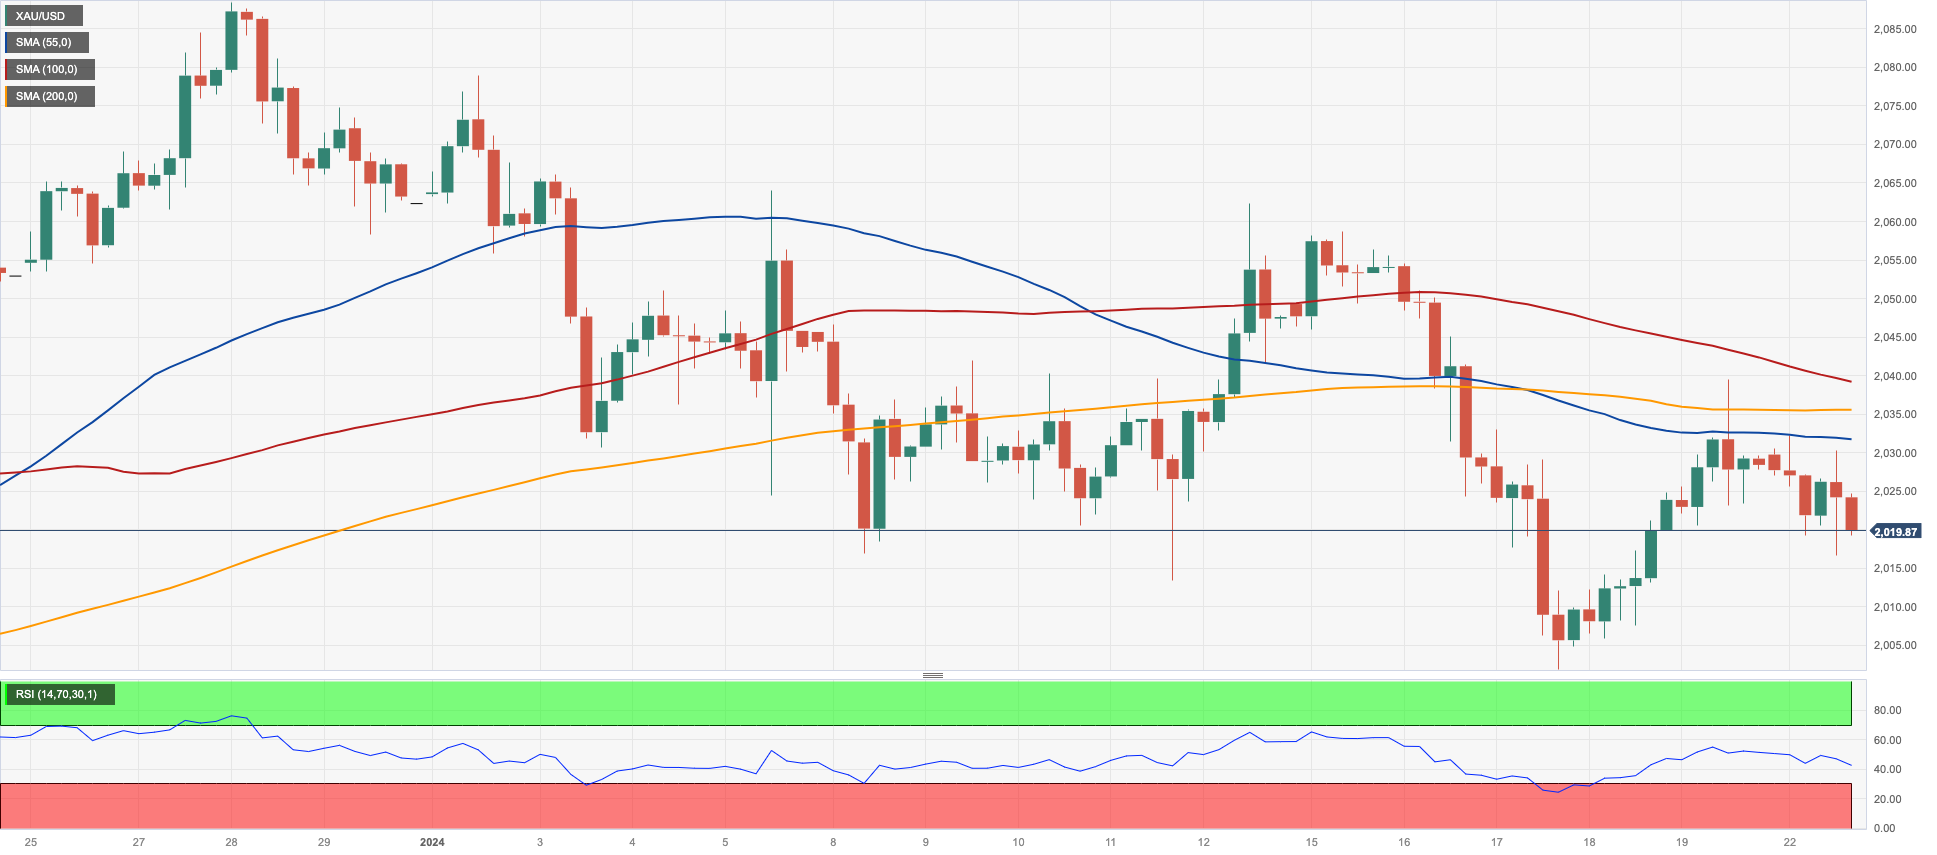
Gold prices kicked off the week on the back foot, leaving behind a two-day rebound and revisiting once again the $2015 zone, where the 55-day SMA also sits and some support also emerged.
The daily pullback in the precious metal came in tandem with the flattish move in the greenback and a corrective pullback in US yields across various maturities, as market participants appeared cautious prior to central banks’ decisions and key data releases in the US economy.
Extra losses could drag Gold to revisit the so-far 2024 low of $2001, which further reinforces the key contention zone around $2000. If this region breaks way, prices may go lower to the December 2023 bottom of $1973, followed by the 200-day SMA of $1963 and the November 2023 low of $1931. In the case of additional losses, the price may retest the October 2023 bottom of $1810, followed by the 2023 low of $1804 and maybe the $1800 zone. Having stated that, the initial up-barrier matches with the weekly top of $2088 (December 28) before the all-time peak of $2150 (December 4, 2023).
Resistance levels: $2039 $2062 $2078 (4H chart)
Support levels: $2001 $1973 $1965 (4H chart)
CRUDE WTI
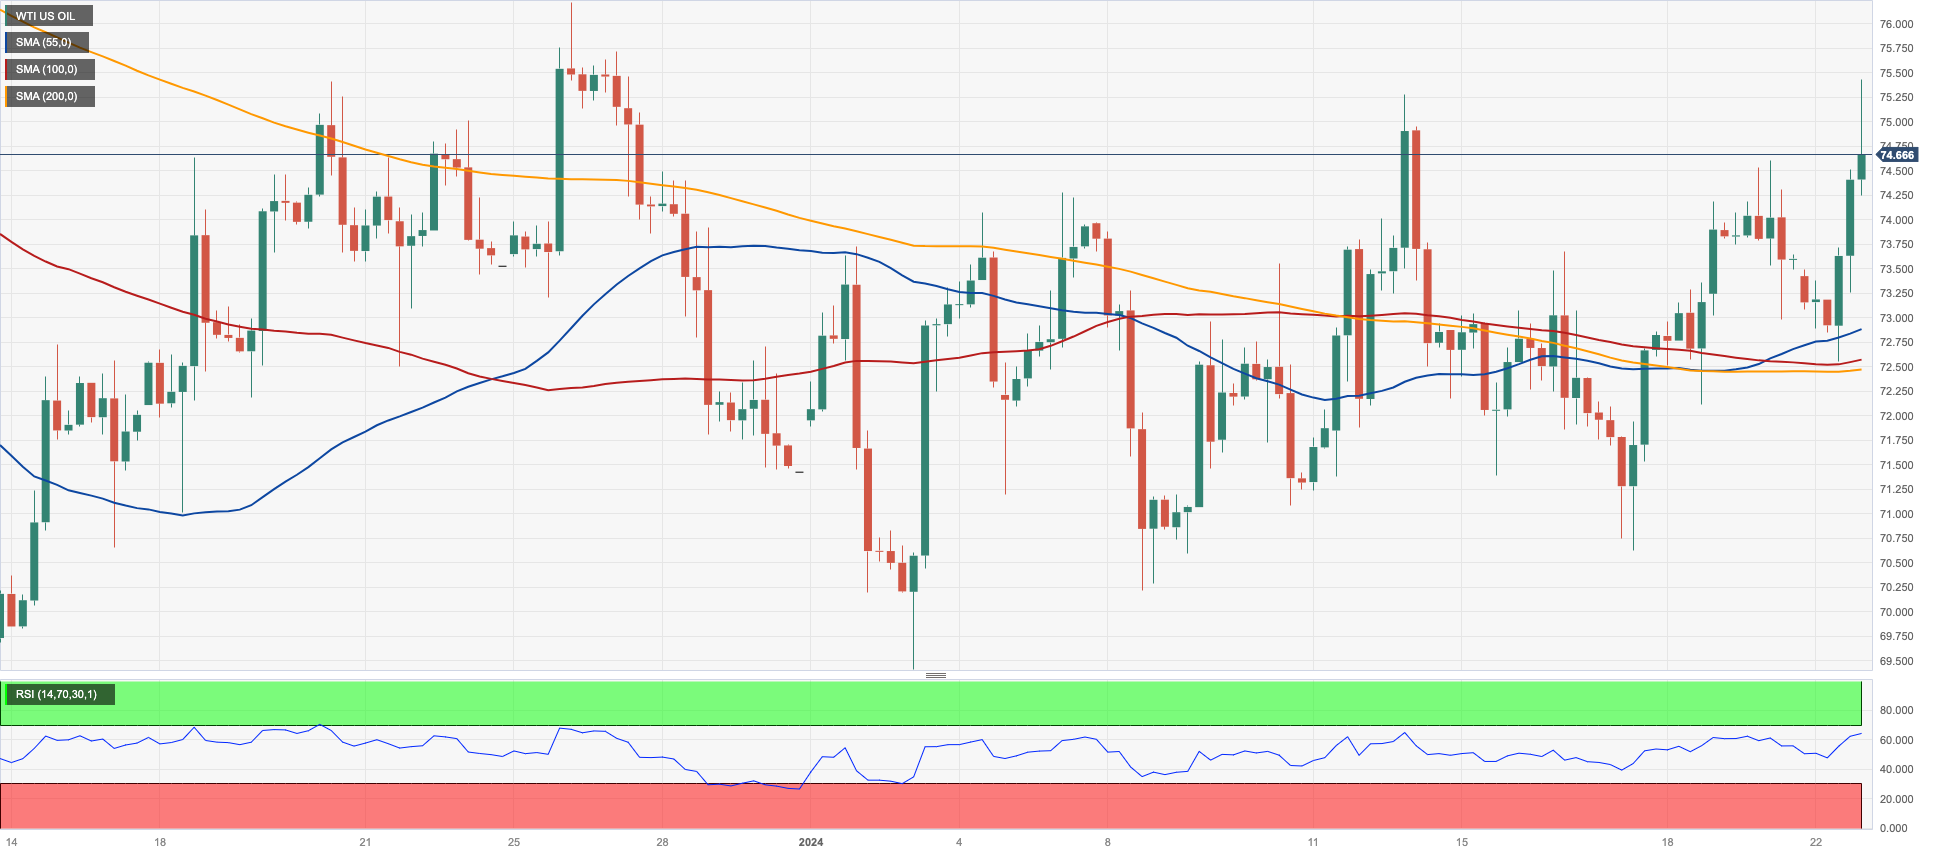
WTI prices rose to fresh four-week peaks north of the $75.00 mark per barrel at the start of the week.
Indeed, the commodity now retargets the upper end of the ongoing consolidative phase just above the $76.00 level, helped by escalating geopolitical concerns and their associated supply disruption fears.
Also collaborating with the strong rebound in crude oil prices, extreme cold weather in the US could also hit the oil industry (mainly in the state of North Dakota), adding to the tight supply narrative.
On the not-so-bright side for the commodity, the major Libyan Sharara oilfield resumed its activity on Sunday after protests closed the facility early in January.
Immediately to the upside for WTI is the weekly high of $76.14 (December 26, 2023), followed by the key 200-day SMA at $77.57, the $80.00 barrier, and the November 2023 top of $80.15 (November 3). Further advances from here may propel the market back to its weekly peak of $89.83 (October 18, 2023), ahead of the 2023 high of $94.99 (September 28, 2023) and the August 2022 top of $97.65 (August 30), all before hitting the critical $100.00 threshold. On the flip side, the next support is the 2024 low of $69.31 (January 3), prior to the December 2023 low of $67.74 (December 13), which comes before the June 2023 bottom of $66.85 (June 12) and the 2023 low of $63.61.
Resistance levels: $75.42 $76.14 $79.56 (4H chart)
Support levels: $70.59 $69.25 $67.68 (4H chart)
GER40
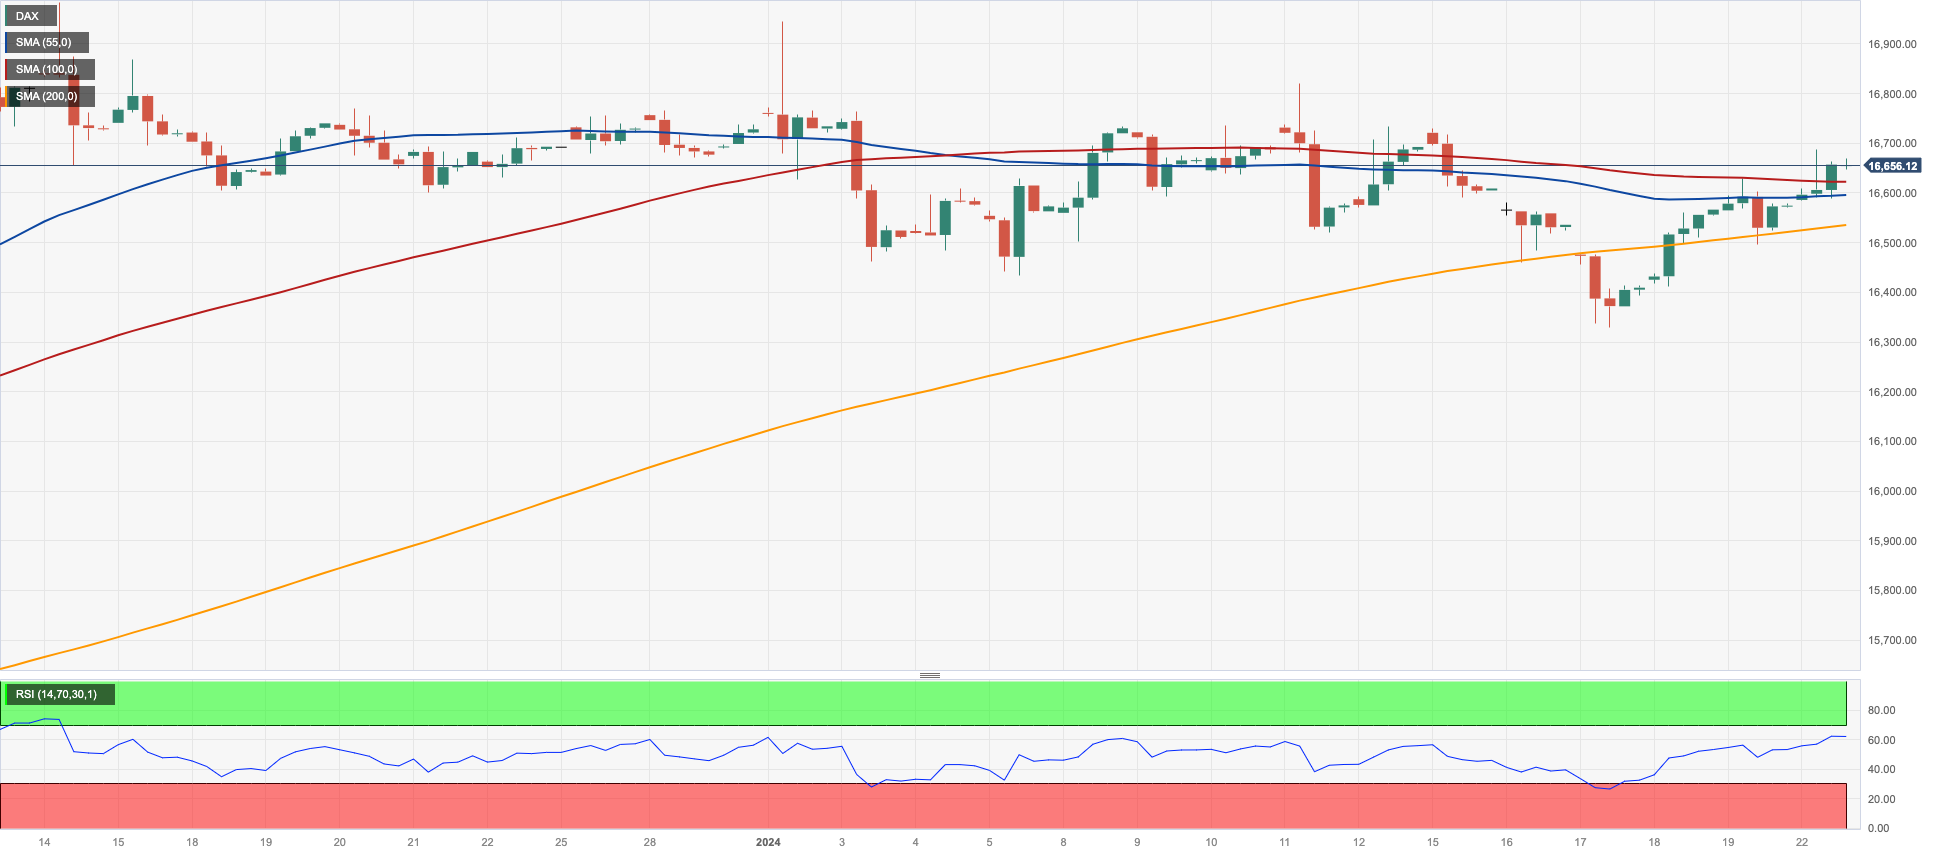
Germany’s stock benchmark DAX40 left behind Friday’s losses and advanced markedly at the beginning of the week, clinching at the same time new multi-session peaks around the 16700 region.
The outperformance of the tech sector helped bulls regain the initiative on Monday, encouraging European stocks to set aside part of their recent weakness and refocus on the upside.
In addition, hopes of a dovish message at the ECB’s meeting later in the week also added to the daily advance in the German index.
In the German debt market, 10-year bund yields edged lower and revisited the 2.25% zone.
The DAX40's immediate downward objective is the so-far 2024 low of 16345 (January 17), ahead of the weekly low of 15915 (November 28), which appears to be supported by the crucial 200-day SMA of 15902. The October 2023 low of 14630 (October 23) follows next, before the March 2023 low of 14458 (March 20). In comparison, the initial up-barrier correlates with the YTD high of 16963 (January 2) prior to the all-time top of 17003 (December 14). The daily RSI improved past the 56 yardstick.
Best Performers: Zalando SE, Hannover Rueck SE, Heidelbergcement
Worst Performers: Commerzbank, RWE AG ST, Dr Ing hc F Porsche Prf
Resistance levels: 16647 16839 16963 (4H chart)
Support levels: 16345 16018 15915 (4H chart)
GBPJPY
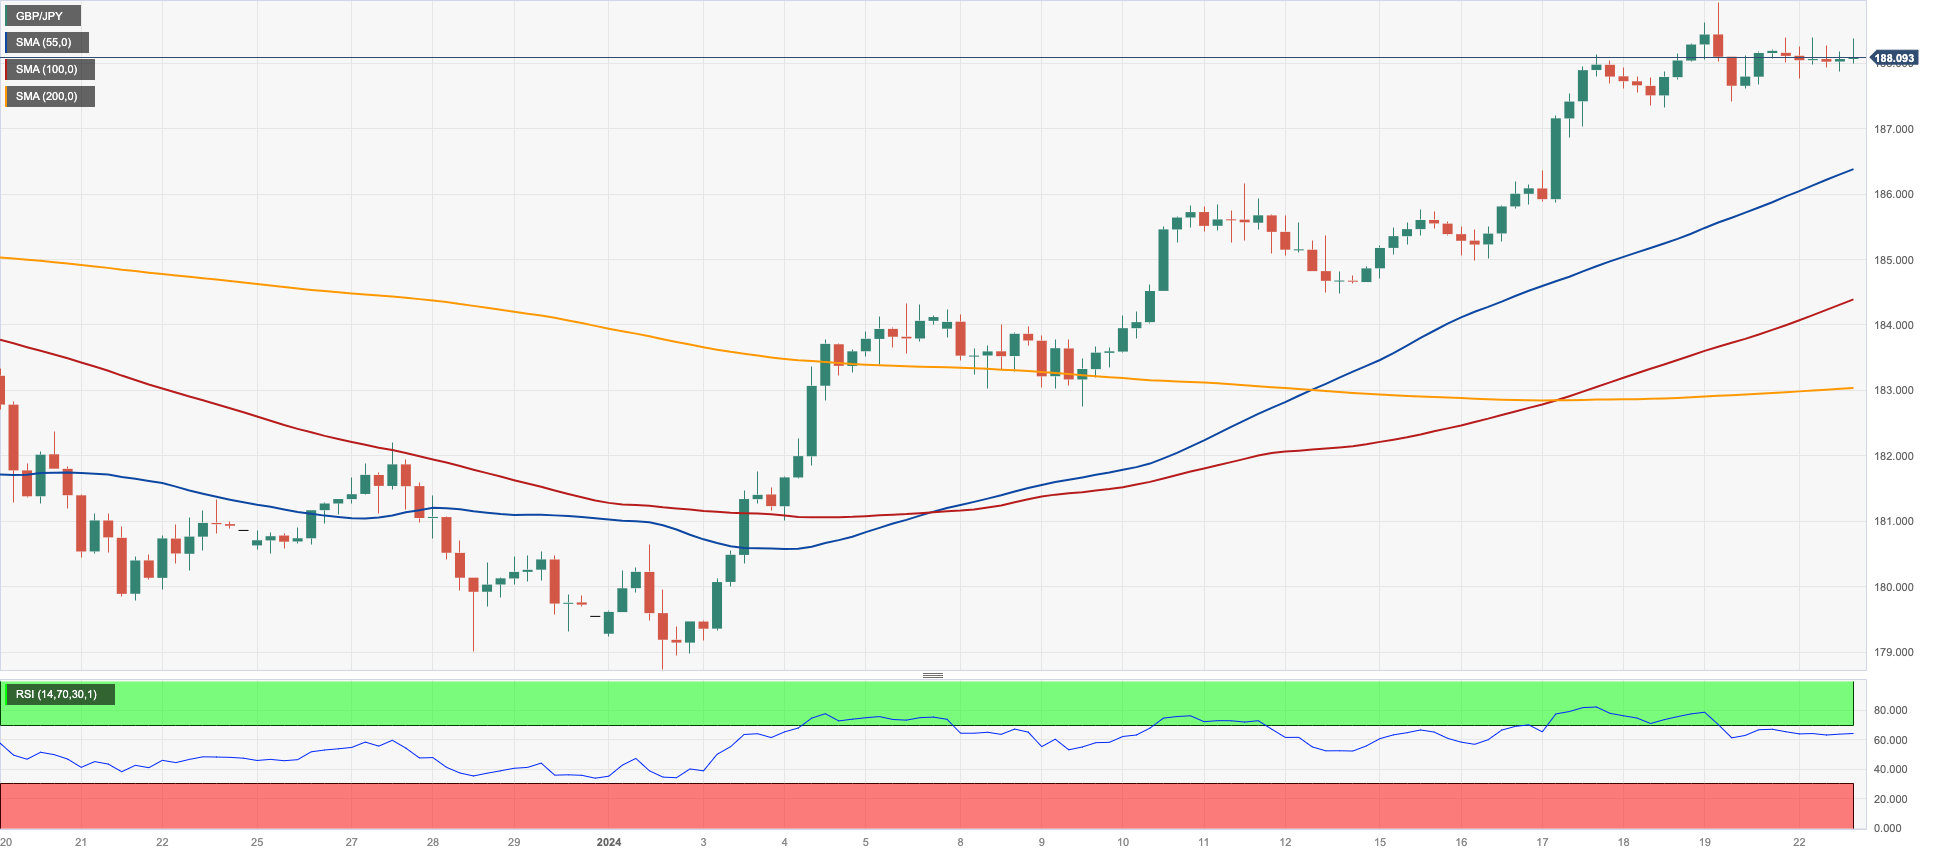
GBP/JPY resumed the uptrend and advanced marginally on Monday, all after the “red doji” candle charted on Friday.
Following the above, investors should now be looking for further developments in the price action, which could eventually morph into the continuation of the strong upside bias seen since the beginning of the year, or instead, the beginning of the corrective move.
In the meantime, the buying pressure around sterling collided with the appreciation of the Japanese yen, resulting in the current tug-of-war around 188.30.
GBP/JPY reached a new 2024 high of 188.93 (January 19). A move over this level might lead to a challenge of the round number of 190.00 prior to the August 2015 top of 195.28 (August 18). In the opposite direction, there is short-term support at the 55-day and 100-day SMAs of 184.52 and 183.68, respectively, ahead of the more crucial 200-day SMA of 180.64. The break of the latter reveals the December 2023 low of 178.33 (December 14), which precedes the October 2023 low of 178.03 (October 3) and the July 2023 low of 176.30. Down from here, another decline to the May 2023 low of 167.84 (May 11) is not out of the question. The daily RSI seems to be constant just above 67.
Resistance levels: 188.93 189.99 195.28 (4H chart)
Support levels: 187.41 184.97 184.47 (4H chart)
NASDAQ
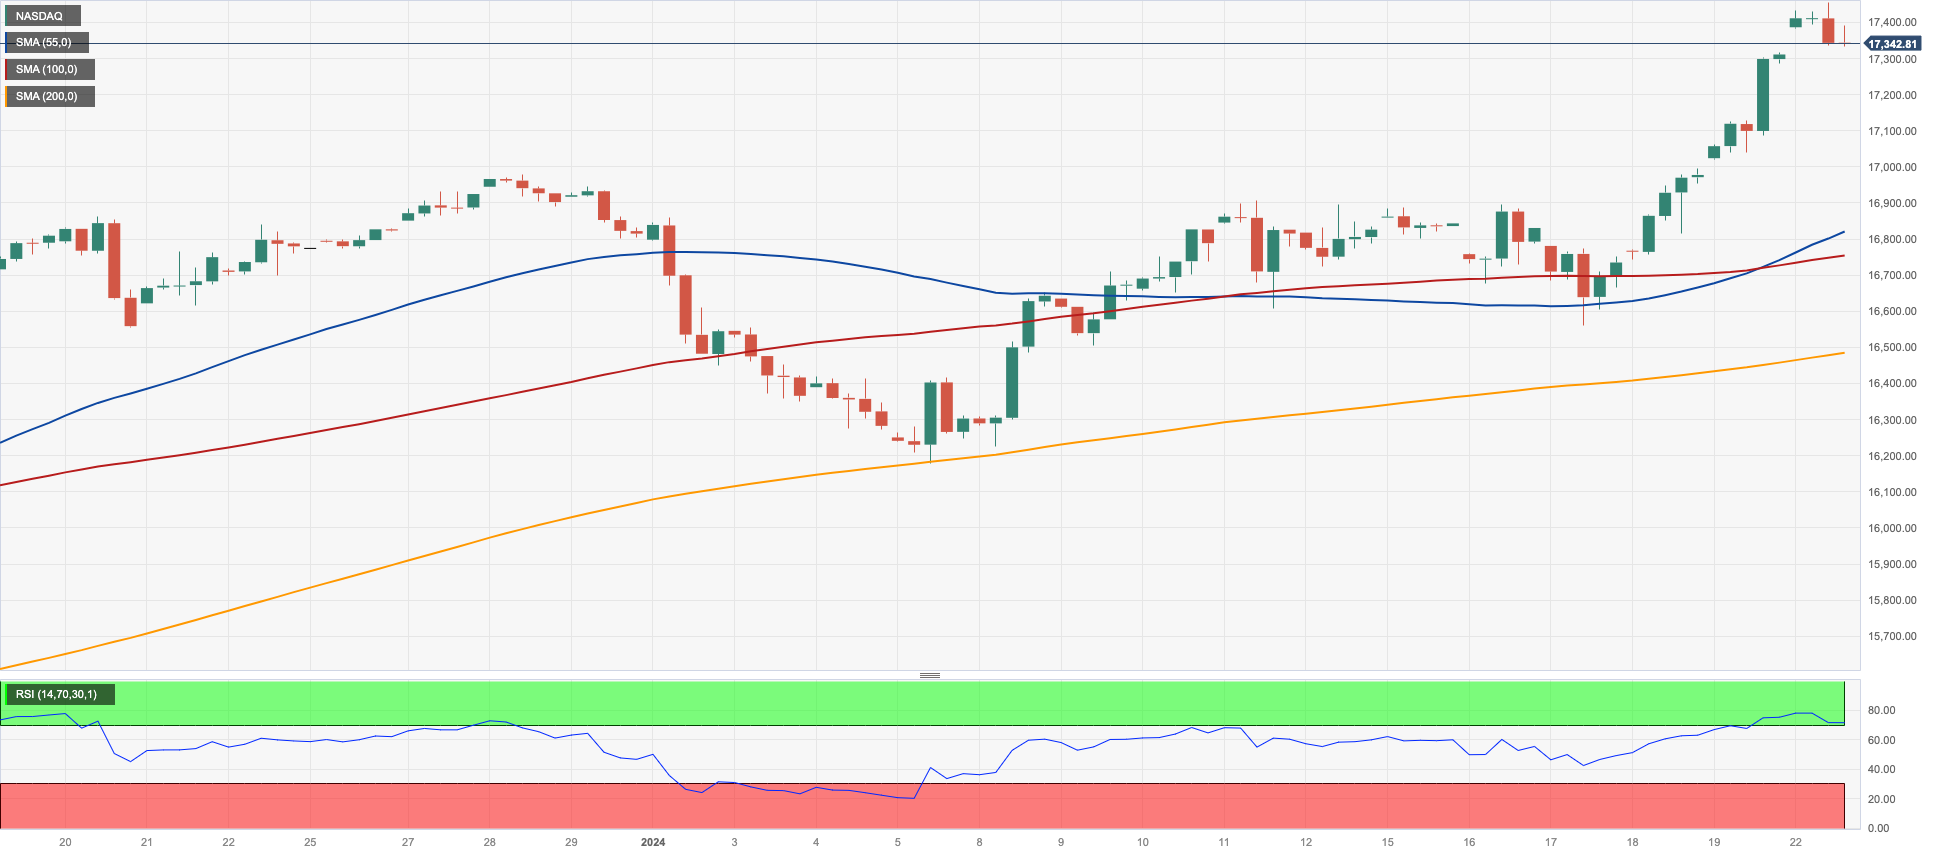
Following its US peers and in response to the broad-based optimism among market participants, the tech benchmark Nasdaq 100 added to the recent uptrend and rose to a fresh record high of around 17450 on Monday.
In fact, the index extended its march north, underpinned by rising bets on a solid performance of AI-related stocks, the irresolute price action in the greenback, diminishing US yields, and speculation of interest rate cuts by the Fed in H1.
In addition, hopes of better-than-expected corporate earnings reports also added to the upbeat mood among investors, eventually bolstering further the upside in the tech sector.
On January 22, the Nasdaq reached a fresh record high of 17450 points. Corrective movements, on the other side, should aim for the 2024 bottom of 16249 (January 5), before the December 2023 low of 15695 (December 4) and the key 200-day SMA of 15027. A decline below this level may cause a regression towards the October 2023 bottom of 14058 (October 26), which comes ahead of the April 2023 low of 12724 (April 25), the March 2023 low of 11695 (March 13), and the 2023 low of 10696 (January 3). The RSI for the day climbed over 72, entering further into the overbought zone.
Top Gainers: Synopsys, The Trade Desk, Zscaler
Top Losers: Gilead, AMD, Booking
Resistance levels: 17450 (4H chart)
Support levels: 16561 16249 15695 (4H chart)
DOW JONES
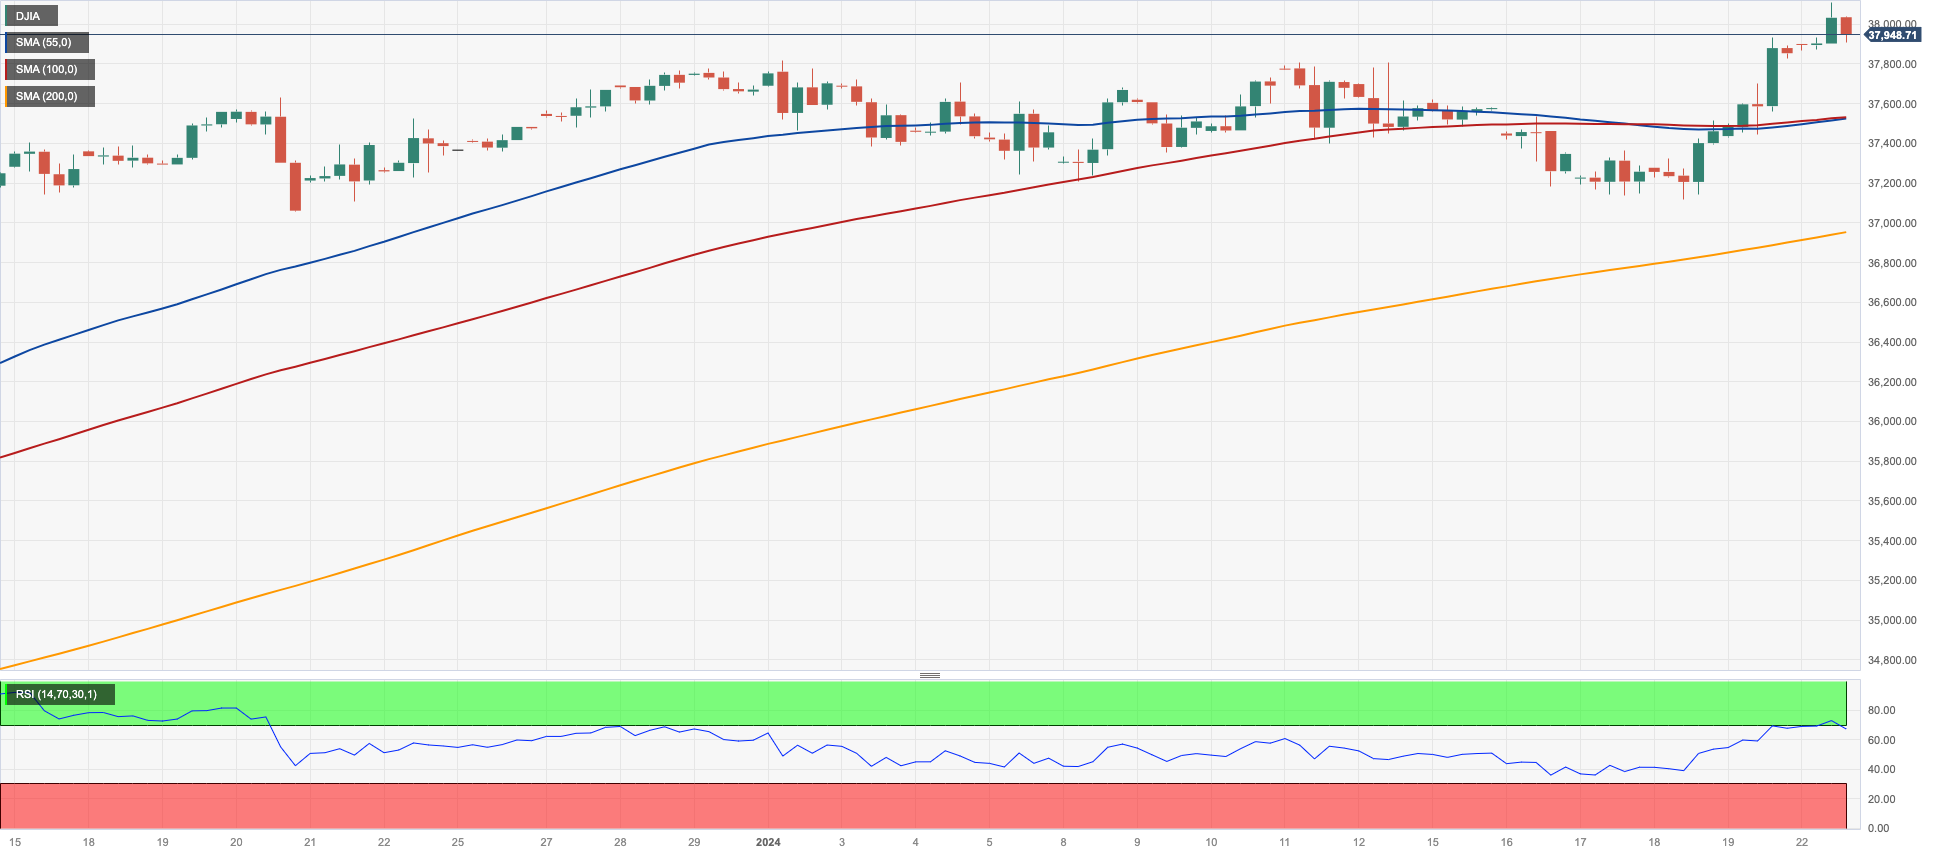
Another day, another record high for US stocks tracked by the reference index Dow Jones, this time exceeding the key barrier at the 38000 level on Monday.
Indeed, FOMO and rising hopes of upbeat corporate earnings reports combined with the strong health of the US economy and expectations of interest rate cuts by the Federal Reserve at some point in Q2 all lent extra support to US equities in a promising start to a new trading week.
On Monday, the Dow Jones gained 0.33% to 37989, the S&P500 advanced 0.31% to 4854, and the tech-centric Nasdaq Composite rose 0.41% to 15374.
Extra gains might drive the Dow Jones to dispute the all-time high of 38109 (January 22). On the other hand, bearish attempts should challenge the 2024 bottom of 37122 (January 18), which comes before the weekly low of 37073 (December 20, 2023) and the December 2023 low of 36010 (December 5). Further losses may bring the 200-day SMA at 34650 into play, ahead of the weekly low of 33859 (November 7, 2023), the October 2023 low of 32327 (October 27), and the 2023 low of 31429 (March 15). The daily RSI rebounded to the proximity of 68.
Top Performers: Walgreen Boots, Walt Disney, UnitedHealth
Worst Performers: Home Depot, Nike, Boeing
Resistance levels: 38109 (4H chart)
Support levels: 37122 37073 36021 (4H chart)
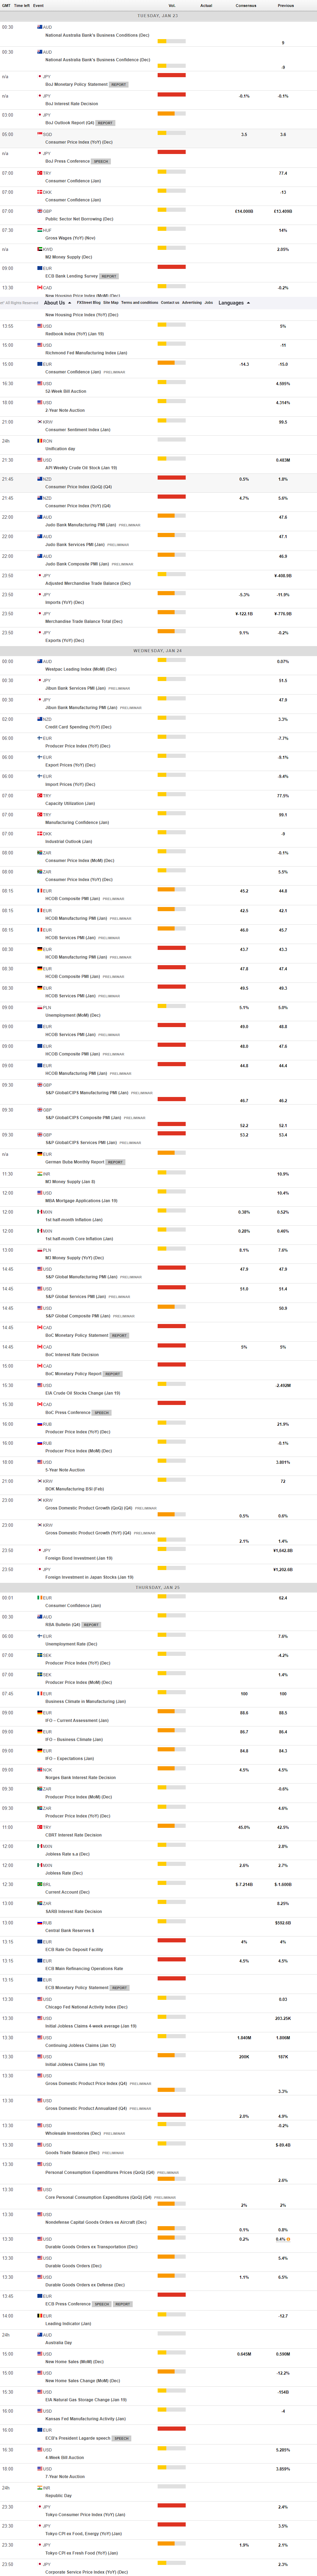
MACROECONOMIC EVENTS
All Information & Updates provided by:

All information relating to the financial markets available on this page has been prepared and issued by FXStreet (Forexstreet SL, Spain, Reg: B62498233) on the basis of publicly available information and all information believed to be reliable and does not conflict with Kuwaiti local laws, and all necessary care has been taken to before the company to ensure that the facts mentioned are correct from the source.
NCM Investment nor any of its directors or employees shall in any way be held responsible for the contents of this news, and the information contained on this page is intended only to provide clients with publicly available information and should not be construed as investment advice, report or analysis and/or constitute an offer or invitation to buy or sell financial instruments of any kind.
RISK WARNING: Forex and CFDs are highly risky leveraged products, as losses can exceed deposits. Please ensure you understand all the risks and take independent advice if necessary. NCM will segregate the clients based on the criteria of the regulator and its bylaws. NCM does not provide any advisory service; the material published does not constitute advice or a recommendation for a transaction in any financial instrument. NCM accepts no responsibility for any use of the content presented and any consequences of that use. Anyone acting on the information provided does so at their own risk.