
- Contact Us:
-

-

-

-


Daily Market Updates
24 Jan 2024
EURUSD
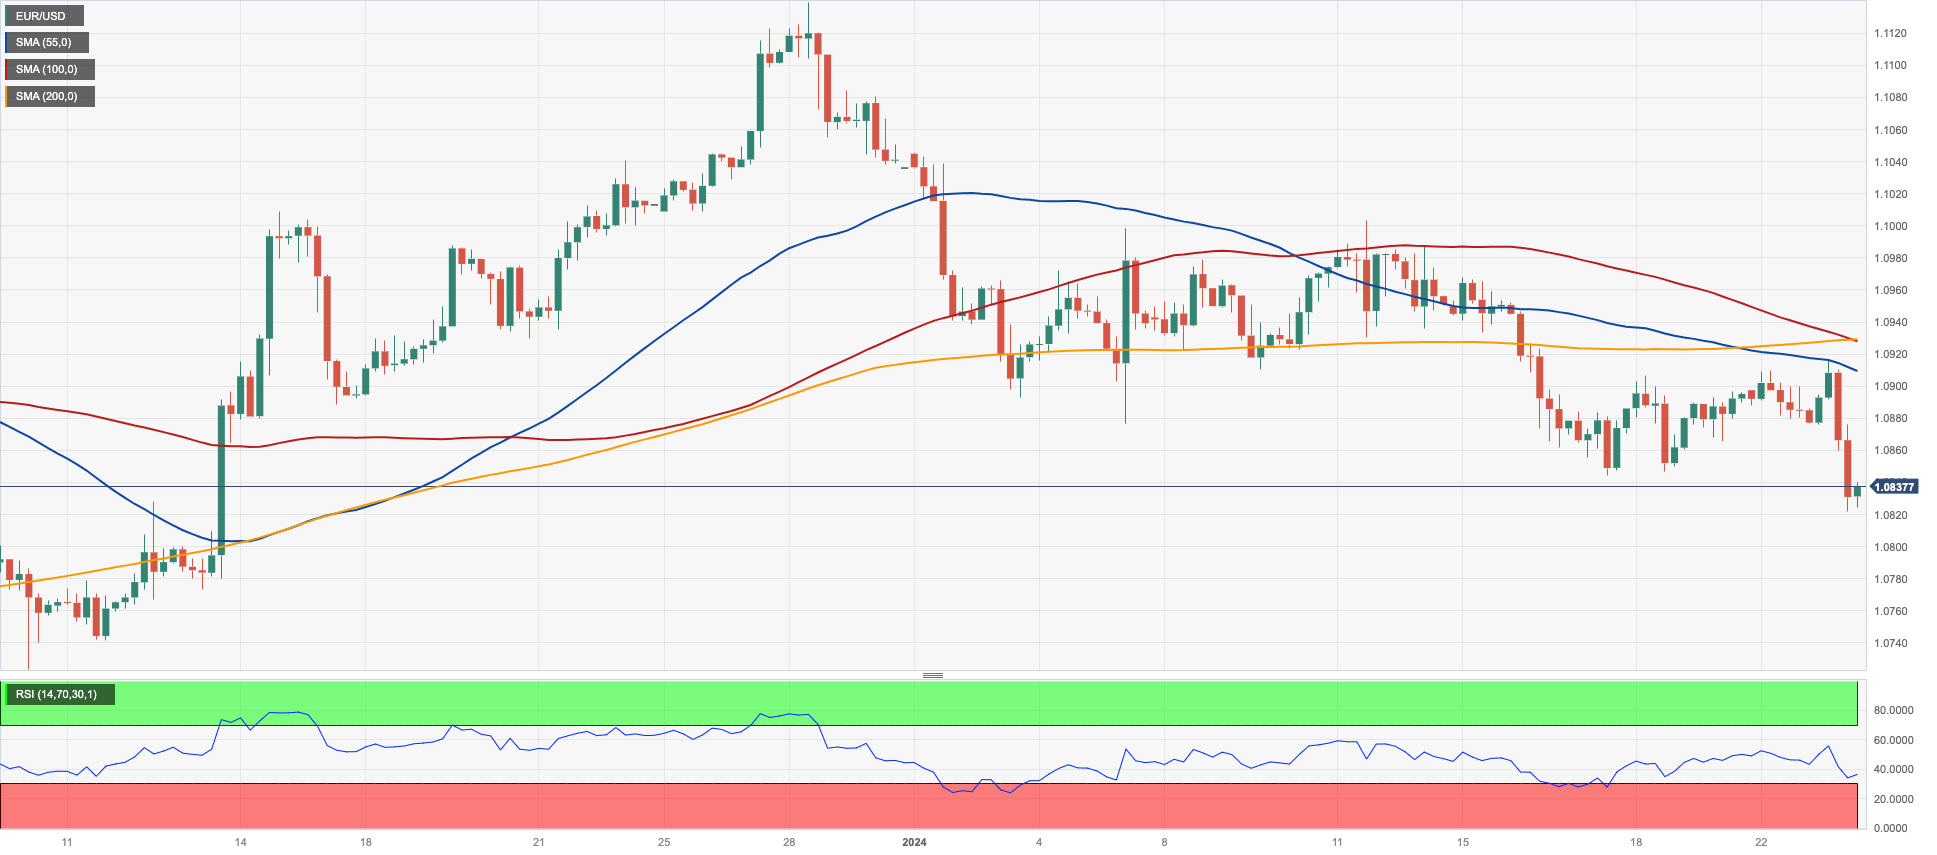
The sharp pick-up in demand for the greenback put EUR/USD under extra downside pressure, dragging it to new multi-week lows in the 1.0820 region on turnaround Tuesday.
On the other side of the coin, the USD Index (DXY) rose to a fresh yearly high, flirting with the 103.80 zone, helped by the move higher in US yields across the curve and the prevailing risk-off mood among market participants.
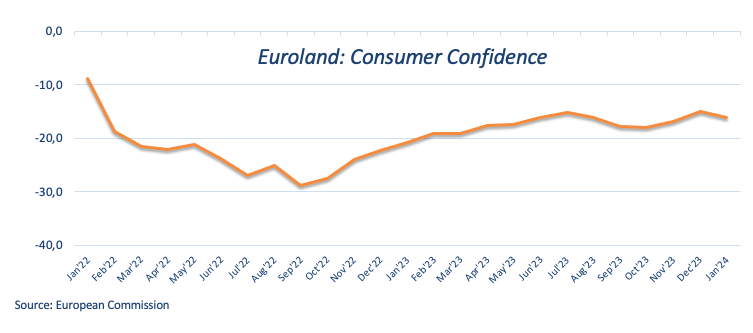
Playing against any recovery in the single currency, the flash Consumer Confidence in the euro area tracked by the European Commission eased to -16.1 for the month of January.
If sellers break below the 2024 low of 1.0821 (January 23), EUR/USD may continue to fall to the transitory 100-day SMA of 1.0771, ahead of the December 2023 bottom of 1.0723 (December 8). The loss of this region indicates a speedier drop to the weekly low of 1.0495 (October 13, 2023), then the 2023 low of 1.0448 (October 3) and the round level of 1.0400. On the upside, there is initial resistance at the weekly high of 1.0998 (January 5, 11) before the December 2023 top of 1.1139 (December 27), which is also supported by the 200-week SMA at 1.1150 and the 2023 peak of 1.1275 (July 18). The daily RSI fell below 40.
Resistance levels: 1.0916 1.0930 1.0998 (4H chart)
Support levels: 1.0821 1.0723 1.0656 (4H chart)
USDJPY
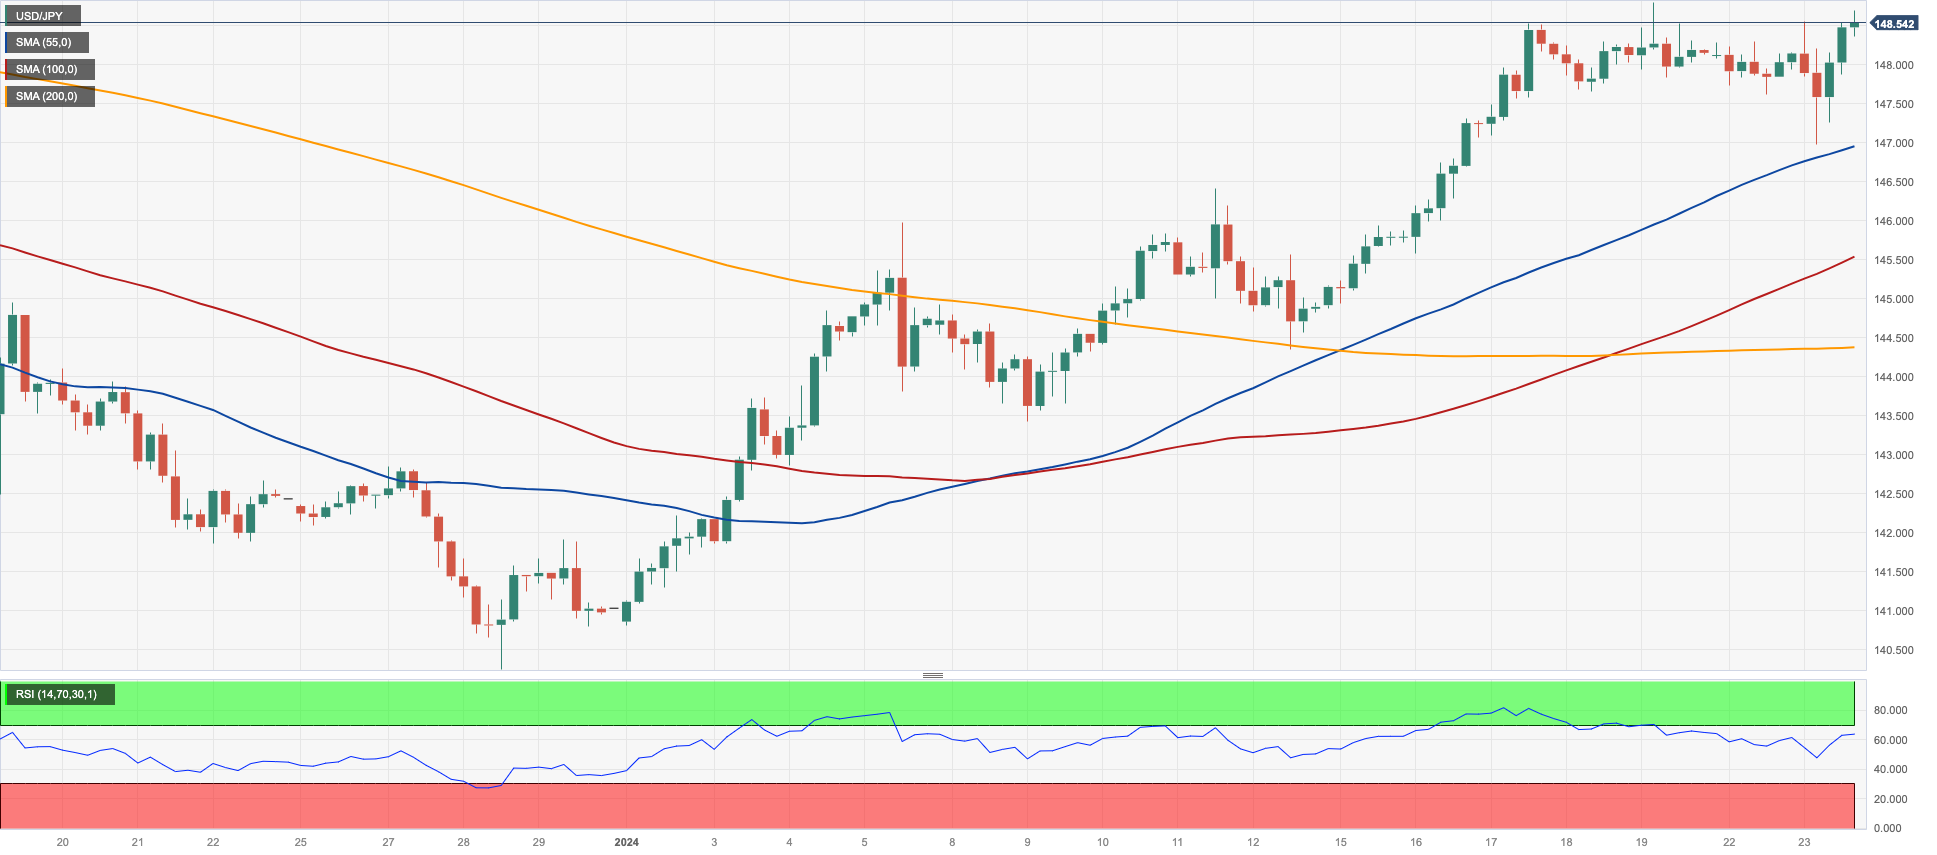
USD/JPY resumed its uptrend and rapidly left behind three sessions of inconclusive price action on Tuesday, managing to trade at shouting distance from the 2024 peaks well past the 148.00 barrier.
Indeed, the depreciation of the Japanese yen gathered extra steam after market participants digested another lack of surprises at the BoJ event early in the Asian trading hours as well as some hawkish comments from Governor Ueda.
On this, the bank revised down its core inflation forecast for FY24 to 2.4% (from 2.8% in October). In contrast, the forecast for FY25 was marginally increased to 1.8%. The core ex-energy inflation forecasts remained unchanged, and there were minor adjustments to the growth forecasts. However, Governor Ueda unsettled financial markets by adopting a less dovish tone. He highlighted that labour unions are seeking higher pay gains in annual wage negotiations and also cautioned about the potential side effects of negative interest rates.
Investors, however, appeared largely unfazed by his comments, opting to dump the yen and push spot higher in the context of rising US and Japanese yields.
Following a new 2024 high of 148.80 (January 18), USD/JPY's next upward objective is the key milestone of 150.00, followed by the 2023 top of 151.90 (November 13). Further up, the 2022 peak of 151.94 (October 21) precedes the round number of 152.00. Instead, if the pair goes below the 200-day SMA of 144.06, it may cause a further pullback to the December 2023 low of 140.24 (December 28), before hitting the round number of 140.00. The July 2023 low of 137.23 (July 14) appears south of here, but the loss of this area will not find much support until the important 130.00 level, which arrives before of the March 2023 low of 129.63 (March 24). The daily RSI climbed past 67.
Resistance levels: 148.80 149.67 151.43 (4H chart)
Support levels: 146.97 145.44 144.34 (4H chart)
GBPUSD
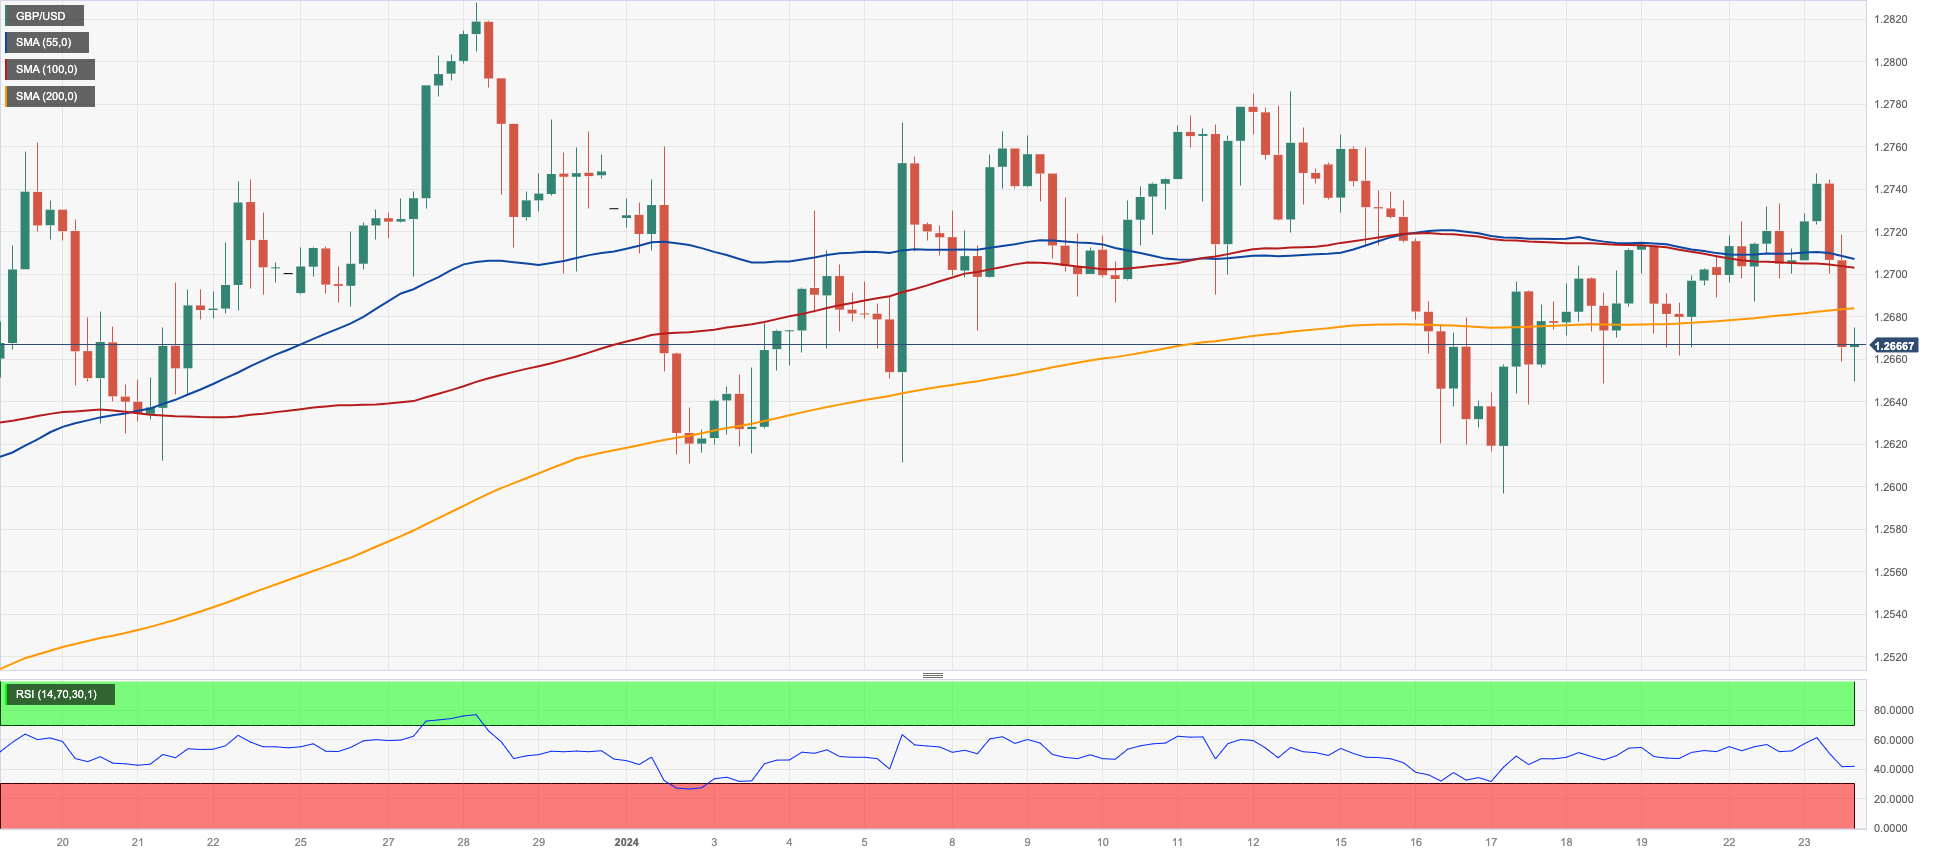
Matching the rest of the risk-associated universe, GBP/USD faded Monday’s small bullish attempt and retreated to multi-session lows in the mid-1.2600s on Tuesday.
Once again, the resurgence of the buying interest in the US dollar maintained potential rebounds in risky assets in check and their price action subdued.
In the domestic money market, 10-year gilt yields revisited the key 4.0% mark for the first time since early December.
In the UK, Public Sector Net Borrowing shrank to £6.85B in December.
Further upward pressure may see GBP/USD rise to the December 2023 high of 1.2827 (December 28), seconded by the weekly top of 1.2995 (July 27, 2023), which is just shy of the key 1.3000 yardstick. On the other side, the pair may return the so-far 2024 low of 1.2596 (January 17), before the critical 200-day SMA at 1.2549 and the December 2023 bottom of 1.2500 (December 13). Extra weakness may cause Cable to challenge the weekly low of 1.2187 (November 10, 2023), ahead of the October 2023 low of 1.2037 (October 3), the key 1.2000 level, and the 2023 bottom of 1.1802 (November 10, 2023). The day-to-day RSI receded to the sub-48 zone.
Resistance levels: 1.2747 1.2785 1.2827 (4H chart)
Support levels: 1.2649 1.2596 1.2500 (4H chart)
GOLD
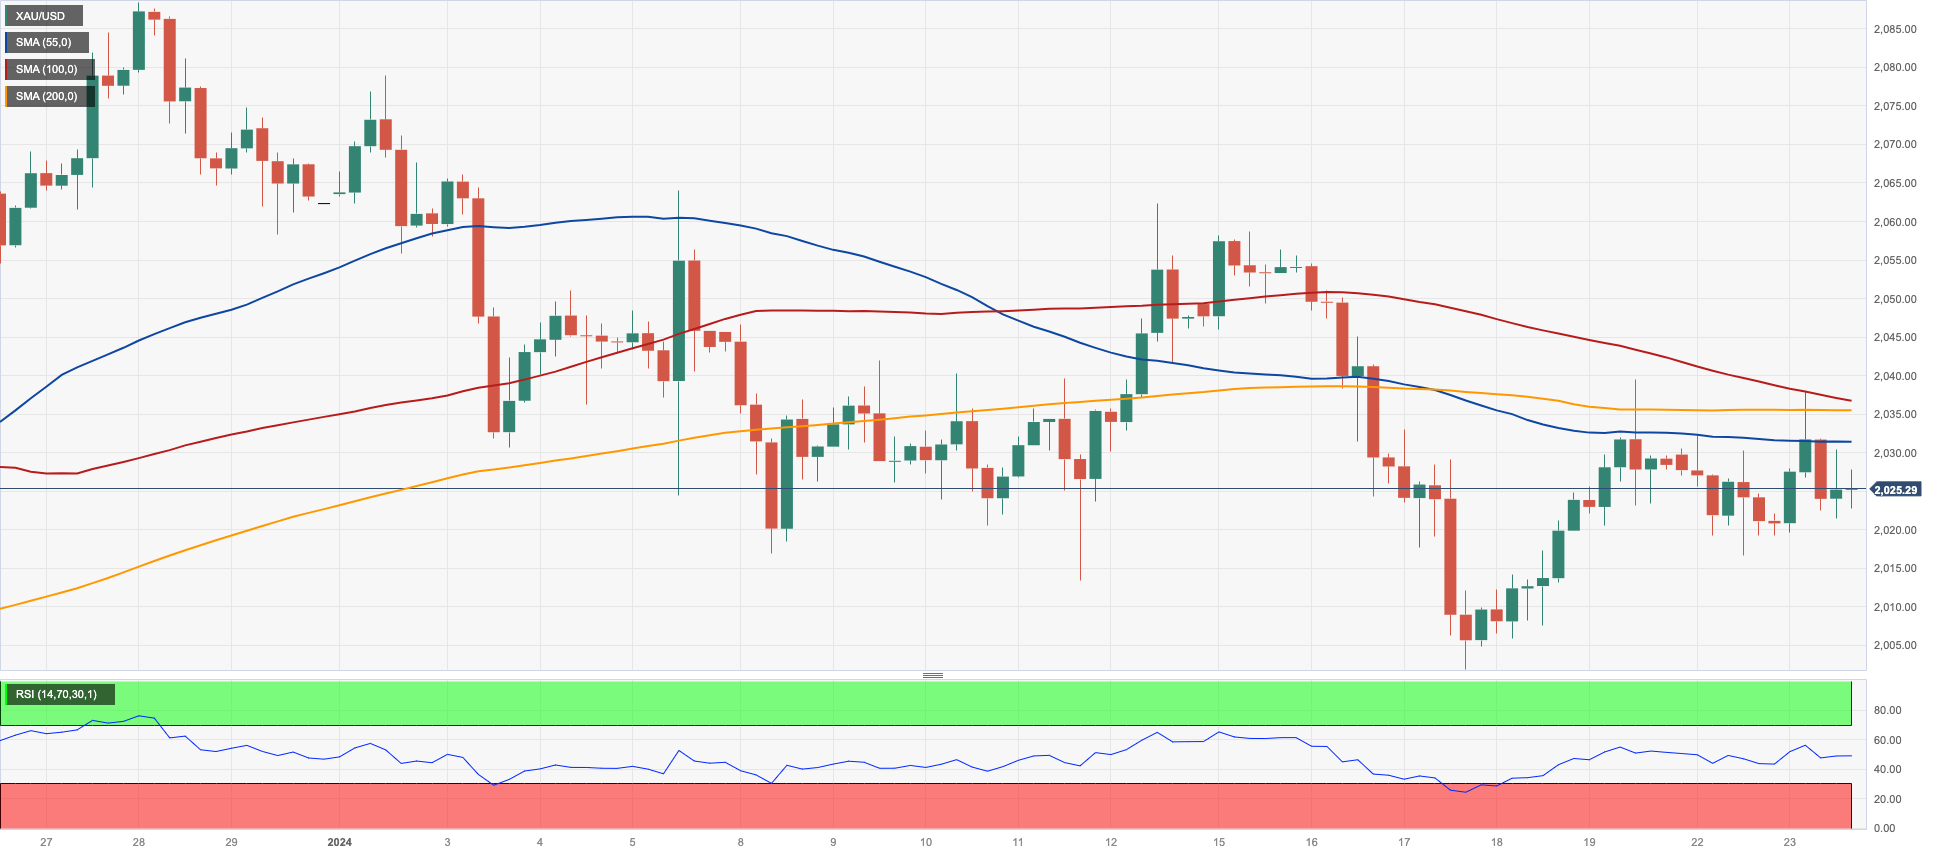
Prices of the yellow metal regained some balance and advanced modestly on Tuesday, setting aside the disheartening start of the week.
Slight gains in the yellow metal came despite investors’ preference for the greenback and the rebound in US yields across different maturities.
In the meantime, bullion is expected to remain under scrutiny in light of interest rate decisions by central banks later in the week, key US data releases, and the unabated geopolitical effervescence.
Extra losses might cause Gold to retest its 2024 level of $2001, which remains bolstered by the crucial $2000 region. If this zone breaks down, prices may fall to the December 2023 low of $1973, followed by the 200-day SMA at $1963 and the November 2023 low of $1931. In the event of more losses, the price may retest the October 2023 low of $1810, followed by the 2023 low of $1804 and maybe the $1800 level. Having said that, the first up-barrier equals the weekly high of $2088 (December 28) before the all-time record of $2150 (December 4, 2023).
Resistance levels: $2039 $2062 $2078 (4H chart)
Support levels: $2001 $1973 $1965 (4H chart)
CRUDE WTI
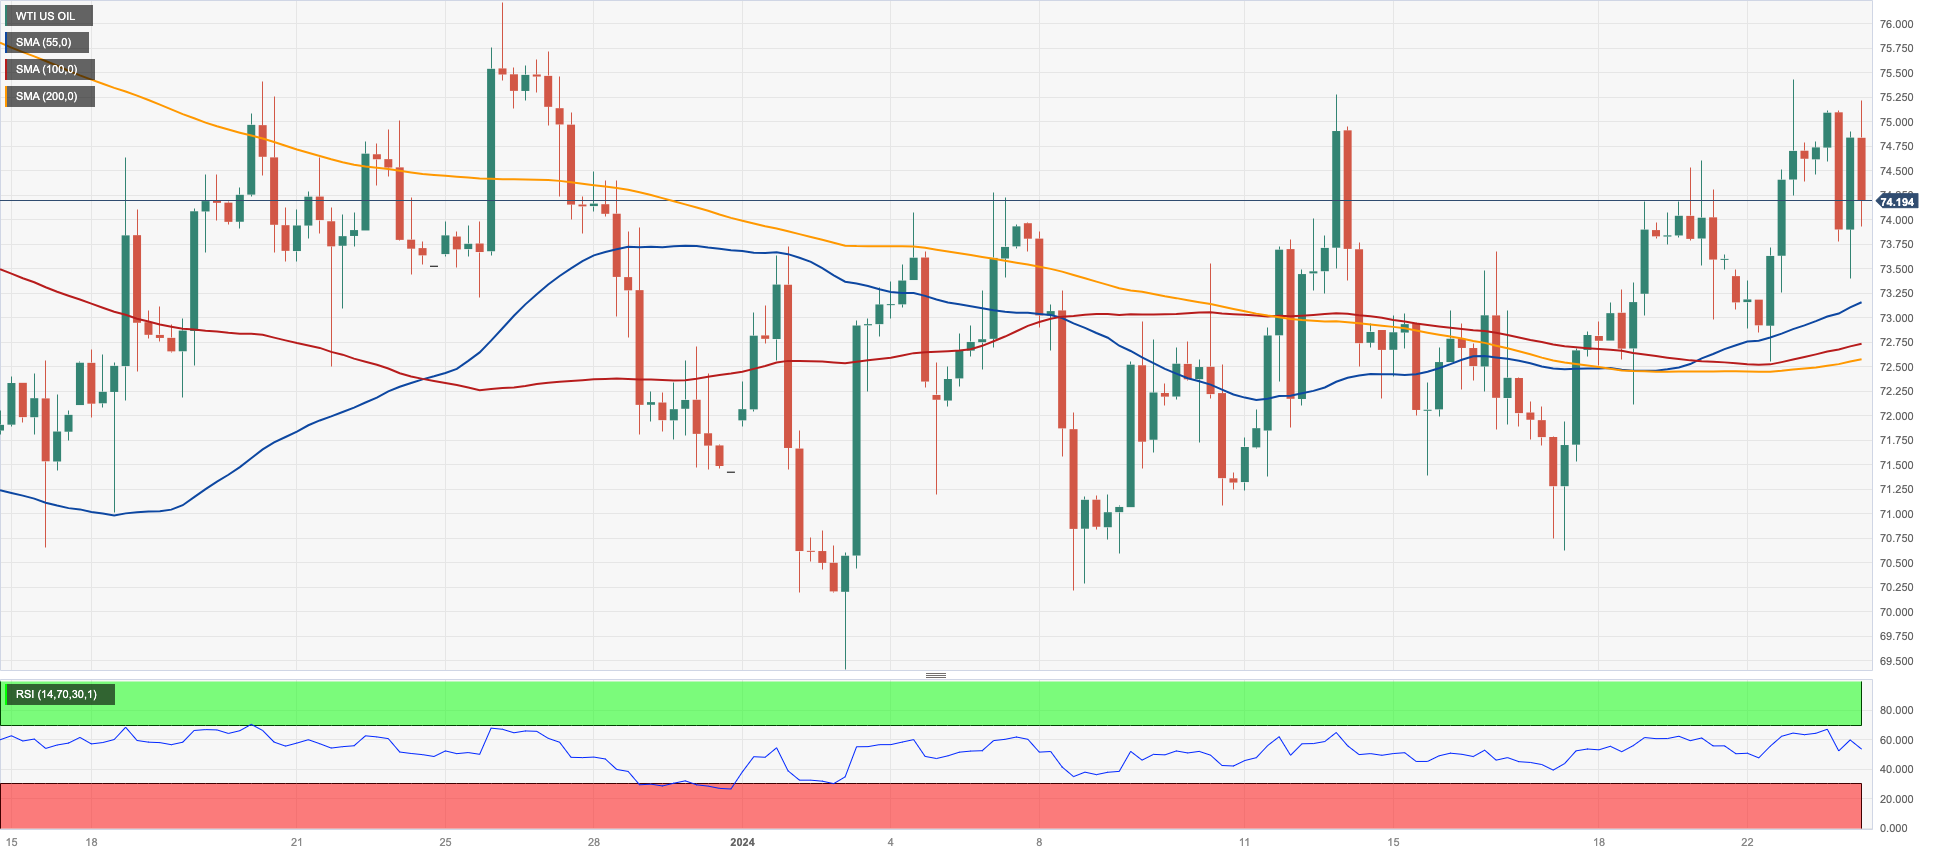
Prices of the American benchmark for the sweet light crude oil faded part of Monday’s uptick and charted small losses on Tuesday.
That said, WTI prices remained on the defensive as traders factored in demand concerns and prospects of interest rate cuts now later than anticipated by the Fed and the ECB, while geopolitical jitters and still weather-related issues in the US (North Dakota) seem to have limited daily losses.
Also weighing on the commodity, Libya’s Sharara oilfield resumed its activity over the weekend, while Norway announced a higher-than-expected increase in its oil production during December (+1.85 mbpd).
Immediately to the upside for WTI is the weekly high of $76.14 (December 26, 2023), followed by the crucial 200-day SMA at $77.52, the $80.00 barrier, and the November 2023 top of $80.15 (November 3). Further gains from here may take the market back to its weekly peak of $89.83 (October 18, 2023), ahead of the 2023 high of $94.99 (September 28, 2023) and the August 2022 high of $97.65 (August 30), all before reaching the psychological $100.00 threshold. On the other hand, the next support level is the 2024 low of $69.31 (January 3), which precedes the December 2023 low of $67.74 (December 13). Down from here aligns the June 2023 bottom of $66.85 (June 12) prior to the 2023 low of $63.61.
Resistance levels: $75.42 $76.14 $79.56 (4H chart)
Support levels: $70.59 $69.25 $67.68 (4H chart)
GER40
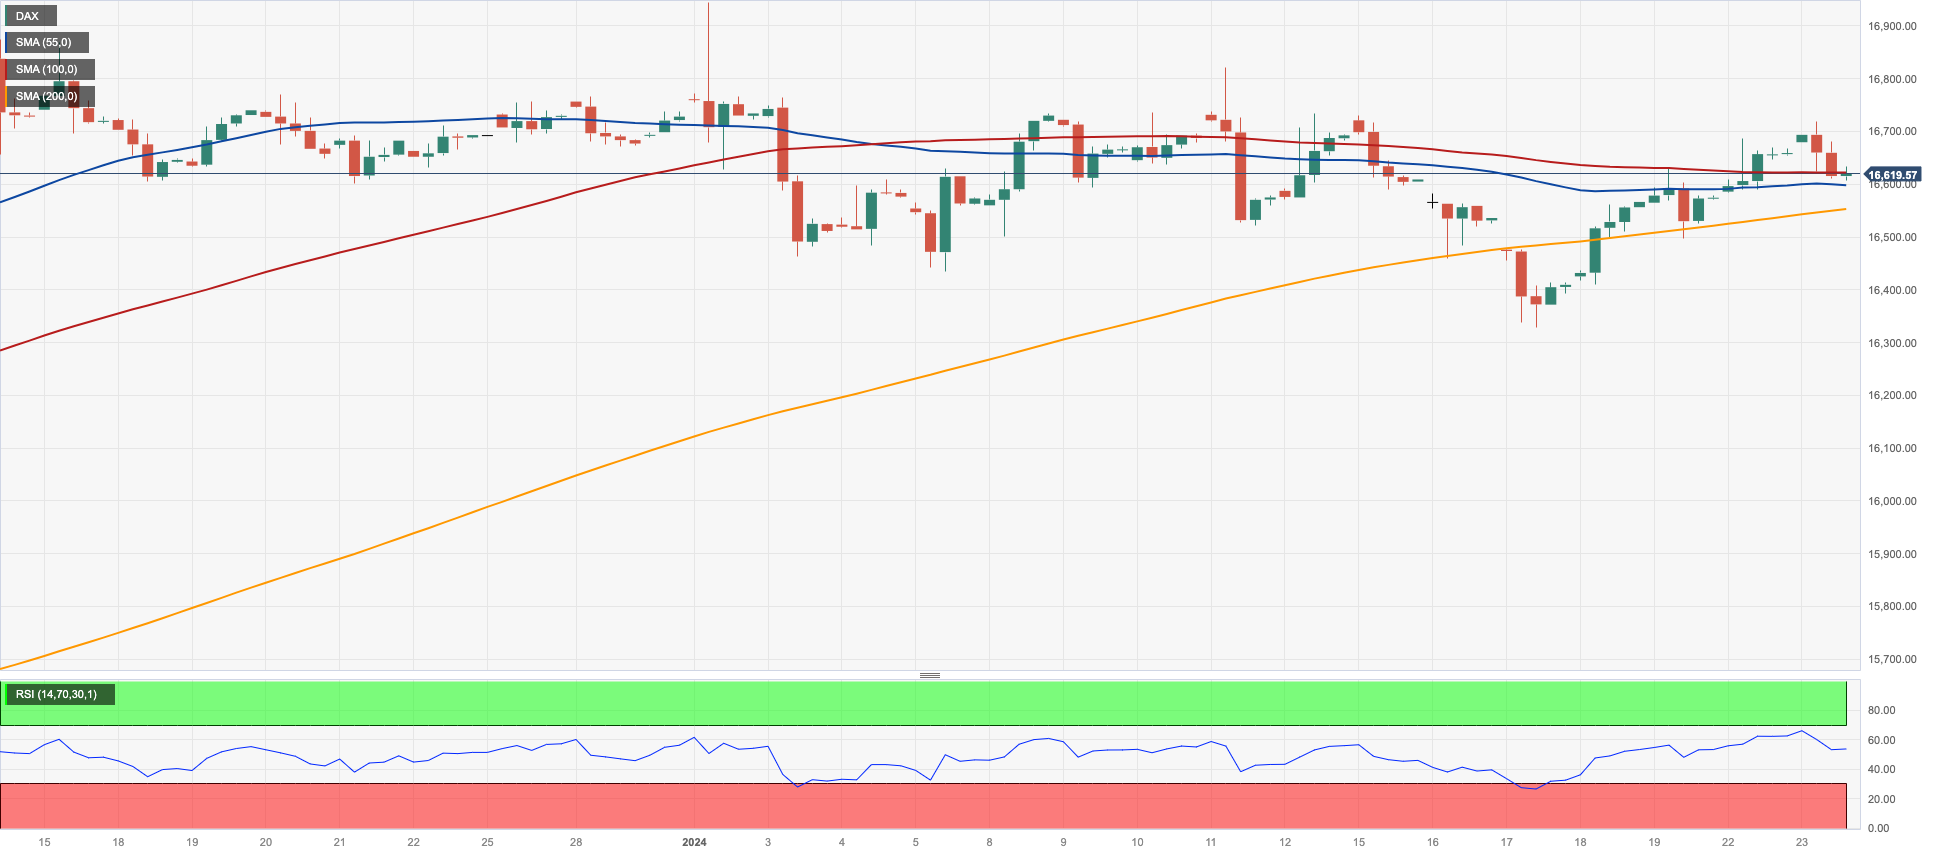
The German stock reference DAX40 could not sustain the earlier move to multi-day highs past the 16700 barrier and eventually gave all those gains to close Tuesday’s session with modest losses around 16600.
The risk-off environment motivated sellers to return to the market and drag equities lower, while pre-ECB prudence also kicked in, contributing to the cautious trade.
The daily pullback in the domestic stock market also came in contrast with the advance in the 10-year bund yields to fresh tops past 2.35%, the highest level since early December 2023.
The DAX40's immediate downward target is the so-far 2024 low of 16345 (January 17), ahead of the weekly low of 15915 (November 28), which looks to be supported by the critical 200-day SMA of 15907. The October 2023 low of 14630 (October 23) comes next, before the March 2023 low of 14458 (March 20). The other way around, the initial up-barrier corresponds with the 2024 top of 16963 (January 2) prior to the all-time peak of 17003 (December 14). The daily RSI receded to the proximity of 53.
Best Performers: Volkswagen VZO, Zalando SE, MTU Aero
Worst Performers: Heidelbergcement, Rheinmetall AG, Brenntag AG
Resistance levels: 16753 16839 16963 (4H chart)
Support levels: 16345 16039 15915 (4H chart)
GBPJPY
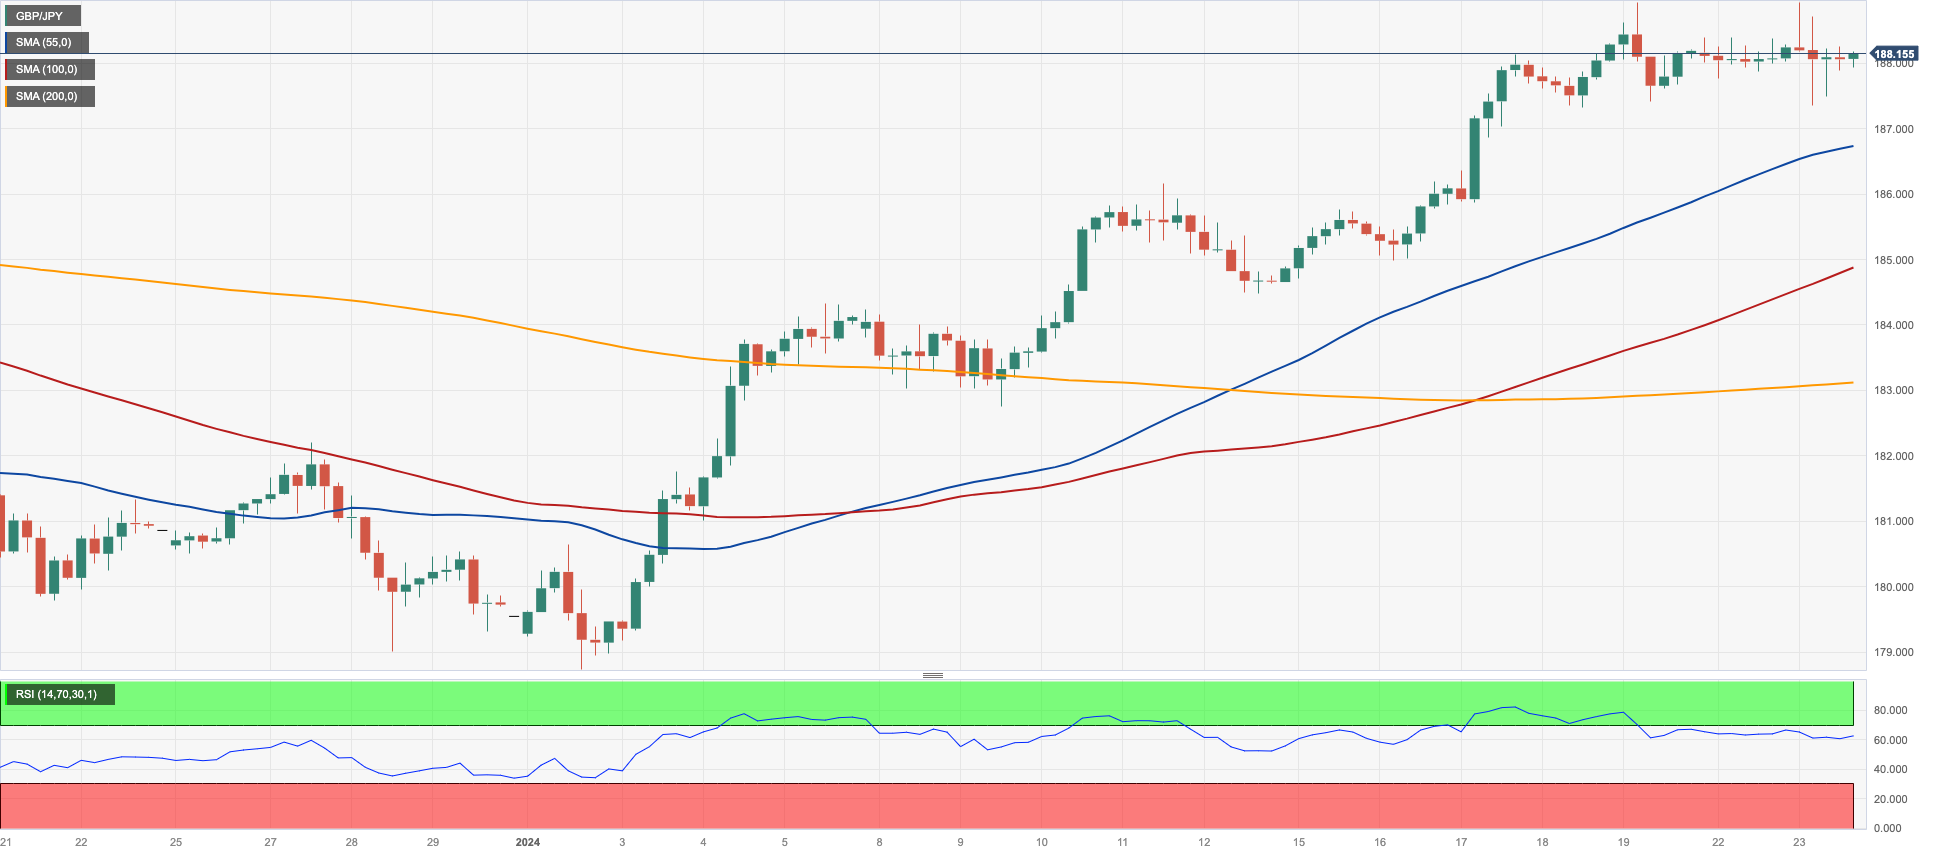
Further indecisive price action left GBP/JPY hovering around the 188.00 region on Tuesday, extending the somewhat consolidative phase in the upper end of the current range.
Price action around the cross followed the increased selling pressure around both the British pound and the Japanese yen, in a context clearly dominated by the strong performance of the US dollar.
GBP/JPY achieved a new 2024 top of 188.93 on January 19. A rise over this level might lead to a test of the round number of 190.00 prior to the August 2015 peak of 195.28 (August 18). In the opposite direction, short-term support exists at the 55-day and 100-day SMAs of 184.58 and 183.72, respectively, ahead of the more important 200-day SMA of 180.75. The breach of the latter exposes the December 2023 low of 178.33 (December 14), which comes before the October 2023 low of 178.03 (October 3) and the July 2023 low of 176.30, all ahead of the May 2023 low of 167.84 (May 11). The daily RSI appears to be consistent, hovering little below 67.
Resistance levels: 188.93 189.99 195.28 (4H chart)
Support levels: 187.35 184.97 184.47 (4H chart)
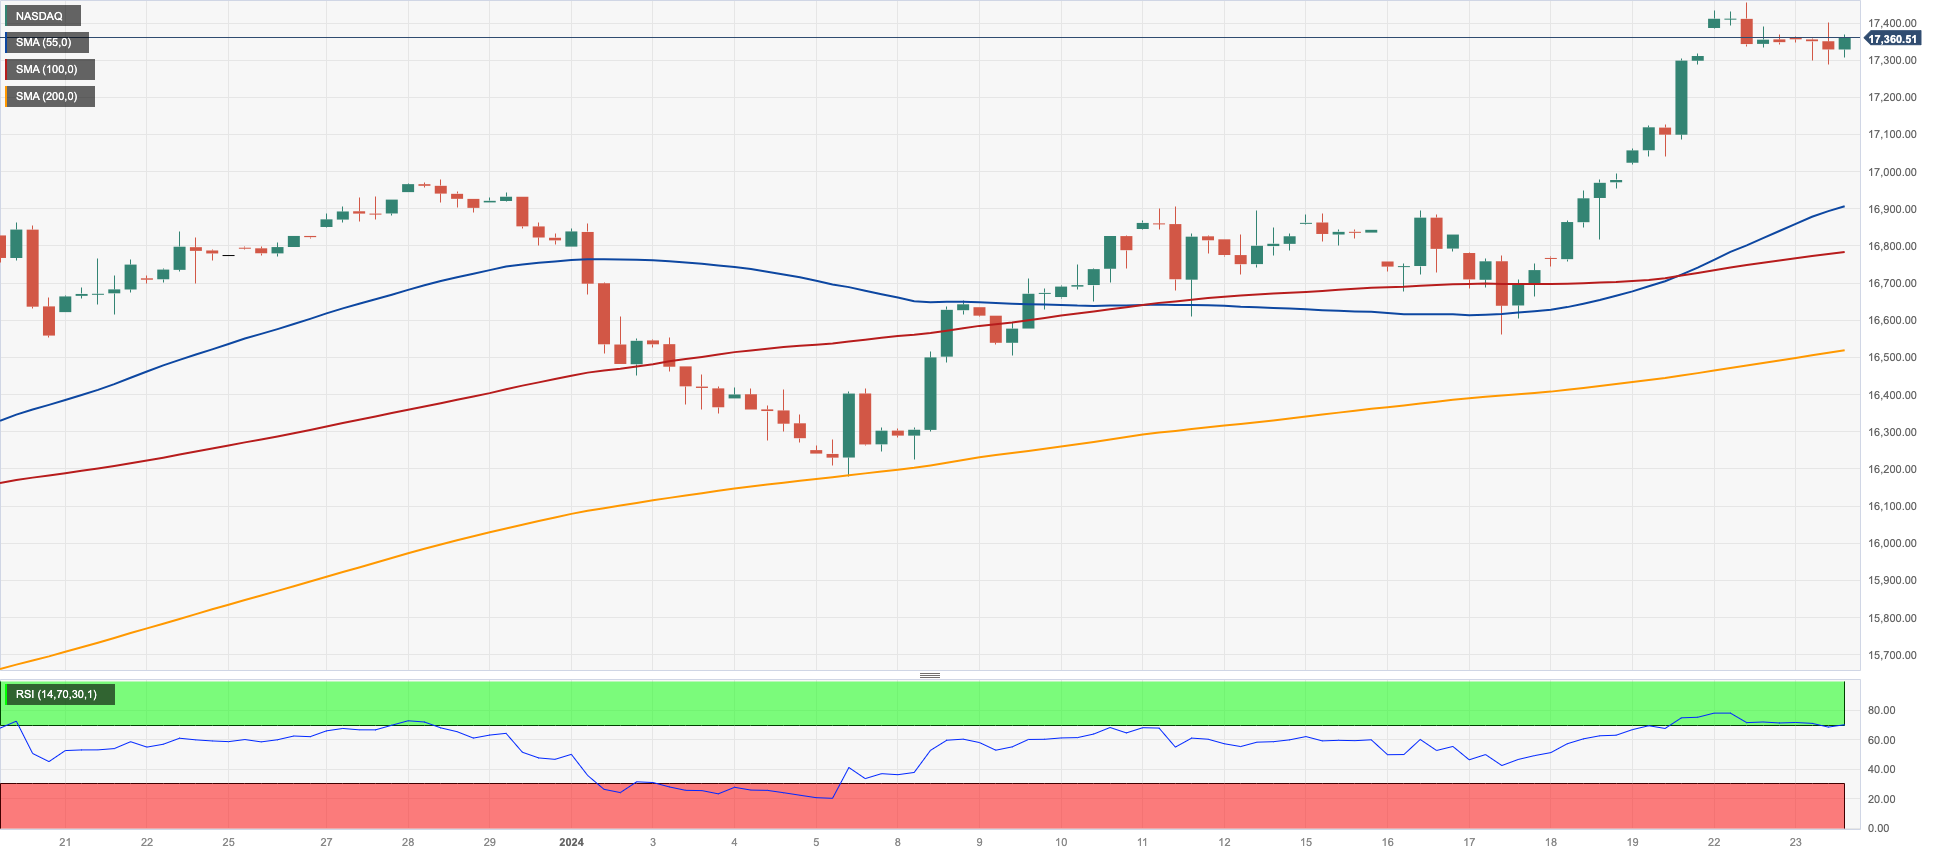
NASDAQ
The US tech sector extended its promising start of the week, printing humble gains and keeping the trade well above the 17000 barrier on Tuesday.
Optimism in the sector remained well in place as investors continued to target AI-linked stocks amidst hopes of positive earnings reports, all surrounded by persistent speculation about the Fed’s rate cut in May.
Limiting the upside, however, emerged the solid performance of the greenback and the marked bounce in US yields, particularly in the belly and the long end of the curve.
On January 22, the Nasdaq set a new record high of 17450 points. Corrective moves, on the other hand, should aim for the 2024 bottom of 16249 (January 5), which precedes the December 2023 low of 15695 (December 4) and the crucial 200-day SMA of 15049. A drop below the latter may prompt a regression to the October 2023 bottom of 14058 (October 26), which comes ahead of the April 2023 low of 12724 (April 25), the March 2023 low of 11695 (March 13), and the 2023 low of 10696 (January 3). The RSI for the day soared over 72, moving farther into the overbought zone.
Top Gainers: Globalfoundries, Fortinet, PACCAR
Top Losers: Datadog, GE HealthCare, Micron
Resistance levels: 17450 (4H chart)
Support levels: 16561 16249 15695 (4H chart)
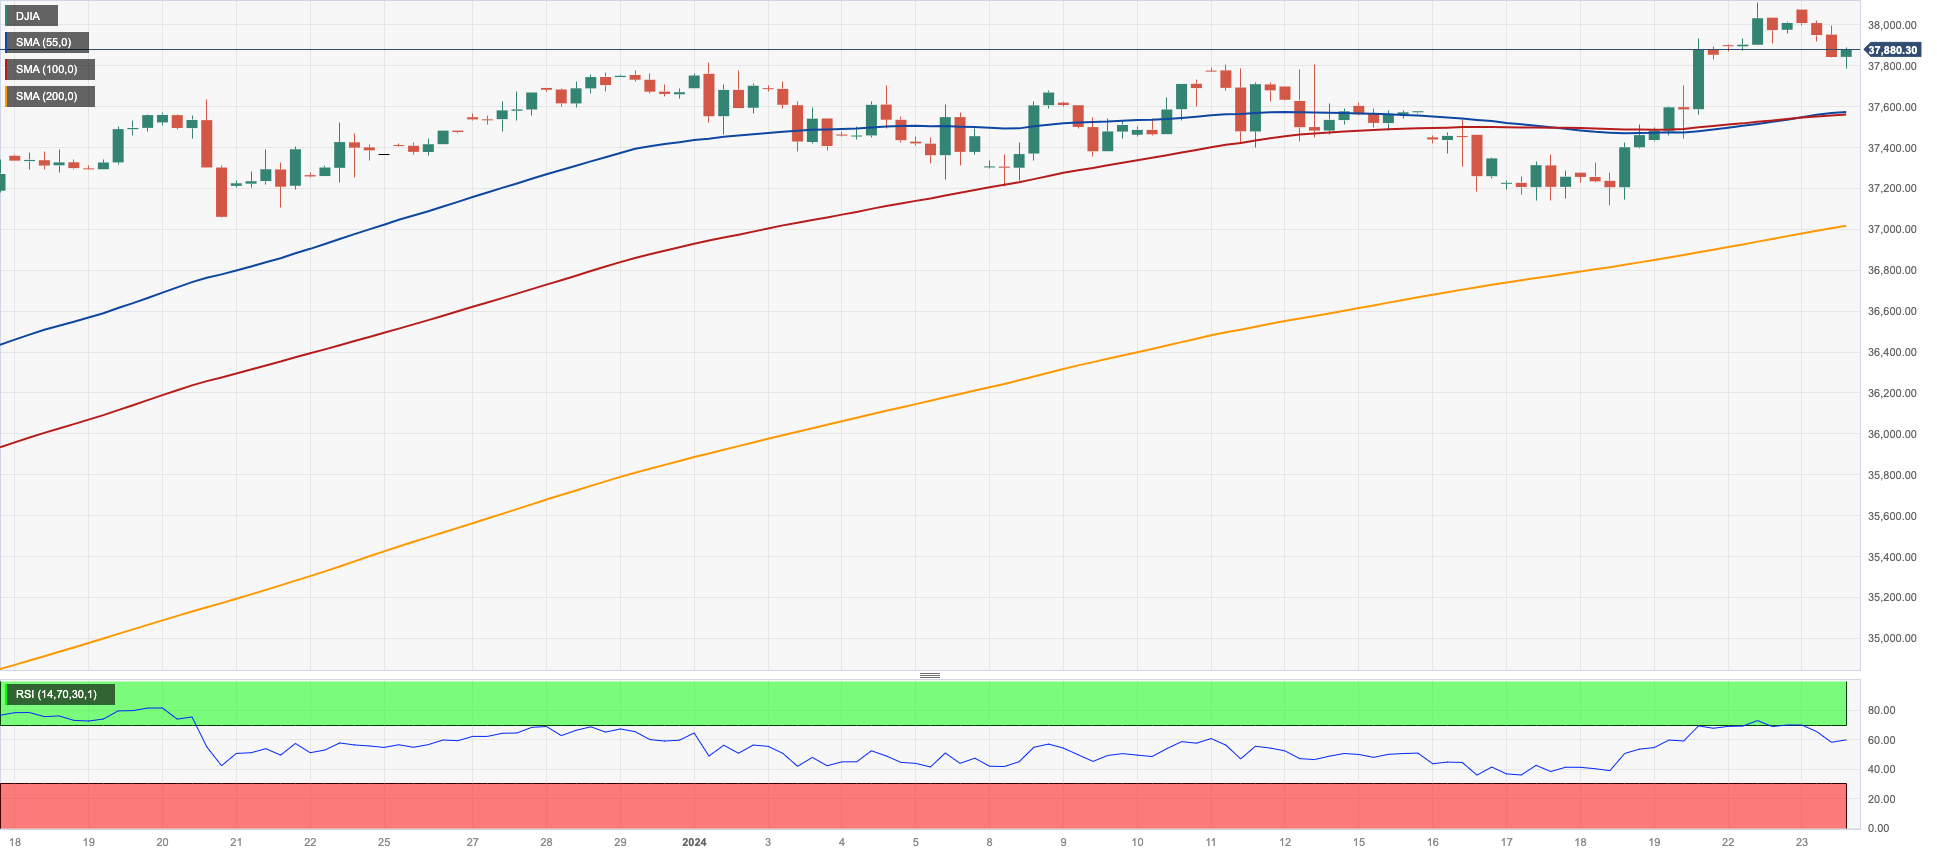
DOW JONES
The key Dow Jones halted its three-session positive streak and printed humble losses on Tuesday, returning to the 37800 zone after hitting levels beyond the 38000 threshold for the first time in its history during the previous session.
The daily knee-jerk in the Dow Jones emerged in response to rising cautiousness ahead of upcoming corporate earnings reports in an atmosphere where the likelihood of a soft landing in the US economy and probable interest rate cuts by the Fed in May continued to underpin the broader optimistic scenario.
All in all, the Dow Jones dropped 0.34% to 37876, the S&P500 gained 0.06% to 4853, and the tech-heavy Nasdaq Composite advanced 0.12% to 15377.
Extra gains might push the Dow Jones to confront its all-time high of 38109 (January 22). Having said that, there is immediate contention at the 2024 bottom of 37122 (January 18), which comes before the weekly low of 37073 (December 20, 2023) and the December 2023 low of 36010 (December 5). Further losses might put the 200-day SMA at 34672 into play, ahead of the weekly low of 33859 (November 7, 2023), the October 2023 low of 32327 (October 27), and the 2023 low of 31429 (March 15). The daily RSI broke below 65.
Top Performers: Verizon, Procter&Gamble, Nike
Worst Performers: 3M, Goldman Sachs, Travelers
Resistance levels: 38109 (4H chart)
Support levels: 37122 37073 36021 (4H chart)
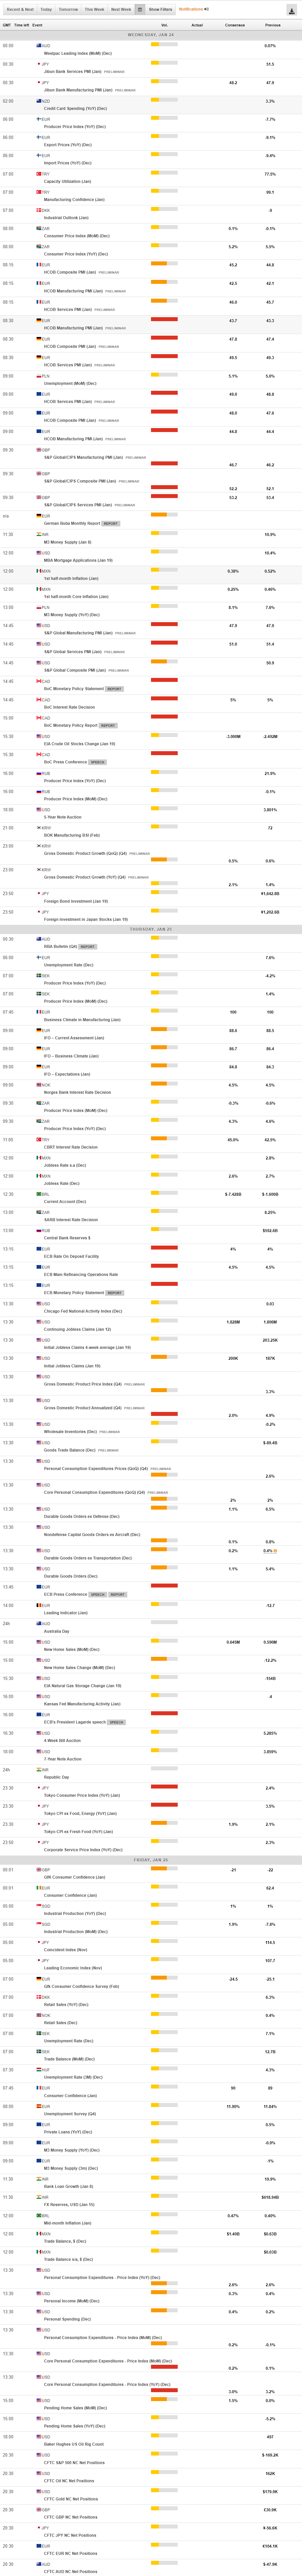
MACROECONOMIC EVENTS
All Information & Updates provided by:

All information relating to the financial markets available on this page has been prepared and issued by FXStreet (Forexstreet SL, Spain, Reg: B62498233) on the basis of publicly available information and all information believed to be reliable and does not conflict with Kuwaiti local laws, and all necessary care has been taken to before the company to ensure that the facts mentioned are correct from the source.
NCM Investment nor any of its directors or employees shall in any way be held responsible for the contents of this news, and the information contained on this page is intended only to provide clients with publicly available information and should not be construed as investment advice, report or analysis and/or constitute an offer or invitation to buy or sell financial instruments of any kind.
RISK WARNING: Forex and CFDs are highly risky leveraged products, as losses can exceed deposits. Please ensure you understand all the risks and take independent advice if necessary. NCM will segregate the clients based on the criteria of the regulator and its bylaws. NCM does not provide any advisory service; the material published does not constitute advice or a recommendation for a transaction in any financial instrument. NCM accepts no responsibility for any use of the content presented and any consequences of that use. Anyone acting on the information provided does so at their own risk.