
- Contact Us:
-

-

-

-


Daily Market Updates
26 Jan 2024
EURUSD
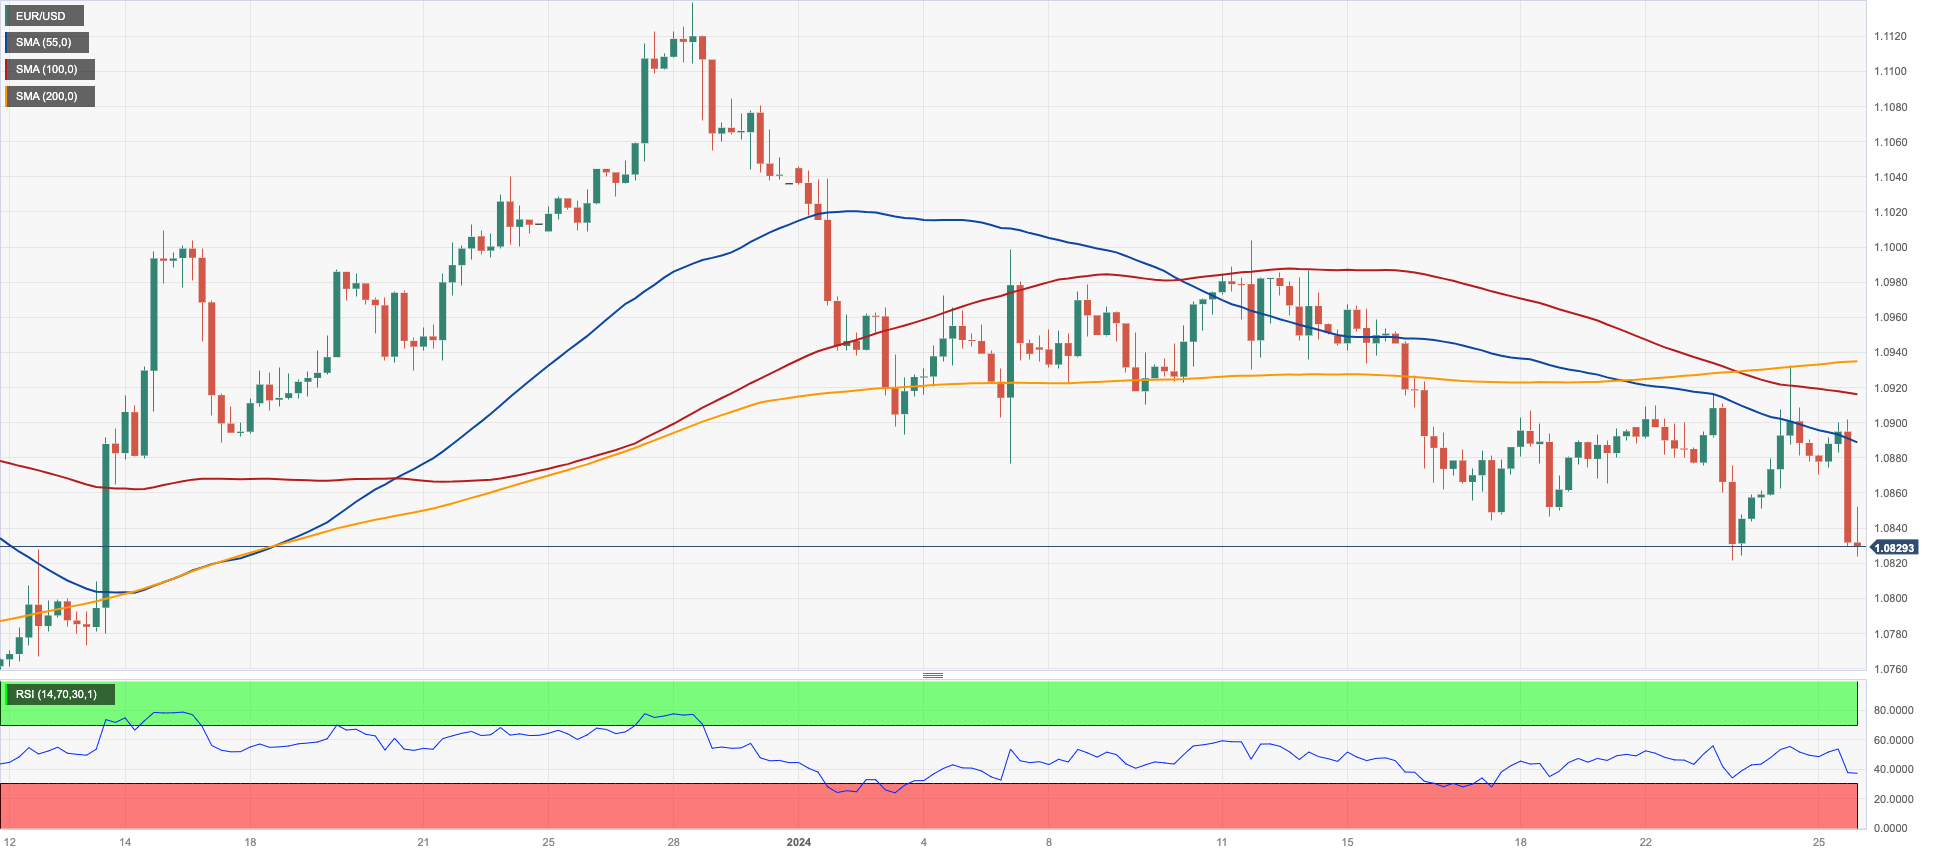
The renewed and strong buying bias in the greenback put the risk complex under further pressure, forcing EUR/USD to approach the area of yearly lows near 1.0820 on Thursday.
The sharp drop in spot was in tandem with the unemotional ECB event, which saw the central bank keep its policy rates unchanged, as broadly telegraphed, and President Lagarde strike a passive tone at her press conference.
On the latter, Chair Lagarde highlighted the importance of data dependency for the central bank and reaffirmed her previous remarks regarding interest rates, possibly indicating a potential cut in the summer. She emphasized that the risks to economic growth are skewed towards the downside and expressed the hope that any wage increases would be adequately absorbed by profits. Lagarde also mentioned that there is a consensus among the members that it is premature to discuss rate cuts at this time.
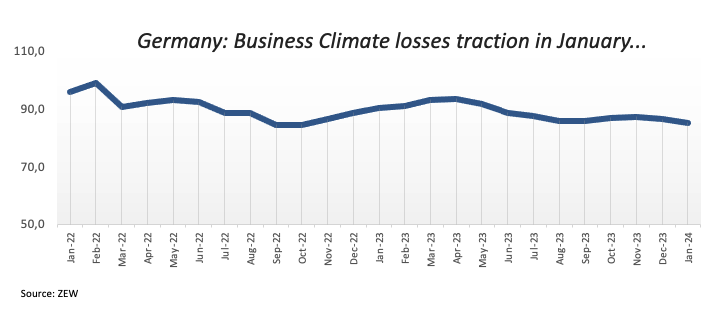
Adding to the weakness surrounding the European currency, the Business Climate in Germany receded a tad to 82.5 for the month of January, according to the IFO institute.
Further strength in the dollar was once again underpinned by solid data in key fundamentals. This time, advanced GDP figures showed the economy expanded more than estimated by 3.3% in the October–December period.
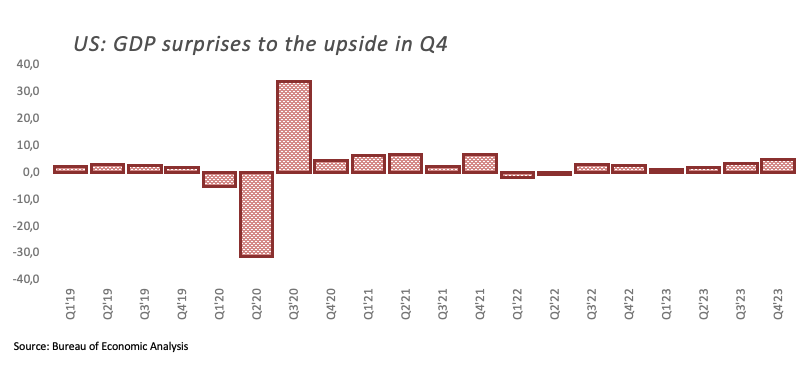
Additional US data showed the Chicago Fed National Activity Index dropped to -0.15 in December, weekly Claims rose by 214K in the week to January 20, Durable Goods Orders came in flat on a monthly basis in December and New Home Sales expanded by 8.0% during the last month of 2023 (0.664M units).
If sellers break below the 2024 low of 1.0821 (January 23), EUR/USD might fall lower and retest the transitory 100-day SMA of 1.0774, ahead of the December 2023 bottom of 1.0723 (December 8). The loss of this region indicates a speedier drop to the weekly low of 1.0495 (October 13, 2023), then the 2023 low of 1.0448 (October 3) and the round level of 1.0400. On the other hand, there is early resistance at the weekly high of 1.0998 (January 5, 11), before the December 2023 top of 1.1139 (December 27), which is also supported by the 200-week SMA at 1.1149 and comes prior to the 2023 peak of 1.1275. (July 18). The daily RSI slipped back to the 40 region.
Resistance levels: 1.0932 1.0998 1.1139 (4H chart)
Support levels: 1.0821 1.0723 1.0656 (4H chart)
USDJPY
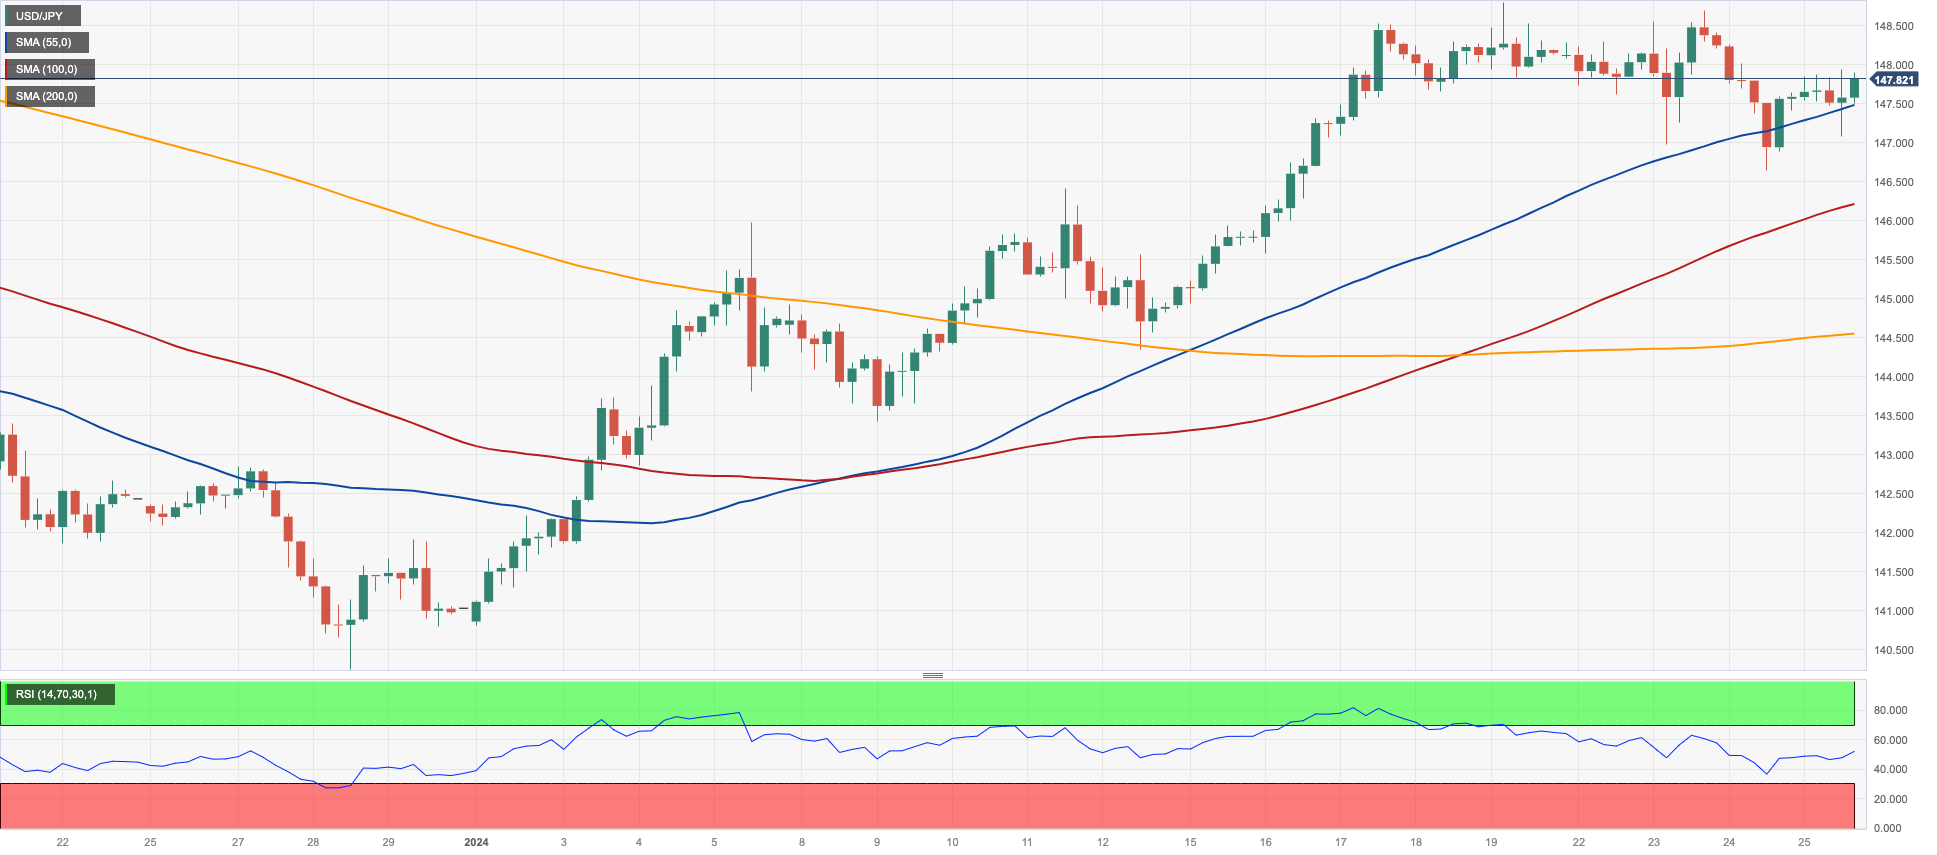
The Japanese yen gave away part of Wednesday’s gains and prompted USD/JPY to edge higher and flirt with the key hurdle at 148.00 the figure on Thursday.
Price action around spot was amidst marked gains in the dollar, which were particularly magnified after flash US Q4 GDP figures came in above estimates.
Limiting the upside, however, US yields retreated across the curve vs. further gains in JGB 10-year yields, which rose to multi-week highs beyond 0.75%.
In the domestic docket, Foreign Bond Investment shrank by ¥48B in the week to January 20.
Immediately to the upside for USD/JPY aligns the 2024 peak of 148.80 (January 18), ahead of the key milestone of 150.00, and followed by the 2023 high of 151.90 (November 13). Further up, the 2022 top of 151.94 (October 21) precedes the round number of 152.00. Instead, if the pair goes below the provisional 55-day SMA at 146.19 it could then retest the 200-day SMA of 144.19, prior to the December 2023 low of 140.24 (December 28), and the round number of 140.00. The July 2023 low of 137.23 (July 14) appears south of here, but the loss of this area will not find much support until the important 130.00 level, which happens before the March 2023 low of 129.63 (March 24). The daily RSI surpassed the 61 mark.
Resistance levels: 148.80 149.67 151.43 (4H chart)
Support levels: 146.65 145.75 144.34 (4H chart)
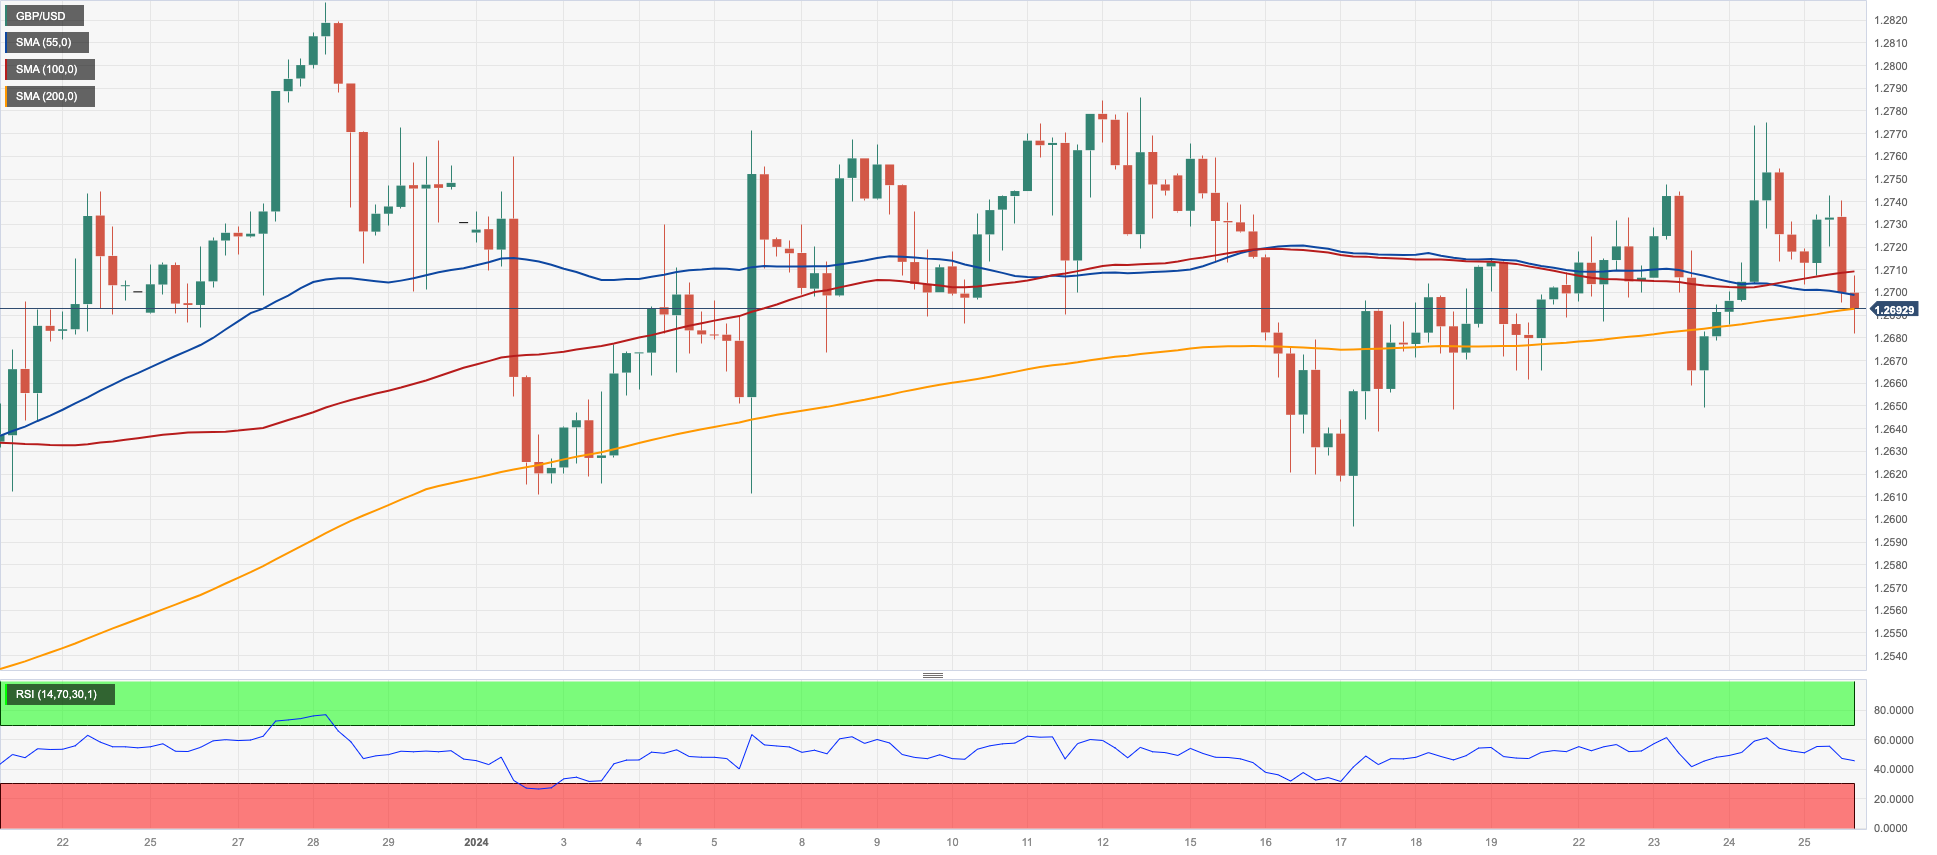
GBPUSD
GBP/USD came under USD-led downside pressure and broke below the 1.2700 support level on Thursday, fading Wednesday’s decent advance and maintaining the weekly erratic mood well in place.
In fact, firmer data from the US calendar reinvigorated the sentiment around the dollar, also helped by the apathetic ECB meeting, where the central bank matched consensus and left its benchmark rates intact.
On the UK bond market, 10-year gilt yields reversed two daily advances in a row and traded slightly on the defensive below 4.0%.
Data-wise, in the UK, Car Production expanded by 20.7% in the year to December, and CBI Distributive Trades worsened to -50 in January.
The breakout of the 2024 top at 1.2785 (January 12) could pave the way for a possible rise to the December 2023 peak of 1.2827 (December 28), followed by the weekly high of 1.2995 (July 27, 2023), which is just shy of the critical 1.3000 mark. On the other side, GBP/USD meets first contention at the so-far 2024 low of 1.2596 (January 17), ahead of the crucial 200-day SMA at 1.2552 and the December 2023 bottom of 1.2500 (December 13). Extra weakness may drive spot to confront the weekly low of 1.2187 (November 10, 2023), ahead of the October 2023 low of 1.2037 (October 3), the crucial 1.2000 level, and the 2023 bottom of 1.1802 (November 10, 2023). The day-to-day RSI dropped to the vicinity of 52.
Resistance levels: 1.2774 1.2785 1.2827 (4H chart)
Support levels: 1.2681 1.2649 1.2596 (4H chart)
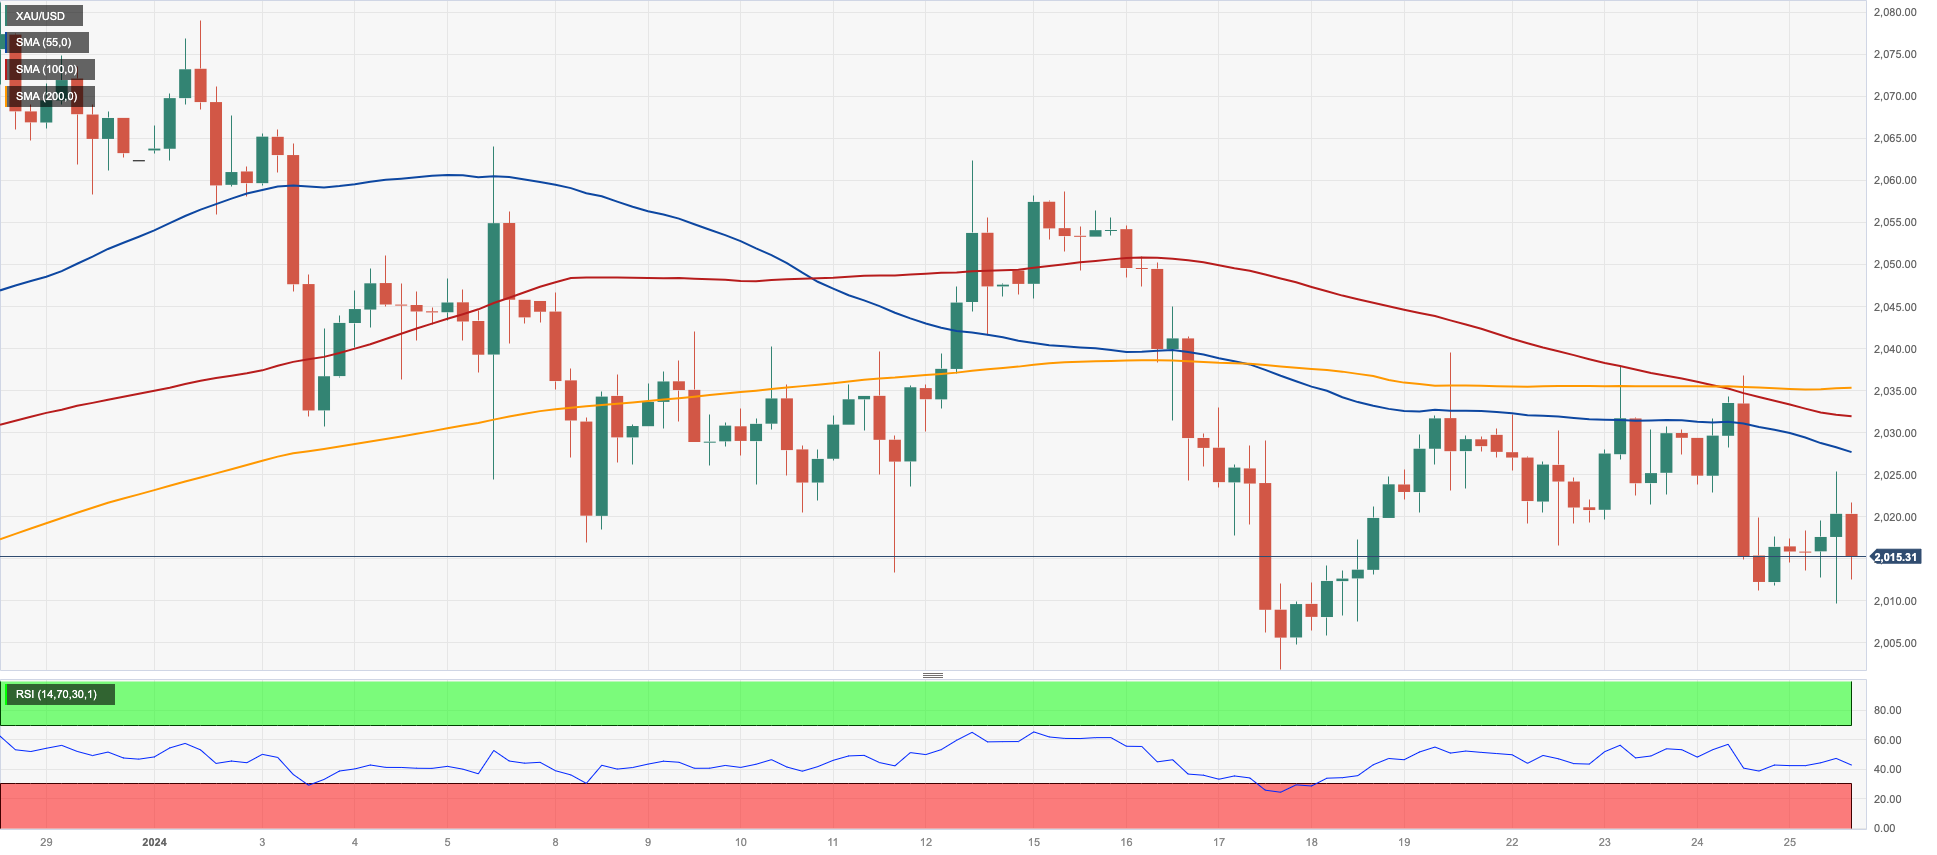
GOLD
Prices of the troy ounce of the precious metal barely differed from Wednesday’s closing levels in the $2015 region on Thursday.
In fact, the data-driven bounce in the greenback put bullion under some pressure, although the late drop in US yields across the board seems to have bolstered a tepid rebound in gold.
A glimpse at Friday’s session should maintain the yellow metal under scrutiny in light of the publication of US inflation figures, this time measured by the PCE for the month of December.
Extra losses may cause Gold to revisit its 2024 level of $2001, which is still supported by the crucial $2000 zone. If this zone breaks down, prices may fall to the December 2023 low of $1973, followed by the 200-day SMA at $1963 and the November 2023 low of $1931. In the event of more losses, the price may retest the October 2023 low of $1810, then the 2023 low of $1804, and maybe the $1800 level. Having said that, the first up-barrier equals the weekly high of $2088 (December 28), before the all-time top of $2150 (December 4, 2023).
Resistance levels: $2039 $2062 $2078 (4H chart)
Support levels: $2009 $2001 $1973 (4H chart)
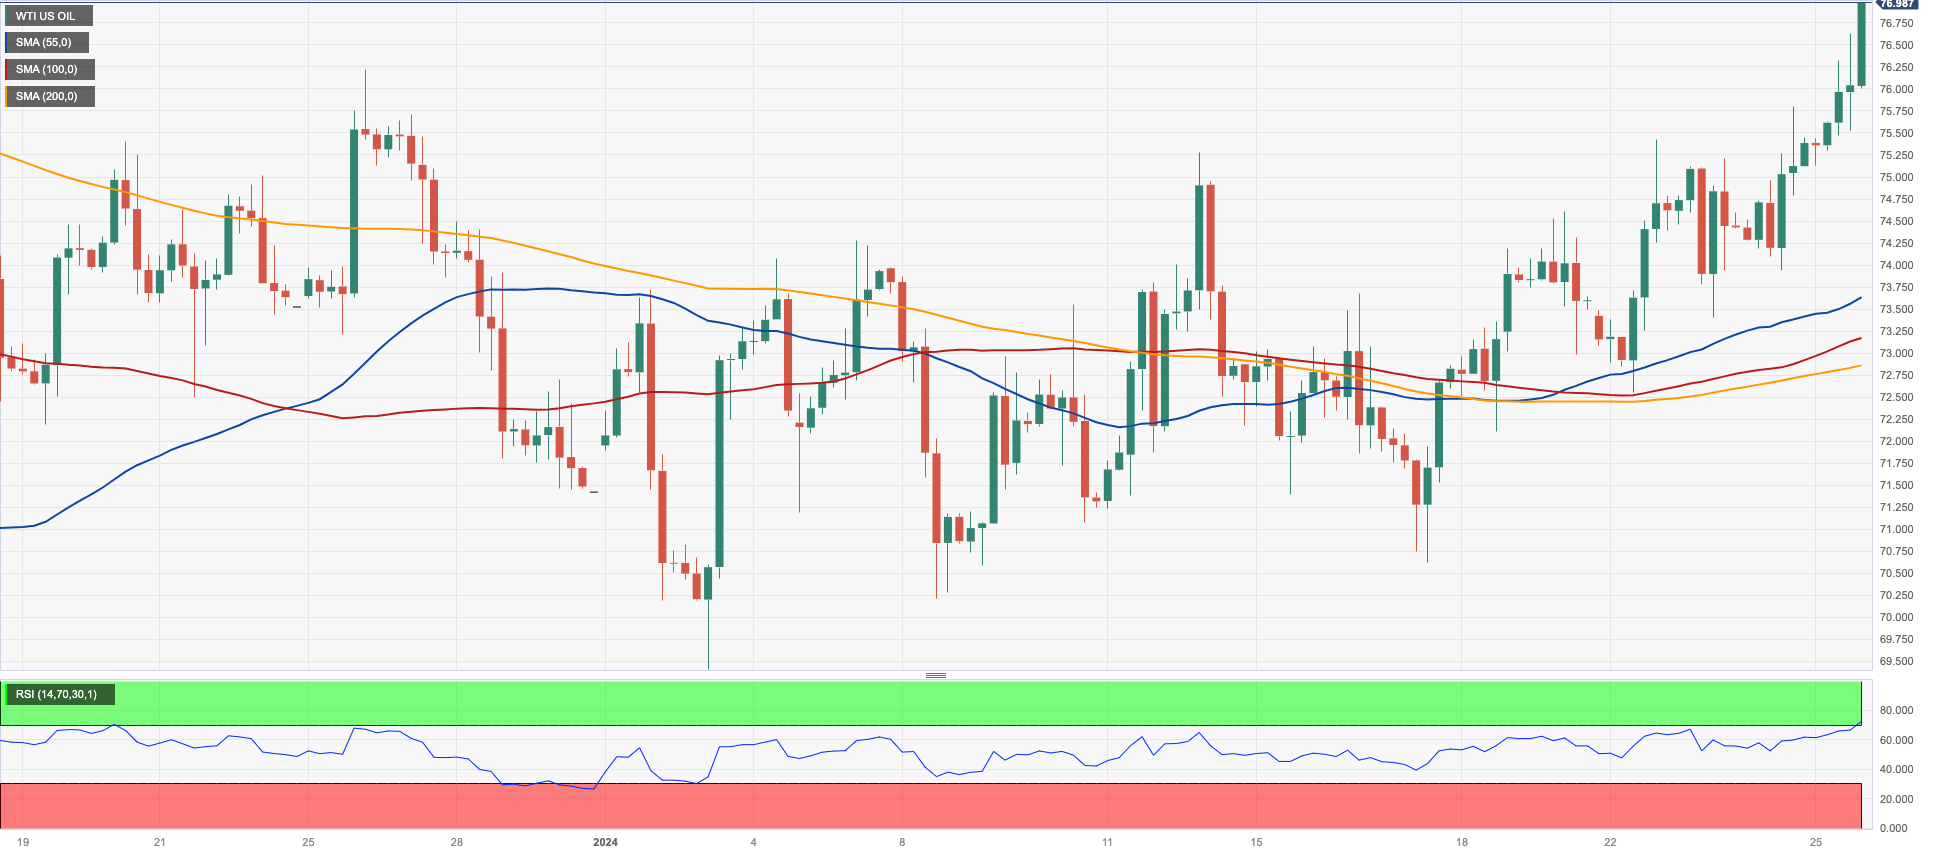
CRUDE WTI
Prices of the West Texas Intermediate (WTI) rose to a new two-month peak around the $77.00 mark per barrel on Thursday.
WTI added to Wednesday’s uptick on the back of omnipresent geopolitical concerns in the Middle East and the Red Sea, at a time when traders continued to digest the larger-than-expected drop in US crude oil inventories, as per the EIA’s report in the previous session (-9.233M barrels).
Also bolstering the upside appeared fresh hopes of an economic rebound in China, a view that was particularly reinvigorated in response to the latest measure by the PBoC, which further reduced its RRR.
Immediately to the upside for WTI is the 2024 high of $76.91 (January 25), closely followed by the crucial 200-day SMA at $77.47. Further up comes the $80.00 barrier, ahead of the November 2023 top of $80.15 (November 3). Extra gains from here may send the market back to its weekly peak of $89.83 (October 18, 2023), seconded by the 2023 high of $94.99 (September 28, 2023) and the August 2022 top of $97.65 (August 30), all before reaching the critical $100.00 level. On the flip side, the next support level is the 2024 low of $69.31 (January 3), which comes before the December 2023 low of $67.74 (December 13). Down from here, the June 2023 bottom of $66.85 (June 12) emerges prior to the 2023 low of $63.61.
Resistance levels: $77.00 $79.56 $83.56 (4H chart)
Support levels: $73.38 $72.53 $70.59 (4H chart)
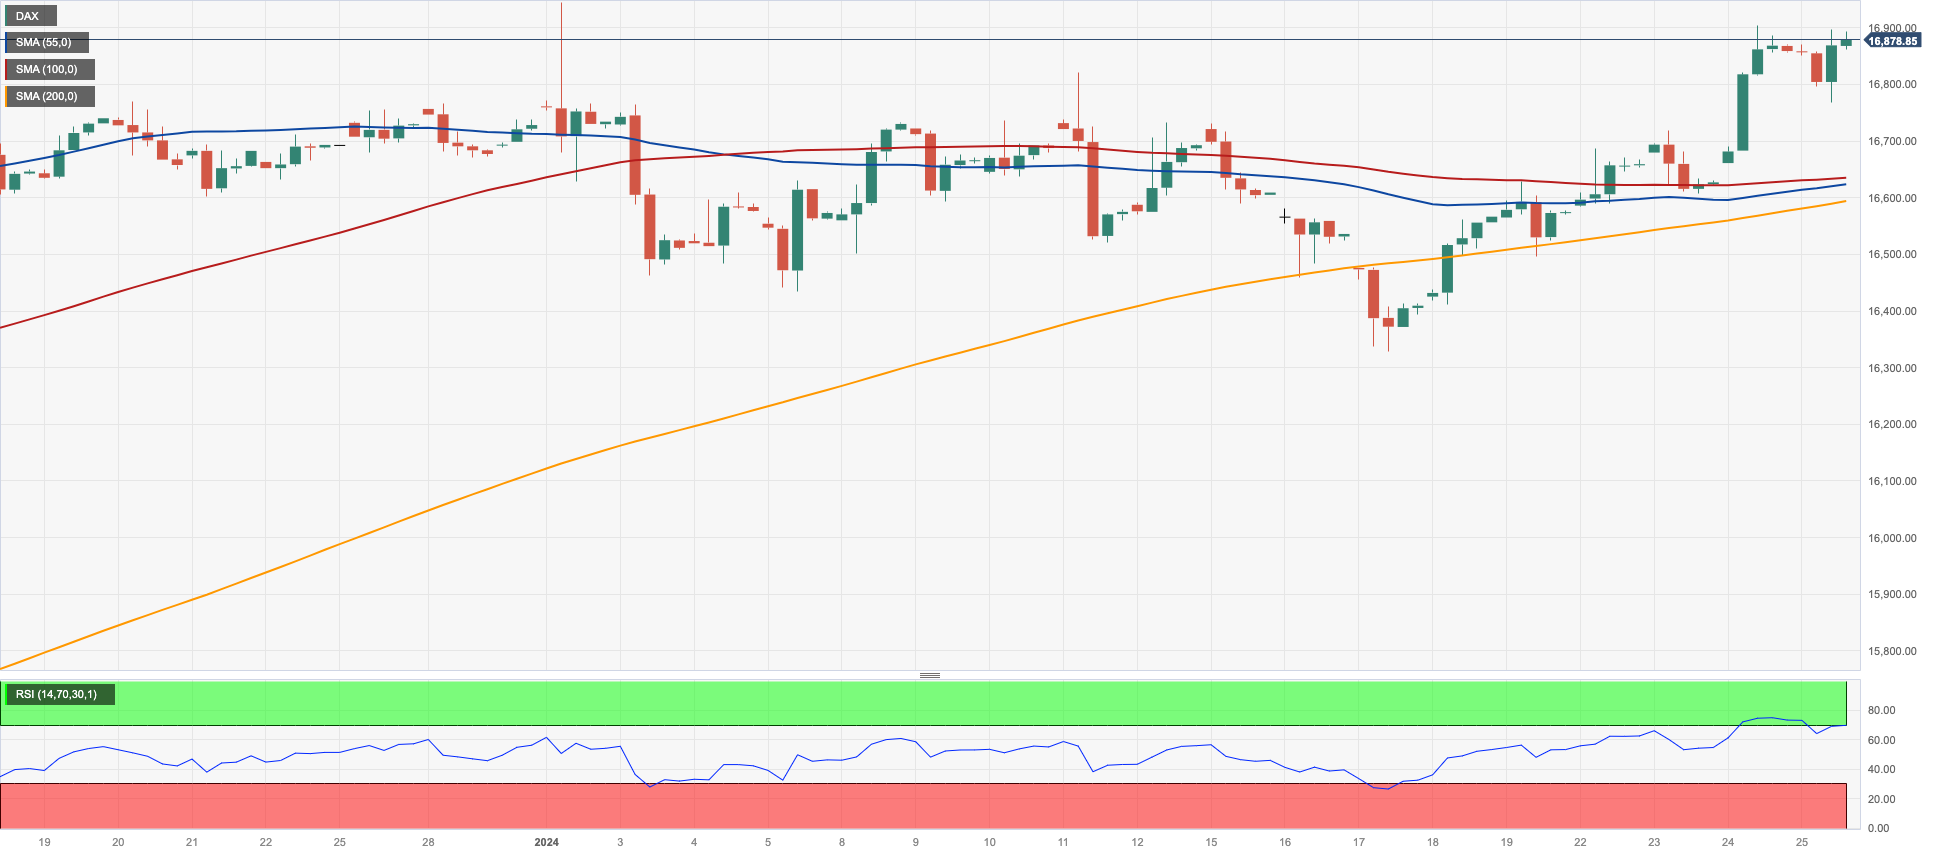
GER40
The German stock benchmark DAX40 rose modestly on Thursday, leaving stocks at shouting distance from the key barrier at 17000.
Investors saw their optimism exacerbated after the ECB left its interest rates unchanged at its event, as broadly anticipated. In her subsequent press conference,
President Lagarde left a potential rate cut at some point in the summer on the table.
In addition, better-than-estimated advanced US GDP figures also played in favour of the dominating bullish sentiment on the old continent on Thursday.
In contrast to the daily uptick in the DAX40, 10-year bund yields set aside two daily advances in a row and dropped below 2.30%.
Immediately on the upside for the DAX40 comes the 2024 top of 16963 (January 2) before reaching the all-time record of 17003 (December 14). Bears should focus on the YTD low of 16345 (January 17), ahead of the weekly low of 15915 (November 28), which looks to be supported by the crucial 200-day SMA of 15918. The October 2023 low of 14630 (October 23) comes next, before the March 2023 low of 14458 (March 20). The daily RSI climbed over 63.
Best Performers: Adidas, Symrise AG, BASF
Worst Performers: Commerzbank, Dr Ing hc F Porsche Prf, Hannover Rueck SE
Resistance levels: 16921 16963 17003 (4H chart)
Support levels: 16345 16065 15915 (4H chart)
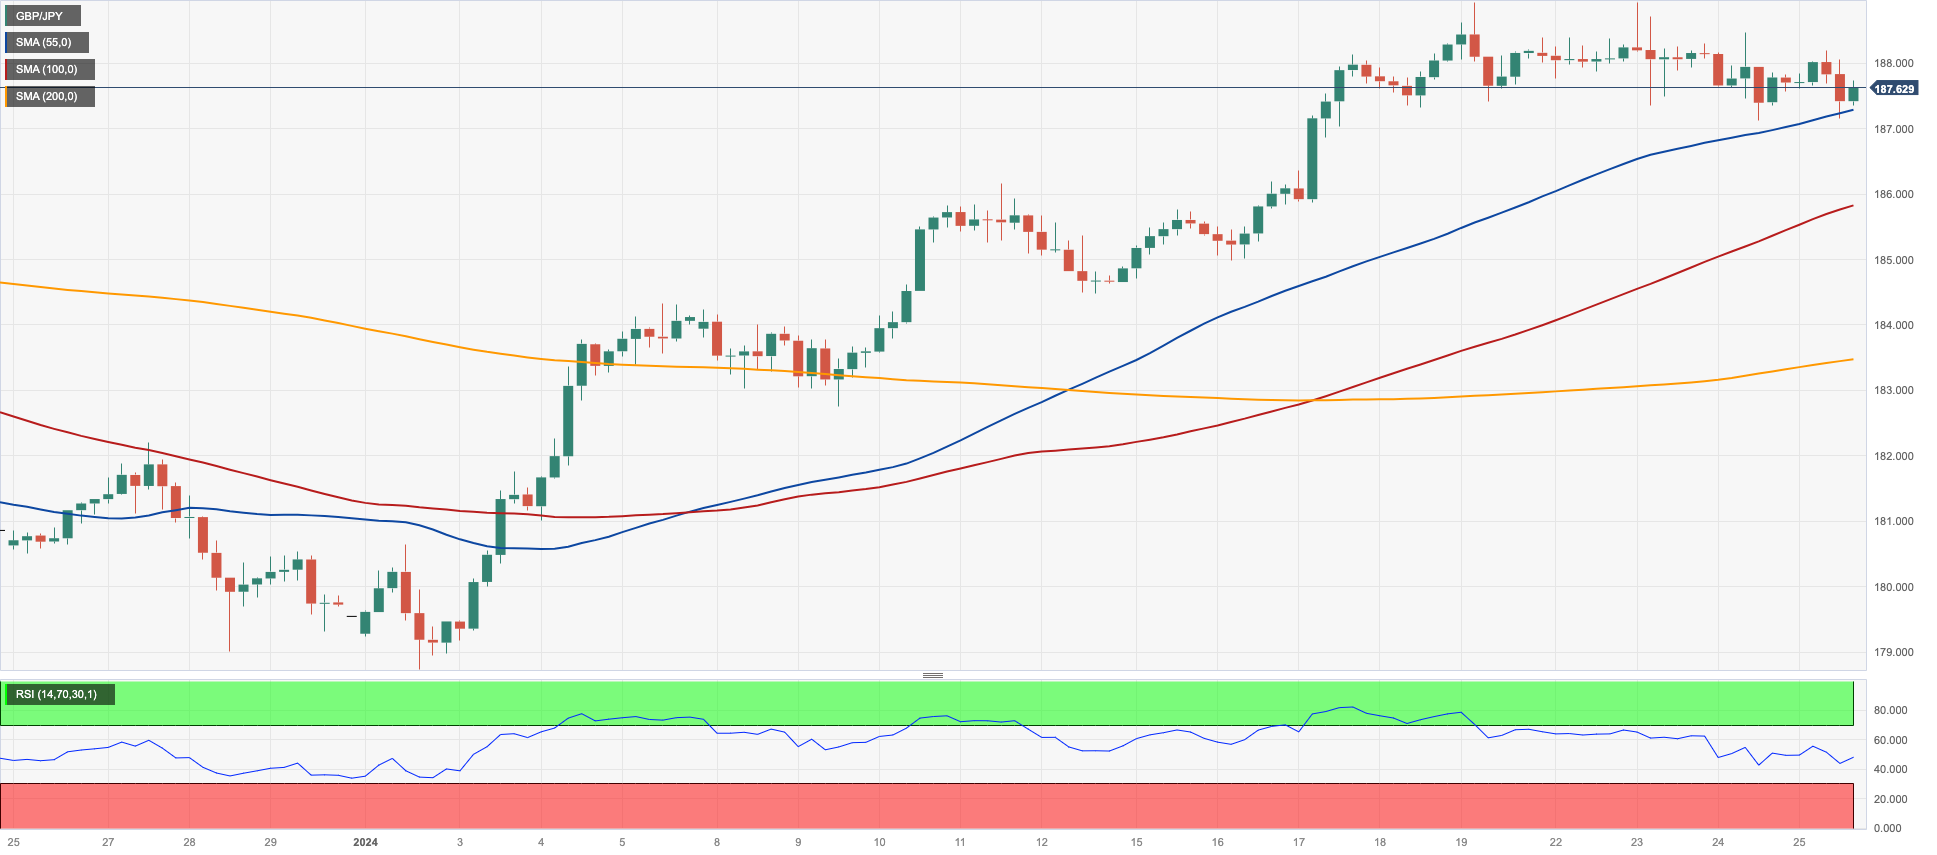
GBPJPY
GBP/JPY traded in a volatile session on Thursday, alternating gains and losses around the 187.60 region and following two consecutive days of losses.
The lack of a clear direction in the cross followed opposite sentiments in the Japanese yen and the Sterling, all against the backdrop of persistent recovery in the greenback, especially in the wake of robust US GDP prints.
GBP/JPY reached a new 2024 high of 188.93 on January 19. A move over this level may result in a test of the round number of 190.00 prior to the August 2015 top of 195.28 (August 18). On the contrary, short-term support exists at the 55-day and 100-day SMAs of 184.67 and 183.77, respectively, ahead of the more important 200-day SMA of 180.96. A breakdown of the latter reveals the December 2023 low of 178.33 (December 14), which comes before the October 2023 low of 178.03 (October 3), and the July 2023 low of 176.30, all ahead of the May 2023 low of 167.84 (May 11). The daily RSI dropped below 64.
Resistance levels: 188.93 189.99 195.28 (4H chart)
Support levels: 187.12 184.97 184.47 (4H chart)
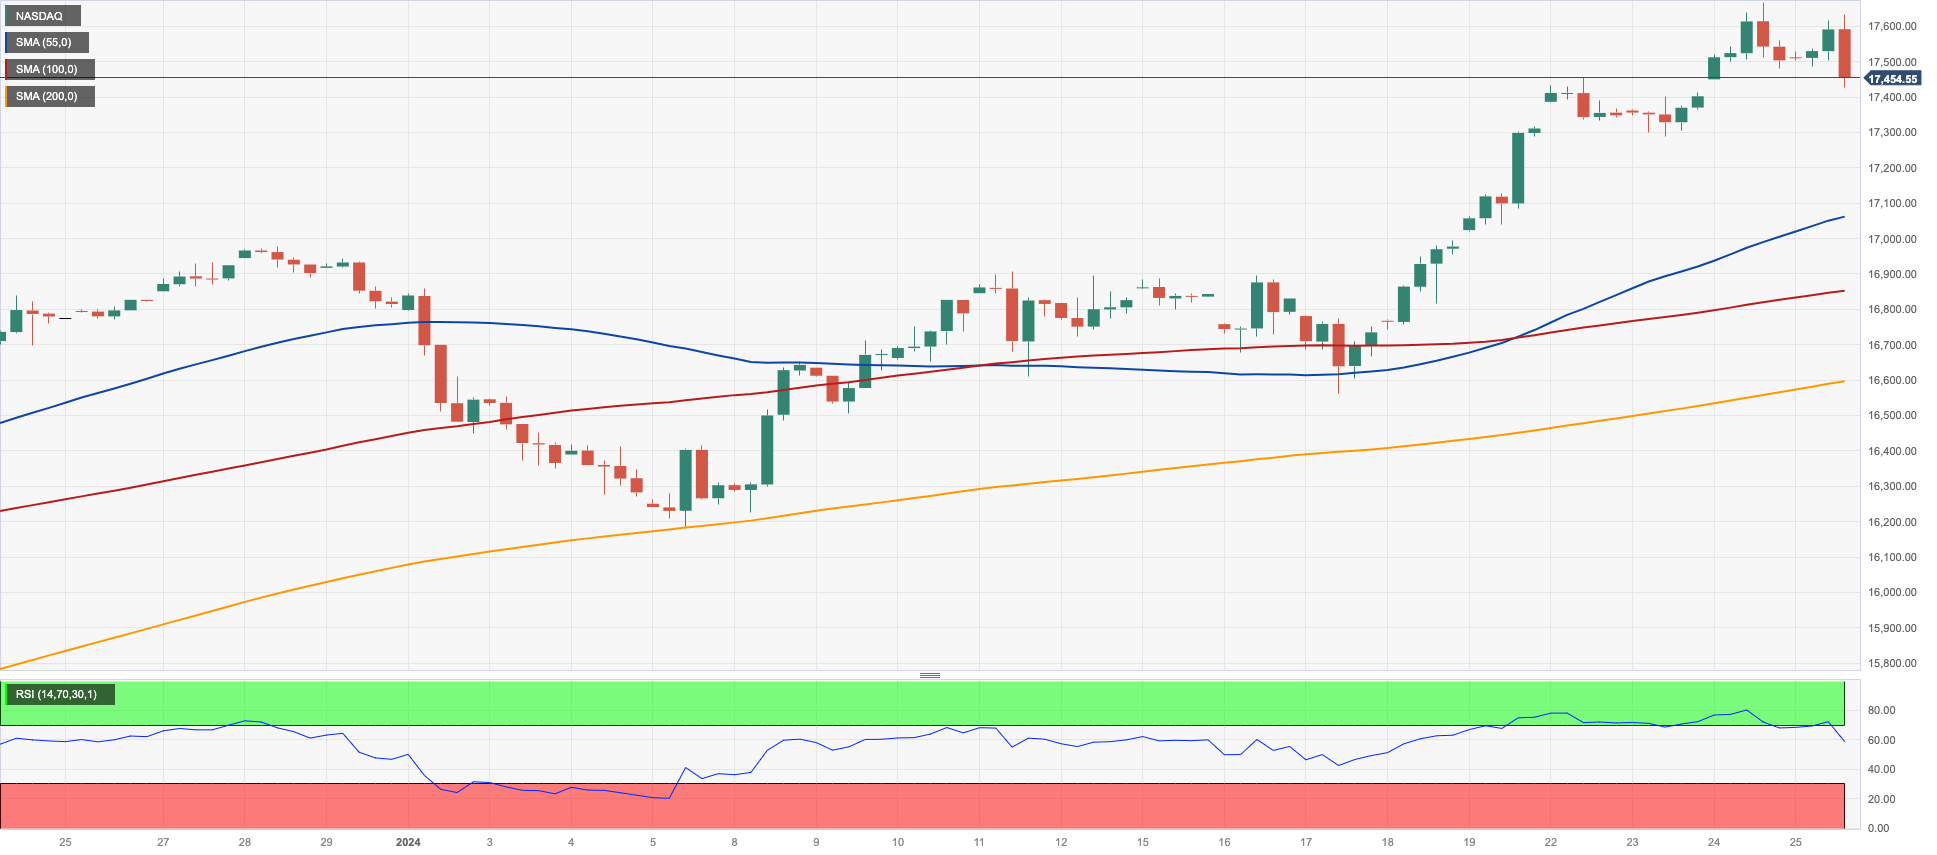
NASDAQ
The US tech sector kept its optimism well in place for yet another session, motivating the reference Nasdaq 100 to clinch its sixth consecutive daily advance on Thursday.
Another positive session in the tech index came despite the poor performance of electric vehicle maker Tesla following its projection of “notably” slower growth amidst a weaker-than-expected earnings report.
Despite the stronger dollar, the tech sector found an excuse to maintain its constructive stance in the corrective decline in US yields.
On January 24, the Nasdaq rose to a new high of 17665 points. The other way around, bearish attempts should aim for the 2024 low of 16249 (January 5), which is prior to the December 2023 low of 15695 (December 4) and the key 200-day SMA of 15094. A drop below the latter may induce a regression to the October 2023 bottom of 14058 (October 26). This is ahead of the April 2023 low of 12724 (April 25), the March 2023 low of 11695 (March 13), and the 2023 low of 10696 (January 3). The RSI for the day remained around 75, well into the overbought zone.
Top Gainers: Comcast, Lam Research, Constellation Energy
Top Losers: Tesla, PayPal, Marvell
Resistance levels: 17665 (4H chart)
Support levels: 16561 16249 15695 (4H chart)
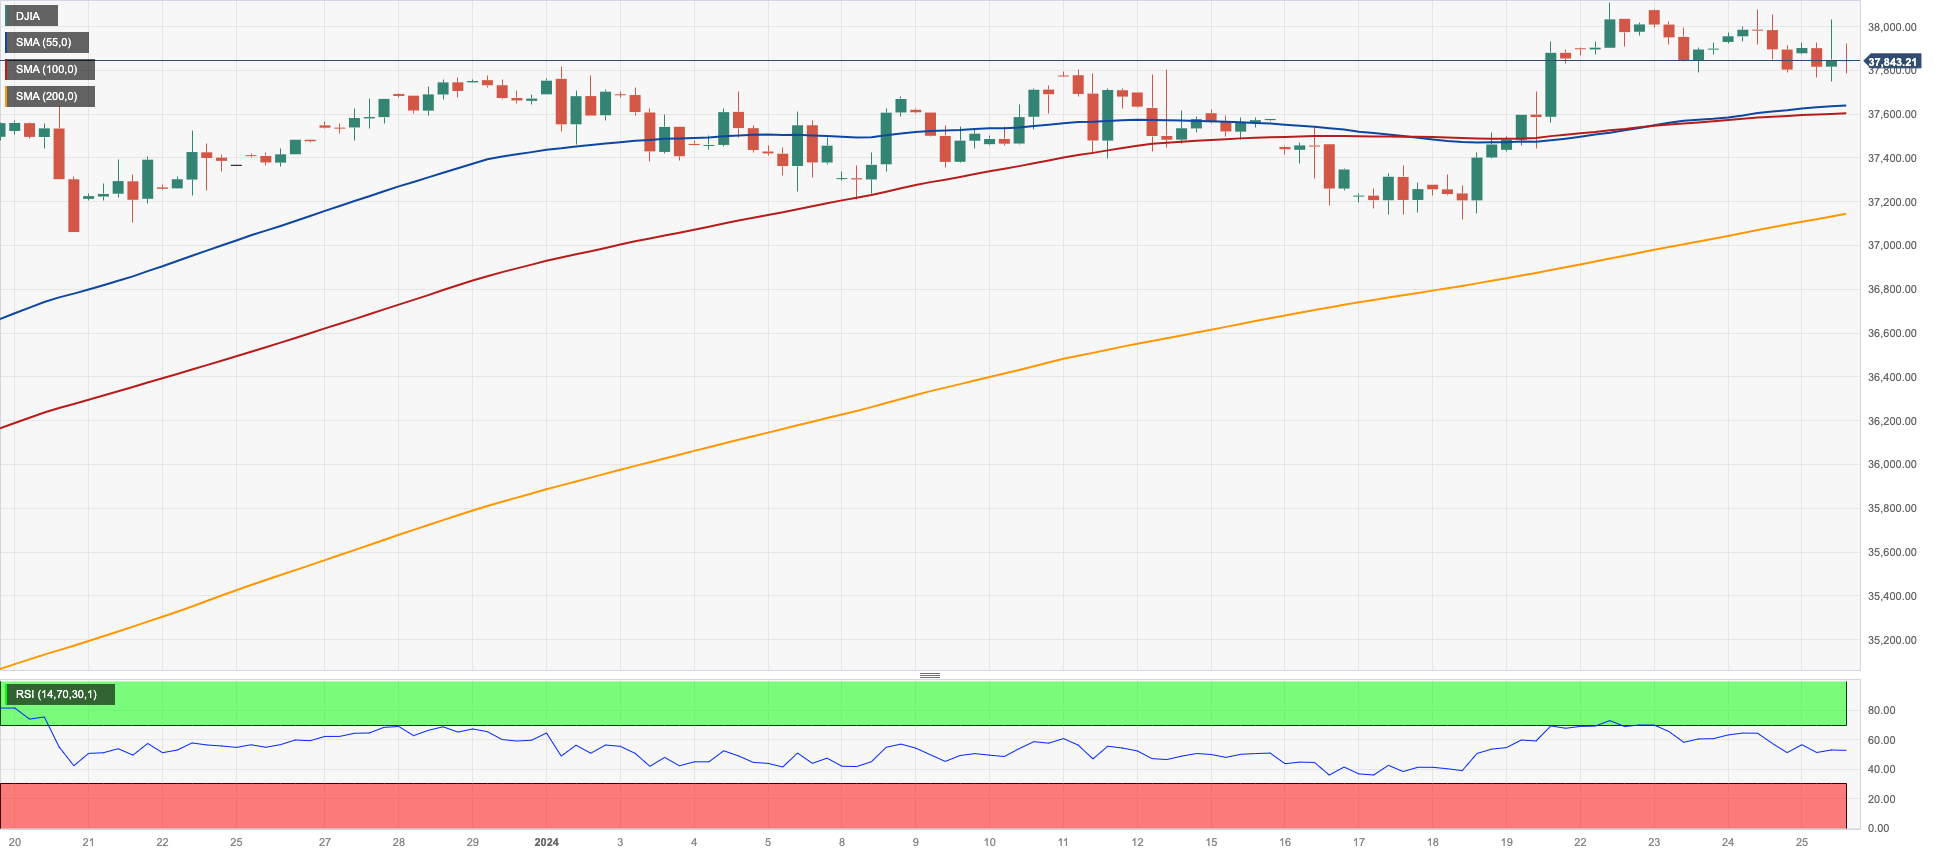
DOW JONES
US equities managed to print humble gains and ephemerally trespassed the 38000 yardstick when gauged by the Dow Jones on Thursday.
The mild advance in the index appeared underpinned by auspicious data from US GDP figures, which showed that the economy expanded more than expected by 3.3% YoY in the October-December period.
However, the unabated resilience of the economy might be an issue for US stocks going forward, as the Federal Reserve might keep its restrictive stance for longer, pushing further its planned interest rate cut.
On Thursday, the Dow Jones gained 0.14% to 37857, the S&P500 advanced 0.22% to 4879, and the tech-focused Nasdaq Composite rose 0.09% to 15494.
Extra gains may push the Dow Jones to its all-time high of 38109 (January 22). However, there is instant controversy at the 2024 bottom of 37122 (January 18), which happens prior to the weekly low of 37073 (December 20, 2023) and the December 2023 low of 36010 (December 5). Further losses may put the 200-day SMA at 334715 into play, ahead of the weekly low of 33859 (November 7, 2023), the October 2023 low of 32327 (October 27), and the 2023 low of 31429 (March 15). The daily RSI gathered some pace and surpassed 63.
Top Performers: IBM, Caterpillar, Dow
Worst Performers: UnitedHealth, Boeing, McDonald’s
Resistance levels: 38109 (4H chart)
Support levels: 37122 37073 36021 (4H chart)
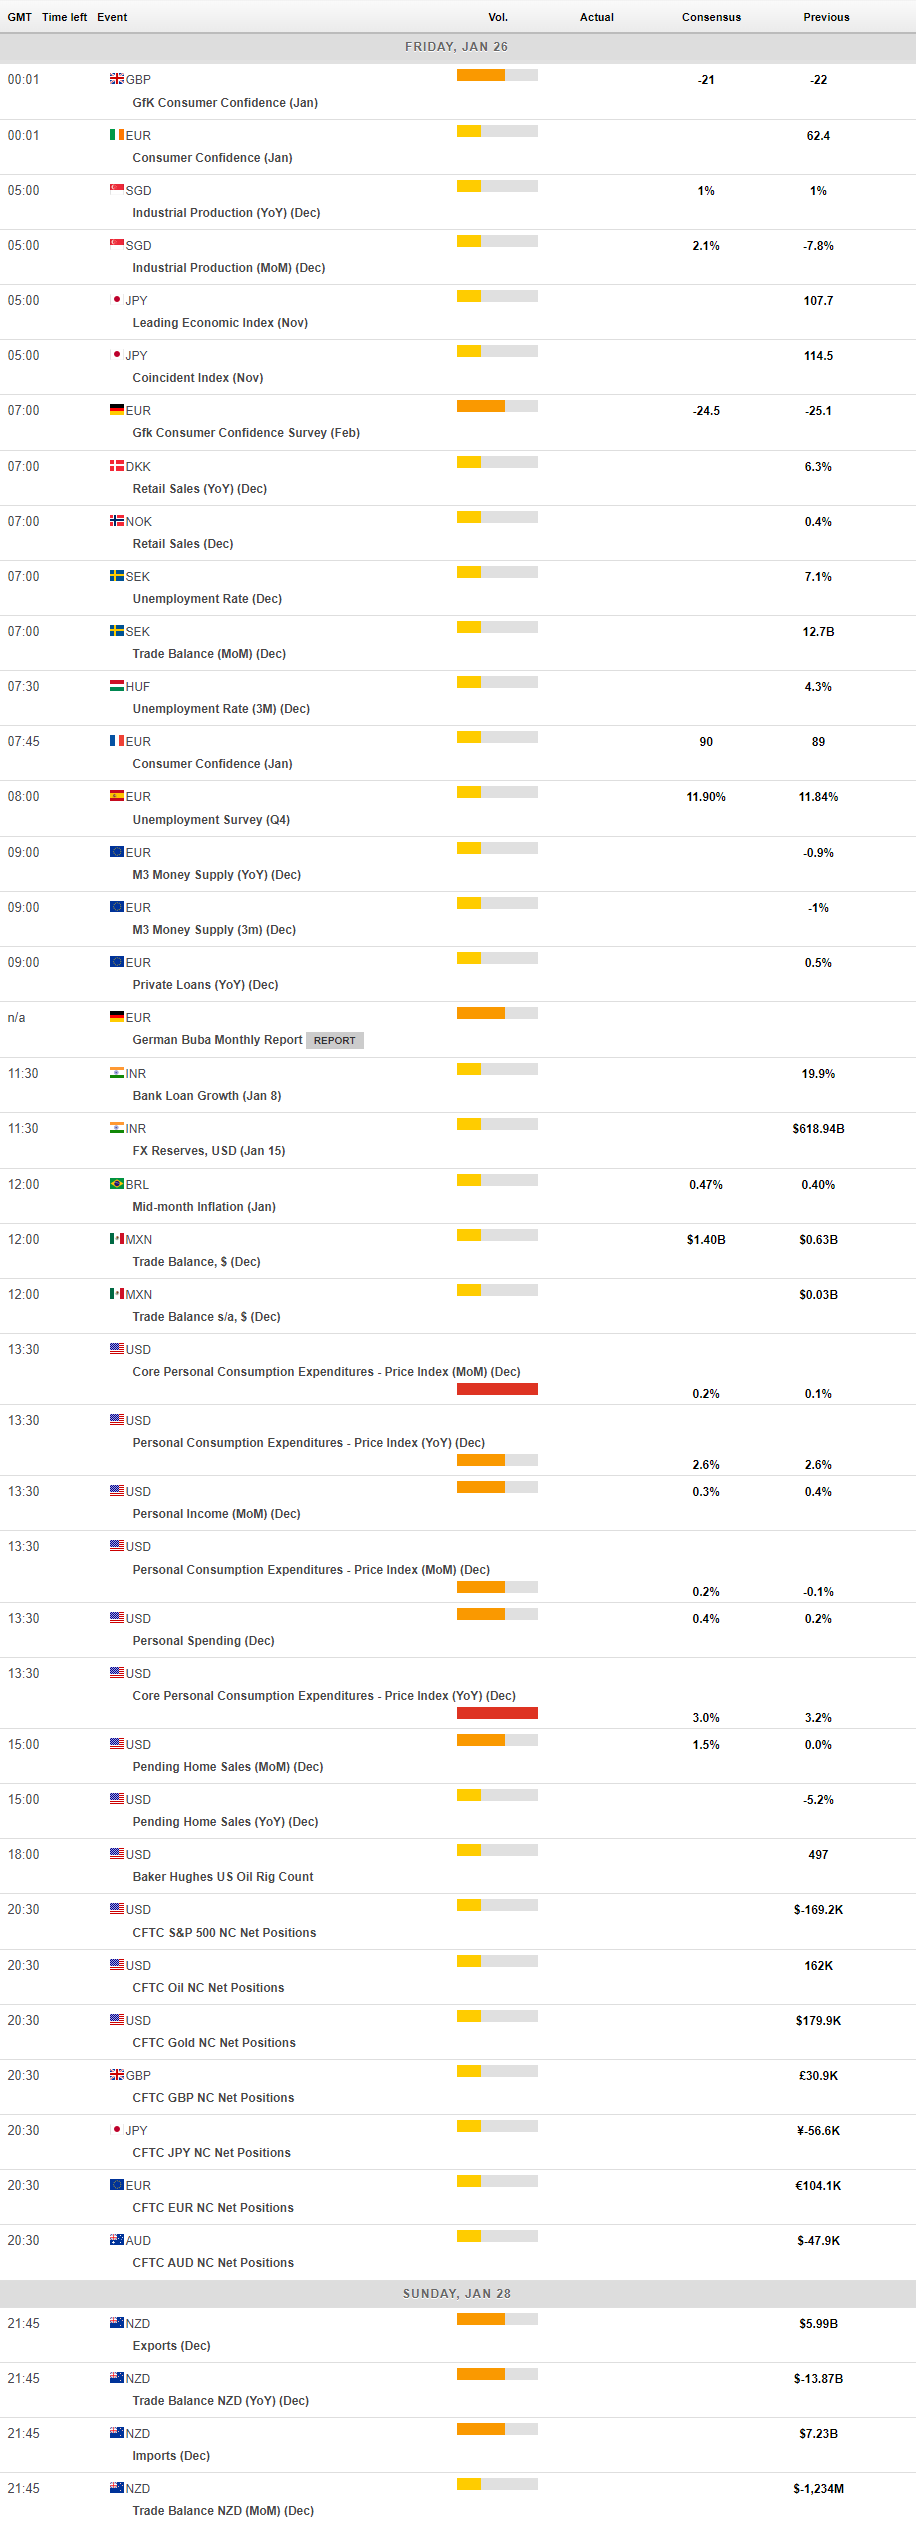
MACROECONOMIC EVENTS
All Information & Updates provided by:

All information relating to the financial markets available on this page has been prepared and issued by FXStreet (Forexstreet SL, Spain, Reg: B62498233) on the basis of publicly available information and all information believed to be reliable and does not conflict with Kuwaiti local laws, and all necessary care has been taken to before the company to ensure that the facts mentioned are correct from the source.
NCM Investment nor any of its directors or employees shall in any way be held responsible for the contents of this news, and the information contained on this page is intended only to provide clients with publicly available information and should not be construed as investment advice, report or analysis and/or constitute an offer or invitation to buy or sell financial instruments of any kind.
RISK WARNING: Forex and CFDs are highly risky leveraged products, as losses can exceed deposits. Please ensure you understand all the risks and take independent advice if necessary. NCM will segregate the clients based on the criteria of the regulator and its bylaws. NCM does not provide any advisory service; the material published does not constitute advice or a recommendation for a transaction in any financial instrument. NCM accepts no responsibility for any use of the content presented and any consequences of that use. Anyone acting on the information provided does so at their own risk.