
- Contact Us:
-

-

-

-


Daily Market Updates
29 Jan 2024
EURUSD
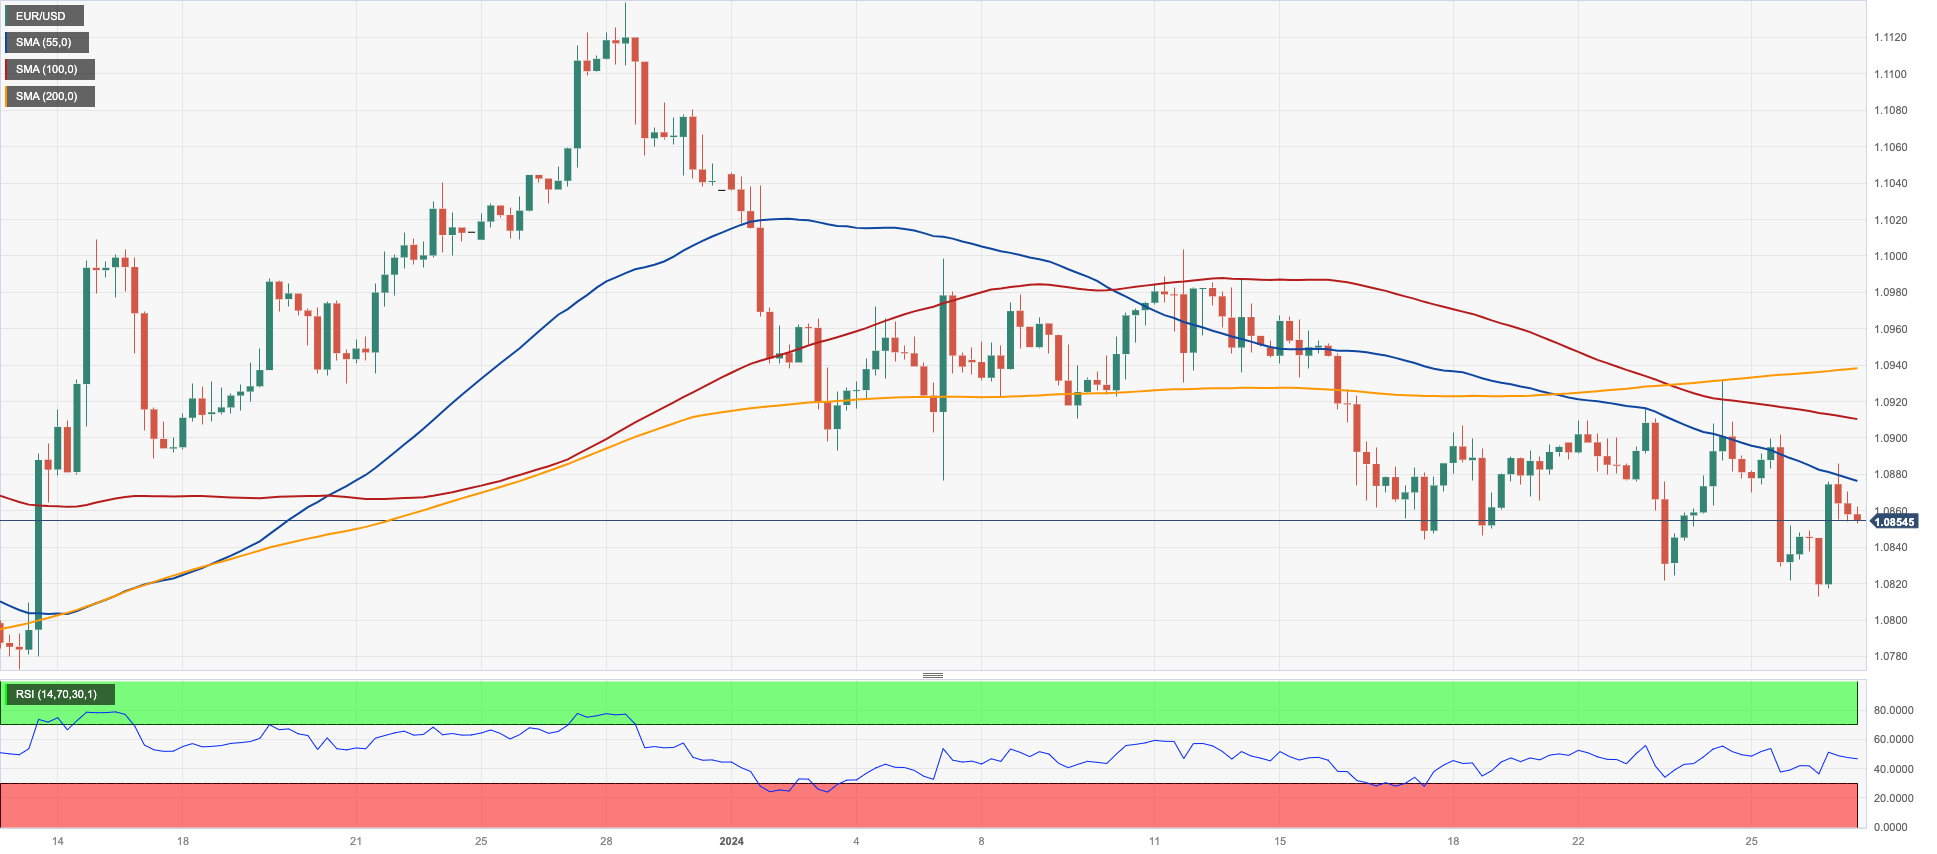
EUR/USD ended Friday’s session with humble gains around the 1.0850 region. Despite the daily uptick, a convincing trespass of the 1.0900 barrier remained elusive, while spot clinched its second consecutive negative week.
The greenback navigated an equally choppy week, leaving the USD Index (DXY) in the mid 103.00s amidst a modest rebound in US yields, which managed to reverse Thursday’s losses across the curve.
Furthermore, absent any surprises from the ECB at its meeting on Thursday, the pair kept its consolidative mood in place, as investors now seem to have shifted their focus to the upcoming FOMC event on January 31.
In the domestic docket, Consumer Confidence in Germany worsened to -29.7 for the month of February, which was the sole release in Europe at the end of the week.
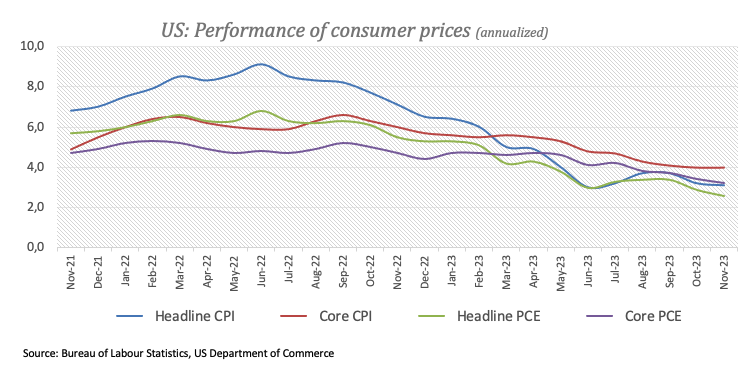
Across the ocean, US inflation figures measured by the PCE rose 2.6% in the year to December and 2.9% when it comes to the Core PCE. Further data saw Personal Income expand by 0.3% MoM and Personal Spending rise by 0.7% from a month earlier. Finally, Pending Home Sales expanded 1.3% YoY.
If sellers break below the 2024 low of 1.0812 (January 26), EUR/USD may drop further and retest the transitory 100-day SMA of 1.0776, ahead of the December 2023 bottom of 1.0723 (December 8). The loss of this area predicts a faster slide to the weekly low of 1.0495 (October 13, 2023), followed by the 2023 low of 1.0448 (October 3) and the round level of 1.0400. On the other side, there is early resistance at the weekly high of 1.0998 (January 5, 11), which precedes the December 2023 top of 1.1139 (December 27), which is also supported by the 200-week SMA at 1.1149 and comes before the 2023 peak of 1.1275 (July 18). The daily RSI improved a tad past 42.
Resistance levels: 1.0932 1.0998 1.1139 (4H chart)
Support levels: 1.0812 1.0723 1.0656 (4H chart)
USDJPY
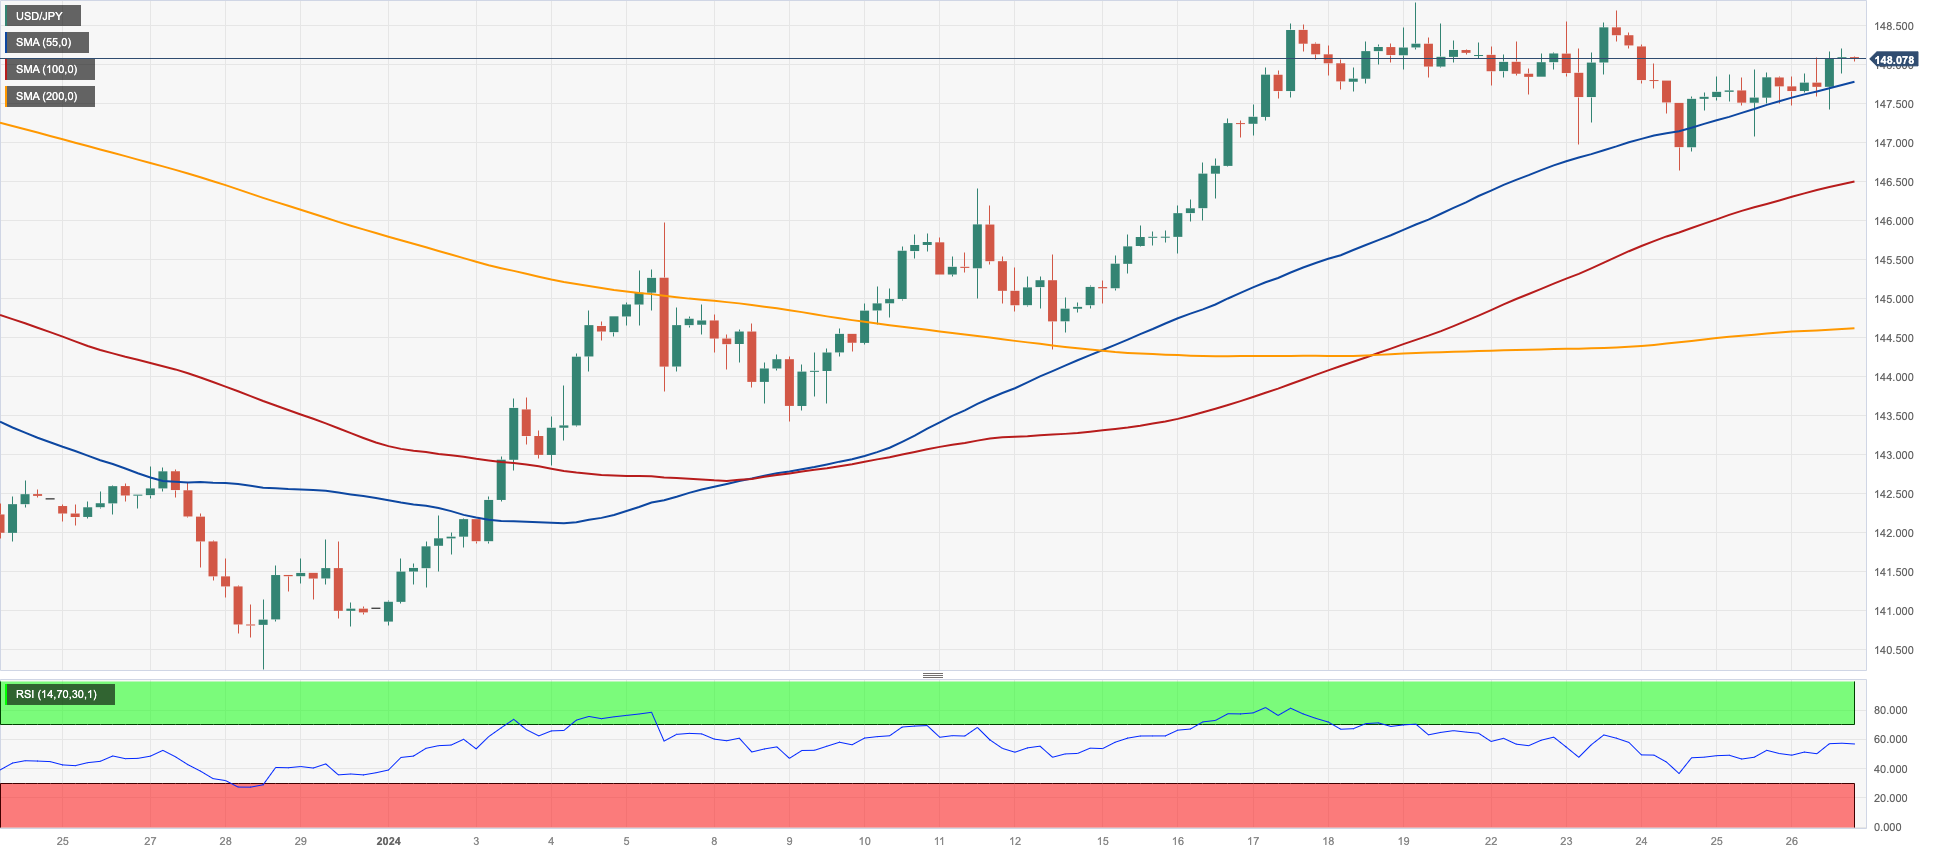
USD/JPY added to Thursday’s gains and reclaimed the 148.00 barrier and beyond on Friday.
The second session in a row of gains in spot came despite a marginal knee-jerk in the greenback, although the recovery in US yields across different maturities seems to have underpinned the upward bias.
In the Japanese bond market, JGB 10-year yields receded a tad after three consecutive daily advances.
There was no news from the BoJ Minutes as members maintained the discussion about an exit from the current monetary policy stance. Indeed, the Minutes reported that members acknowledged the significance of engaging in further discussions regarding matters such as the timing of the transition from the current monetary policy and the suitable rate at which to increase policy interest rates thereafter.
Data wise, the final November prints saw the Coincident Index at 114.6 and the Leading Economic Index at 107.6, down from 115.9 and 108.9, respectively.
Immediately to the upside for USD/JPY aligns the 2024 top of 148.80 (January 18), ahead of the critical milestone of 150.00, and then the 2023 peak of 151.90 (November 13). Further up, the 2022 high of 151.94 (October 21) comes before the round number of 152.00. Instead, if the pair falls below the provisional 55-day SMA of 146.13, it may retest the 200-day SMA of 144.26, which precedes the December 2023 low of 140.24 (December 28) and the round number of 140.00. The July 2023 low of 137.23 (July 14) appears south of here, but the loss of this region will find little support until the critical 130.00 level, which occurs before the March 2023 low of 129.63 (March 24). The daily RSI climbed above the 63 level.
Resistance levels: 148.20 148.80 149.67 (4H chart)
Support levels: 146.65 145.75 144.34 (4H chart)
GBPUSD
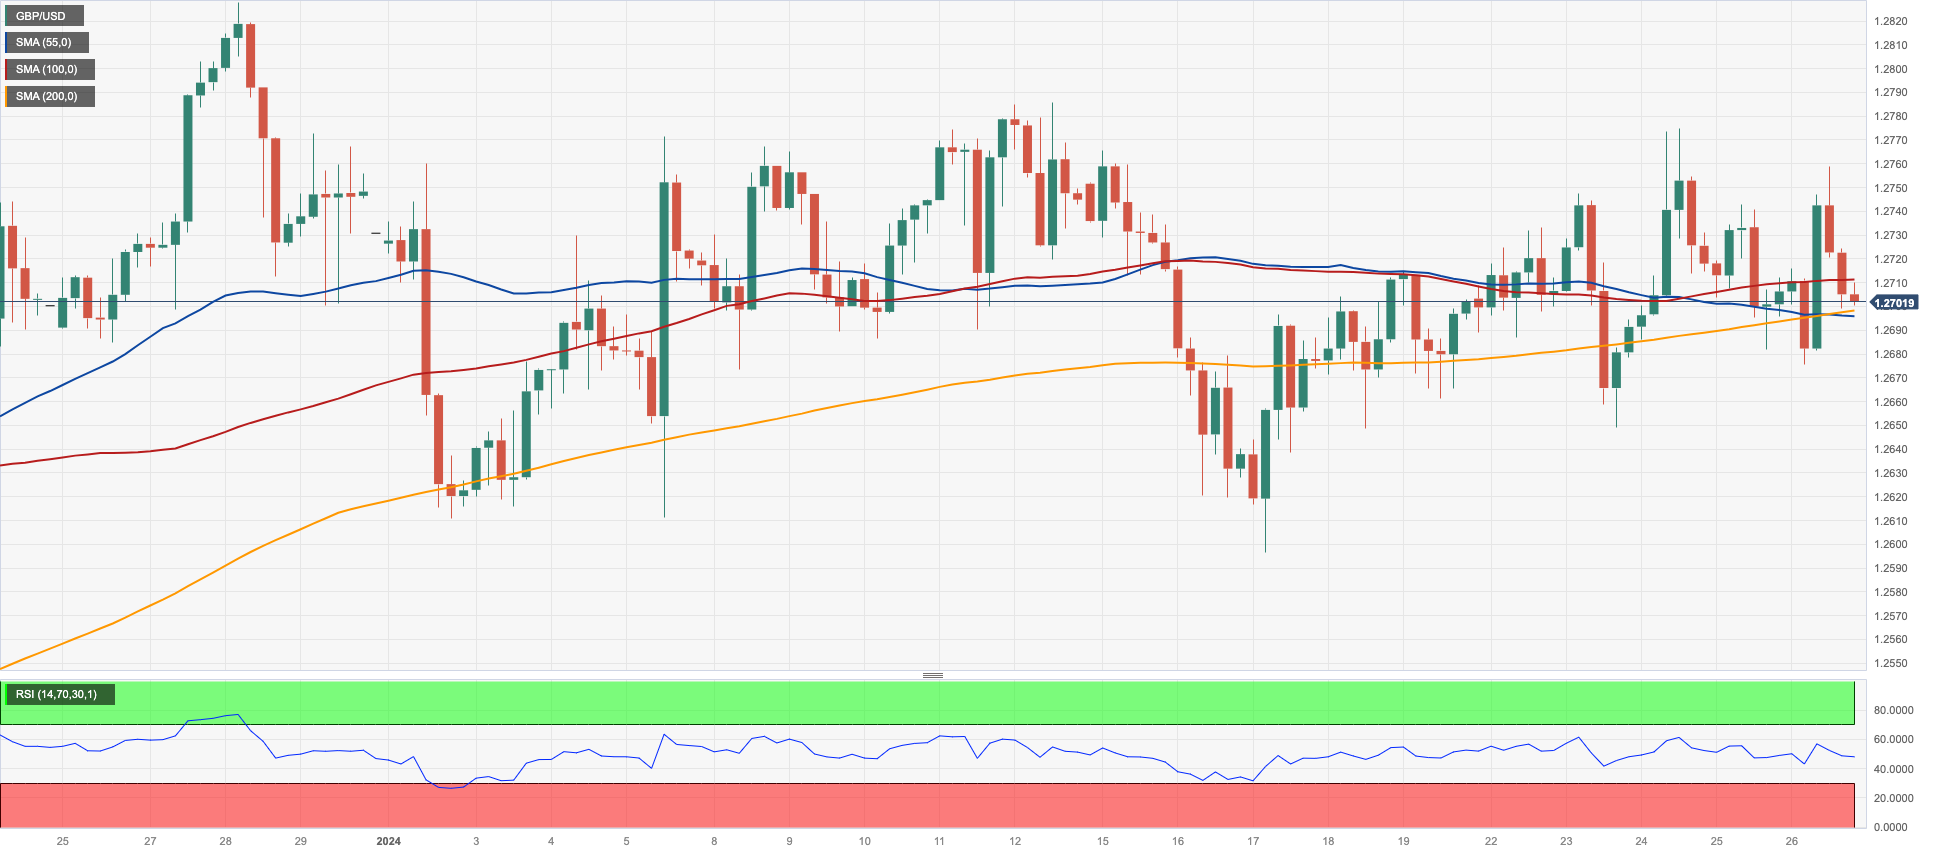
GBP/USD transited a volatile session to end around the key 1.2700 zone at the end of the week.
The price action around Cable followed alternating trends in the greenback, while some pre-BoE prudence appears to have also kicked in.
On the latter, it is highly likely that the BoE will maintain the status quo at its February gathering. Although the BoE has sustained its inclination towards rate hikes longer than many of its peers, a shift towards a more dovish stance at this meeting should not be ruled out.
The UK money market showed another small downtick in 10-year gilt yields, which remained below the key 4.0% mark.
In the docket, Consumer Confidence gauged by GfK improved to -19 for the month of January.
The break of the 2024 top at 1.2785 (January 12) may open the way for a probable advance to the December 2023 peak of 1.2827 (December 28), followed by the weekly high of 1.2995 (July 27, 2023), which is just shy of the important 1.3000 level. On the other hand, GBP/USD faces initial contention at the so-far 2024 low of 1.2596 (January 17), ahead of the critical 200-day SMA at 1.2554 and the December 2023 bottom of 1.2500 (December 13). Extra weakness may cause spot to challenge the weekly low of 1.2187 (November 10, 2023), ahead of the October 2023 low of 1.2037 (October 3), the critical 1.2000 mark, and the 2023 bottom of 1.1802 (November 10, 2023). The day-to-day RSI decreased marginally to about 52.
Resistance levels: 1.2758 1.2774 1.2785 (4H chart)
Support levels: 1.2675 1.2649 1.2596 (4H chart)
GOLD
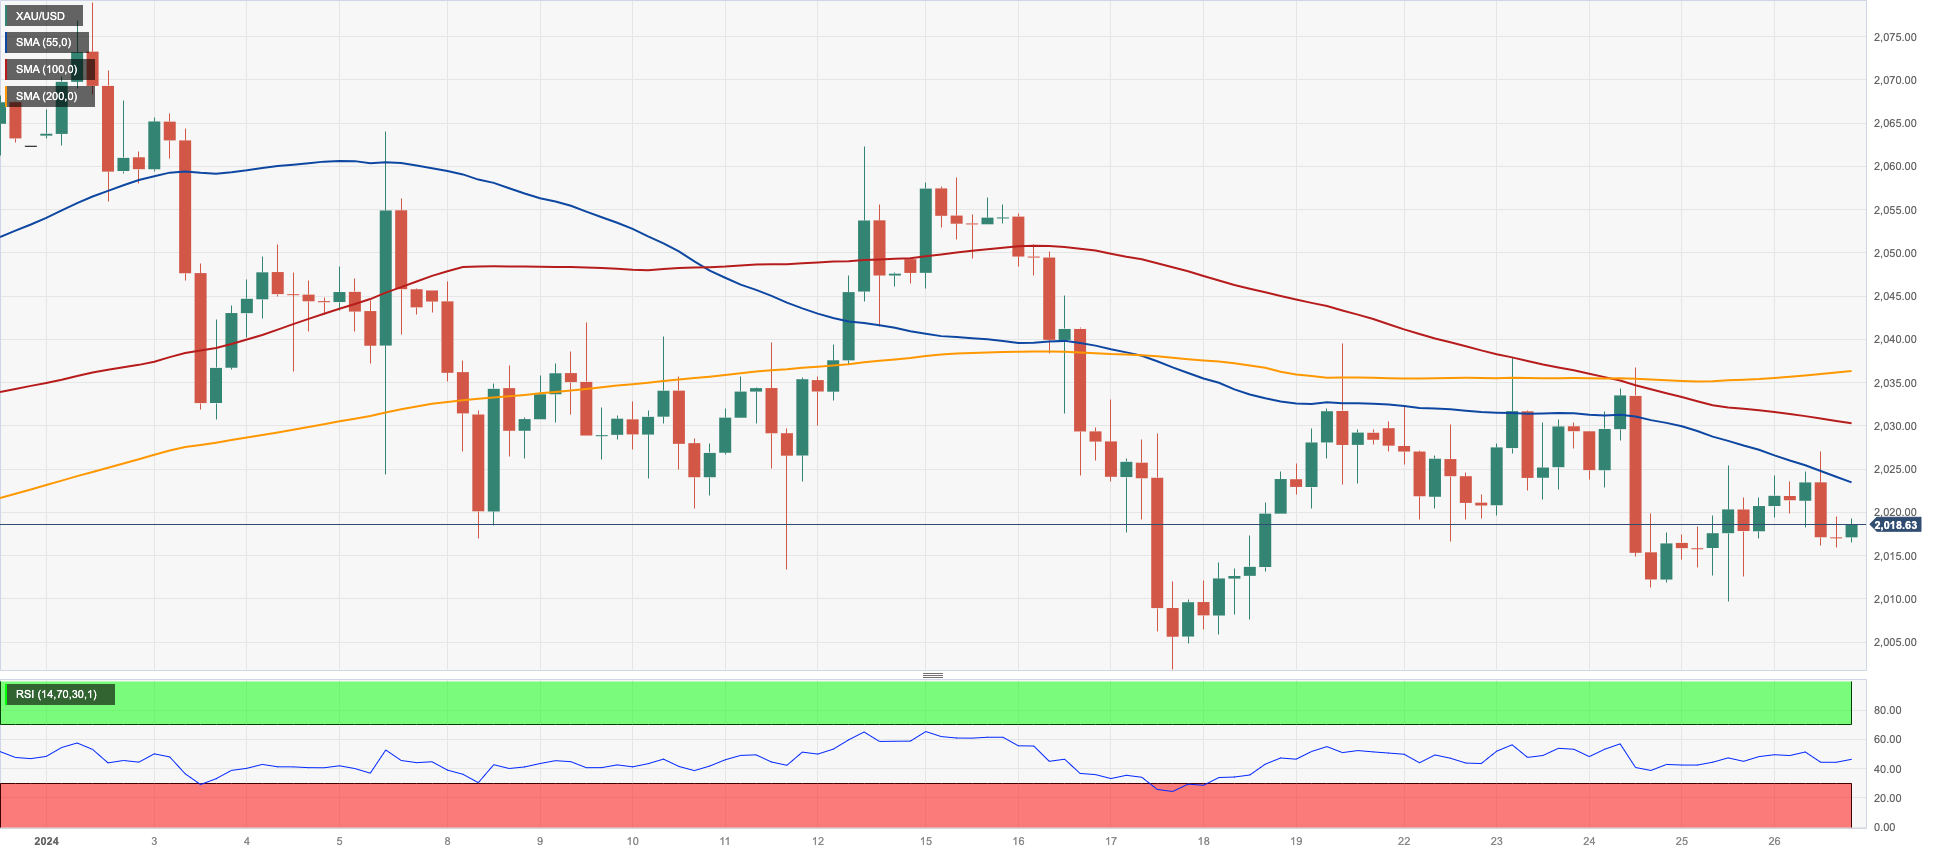
Gold prices retreated modestly at the end of the week, ending the session around the $2020 region per troy ounce.
The daily decline in the precious metal fell under the broader multi-session consolidative theme seen as of late, while the muted price action in the greenback and the decent rebound in US yields across the curve seem to have been behind the metal’s retracement.
Moving forward, bullion should remain under the microscope in light of the upcoming FOMC meeting. Despite the Fed is largely expected to keep its rates unchanged, discussion among traders has now moved over the potential timing of the planned interest rate cut, namely March or May.
Extra losses might push Gold to retest its 2024 level of $2001, which is still supported by the critical $2000 zone. If this zone breaks down, prices might fall to the December 2023 bottom of $1973, followed by the 200-day SMA at $1964 and the November 2023 low of $1931. In the case of more losses, the price may retest the October 2023 bottom of $1810, then the 2023 low of $1804, and maybe the $1800 level. Having said that, the initial up-barrier matches the weekly high of $2088 (December 28), before the all-time top of $2150 (December 4, 2023).
Resistance levels: $2039 $2062 $2078 (4H chart)
Support levels: $2009 $2001 $1973 (4H chart)
CRUDE WTI
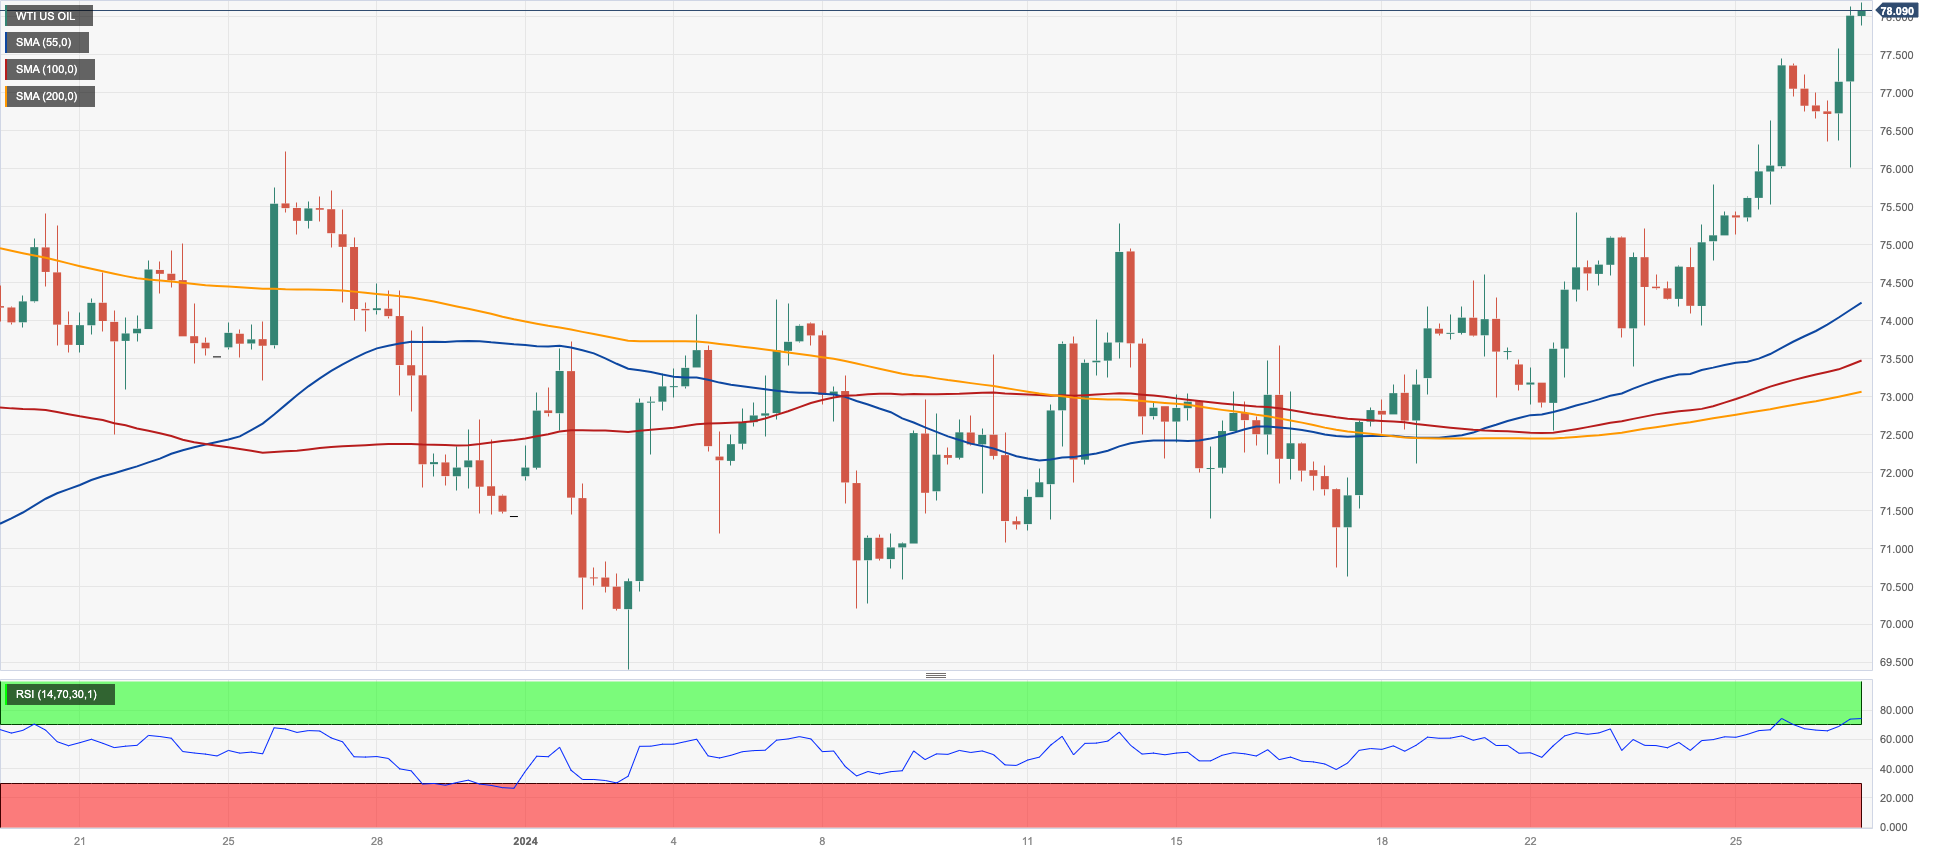
WTI prices rose sharply and printed a new seven-week high past the $78.00 mark per barrel on Friday. Following its price action, the commodity closed its second straight week with gains.
Increasing geopolitical risks in the Red Sea continued to lend support to crude oil prices on Friday, all in combination with strong prints from US GDP, news of extra stimulus to boost the Chinese economy, and the unexpectedly larger-than-estimated drop in weekly US crude oil stockpiles, reported by the EIA on Wednesday.
Somewhat diminishing the upside potential in the commodity remained the view that the Fed might keep its current restrictive stance for longer than anticipated, with investors now seeing the central bank reducing rates in May (from March).
Closing the weekly calendar, driller Baker Hughes said the US oil rig count went up by two, totaling 499 US active oil rigs.
WTI's next upward target is the 2024 high of $78.22 (January 26), which is followed by the key $80.00 barrier, and comes ahead of the November 2023 top of $80.15 (November 3). Extra gains from here may propel the market back to its weekly peak of $89.83 (October 18, 2023), seconded by the 2023 high of $94.99 (September 28, 2023) and the August 2022 top of $97.65 (August 30), all before hitting the important $100.00 level. On the other side, the next support level is the 2024 low of $69.31 (January 3), which comes before the December 2023 low of $67.74 (December 13) and the June 2023 bottom of $66.85 (June 12).
Resistance levels: $78.22 $79.56 $83.56 (4H chart)
Support levels: $73.38 $72.53 $70.59 (4H chart)
GER40
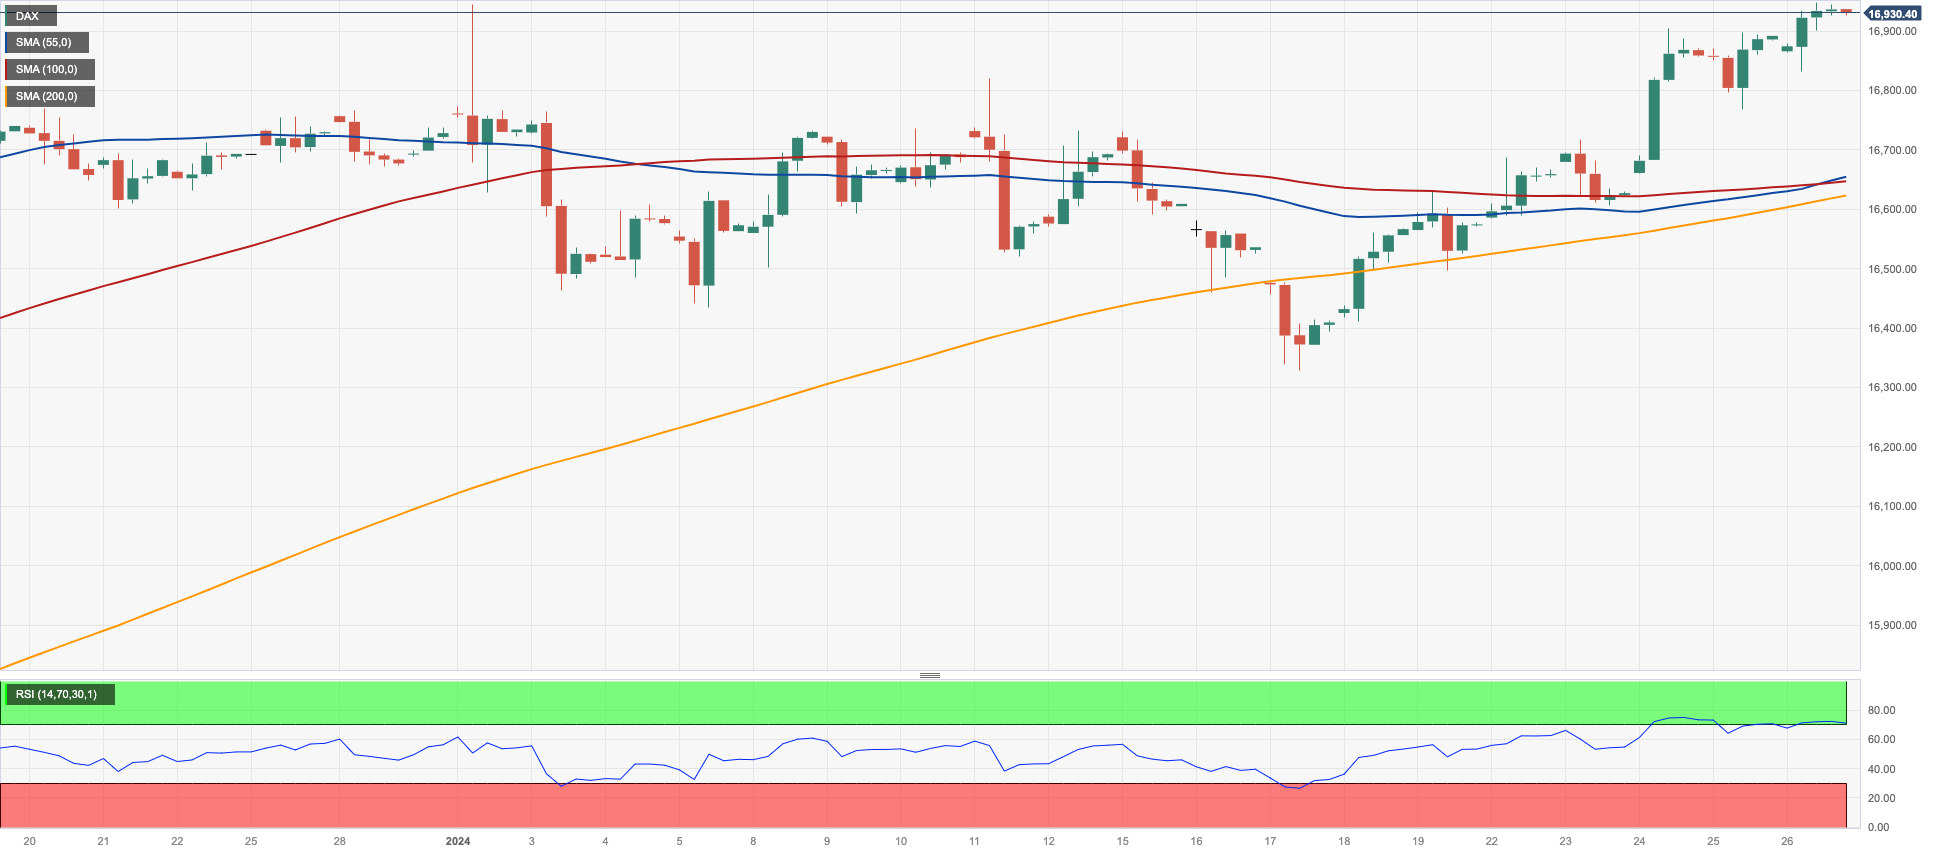
Germany’s reference DAX40 extended its weekly upward bias for the third session in a row on Friday, ending around the 16900 zone, at shouting distance from the all-time high recorded in mid-December just beyond the 17000 yardstick.
The DAX40 advanced further as investors continued to digest Thursday’s “on hold” decision by the ECB, while speculation remained firm regarding a potential interest rate cut in April or June.
Also playing in favour of the recovery in European markets turned up further stimulus in China aimed at boosting its lagged rebound following the pandemic.
Mirroring their US peers, 10-year bund yields ticked higher past the 2.30% level.
Immediately on the upward for the DAX40 is the 2024 peak of 16963 (January 2), before hitting the all-time high of 17003 (December 14). Immediately to the downside emerges the YTD low of 16345 (January 17), ahead of the critical 200-day SMA of 15924, and the weekly low of 15915 (November 28). The October 2023 low of 14630 (October 23) follows next, before the March 2023 low of 14458 (March 20). The everyday RSI rose further and flirted with 65.
Best Performers: Sartorius AG VZO, Merck, Dr Ing hc F Porsche Prf
Worst Performers: RWE AG ST, Rheinmetall AG, Bayer
Resistance levels: 16967 17003 (4H chart)
Support levels: 16345 16124 15915 (4H chart)
GBPJPY
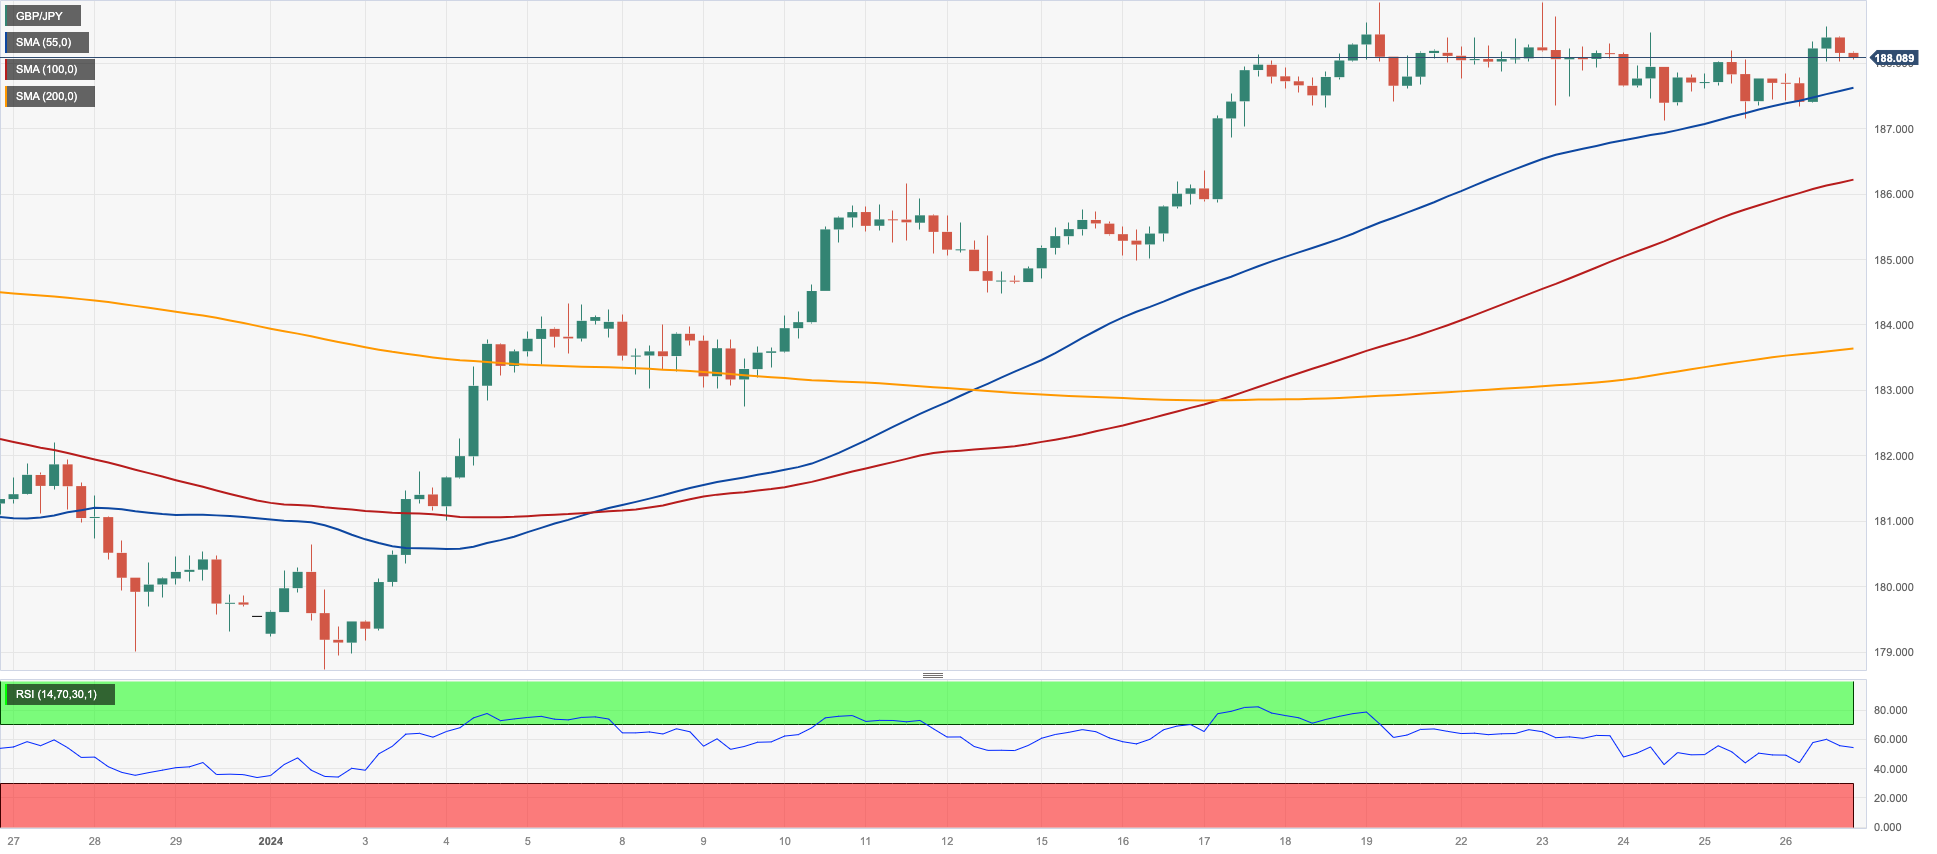
GBP/JPY printed decent gains for the first time after three daily pullbacks in a row on Friday, regaining composure and moving north of the 188.00 hurdle.
The marked depreciation of the Japanese yen favoured the change of direction in the cross in the latter part of the week, although it was not enough to maintain the yearly positive streak.
GBP/JPY hit a new 2024 high of 188.93 on January 19. A rise over this level might result in a test of the round number of 190.00 prior to the August 2015 top of 195.28 (August 18). On the contrary, short-term support is found at the 55-day and 100-day SMAs of 184.72 and 183.80, respectively, ahead of the more crucial 200-day SMA of 181.07. A breakdown of the latter reveals the December 2023 low of 178.33 (December 14), coming before the October 2023 low of 178.03 (October 3), and the July 2023 low of 176.30, all ahead of the May 2023 low of 167.84 (May 11). The daily RSI rose past 65.
Resistance levels: 188.56 188.93 189.99 (4H chart)
Support levels: 187.12 184.97 184.47 (4H chart)
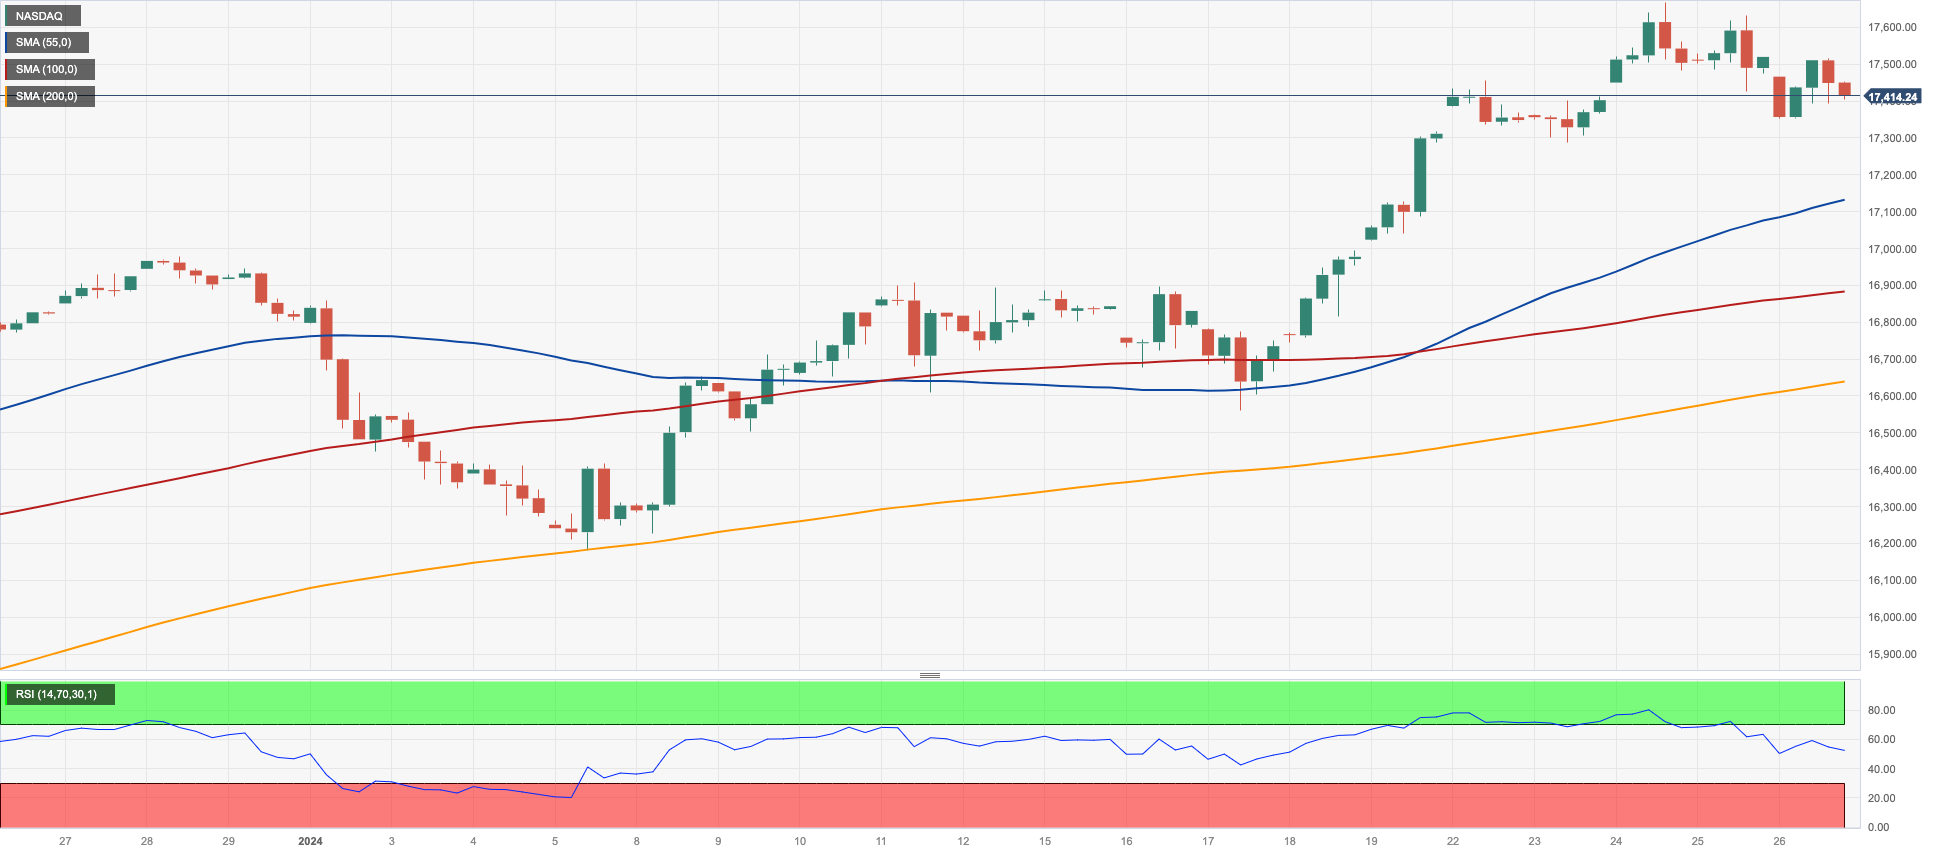
NASDAQ
Despite Friday’s marginal downtick, the tech reference Nasdaq 100 closed its third consecutive week in positive territory, having ended with gains in twelve out of the last thirteen sessions.
In fact, the steep rally in tech equities seems to have taken a breather at the end of the week, allowing market participants to gauge upcoming earnings reports from megacaps Alphabet, Microsoft, Apple, and Amazon.
In addition, the FOMC event on January 31 is expected to bring some prudence to the markets, despite the generalized consensus that the central bank should refrain from any moves on its interest rates.
Also weighing on the Nasdaq 100 was the firm performance of US yields across various timeframes.
On January 24, the Nasdaq reached a new high of 17665 points. Bearish efforts should aim for the 2024 low of 16249 (January 5), which aligns ahead of the December 2023 low of 15695 (December 4) and the important 200-day SMA of 15116. A decline below the latter might cause a regression to the October 2023 low of 14058 (October 26) and the April 2023 low of 12724 (April 25). South from here emerges the March 2023 low of 11695 (March 13), prior to the 2023 low of 10696 (January 3). The RSI eased to the proximity of 70, still in the overbought zone.
Top Gainers: Airbnb, MercadoLibre, Comcast
Top Losers: Intel, KLA Corp, Globalfoundries
Resistance levels: 17665 (4H chart)
Support levels: 16561 16249 15695 (4H chart)
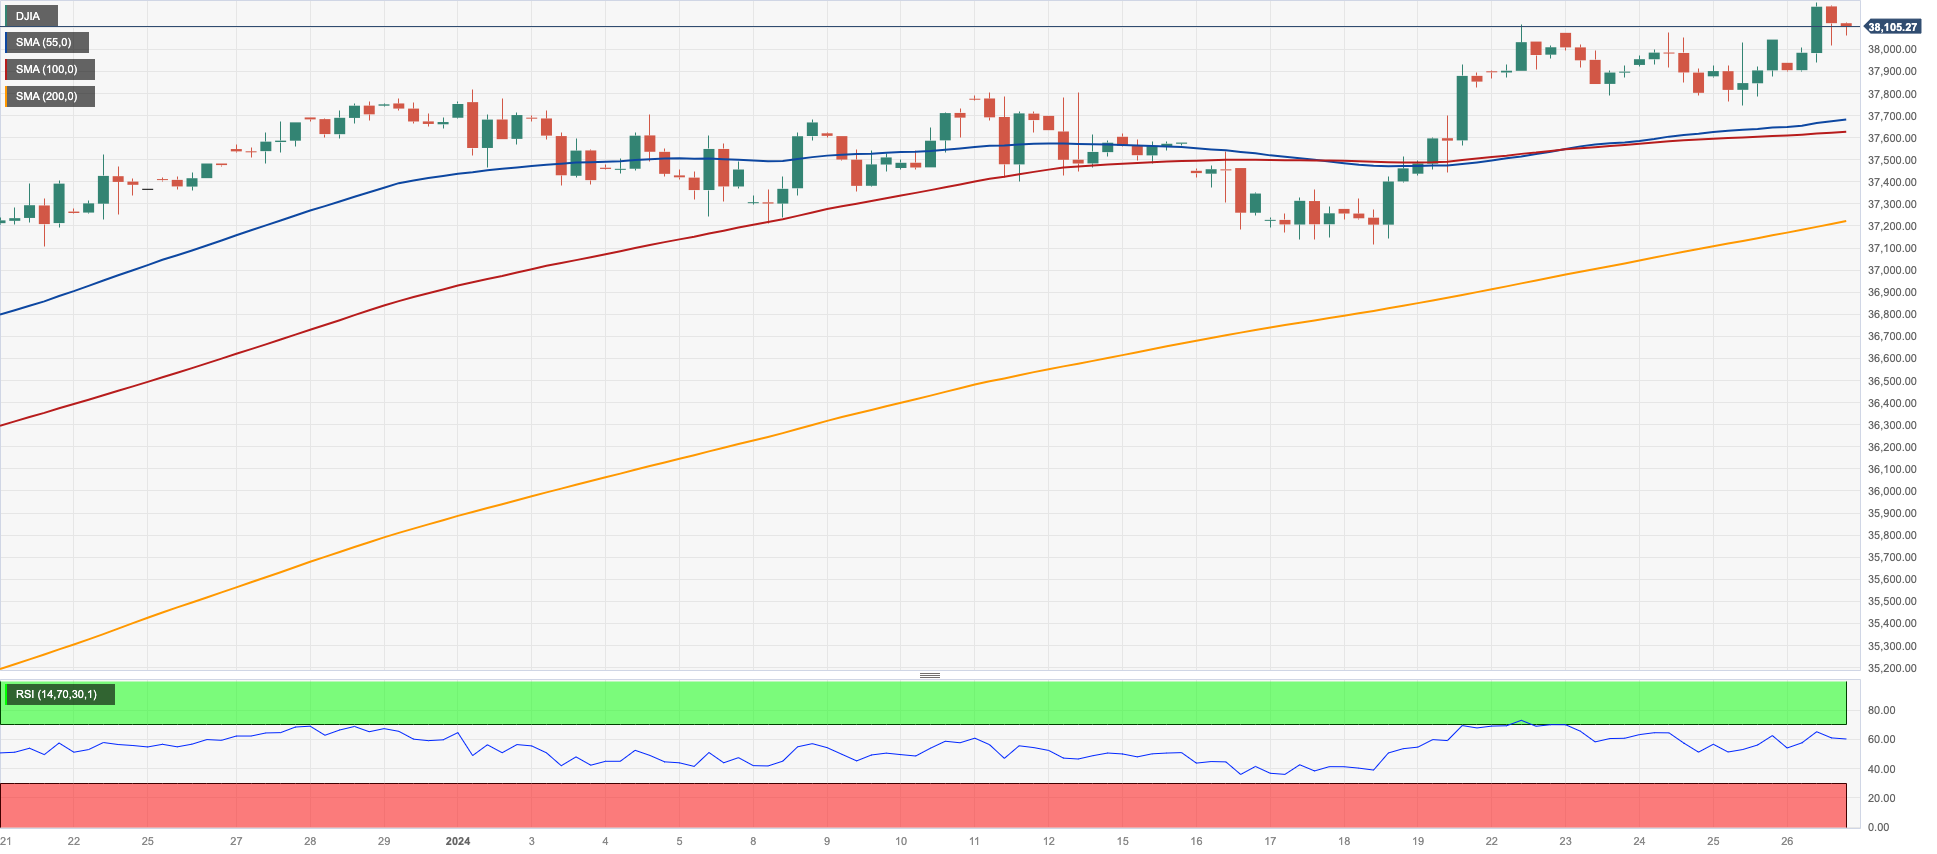
DOW JONES
Another positive session saw the US stock benchmark Dow Jones print a new all-time top around 38215 on Friday, clinching at the same time its third consecutive weekly advance.
In fact, the optimism among investors remained unchanged, further propped up by the perception that a “soft landing” looks increasingly likely. Helping this view emerged the robust prints from the Q4 GDP, while December PCE figures gave extra signs that disinflationary pressures remain in play.
In the next sessions, some pre-FOMC caution is expected to kick in in spite of the broad consensus pointing to an “on hold” decision on January 31. The debate, however, has now moved on to whether the Fed could cut rates in March or May.
At the end of the week, the Dow Jones rose 0.16% to 38109, the S&P500 retreated 0.07% to 4890, and the tech-heavy Nasdaq Composite dropped 0.36% to 15455.
Extra gains may propel the Dow Jones to its all-time high, 38215 (January 26). The other way around, there is immediate contention at the 2024 bottom of 37122 (January 18), which occurs prior to the weekly low of 37073 (December 20, 2023) and the December 2023 low of 36010 (December 5). Further losses might bring the 200-day SMA at 34738 in play, ahead of the weekly low of 33859 (November 7, 2023), the October 2023 low of 32327 (October 27), and the 2023 low of 31429 (March 15). The daily RSI picked up pace and trespassed 67.
Top Performers: American Express, UnitedHealth, Nike
Worst Performers: Intel, Visa A, McDonald’s
Resistance levels: 38215 (4H chart)
Support levels: 37122 37073 36021 (4H chart)
MACROECONOMIC EVENTS

All Information & Updates provided by:

All information relating to the financial markets available on this page has been prepared and issued by FXStreet (Forexstreet SL, Spain, Reg: B62498233) on the basis of publicly available information and all information believed to be reliable and does not conflict with Kuwaiti local laws, and all necessary care has been taken to before the company to ensure that the facts mentioned are correct from the source.
NCM Investment nor any of its directors or employees shall in any way be held responsible for the contents of this news, and the information contained on this page is intended only to provide clients with publicly available information and should not be construed as investment advice, report or analysis and/or constitute an offer or invitation to buy or sell financial instruments of any kind.
RISK WARNING: Forex and CFDs are highly risky leveraged products, as losses can exceed deposits. Please ensure you understand all the risks and take independent advice if necessary. NCM will segregate the clients based on the criteria of the regulator and its bylaws. NCM does not provide any advisory service; the material published does not constitute advice or a recommendation for a transaction in any financial instrument. NCM accepts no responsibility for any use of the content presented and any consequences of that use. Anyone acting on the information provided does so at their own risk.