
- Contact Us:
-

-

-

-


Daily Market Updates
31 Jan 2024
EURUSD
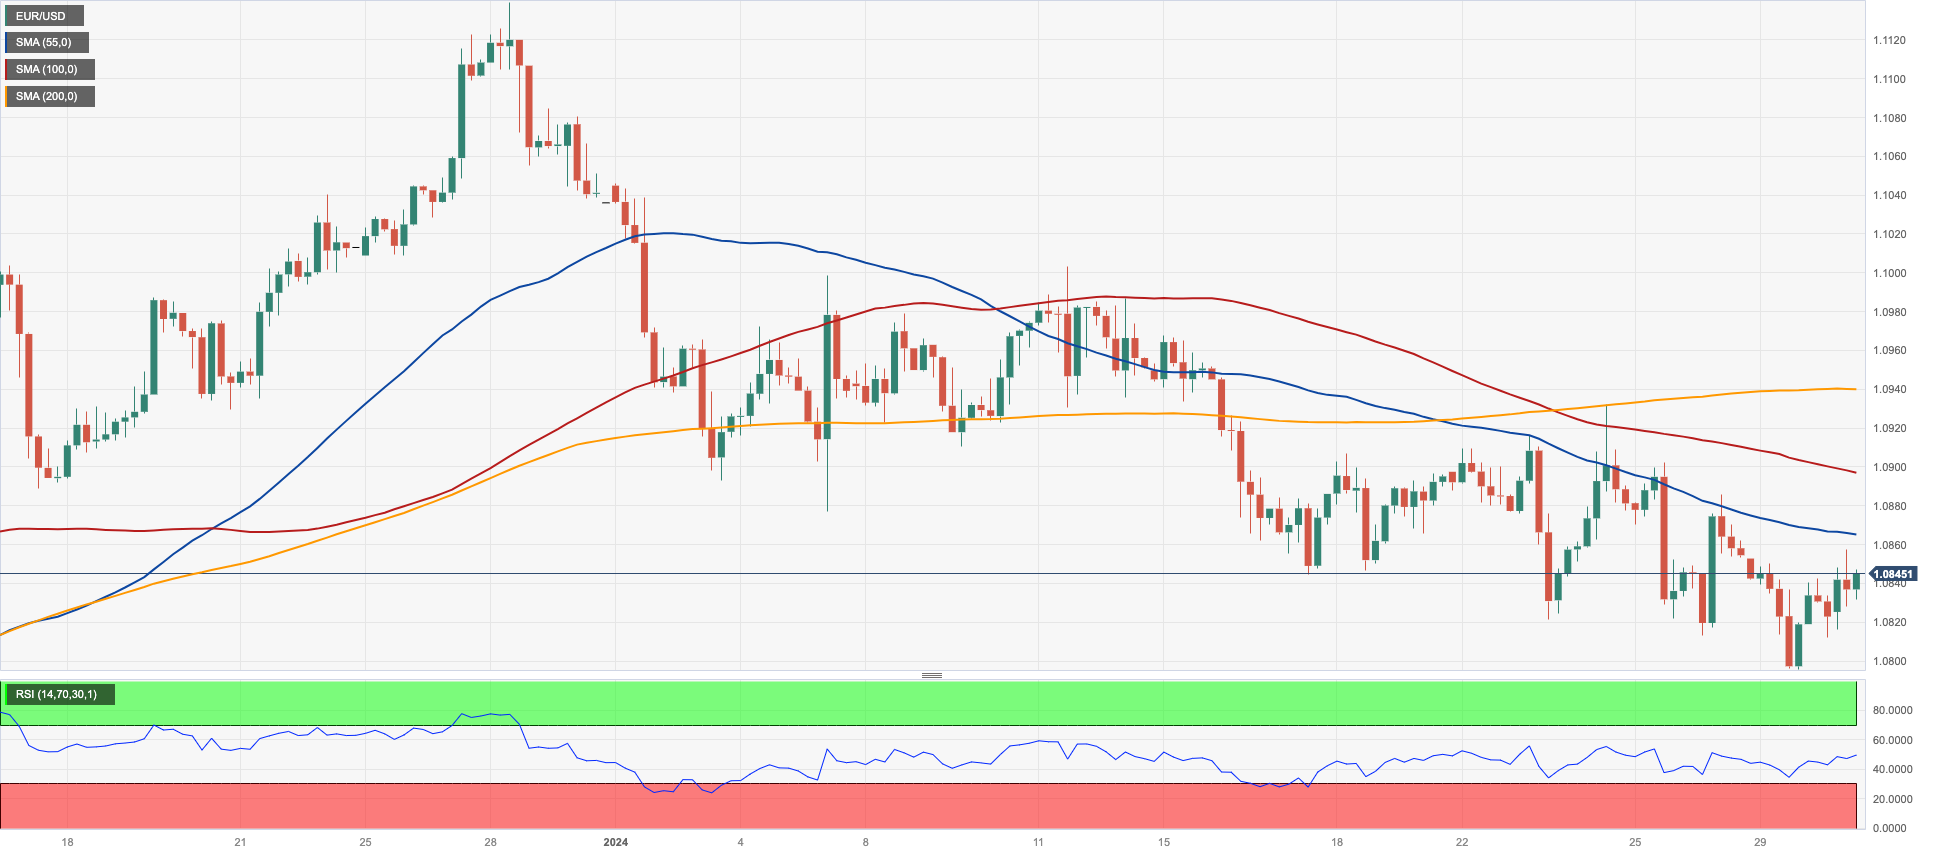
Tuesday’s vacillating trading session left EUR/USD with humble gains near the 1.0840 zone, an area coincident with the critical 200-day SMA, while the greenback traded within its familiar range near the mid-103.00s.
Price action around both spot and the dollar was against the backdrop of a mixed tone in US yields, where the short end of the curve regained traction vs. marginal developments in the belly and the long end, all ahead of the key FOMC event on Wednesday.
On the latter, it is widely anticipated that the Federal Reserve will leave its interest rates unchanged, although the centre of the debate should remain Chief Powell and any hints regarding the timing of the long-awaited first interest rate cut.
On the latter, CME Group’s FedWatch Tool sees a rate cut in May with a nearly 55% probability.
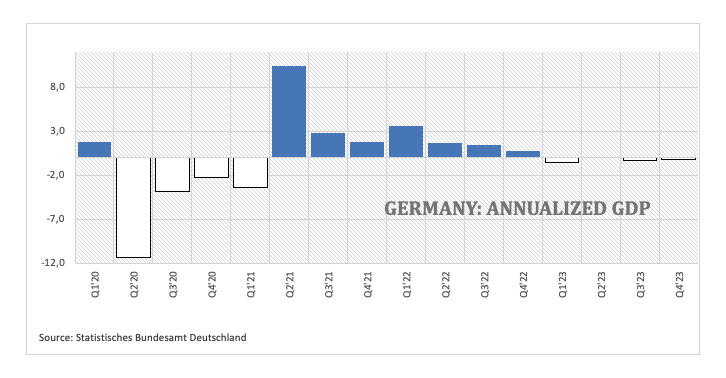
Back to the domestic calendar, the flash GDP Growth Rate in Germany saw the economy contract by 0.3% QoQ and 0.2% YoY in Q4, while the broader euro area expanded marginally by 0.1% YoY and came in flat vs. the previous quarter.
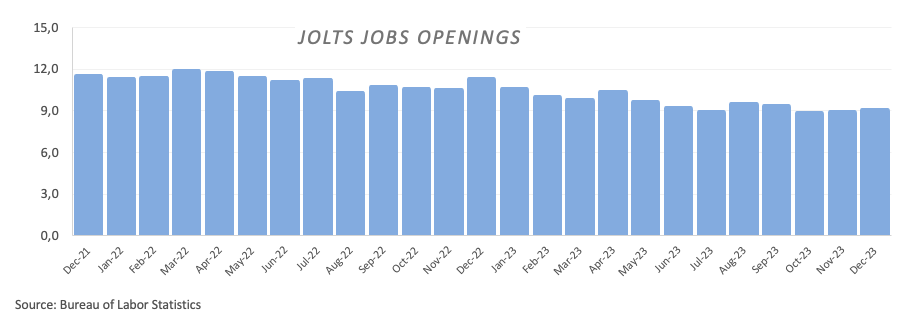
In the US, JOLTs Job Openings surprised to the upside after increasing by 9.026M in December, while the FHFA’s House Price Index rose by 0.3% MoM in November, and the always-relevant Consumer Confidence tracked by the Conference Board improved, albeit below estimates, to 114.8 in the first month of 2024.
If sellers break below the 2024 low of 1.0795 (January 29), EUR/USD may go further and retest the transitory 100-day SMA of 1.0778, ahead of the December 2023 low of 1.0723 (December 8). The loss of this area predicts a faster slide to the weekly low of 1.0495 (October 13, 2023), followed by the 2023 low of 1.0448 (October 3) and the round level of 1.0400. On the other hand, there is early resistance at the weekly high of 1.0932 (January 24) before another weekly top of 1.0998 (January 5, 11), all before the December 2023 peak of 1.1139 (December 27). This is also supported by the 200-week SMA at 1.1149 and comes before the 2023 high of 1.1275 (July 18). The daily RSI looked stable around 40.
Resistance levels: 1.0885 1.0932 1.0998 (4H chart)
Support levels: 1.0795 1.0723 1.0656 (4H chart)
USDJPY
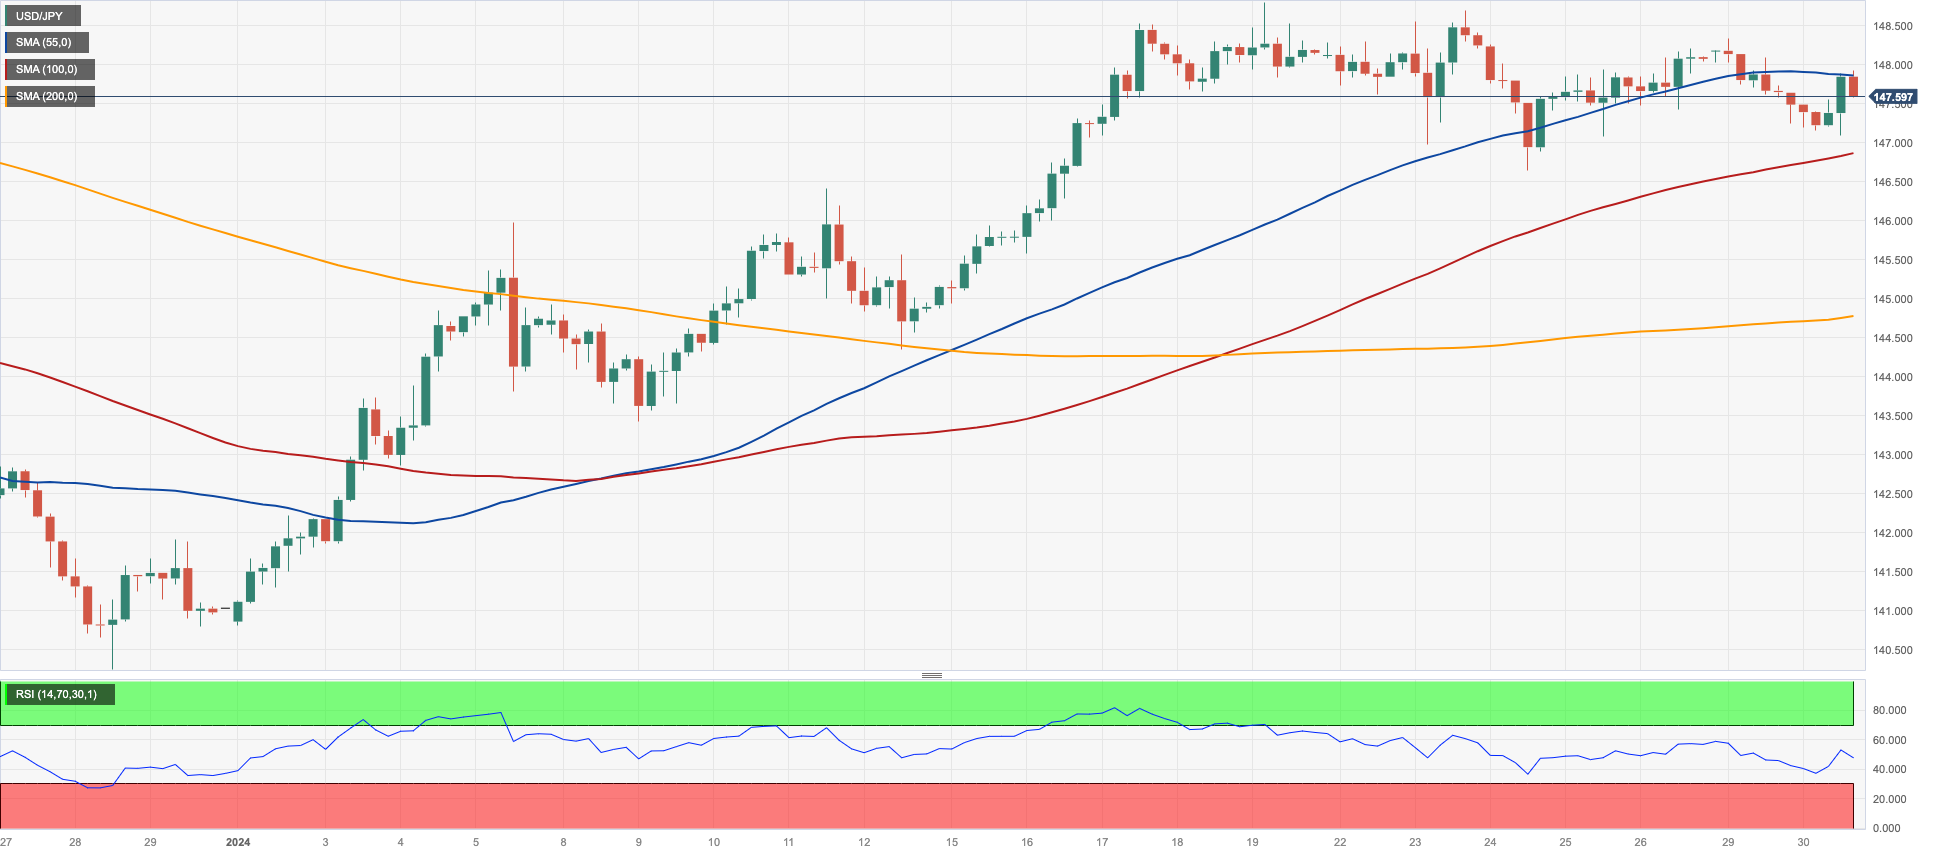
USD/JPY further extended its multi-session choppiness on Tuesday, regaining some upside traction at a time when it also flirted with the key barrier at 148.00 the figure.
Slight gains in the greenback seem to have bolstered the optimism in the pair, along with a decent uptick in the short end of the US yield curve, while JGB 10-year yields traded with marginal moves around the 0.70% level.
In the docket, the Japanese unemployment rate ticked lower to 2.4% in December (from 2.5%), which was the sole release on Tuesday.
Immediately to the upside for USD/JPY aligns the 2024 peak of 148.80 (January 18), before the significant threshold of 150.00, and followed by the 2023 high of 151.90 (November 13). Further up, the 2022 top of 151.94 (October 21) comes before the round number of 152.00. Instead, if the pair falls below the weekly low of 146.65 (January 24), it may later face the provisional 55-day SMA of 145.98, prior to the crucial 200-day SMA of 144.40. The loss of the latter may result in a test of the December 2023 low of 140.24 (December 28) and the round number of 140.00. The low of 137.23 (July 14) shows south of here. The breach of this region will see the next contention zone at the 130.00 level ahead of the March low of 129.63 (March 24).
Resistance levels: 148.33 148.80 149.67 (4H chart)
Support levels: 146.65 144.85 144.34 (4H chart)
GBPUSD
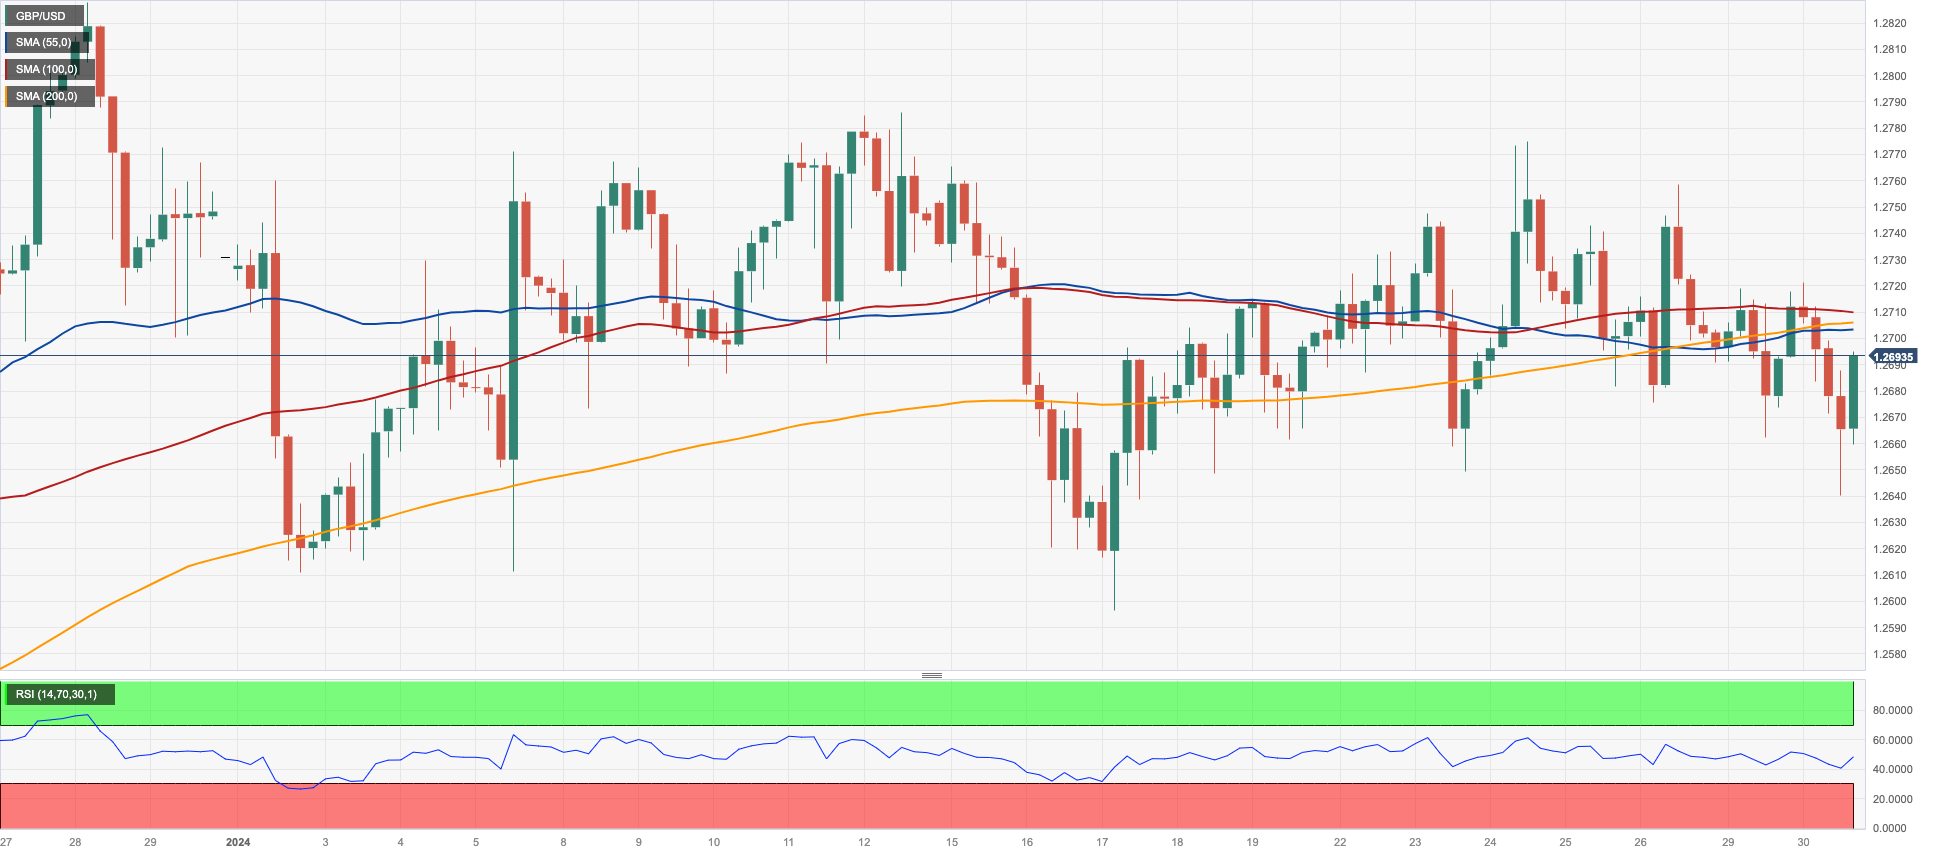
Slight gains in the greenback coupled with poor results from the UK docket seem to have been enough to spark a knee-jerk in GBP/USD to the sub-1.2700 zone on turnaround Tuesday.
In fact, Cable set aside Monday’s promising session and resumed the downside, although always within the broad-based consolidative range in place since the beginning of the year.
In the UK money market, 10-year gilt yields managed to leave behind three sessions in a row of losses and regained the 3.90% zone.
The breakout of the 2024 high at 1.2785 (January 12) may open the way for a potential rally to the December top of 1.2827 (December 28), followed by the weekly peak of 1.2995 (July 27, 2023), which is just shy of the important 1.3000 milestone. On the downside, GBP/USD faces its first battle at the so-far 2024 low of 1.2596 (January 17), ahead of the critical 200-day SMA at 1.2556 and the December 2023 bottom of 1.2500 (December 13). Extra weakness may push spot to target the weekly low of 1.2187 (November 10, 2023), prior to the October 2023 low of 1.2037 (October 3), the critical 1.2000 mark, and the 2023 bottom of 1.1802 (November 10, 2023). The daily RSI dropped below 50.
Resistance levels: 1.2758 1.2774 1.2785 (4H chart)
Support levels: 1.2640 1.2596 1.2500 (4H chart)
GOLD
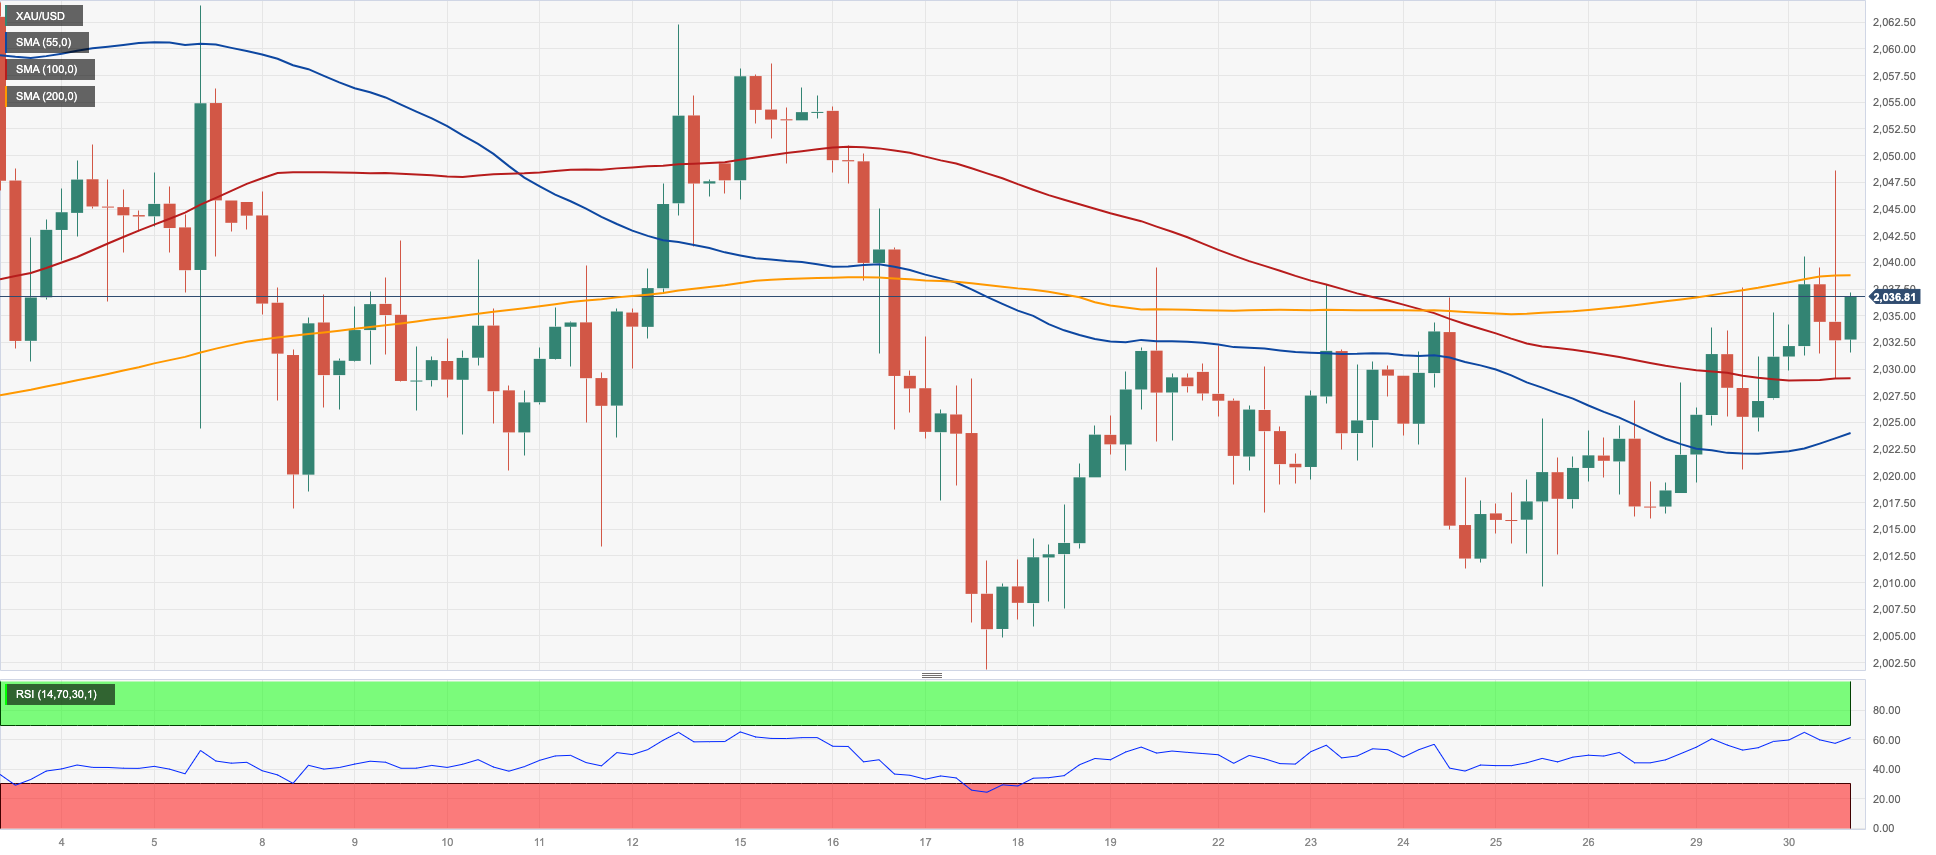
Following a brief advance to multi-day highs around the $2050 zone per troy ounce, gold prices eventually debilitated and ended Tuesday’s session around Monday’s closing levels near $2030.
The late bounce in the greenback and some reaction in the short end of the US yield curve appear to have forced the yellow metal to give away part of that early advance, although the focus of attention will be on the FOMC event on Wednesday.
Although it is widely anticipated that the Federal Reserve will keep its current interest rates unchanged, traders are now focusing on speculating about when the planned interest rate cut might take place, particularly in March or May.
Additionally, the upcoming release of Nonfarm Payrolls on February 2 is also expected to keep the yellow metal under scrutiny.
Extra losses might push Gold to retest its 2024 level of $2001, which is still supported by the critical $2000 zone. If this zone breaks down, prices may fall to the December 2023 bottom of $1973, followed by the 200-day SMA at $1964 ahead of the November 2023 low of $1931. In the case of more losses, the price may retest the October 2023 bottom of $1810, then the 2023 low of $1804, and maybe the $1800 level. Having said that, the initial upward barrier matches the weekly top of $2088 (December 28), which precedes the all-time peak of $2150 (December 4, 2023).
Resistance levels: $2048 $2062 $2078 (4H chart)
Support levels: $2009 $2001 $1973 (4H chart)
CRUDE WTI
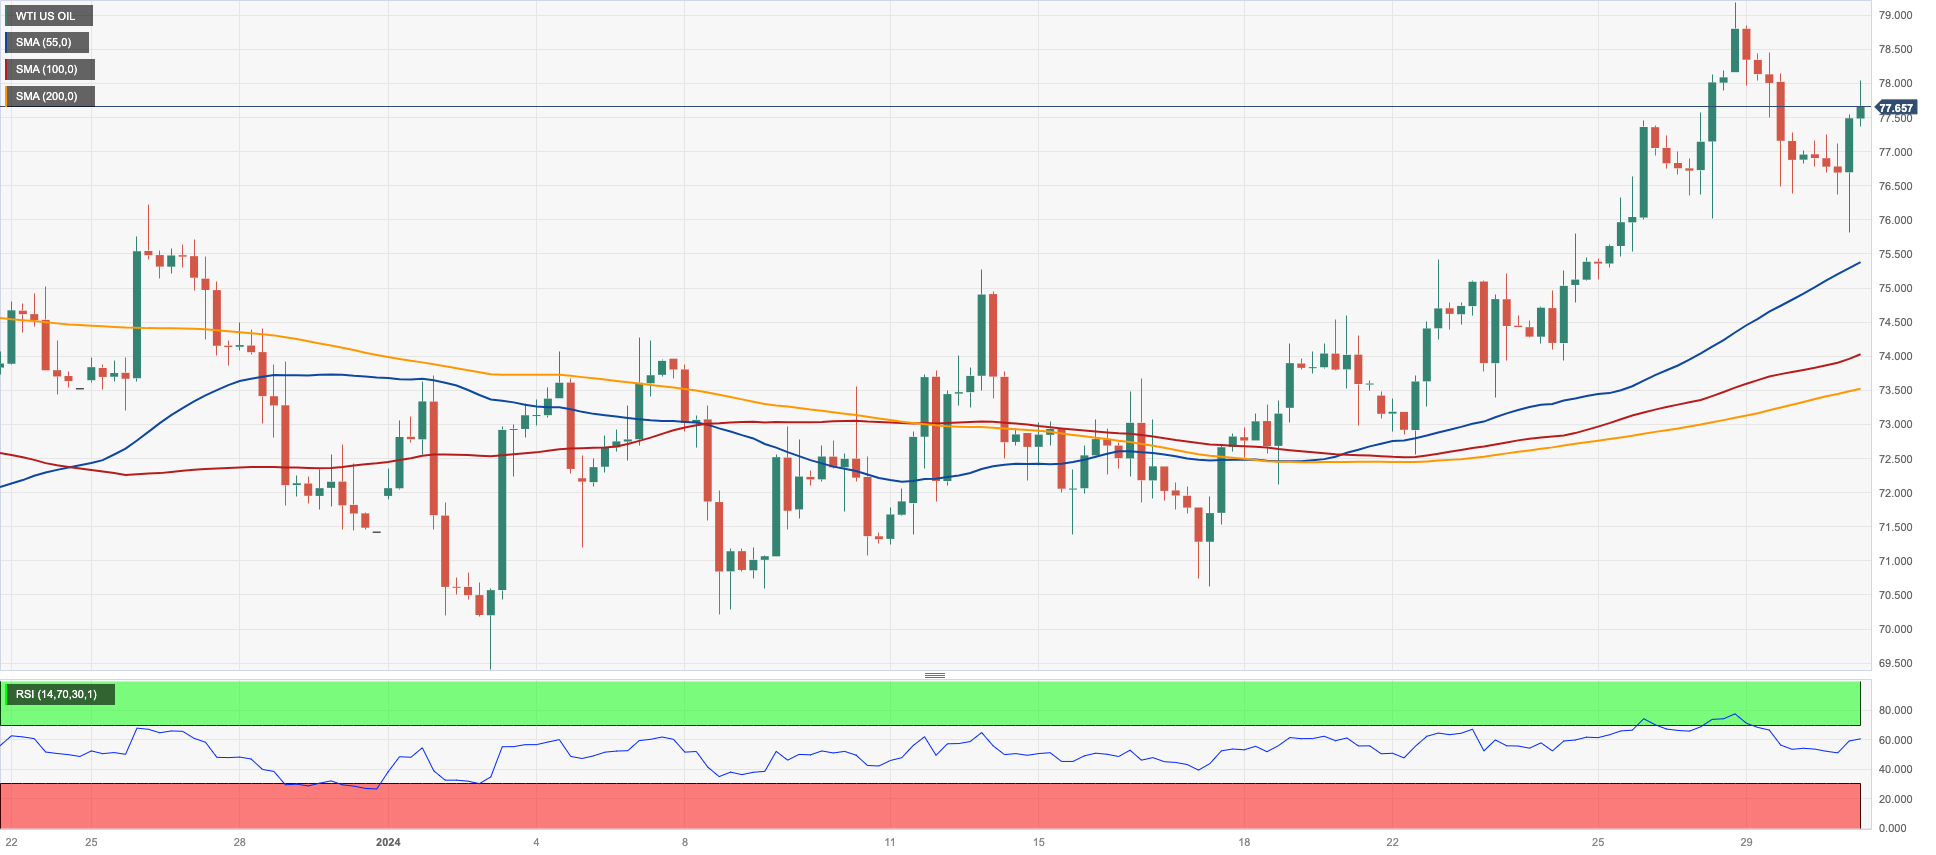
WTI prices regained the smile and rapidly reversed Monday’s bearish price action, reclaiming the area beyond the $78.00 mark per barrel on Tuesday.
The resurgence of buying pressure around the commodity was once again sparked by geopolitical jitters, particularly in the Red Sea, while the IMF’s upbeat economic outlook on China and the US also added to the constructive tone among traders.
Finally, the perception that the Federal Reserve will keep its monetary conditions unchanged at its event on Wednesday also appears to have bolstered the sentiment.
WTI's next upward target is the 2024 high of $79.25 (January 29), which is immediately followed by the key $80.00 barrier and comes ahead of the November 2023 top of $80.15 (November 3). Extra gains from here may propel the market back to its weekly peak of $89.83 (October 18, 2023), seconded by the 2023 high of $94.99 (September 28, 2023) and the August 2022 top of $97.65 (August 30), all before hitting the critical $100.00 level. In the opposite direction, there is temporary support at the 55-day SMA at $73.83, prior to the 2024 low of $69.31 (January 3), which comes before the December 2023 low of $67.74 (December 13) and the June 2023 bottom of $66.85 (June 12).
Resistance levels: $79.25 $79.56 $83.56 (4H chart)
Support levels: $75.82 $73.38 $72.53 (4H chart)
GER40
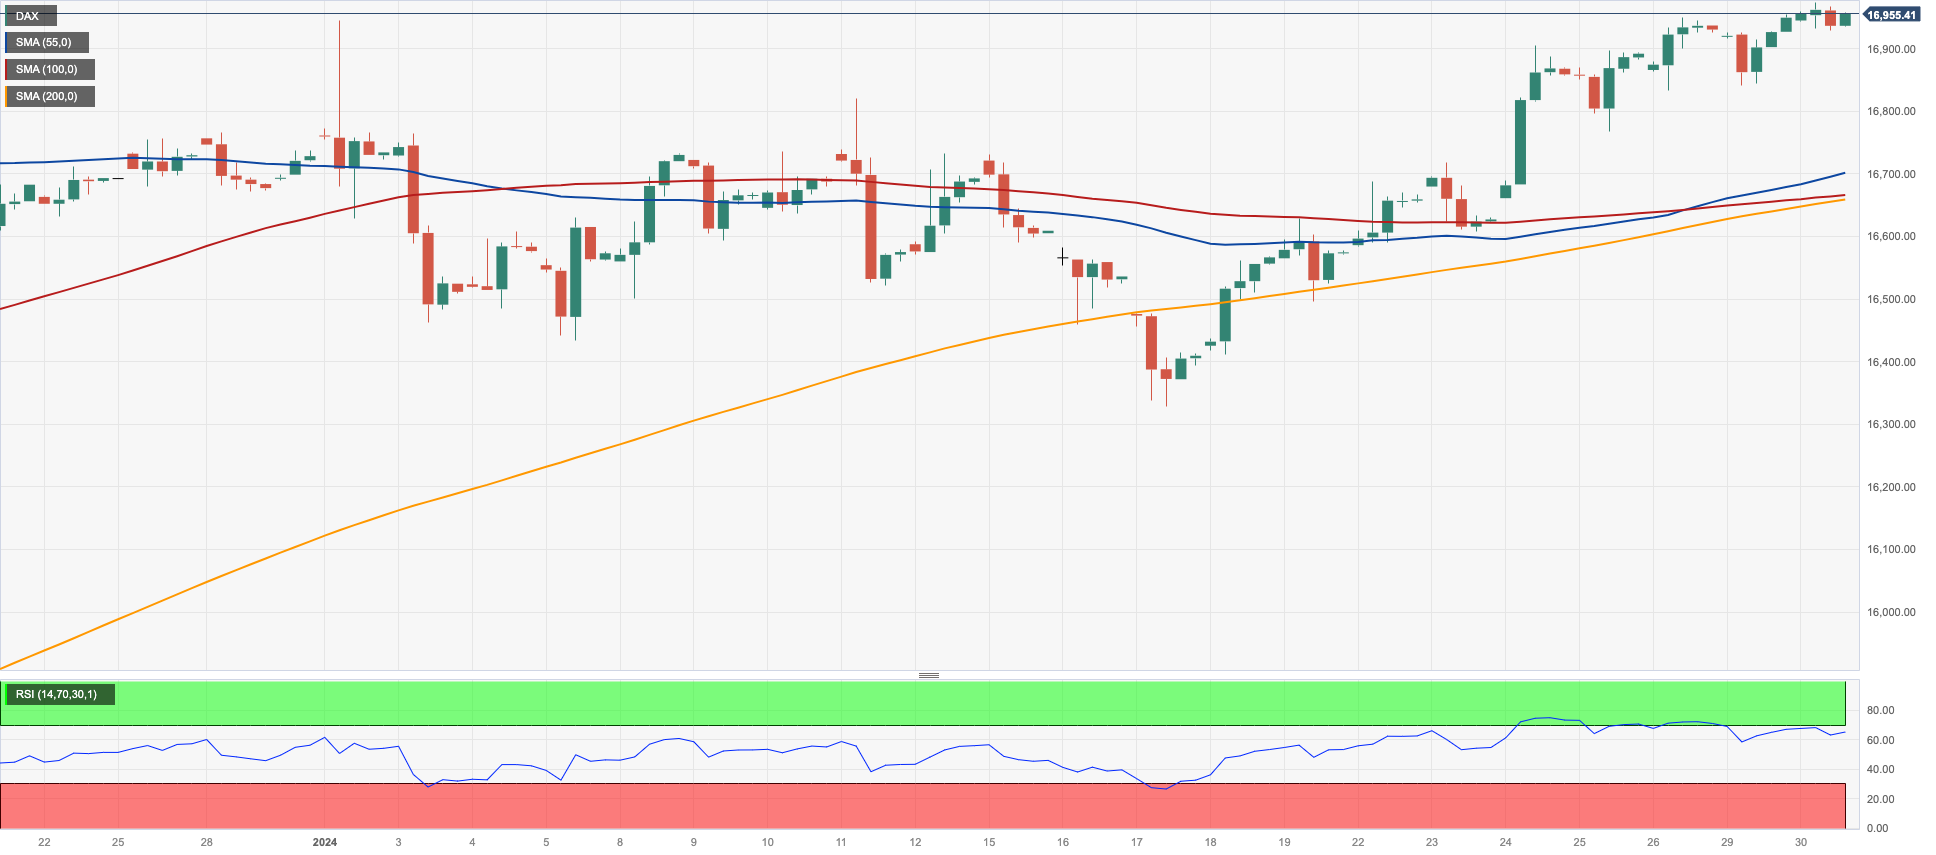
Germany’s benchmark index DAX40 left behind Monday’s pullback, advancing modestly and flirting with the key 17000 threshold on Tuesday.
In fact, the buying interest in European stocks gathered traction after advanced GDP figures saw the region’s economy avoid recession in the October–December period. In the same direction, the IMF revised its forecast for global economic growth in 2024, which further contributed to the positive sentiment among investors.
Also on the positive side, the constructive price action was also underpinned by steady expectations that the Fed will leave its monetary conditions unchanged at its January 31 event.
In the German debt market, 10-year bund yields edged higher and approached 2.27%.
The DAX40 is immediately on an upward trend, with the 2024 peak of 16999 (January 30), followed by the all-time high of 17003. (December 14). Immediately to the downside are the YTD low of 16345 (January 17), ahead of the crucial 200-day SMA of 15935 and the weekly low of 15915 (November 28). The October 2023 low of 14630 (October 23) follows next, before the March 2023 low of 14458 (March 20) (March 20). The daily RSI ticked higher to the proximity of 65.
Best Performers: Sartorius AG VZO, Heidelbergcement, Infineon
Worst Performers: Zalando SE, MTU Aero, Bayer
Resistance levels: 16999 17003 (4H chart)
Support levels: 16345 16188 15915 (4H chart)
GBPJPY
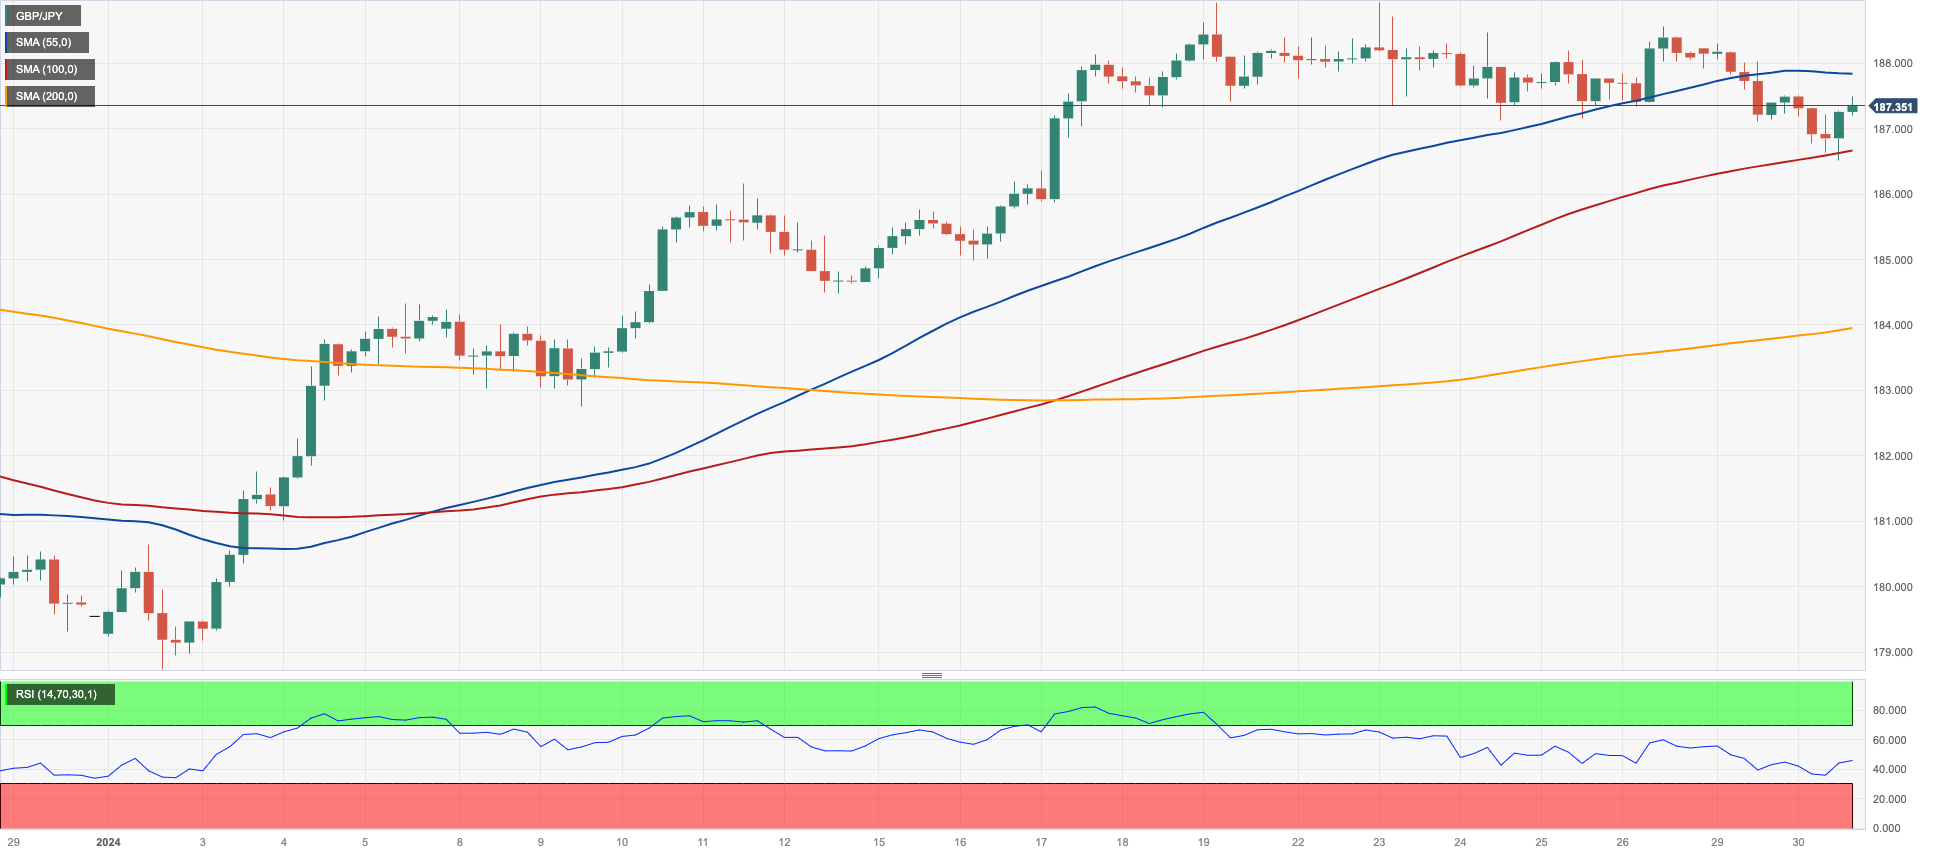
The ongoing gradual multi-day decline this time saw GBP/JPY drop to new two-week lows near 186.50 on Tuesday.
The bearish bias in the British pound was a drag for the cross, which added to losses recorded at the beginning of the week, although it manages well to keep the trade in the upper end of its range for the time being.
A rise over the 2024 high of 188.93 (January 19) may lead to a test of the round number of 190.00 before the August 2015 top of 195.28 (August 18). On the contrary, GBP/JPY is likely to find short-term support around the 55-day and 100-day SMAs of 184.81 and 183.88, respectively, before reaching the more crucial 200-day SMA of 181.27. A breakdown of the latter reveals the December 2023 low of 178.33 (December 14), coming before the October 2023 low of 178.03 (October 3), and the July 2023 low of 176.30, all ahead of the May 2023 low of 167.84 (May 11). The daily RSI deflated below the 60 yardstick.
Resistance levels: 188.56 188.93 189.99 (4H chart)
Support levels: 186.51 184.97 184.47 (4H chart)
NASDAQ
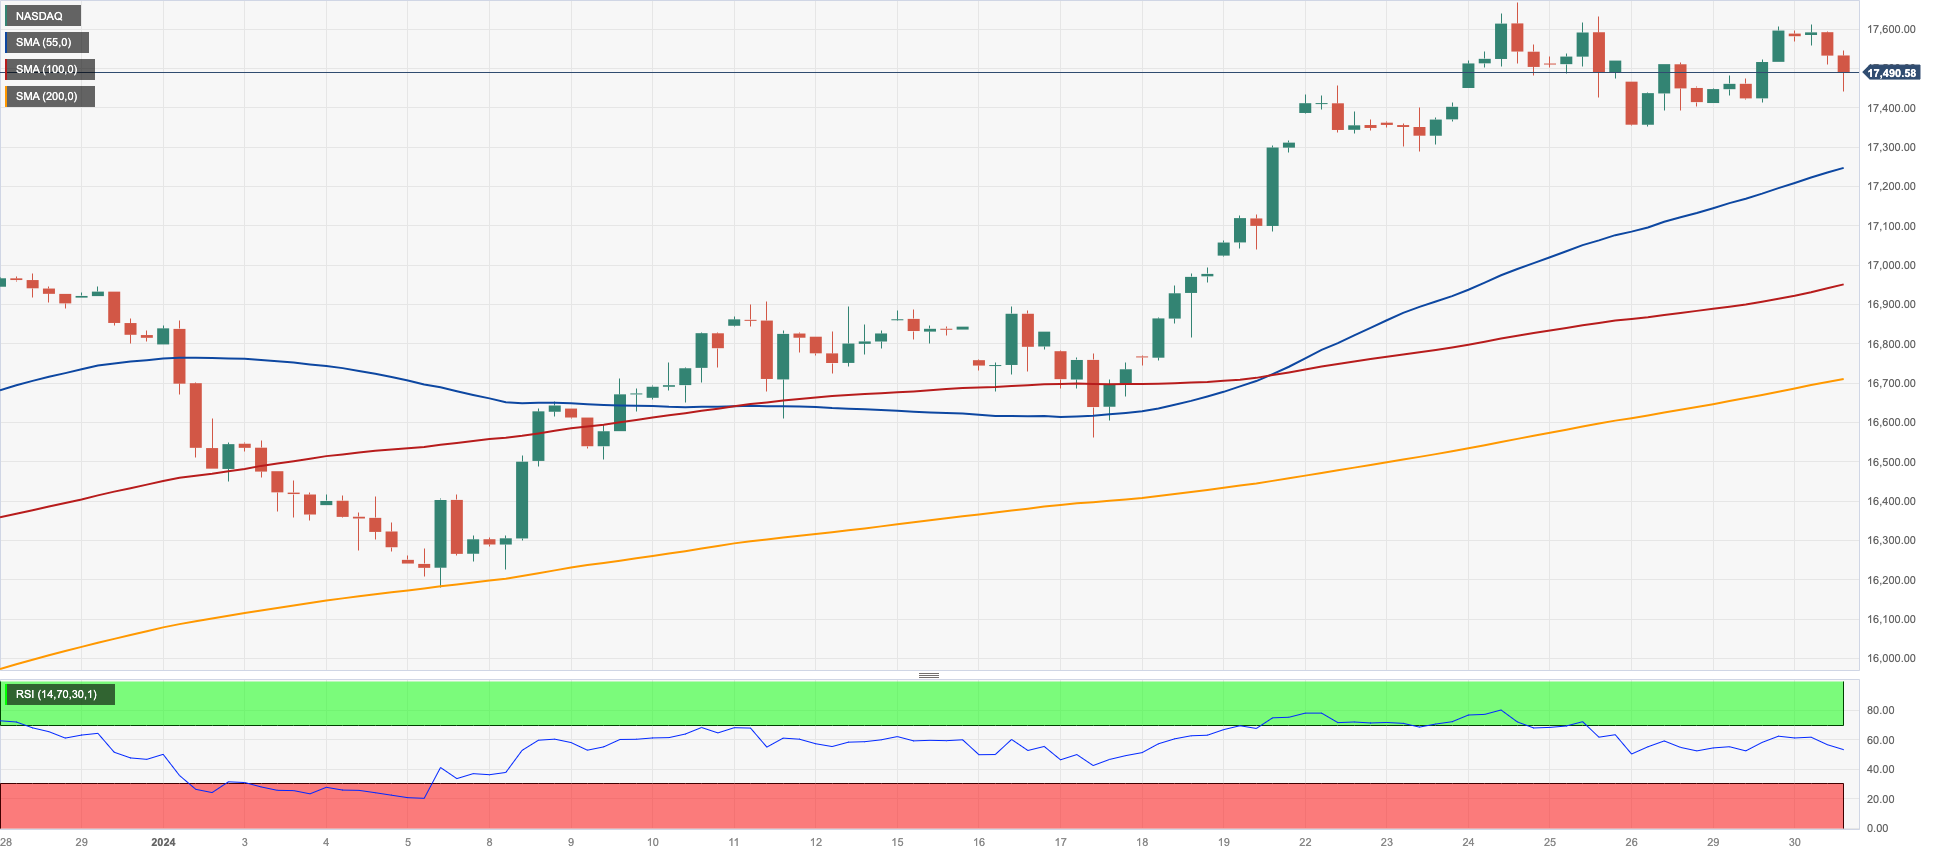
The US tech sector gave away part of Monday’s advance and prompted the reference Nasdaq 100 to retreat markedly on turnaround Tuesday.
In fact, prudence ahead of the publication of key earnings reports by megacaps Microsoft, Alphabet, Apple, and Amazon, among others, seems to have kept buyers at bay for the time being.
In the meantime, all the attention remains on the 2-day FOMC meeting, which is expected to end on Wednesday without any move on interest rates, while the start of the easing cycle (March or May) is expected to come to the fore in the press conference by Chair Powell.
On January 24, the Nasdaq reached a new record high of 17665 points. Conversely, bearish attempts should aim for the 2024 bottom of 16249 (January 5), which emerges prior to the December 2023 low of 15695 (December 4) and the key 200-day SMA of 15162. A decline below the latter might cause a regression to the October 2023 low of 14058 (October 26) and the April 2023 low of 12724 (April 25). South from here resurfaces the March 2023 low of 11695 (March 13), before the 2023 low of 10696 (January 3). The RSI deflated to the sub-68 area.
Top Gainers: Vertex, ComCast, O’Reilly Automotive
Top Losers: AMD, PDD Holdings DRC, DoorDash
Resistance levels: 17665 (4H chart)
Support levels: 16561 16249 15695 (4H chart)
DOW JONES
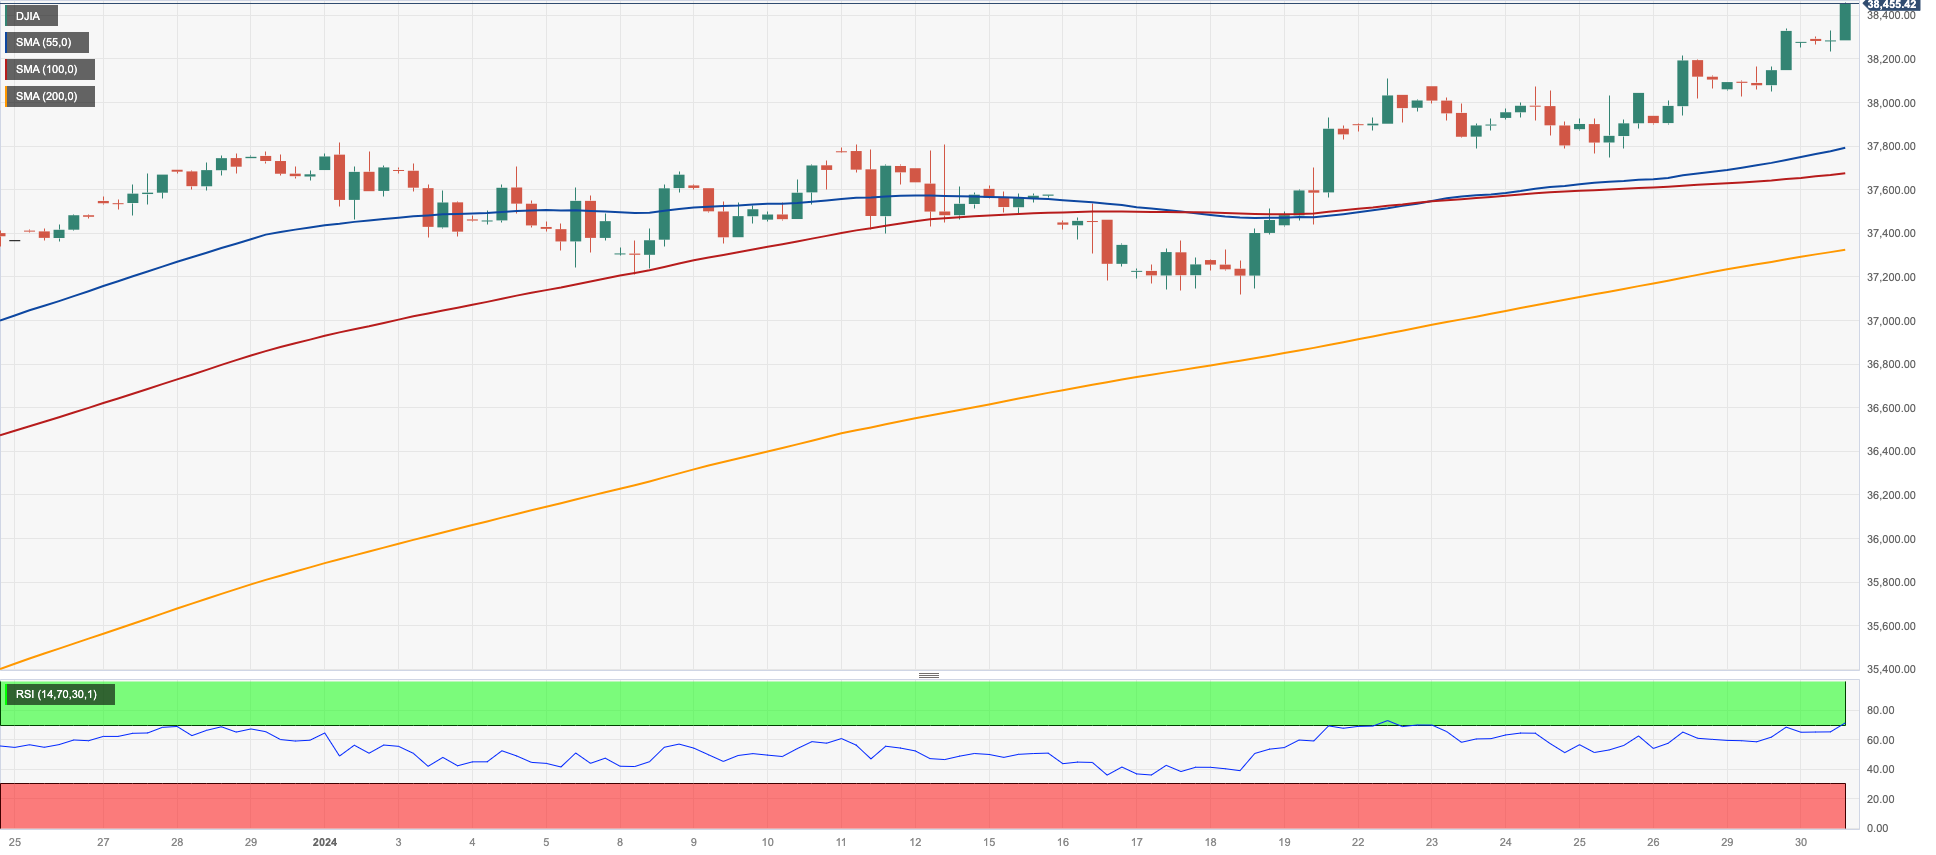
US stocks measured by the Dow Jones rose to a new all-time high near the 38500 zone on Tuesday.
Further gains in the benchmark index came on the back of positive results from corporate earnings reports, particularly from General Motors, while investors geared up for the imminent decision on rates by the Fed on Wednesday.
Despite the fact that the Committee is expected to keep rates on hold, a key factor will be the potential timing of the first interest rate cut, which, according to markets, could be in March or May.
On Tuesday, the Dow Jones gained 0.31% to 38453, the S&P500 dropped 0.02% to 4926, and the tech-heavy Nasdaq Composite retreated 0.74% to 15512.
Extra gains may lift the Dow Jones to its all-time high of 38455 (January 30). Alternatively, there is instant conflict at the 2024 bottom of 37122 (January 18), which occurs sooner than the weekly low of 37073 (December 20, 2023). The breakdown of the latter reveals a possible challenge of the intermediate 55- and 100-day SMAs at 36710 and 35381, respectively. The 200-day SMA is immediately down at 34783, ahead of the weekly low of 33859 (November 7, 2023), the October 2023 low of 32327 (October 27), and the 2023 low of 31429 (March 15). The daily RSI climbed past the 72 level, indicative of an overbought market.
Top Performers: JPMorgan, Goldman Sachs, Visa A
Worst Performers: Boeing, Apple, Intel
Resistance levels: 38455 (4H chart)
Support levels: 37122 37073 36021 (4H chart)
MACROECONOMIC EVENTS

All Information & Updates provided by:

All information relating to the financial markets available on this page has been prepared and issued by FXStreet (Forexstreet SL, Spain, Reg: B62498233) on the basis of publicly available information and all information believed to be reliable and does not conflict with Kuwaiti local laws, and all necessary care has been taken to before the company to ensure that the facts mentioned are correct from the source.
NCM Investment nor any of its directors or employees shall in any way be held responsible for the contents of this news, and the information contained on this page is intended only to provide clients with publicly available information and should not be construed as investment advice, report or analysis and/or constitute an offer or invitation to buy or sell financial instruments of any kind.
RISK WARNING: Forex and CFDs are highly risky leveraged products, as losses can exceed deposits. Please ensure you understand all the risks and take independent advice if necessary. NCM will segregate the clients based on the criteria of the regulator and its bylaws. NCM does not provide any advisory service; the material published does not constitute advice or a recommendation for a transaction in any financial instrument. NCM accepts no responsibility for any use of the content presented and any consequences of that use. Anyone acting on the information provided does so at their own risk.