Daily Market Updates
01 Feb 2024
EURUSD
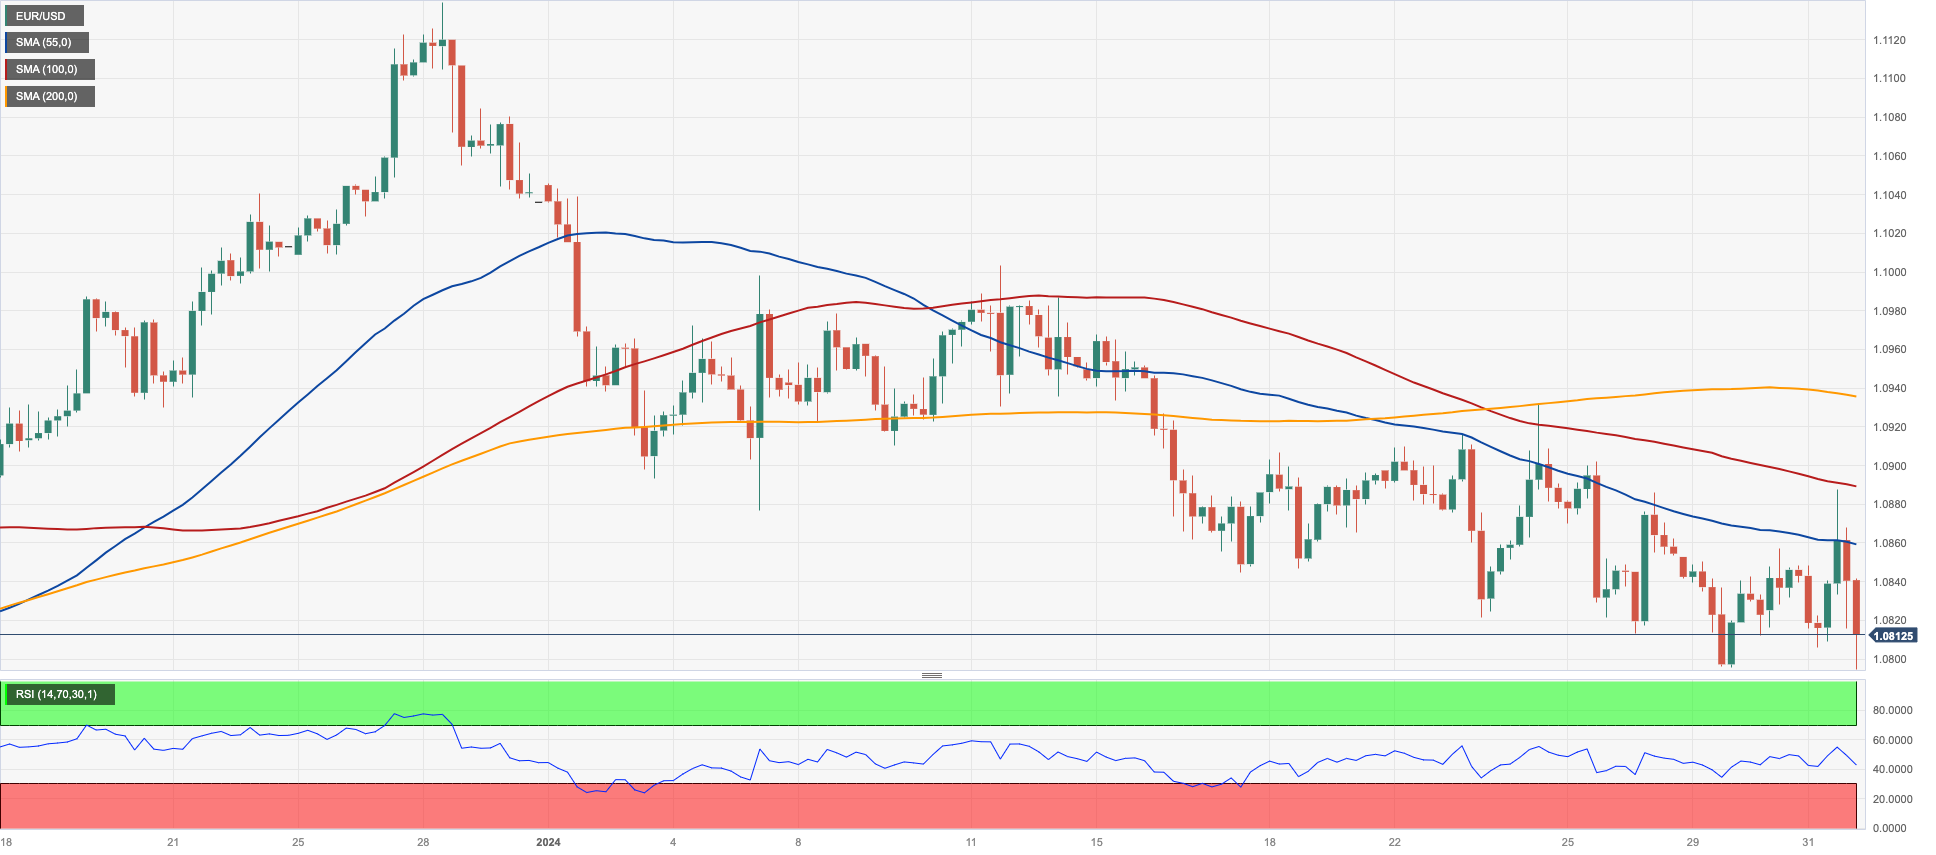
EUR/USD resumed its downward bias and revisited the area of yearly lows just below 1.0800 the figure on Wednesday, always on the back of USD-dynamics and following the FOMC event earlier in the day.
On the latter, the Federal Reserve matched consensus and left its interest rates unchanged, citing an "uncertain" economic outlook. Furthermore, the reference to potential additional rate hikes has been removed.
Later in the session, Chief Powell stated that the Federal Reserve is prepared to maintain the current policy rate for a longer duration if necessary. He mentioned that ongoing progress on inflation is not assured and indicated that it will likely be appropriate to begin reducing rates sometime this year. Powell emphasized that the labour market remains tight, but he also acknowledged that reducing the policy rate too late could unduly weaken the economy. He stated that decisions will continue to be made meeting by meeting and expressed the belief that the policy rate is likely at its peak.
However, Powell’s mention that an interest rate cut in March seems unlikely boosted the greenback and sparked a noticeable rebound in US yields across different time frames, eventually forcing the pair to retreat further.
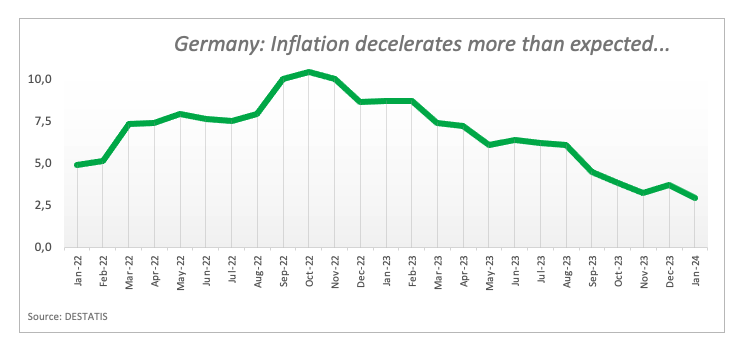
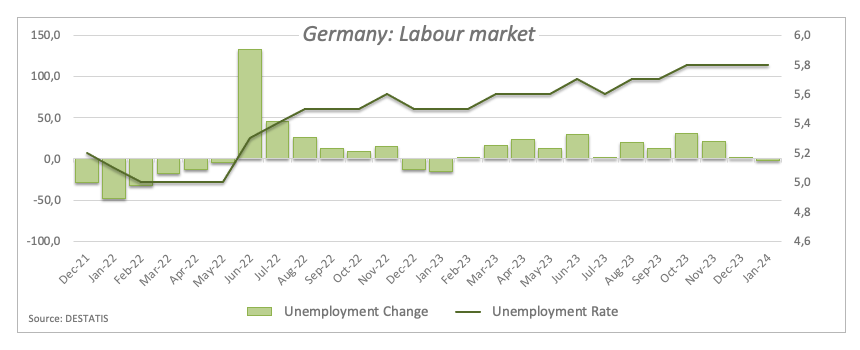
In the euro docket, Germany was in the spotlight after Retail Sales contracted 1.7% YoY in December, while the January labour market report showed the jobless rate steady at 5.8% and the Unemployment Change down by 2K individuals. Finally, advanced inflation figures showed the CPI rose less than estimated by 2.9% in the year to January and 0.2% from a month earlier.
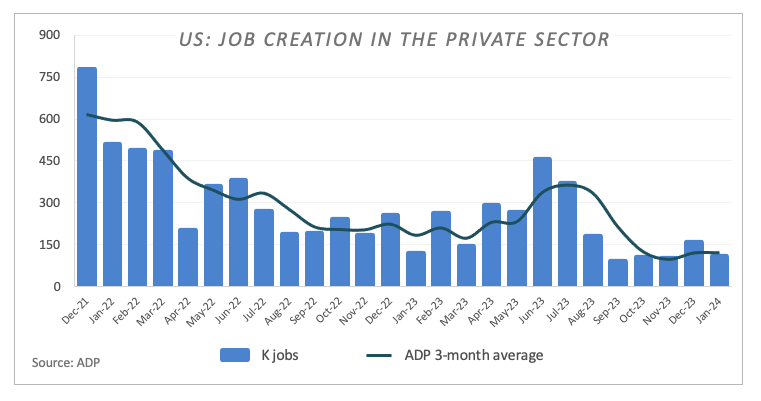
Across the ocean and other than the FOMC event, the ADP report saw the US private sector add fewer jobs than anticipated by 107K during the first month of the year. Further data indicates that Mortgage Applications contracted 7.2% in the week to January 26, while Employment Cost – Benefits increased by 0.7% QoQ and Employment Cost – Wages rose by 0.9% QoQ.
If sellers break below the 2024 low of 1.0794 (January 31), EUR/USD may challenge the transitory 100-day SMA of 1.0778, ahead of the December 2023 bottom of 1.0723 (December 8). The loss of this region indicates a speedier drop to the weekly low of 1.0495 (October 13, 2023), ahead of the 2023 low of 1.0448 (October 3) and the round level of 1.0400. The other way around, there is early resistance at the weekly high of 1.0932 (January 24), followed by another weekly top of 1.0998 (January 5, 11), all before the December 2023 high of 1.1139 (December 27). This level is also reinforced by the 200-week SMA at 1.1149 and aligns before the 2023 top of 1.1275 (July 18). The daily RSI dropped below 38.
Resistance levels: 1.0885 1.0932 1.0998 (4H chart)
Support levels: 1.0794 1.0723 1.0656 (4H chart)
USDJPY
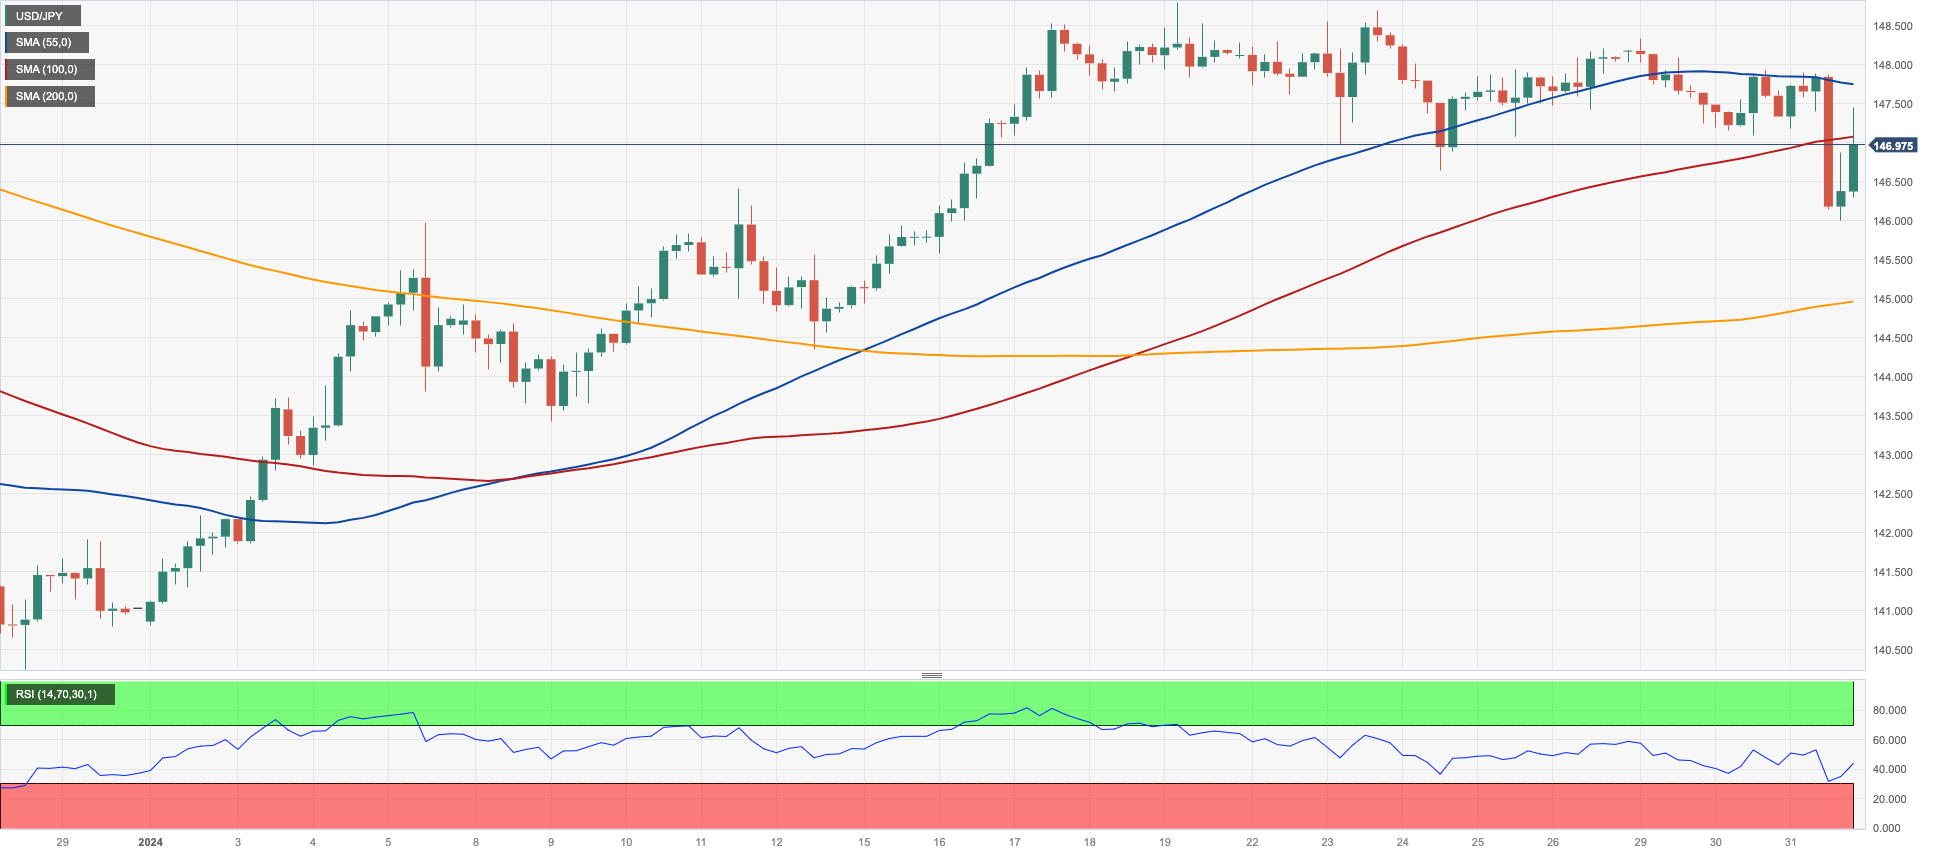
USD/JPY ended Wednesday’s session with a noticeable drop, although it managed to bounce off multi-day lows around 146.00, an area coincident with the provisional 55-day SMA.
The increased volatility in the pair came in response to the equally vacillating mood seen in the FOMC event, where the Fed left its rates unchanged, as expected, and Chief Powell kind of ruled out an interest rate cut in March at his press conference.
From the BoJ, the Summary of Opinions of its meeting on January 22-23 indicated an increased emphasis on the central bank's efforts to implement its initial interest rate hike since 2007 and depart from its enduring policy of negative interest rates. Nonetheless, the discussions fell shy of outlining a definite timeline for these policy changes.
On the domestic calendar, flash Industrial Production is seen contracting 0.7% in the year to December, while Retail Sales dropped by 2.1% YoY in the same month. In addition, Consumer Confidence improved a tad to 38 for the current month and Housing Starts shrank by 4.0% YoY in December.
Immediately to the upside for USD/JPY aligns the 2024 top of 148.80 (January 18), before the major hurdle of 150.00, and then the 2023 peak of 151.90 (November 13). Further up, the 2022 high of 151.94 (October 21) precedes the round number of 152.00. Instead, if the pair goes below the weekly low of 146.65 (January 24), it may encounter the provisional 55-day SMA of 145.92, which comes before the critical 200-day SMA of 144.46. The loss of the latter might force a test of the December 2023 low of 140.24 (December 28) prior to the round number of 140.00 and the July low of 137.23 (July 14). The everyday RSI dropped to the 56 region.
Resistance levels: 148.33 148.80 149.67 (4H chart)
Support levels: 146.00 144.85 144.34 (4H chart)
GBPUSD
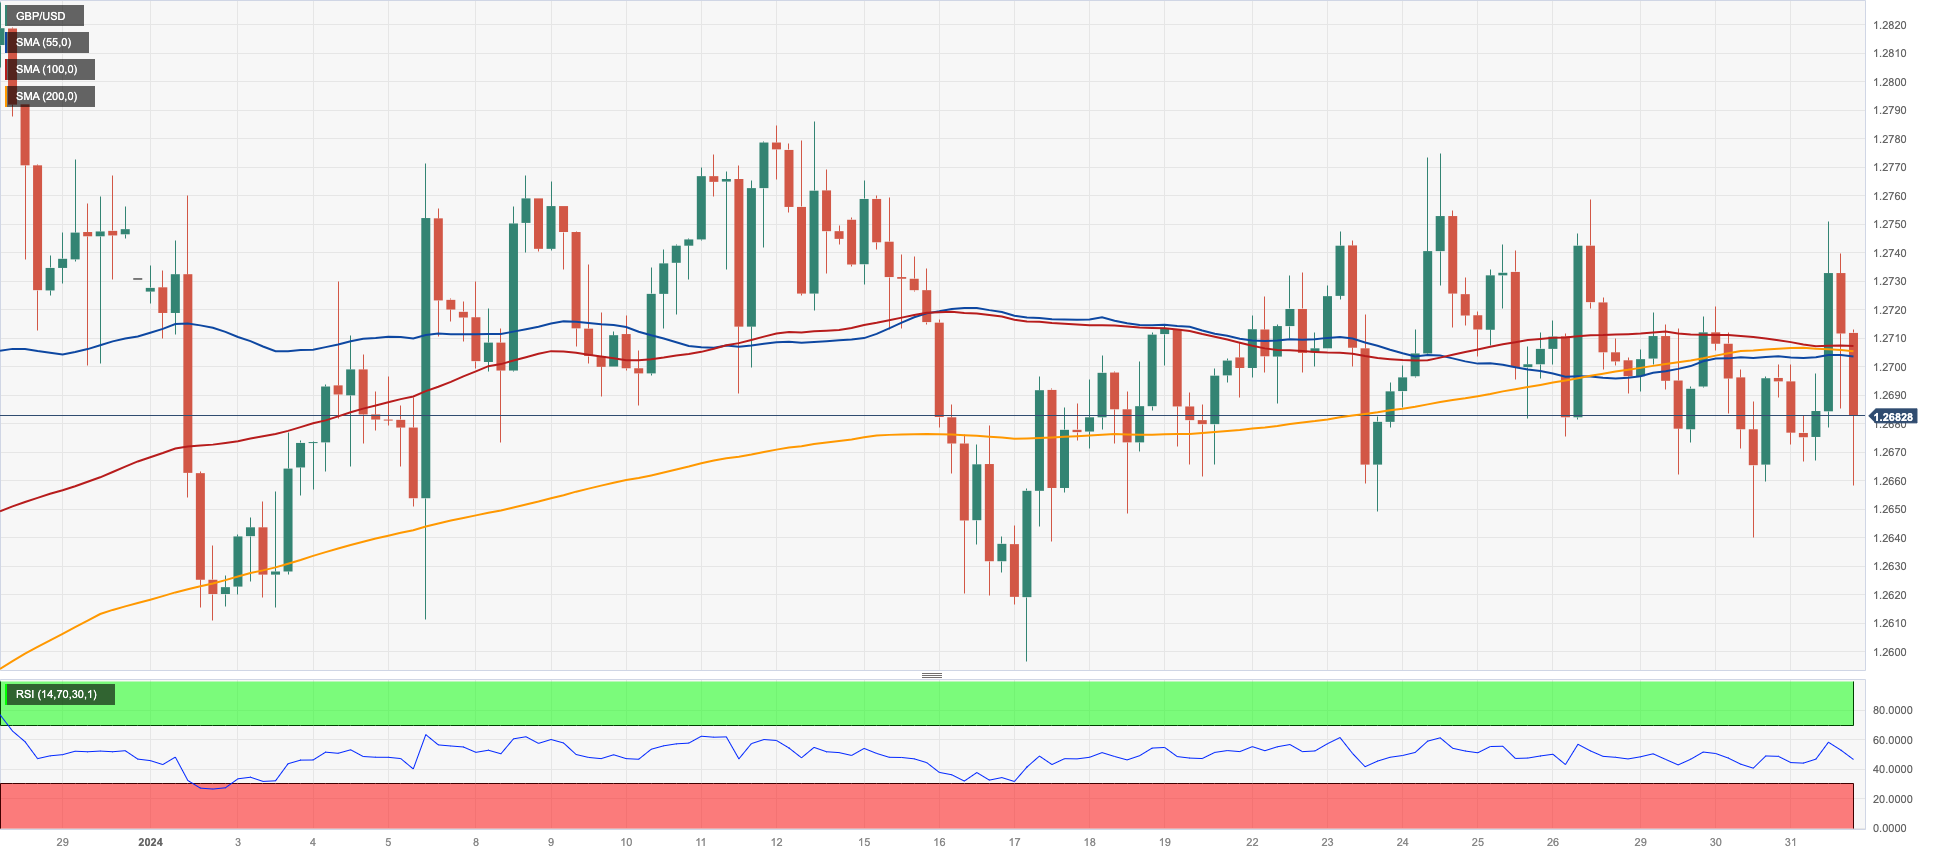
The moderated advance in the greenback post-Fed decision prompted a knee-jerk in the risk-linked galaxy and dragged GBP/USD from daily highs near 1.2750 to the 1.2680 region on Wednesday.
That said, Cable added to Tuesday’s decline, although it maintained the 1.2600–1.2800 consolidative range well in place for yet another session.
Moving forward, the British pound is expected to remain under the microscope as markets get ready for the BoE monetary policy meeting on February 1, when the “Old Lady” is widely seen maintaining its policy rate unchanged.
Data wise across the Channel, house prices measured by Nationwide contracted 0.2% in the year to January.
The trespass of the 2024 top at 1.2785 (January 12) may pave the way for a possible rally to the December peak of 1.2827 (December 28), followed by the weekly high of 1.2995 (July 27, 2023), which is just shy of the crucial 1.3000 yardstick. On the downside, GBP/USD confronts its first struggle at the so-far 2024 low of 1.2596 (January 17), ahead of the important 200-day SMA at 1.2557 and the December 2023 low of 1.2500 (December 13). Extra weakness may drive spot to seek the weekly low of 1.2187 (November 10, 2023), before to the October 2023 low of 1.2037 (October 3), the key 1.2000 level, and the 2023 bottom of 1.1802 (November 10, 2023). The daily RSI slipped back below 48.
Resistance levels: 1.2758 1.2774 1.2785 (4H chart)
Support levels: 1.2640 1.2596 1.2500 (4H chart)
GOLD
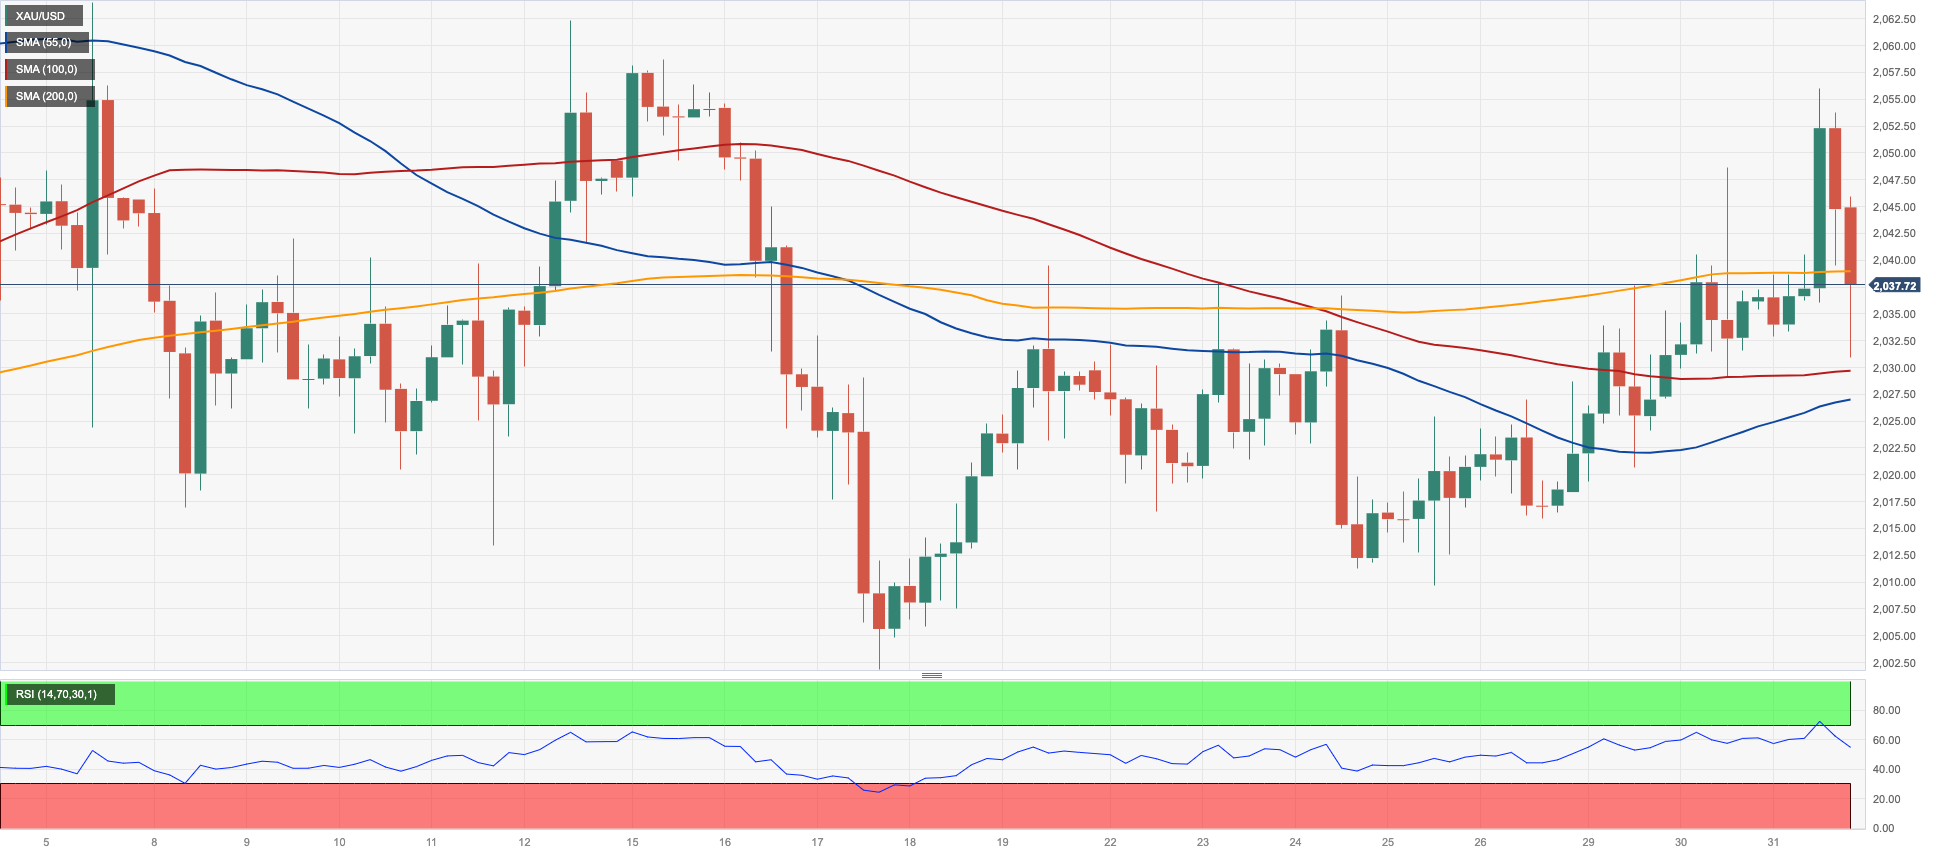
Gold prices could not sustain a move to new multi-day peaks past the $2050 mark per troy ounce on Wednesday, retreating afterwards to the $2030 zone as traders continued to digest the FOMC gathering.
In fact, the yellow metal ended around Tuesday’s closing levels after the Fed showed no rush to reduce rates, adding that the bank needs more evidence that inflation is heading towards its target at the time when Powell almost excluded a rate cut at the March gathering.
Furthermore, the next announcement of Nonfarm Payrolls on February 2 is anticipated to keep the yellow metal in focus.
Extra rebound may cause Gold to revisit the weekly peak of $2088 (December 28), which precedes the all-time record of $2150 (December 4, 2023). Just the opposite, a drop below the 2024 low could put a potential move to the December 2023 low of $1973 back on the radar, seconded by the 200-day SMA at $1964 and the November 2023 low of $1931. In the event of more losses, the metal may retest the October 2023 low of $1810, then the 2023 low of $1804, and maybe the $1800 level.
Resistance levels: $2056 $2062 $2078 (4H chart)
Support levels: $2009 $2001 $1973 (4H chart)
CRUDE WTI
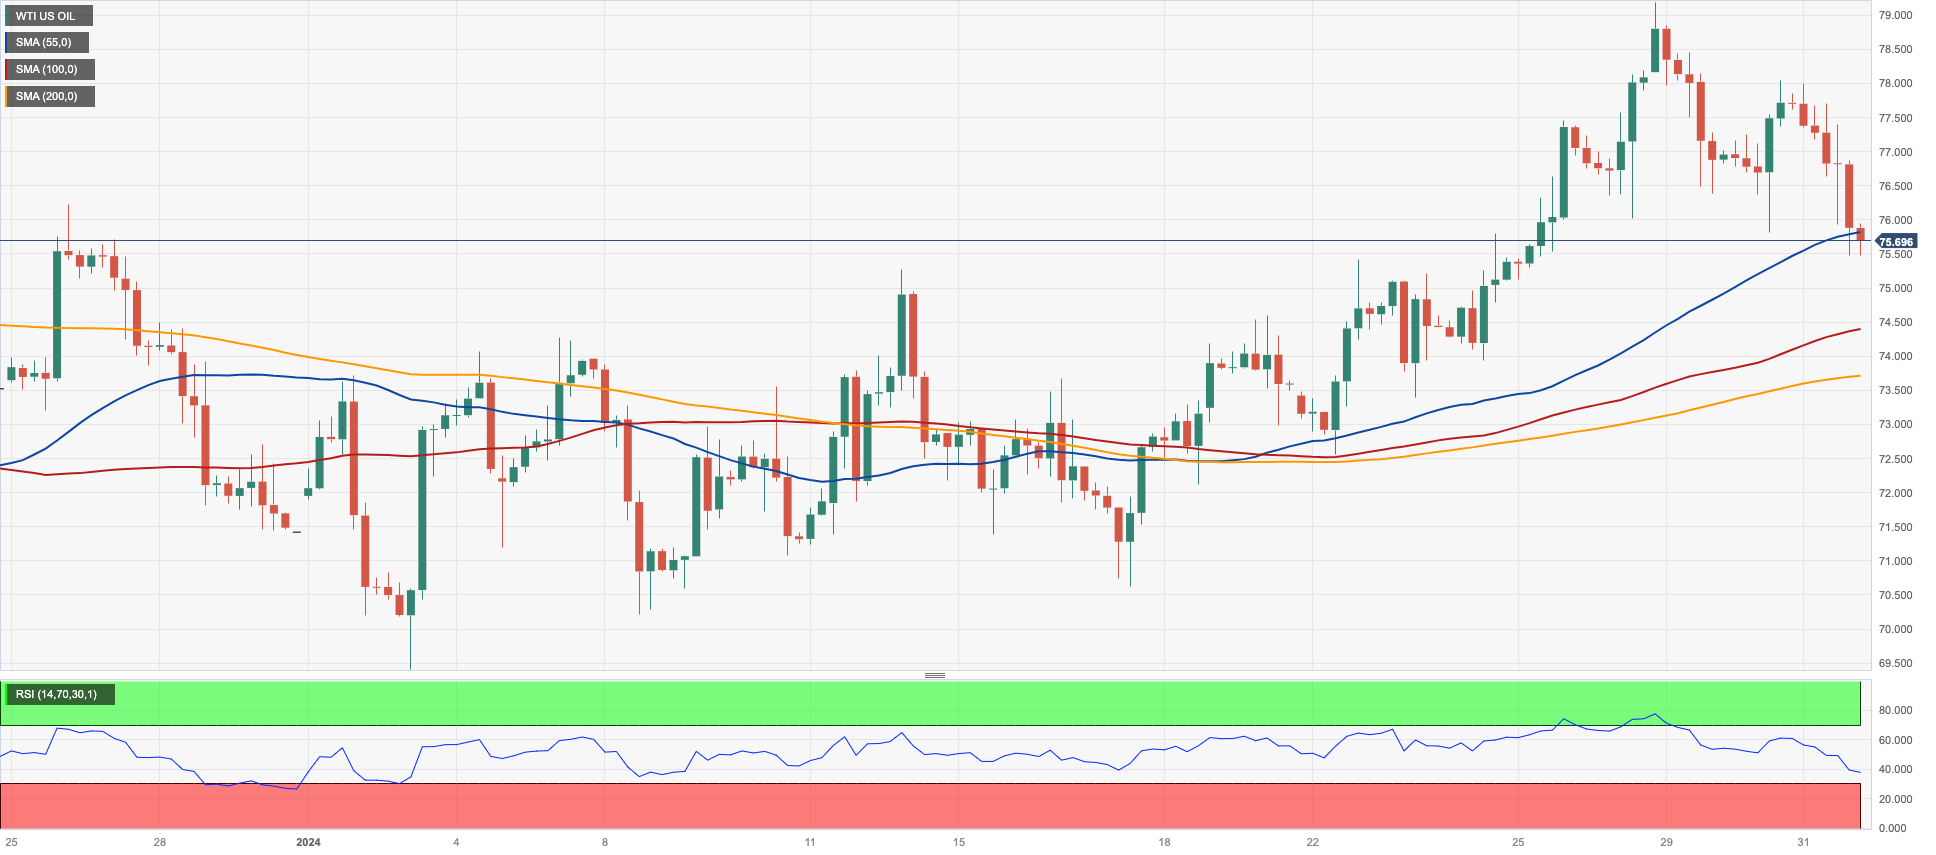
Prices of WTI dropped to weekly lows in the sub-$76.00 region per barrel on Thursday.
The marked decline in the commodity came in response to reignited demand concerns in China, particularly after discouraging results from the manufacturing and services sectors tracked by NBS.
Also contributing to the downside in prices was the unexpectedly larger-than-expected build of US crude oil inventories, as per the EIA’s report. Indeed, the agency reported that US crude oil inventories increased by 1.234M barrels in the week to January 26, while supplies at Cushing dropped by 1.972M barrels, Weekly Distillate Stocks shrank by 2.542M barrels and gasoline stockpiles unexpectedly rose by 1.156M barrels.
The next upward objective for WTI is the 2024 high of $79.25 (January 29), which is immediately followed by the important $80.00 barrier and comes ahead of the November 2023 top of $80.15 (November 3). Extra upside from here may take the market back to its weekly peak of $89.83 (October 18, 2023), ahead of the 2023 high of $94.99 (September 28, 2023) and the August 2022 top of $97.65 (August 30), all before reaching the important $100.00 level. In the reverse direction, there is temporary support at the 55-day SMA at $73.80, before the 2024 low of $69.31 (January 3), and the December 2023 low of $67.74 (December 13), all ahead of the June 2023 bottom of $66.85 (June 12).
Resistance levels: $79.25 $79.56 $83.56 (4H chart)
Support levels: $75.56 $73.38 $72.53 (4H chart)
GER40
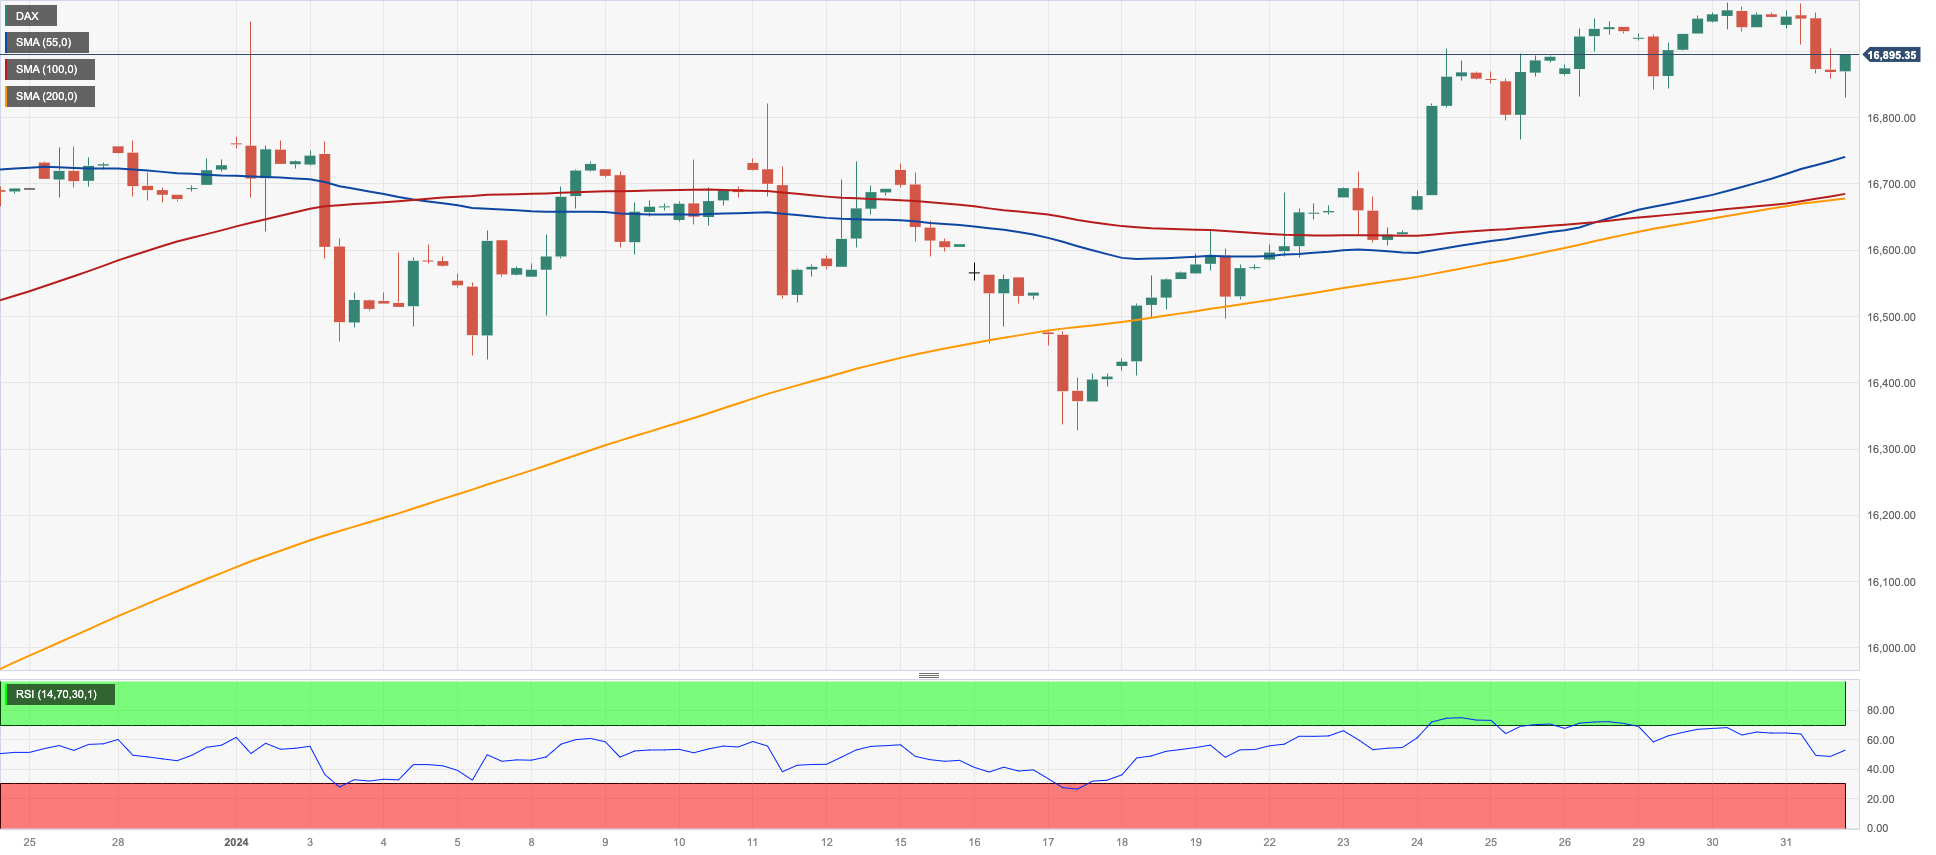
The DAX40 clinched its second daily pullback in the last three days, this time revisiting the 16900 region on Wednesday.
The negative performance of Germany’s reference index came on the back of discouraging results from Chinese manufacturing and services PMIs gauged by the NBS for the month of January, while an upbeat domestic labour market report and lower-than-expected preliminary inflation readings also added to the daily developments.
Next of note in the region will be the interest rate decision by the BoE due on February 1, with consensus expecting the bank to refrain from acting on rates.
Looking at the local debt market, 10-year bund yields dropped to two-week lows near 2.15%, in line with the majority of their global peers.
The DAX40 is immediately on a rising trend, with the next target at the 2024 peak of 16999 (January 30) closely followed by the all-time high of 17003 (December 14). Immediately to the downside emerges the YTD low of 16345 (January 17), ahead of the critical 200-day SMA of 15941 and the weekly low of 15915 (November 28). The October 2023 low of 14630 (October 23) comes next, before the March 2023 low of 14458 (March 20). The daily RSI slipped back to the 60 area.
Best Performers: Sartorius AG VZO, Heidelbergcement, Infineon
Worst Performers: Zalando SE, MTU Aero, Bayer
Resistance levels: 16999 17003 (4H chart)
Support levels: 16345 16188 15915 (4H chart)
GBPJPY
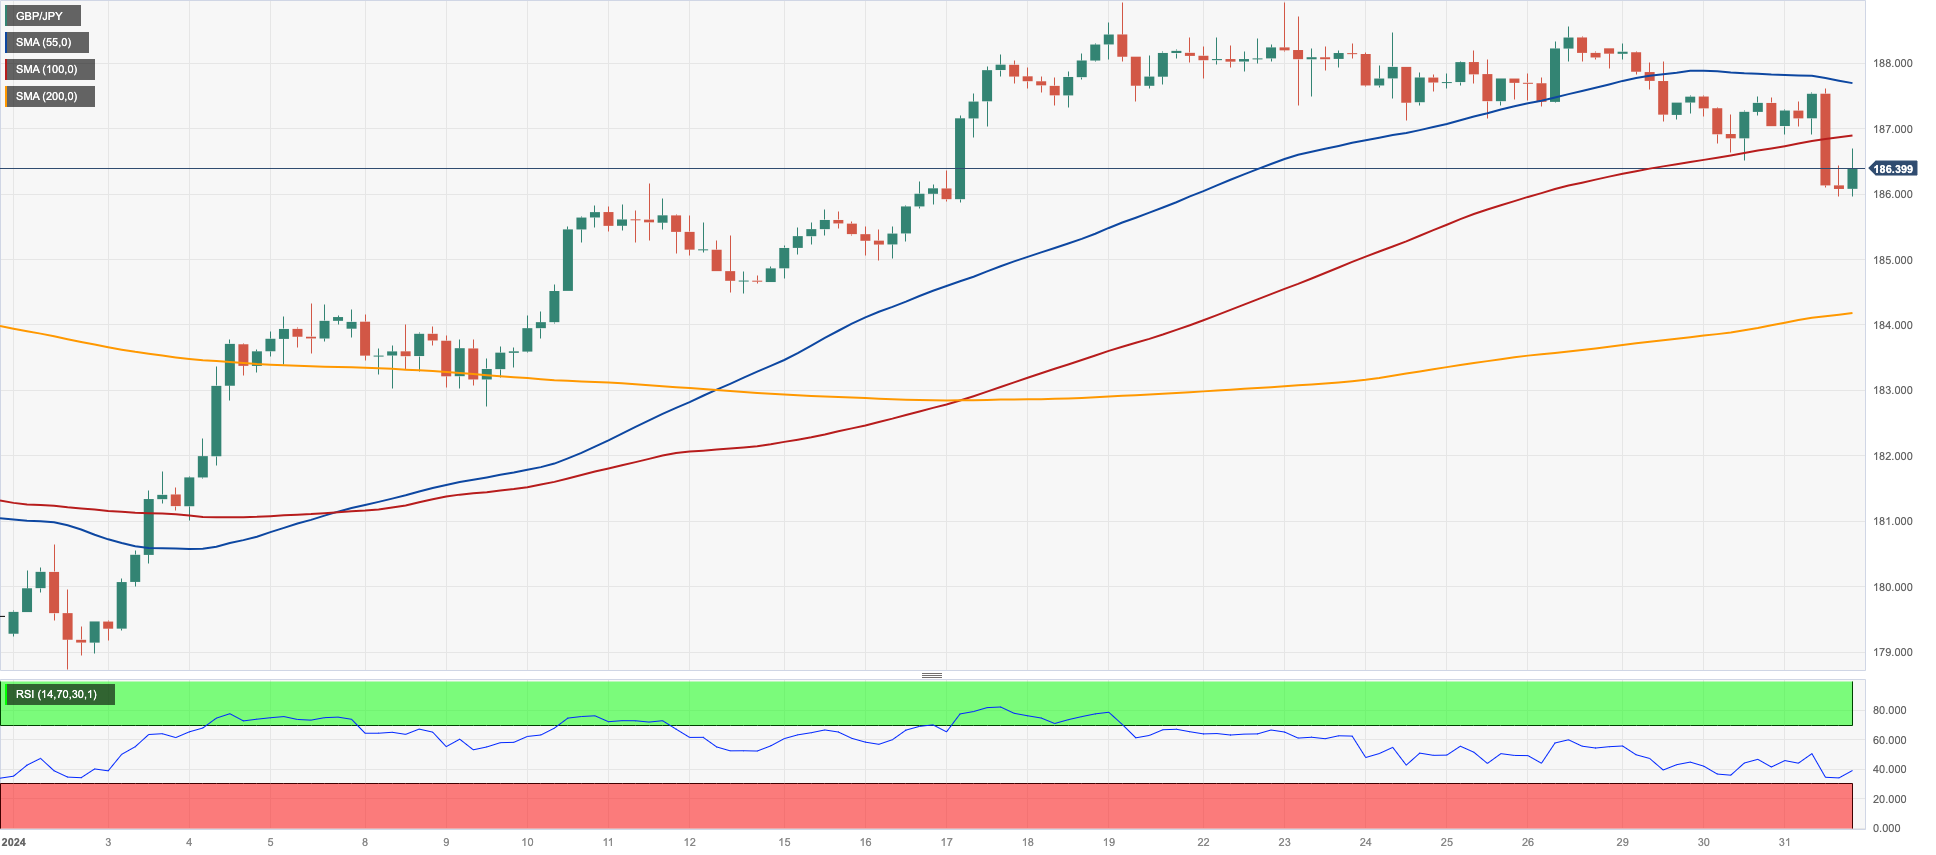
Extra gains in the Japanese yen coupled with increasing weakness in the Sterling motivated GBP/JPY to recede to new two-week lows in the boundaries of the 186.00 zone on Wednesday.
Indeed, the bearishness in the cross gathered extra pace in the wake of the FOMC event, where the Fed maintained its monetary status quo and Chief Powell reiterated that rates could likely be at their peak.
A gain over the 2024 high of 188.93 (January 19) might lead to a test of the round number of 190.00 before the August 2015 top of 195.28 (August 18). On the contrary, GBP/JPY is expected to find short-term support at the 55-day and 100-day SMAs of 184.82 and 183.91, respectively, before hitting the more important 200-day SMA of 181.37. A breakdown of the latter reveals the December 2023 low of 178.33 (December 14), which comes before the October 2023 low of 178.03 (October 3), and the July 2023 low of 176.30, all ahead of the May 2023 low of 167.84 (May 11). The daily RSI retreated to the 54 zone.
Resistance levels: 188.56 188.93 189.99 (4H chart)
Support levels: 185.96 184.97 184.47 (4H chart)
NASDAQ
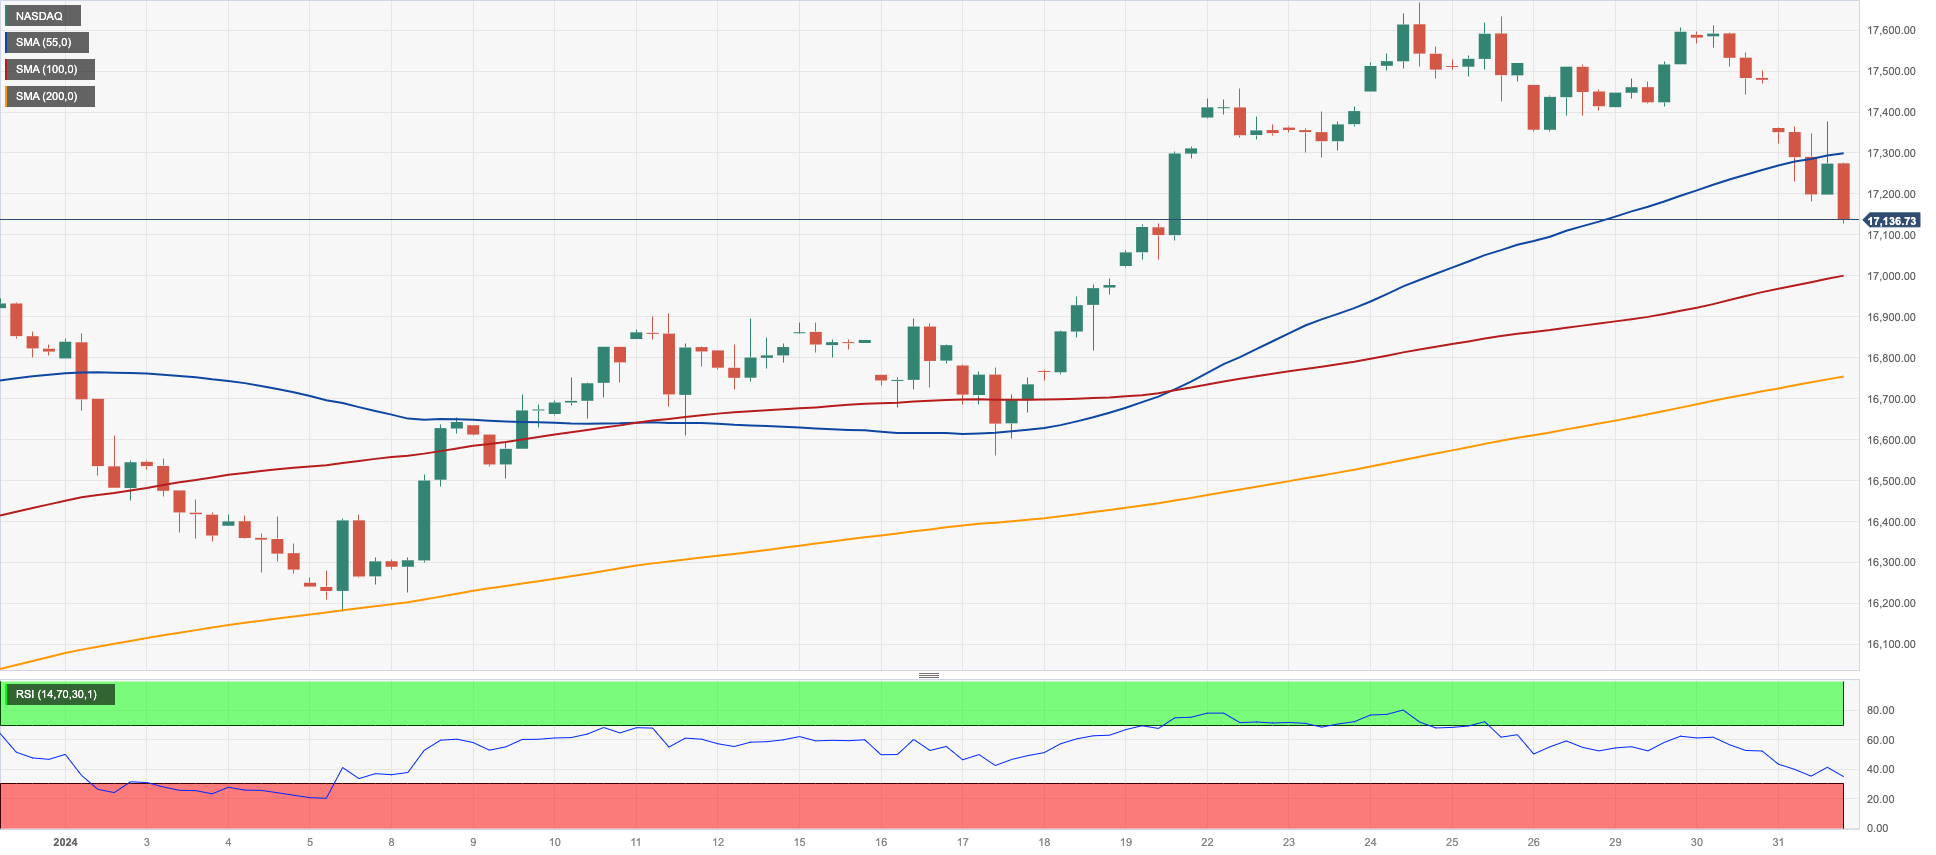
US tech stocks dropped markedly and approached the 17100 region when measured by the benchmark Nasdaq 100 on Wednesday.
The sharp correction in the index came in response to hawkish remarks from Chair Powell at his press conference after the Fed left its interest rates unchanged at 5.25%–5.50%, as broadly expected.
In fact, Powell hinted at the idea that a rate cut in March remained unlikely, as the Fed needs to be sustainably convinced of the downtrend in inflation towards the 2% goal.
The resumption of the buying pressure should motivate the Nasdaq to dispute its record high of 17665 (January 24). Bearish efforts should aim for the 2024 low of 16249 (January 5), which comes before the December 2023 low of 15695 (December 4) and the important 200-day SMA of 15162. A deeper drop from here may result in a regression to the October 2023 low of 14058 (October 26) and the April 2023 low of 12724 (April 25). Further south comes the March 2023 low of 11695 (March 13), before to the 2023 low of 10696 (January 3). The RSI plummeted to the 55 area.
Top Gainers: ADP, Qualcomm, PDD Holdings DRC
Top Losers: Alphabet A, Alphabet C, Lululemon Athletica
Resistance levels: 17665 (4H chart)
Support levels: 16561 16249 15695 (4H chart)
DOW JONES
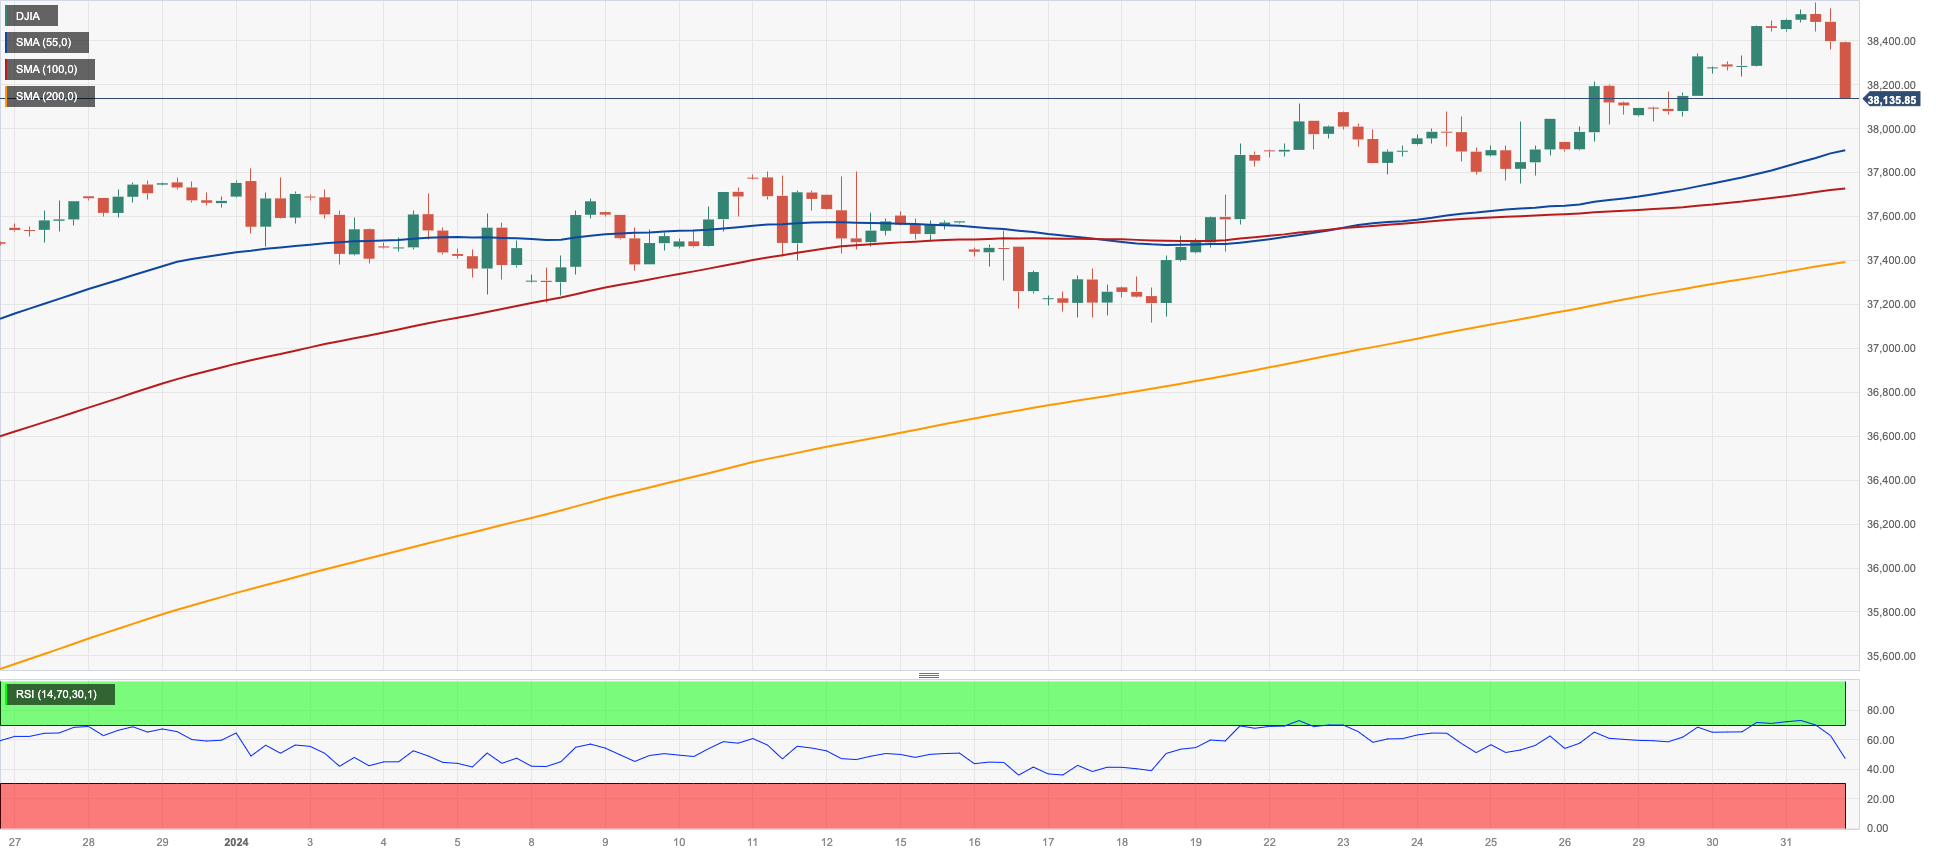
US equities gauged by the reference Dow Jones reversed four consecutive days of gains and ended Wednesday’s session around two-day lows near 38100.
In fact, the sour sentiment grew among market participants after the Federal Reserve said it needed to see a continuation of the positive data and further confidence that inflation remains on a sustainable path to the bank’s goal, at the time when Powell suggested that a rate cut in March would likely be off the table.
All in all, the Dow Jones retreated 0.82% to 38150, the S&P500 deflated 1.55% to 4848, and the tech-focused Nasdaq Composite dropped 2.23% to 15164.
Extra gains may bring the Dow Jones to its all-time high, 38588 (January 31). Alternatively, there is instant disagreement at the 2024 low of 37122 (January 18), which happens sooner than the weekly low of 37073 (December 20, 2023). The breakdown of the latter suggests a potential challenge for the intermediate 55- and 100-day SMAs around 36788 and 35417, respectively. The 200-day SMA is immediately lower at 34805, ahead of the weekly low of 33859 (November 7, 2023), the October 2023 low of 32327 (October 27), and the 2023 low of 31429 (March 15). The daily RSI retreated to the vicinity of 62.
Top Performers: Boeing, UnitedHealth, Intel
Worst Performers: Cisco, Microsoft, Nike
Resistance levels: 38588 (4H chart)
Support levels: 37122 37073 36021 (4H chart)
MACROECONOMIC EVENTS


