
- Contact Us:
-

-

-

-


Daily Market Updates
05 Feb 2024
EURUSD
EUR/USD ended its third consecutive week in negative territory after another stellar print from US Nonfarm Payrolls lent extra wings to the greenback and pushed the pair back below the 1.0800 region on Friday.
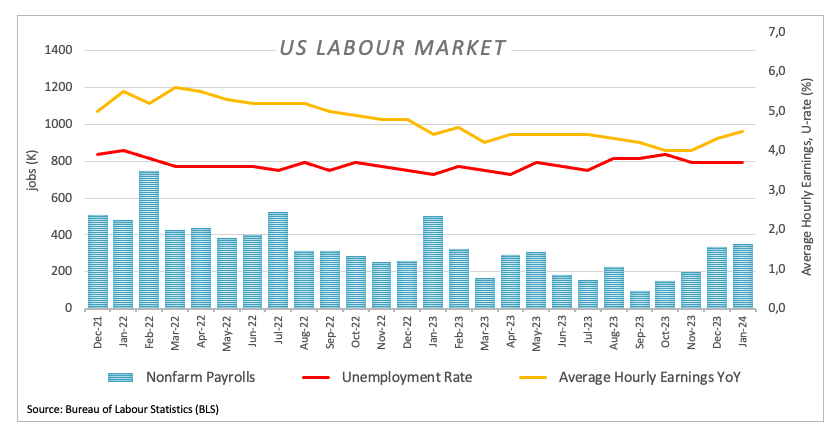
Indeed, the USD Index (DXY) briefly trespassed the key barrier at 104.00 the figure to print fresh yearly highs, boosted by a robust labour market report where the US economy added 353K jobs in January, the jobless rate held steady at 3.7%, and Average Hourly Earnings rose at an annualized 4.5%.
The timing of the release of the NFP was almost perfect, as it followed Chair Powell’s remarks at his press conference on the FOMC event on Wednesday, when he emphasized the data-dependent stance of the central bank and kind of ruled out an interest rate cut in March.
The probability of the above-mentioned scenario dropped to around 20%, while it climbed to nearly 60% at the May 1 event, always according to CME Group’s FedWatch Tool.
The greenback also derived extra strength from the marked bounce in US yields across different maturities, while German 10-year bund yields rose to the 2.25% zone after two daily drops in a row.
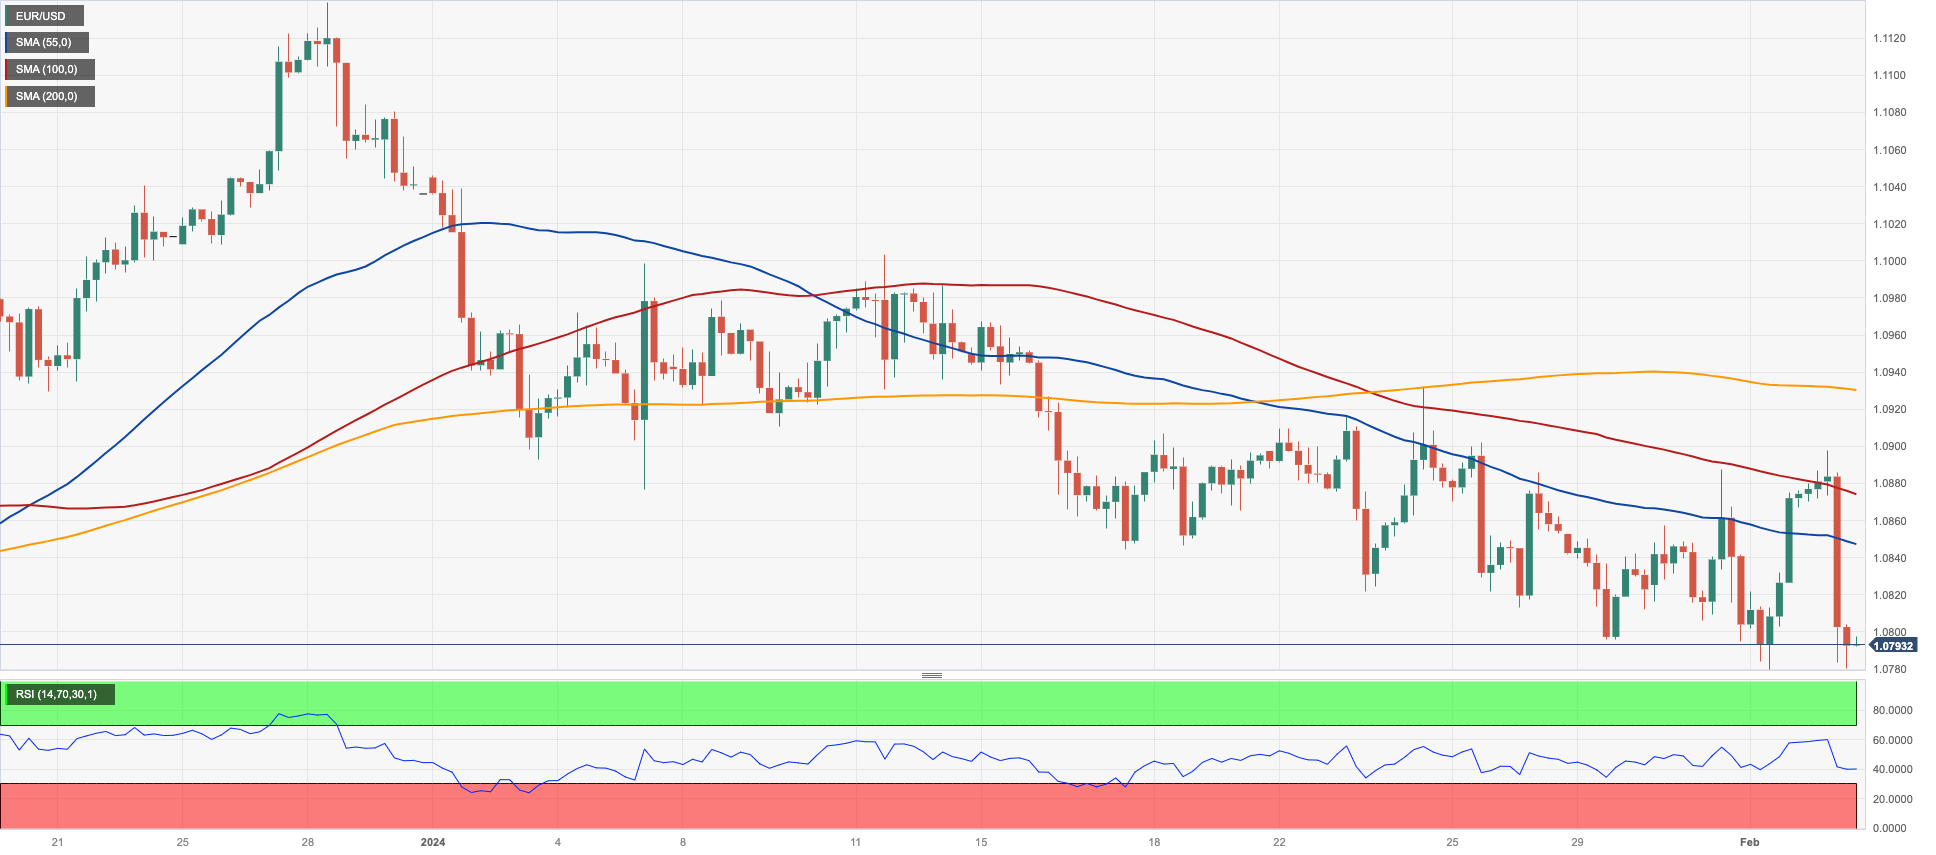
If sellers break below the 2024 low of 1.0779 (February 1), EUR/USD might assault the December 2023 low of 1.0723 (December 8). The loss of this region indicates a speedier decline to the weekly low of 1.0495 (October 13, 2023), ahead of the 2023 low of 1.0448 (October 3) and the round level of 1.0400. The other way around, there is temporary resistance at the 55-day SMA at 1.0912 prior to the weekly high of 1.0932 (January 24), and another weekly top of 1.0998 (January 5, 11), all before the December 2023 peak of 1.1139 (December 27). This level is further bolstered by the 200-week SMA of 1.1149 and comes before the 2023 high of 1.1275 (July 18). The daily RSI deflated to the 39 zone.
Resistance levels: 1.0897 1.0932 1.0998 (4H chart)
Support levels: 1.0779 1.0723 1.0656 (4H chart)
USDJPY
USD/JPY set aside two daily declines in a row and advanced north of the 148.00 barrier at the end of the week, clinching at the same time new multi-day highs.
In fact, the pair’s upside gathered extra steam on the back of the intense bounce in the greenback along with US yields across the curve, all after US Nonfarm Payrolls came in well above expectations in January, creating 353K jobs.
In the Japanese debt market, JGB 10-year yields added to Thursday’s retracement and dropped to multi-session lows around 0.65%.
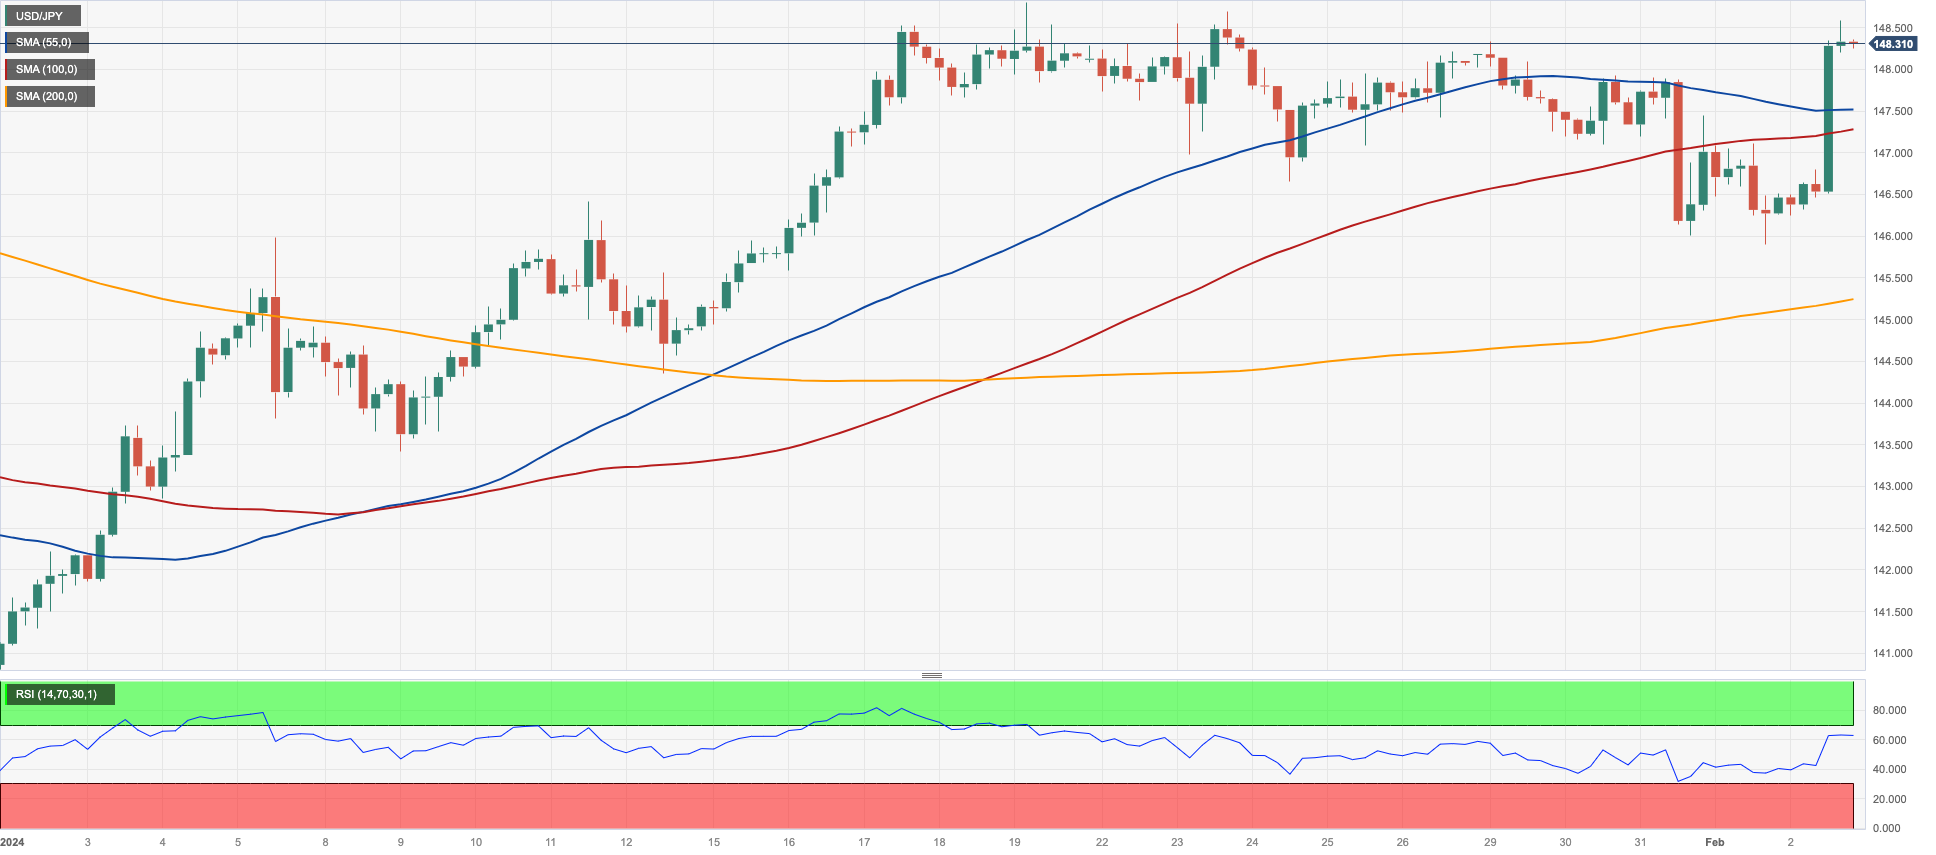
If the recovery gathers further traction, USD/JPY could revisit the 2024 high of 148.80 (January 18), followed by the main hurdle of 150.00 and the 2023 top of 151.90 (November 13). Further up, the 2022 peak of 151.94 (October 21) precedes the round number of 152.00. In the opposite direction, immediate contention aligns at so-far February low of 145.89 (February 1) just ahead of the provisional 55-day SMA at 145.78. Down from here emerges the critical 200-day SMA of 144.60 ahead of the December 2023 low of 140.24 (December 28), and the round number of 140.00, all preceding the July low of 137.23 (July 14). The day-to-day RSI leapt past 60.
Resistance levels: 148.58 148.80 149.67 (4H chart)
Support levels: 145.89 145.17 144.34 (4H chart)
GBPUSD
In line with the rest of the risk-associated universe, GBP/USD retreated markedly and approached the key 1.2600 neighbourhood on Friday, or two-week lows.
In fact, the British pound succumbed to the firm tone in the greenback, which was particularly exacerbated after the auspicious release of the US labour market report, where US Nonfarm Payrolls crushed estimates in January (+353K jobs).
In the meantime, investors continued to digest Thursday’s dovish hold by the BoE after the central bank maintained the policy rate at 5.25% while setting the stage for more accommodative policy measures in the future.
The strong pullback in Cable also came in tandem with a decent rebound in UK 10-year gilts past the 3.90% level.
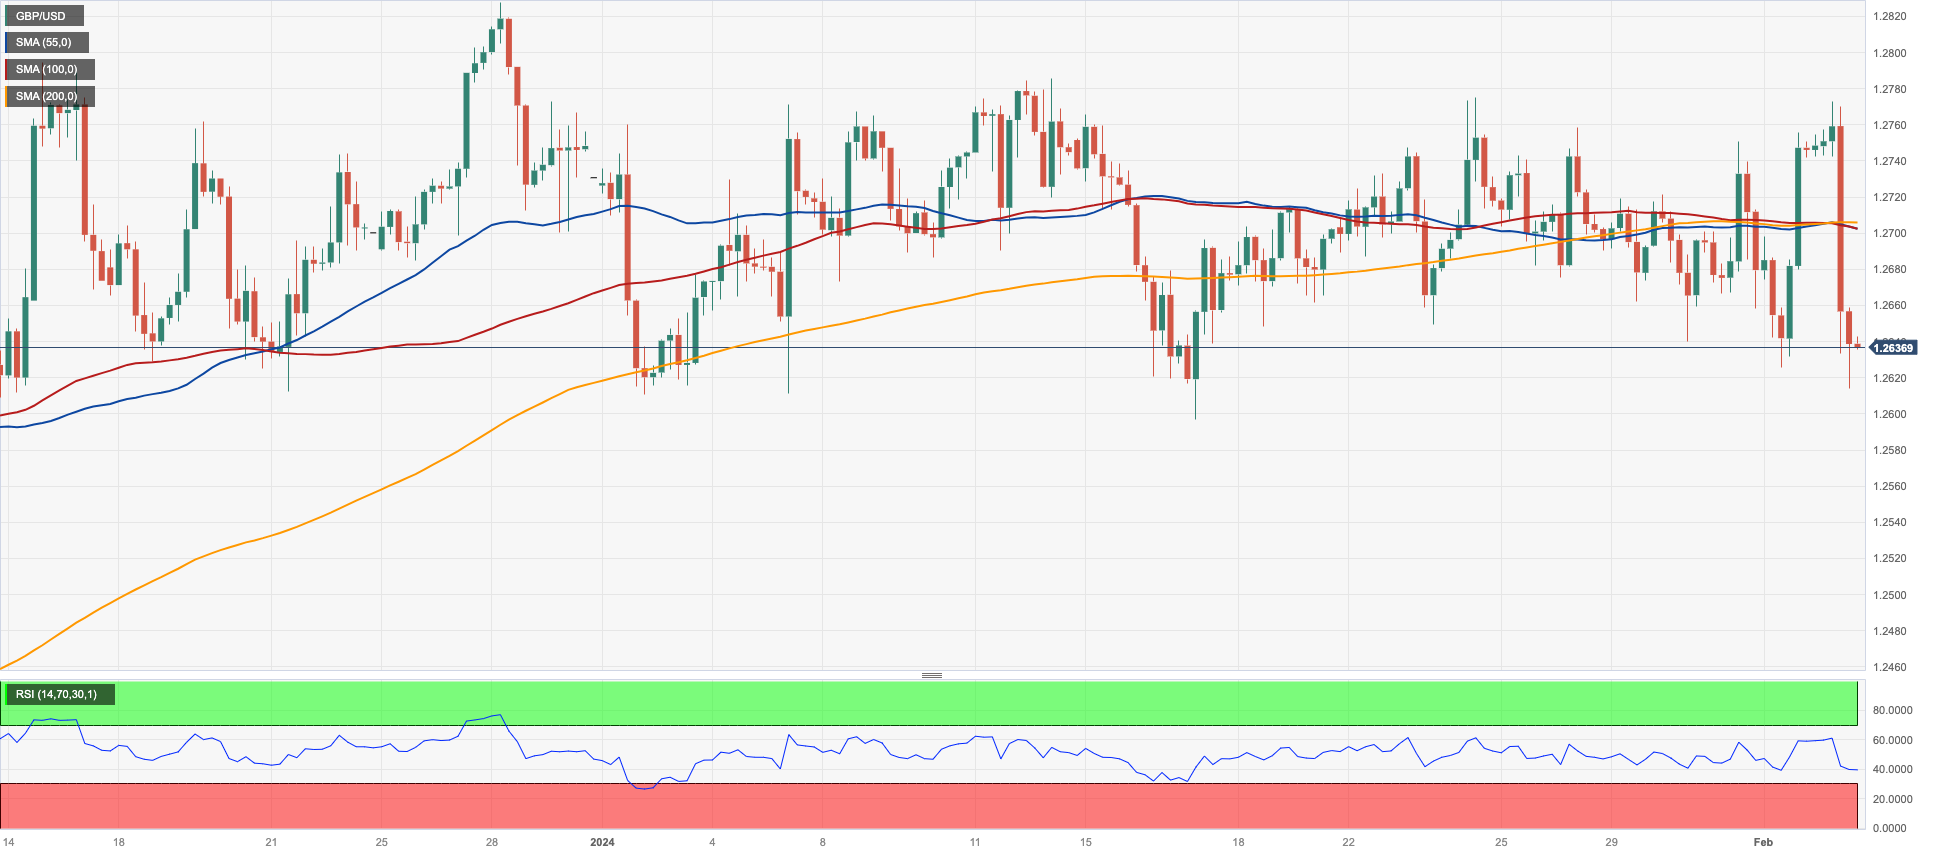
The breakout of the 2024 high at 1.2785 (January 12) might pave the way for a rally to the December top of 1.2827 (December 28), followed by the weekly peak of 1.2995 (July 27, 2023), which is just shy of the important 1.3000 barrier. On the downside, GBP/USD faces its first challenge at the so-far 2024 low of 1.2596 (January 17), before the important 200-day SMA at 1.2560 and the December 2023 bottom of 1.2500 (December 13). Extra weakness may lead spot to seek the weekly low of 1.2187 (November 10, 2023), before hitting the October 2023 low of 1.2037 (October 3), the crucial 1.2000 level, and the 2023 bottom of 1.1802 (November 10, 2023). The daily RSI fell to below 45.
Resistance levels: 1.2772 1.2784 1.2827 (4H chart)
Support levels: 1.2613 1.2596 1.2500 (4H chart)
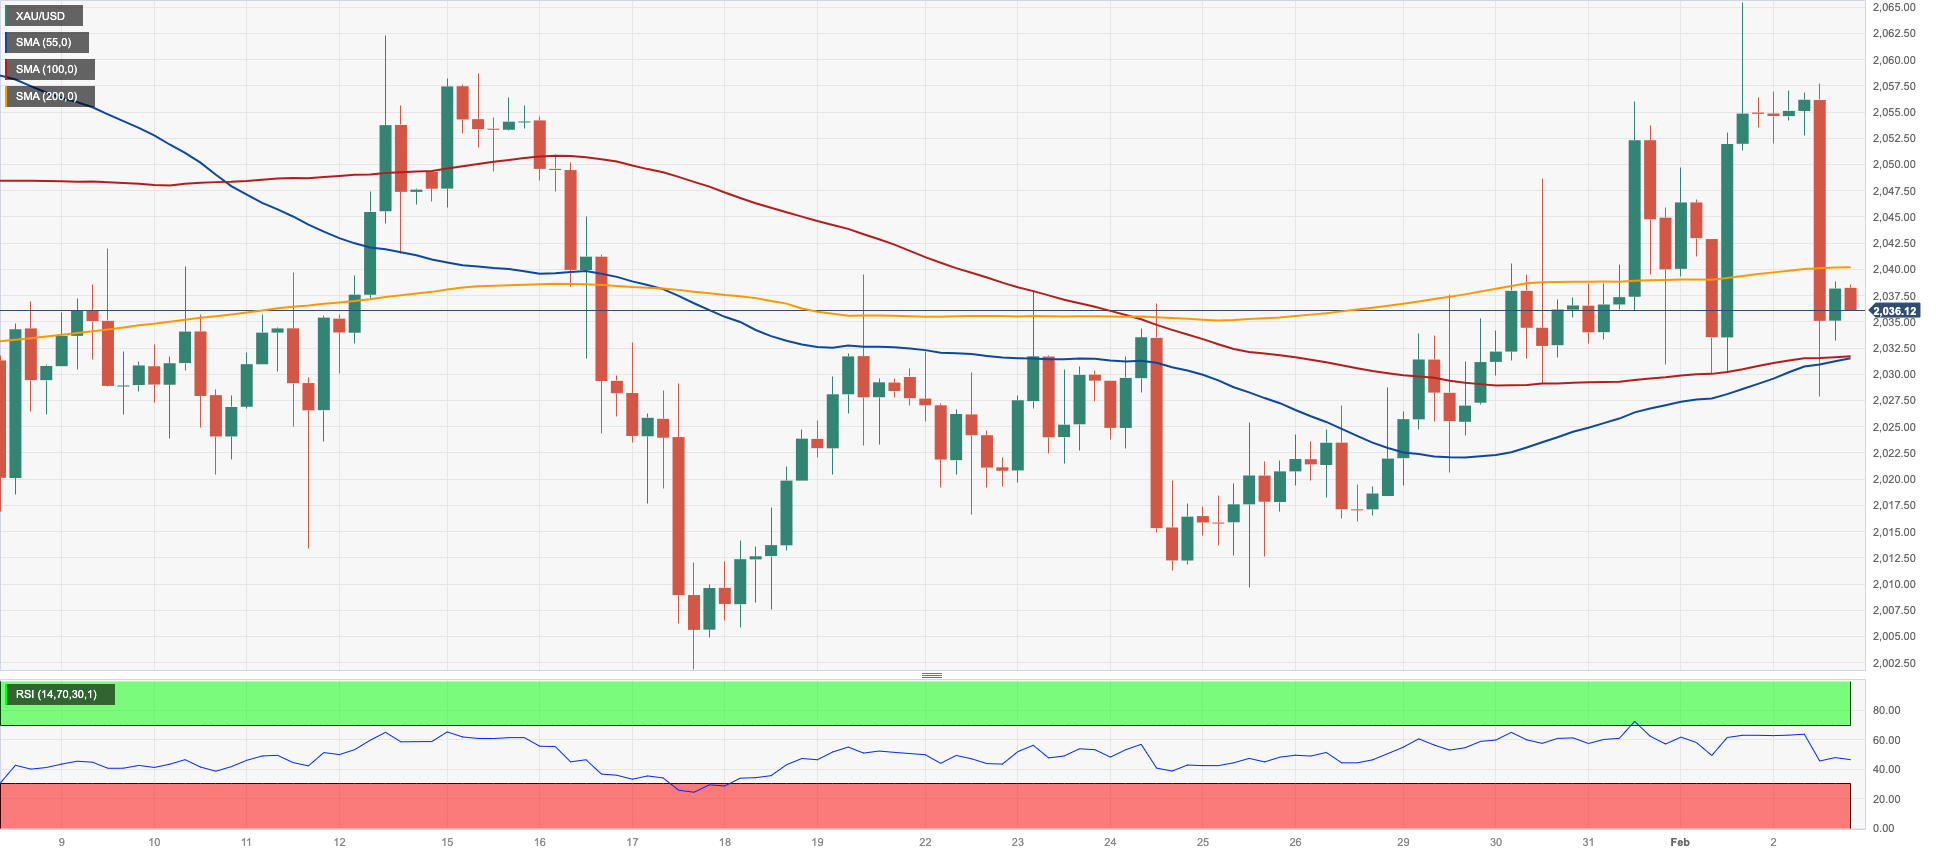
GOLD
Gold prices ended the week with marked losses on the back of the strong resurgence of buying pressure in the greenback, which was magnified after strong prints from the US NFP for the month of January (+353K jobs).
Also weighing on the precious metal came the equally sharp bounce in US yields across various timeframes, all against the backdrop of increasing speculation of an interest rate cut by the Federal Reserve in May (or even June) from March.
Extra gains may lead Gold to revisit the weekly high of $2088 (December 28), which comes before the all-time top of $2150 (December 4, 2023). In the other direction, a drop below the 2024 low of $2001 (January 17) might reintroduce a move to the December 2023 low of $1973, which is supported by the vicinity of the 200-day SMA at $1965 and the November 2023 low of $1931. In the event of more losses, the metal may retest the October 2023 bottom of $1810, then the 2023 low of $1804, and maybe the $1800 contention zone.
Resistance levels: $2065 $2078 $2088 (4H chart)
Support levels: $2030 $2009 $2001 (4H chart)
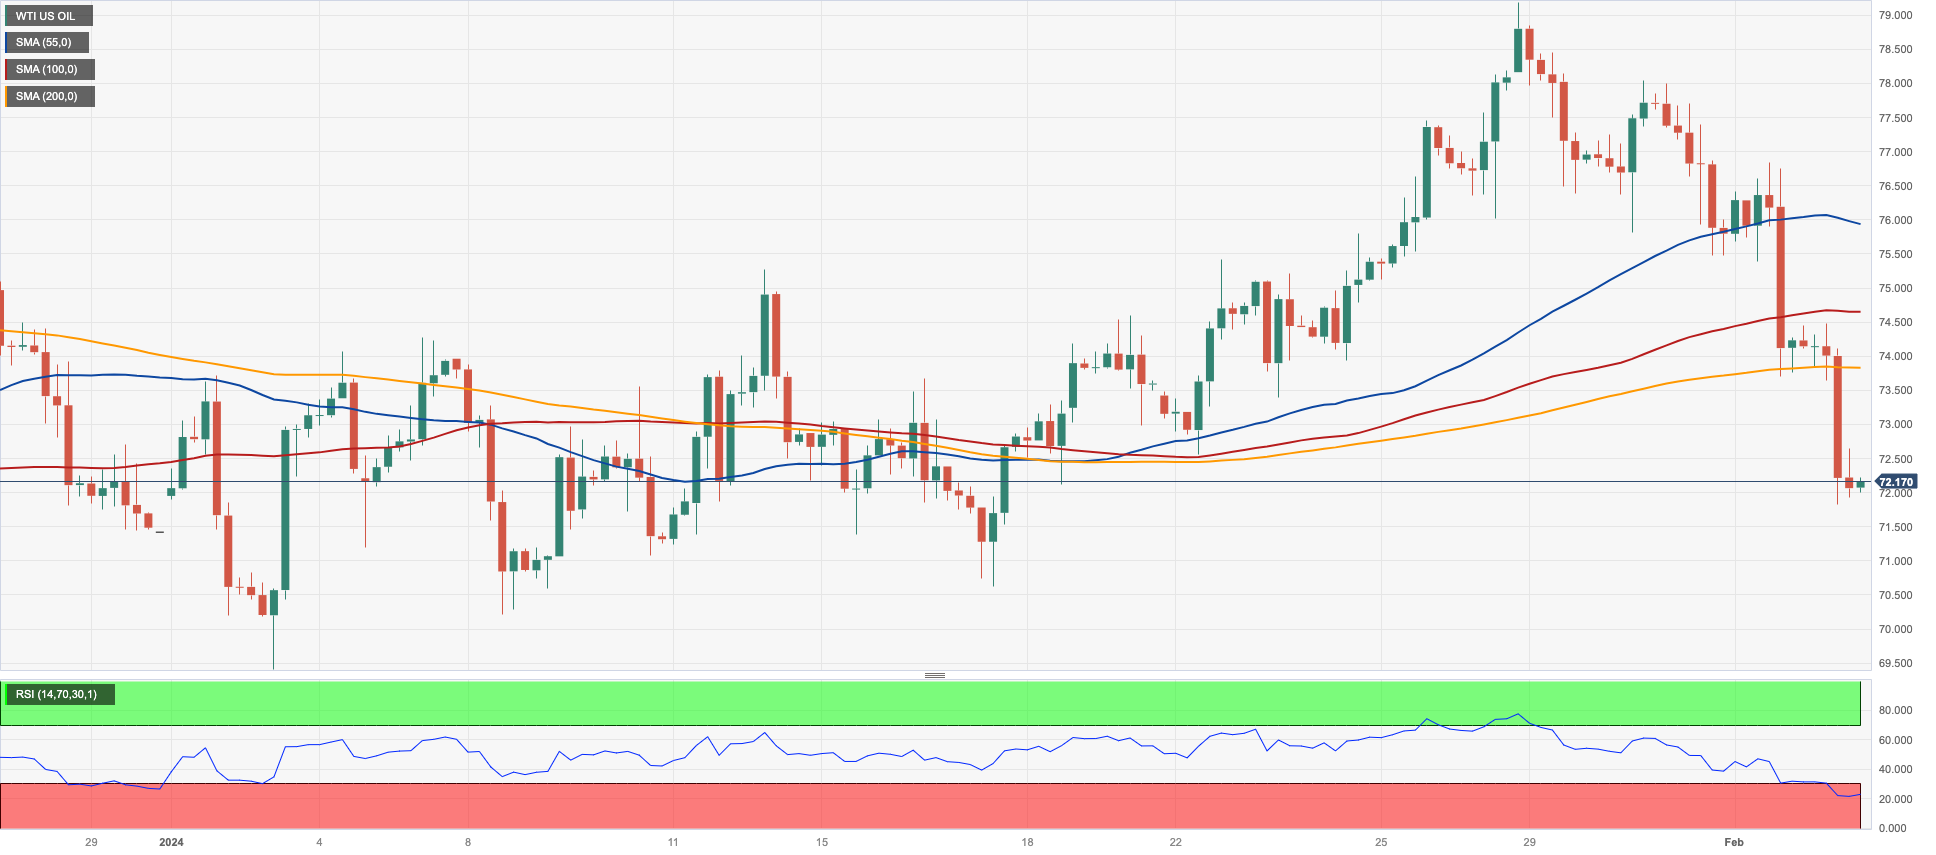
CRUDE WTI
Prices of the American benchmark for sweet light crude oil retreated for the third consecutive session, briefly piercing the $72.00 mark per barrel on Friday, an area also coincident with the key 200-week SMA.
The weekly decline in crude oil prices picked up extra pace after another solid job creation in the US economy, this time during January, according to the latest nonfarm Payrolls figures, which dented expectations of interest rate cuts in the near term.
In addition, the strong upside bias in the greenback also kept USD-denominated assets depressed, while persistent uncertainty surrounding the economic recovery in China also contributed to the sour sentiment among traders at the end of the week.
In the calendar, driller Baker Hughes said the total number of US active oil rigs remained unchanged at 499 in the week to February 2.
There is initial contention at the so-far February low of $71.82 (February 2) ahead of the key $70.00 mark and the 2024 low of $69.31 (January 3). The loss of the latter could expose the December 2023 low of $67.74 (December 13), prior to the June 2023 bottom of $66.85 (June 12). On the contrary, the next upward objective for WTI is the 2024 high of $79.25 (January 29), which is immediately followed by the important $80.00 barrier and comes ahead of the November 2023 top of $80.15 (November 3). Extra upside from here may take the market back to its weekly peak of $89.83 (October 18, 2023), followed by the 2023 high of $94.99 (September 28, 2023) and the August 2022 top of $97.65 (August 30), all before reaching the critical $100.00 threshold.
Resistance levels: $79.25 $79.56 $83.56 (4H chart)
Support levels: $71.82 $70.59 $69.25 (4H chart)
GER40
Germany’s reference index DAX40 managed to leave behind part of the weekly pessimism and rose to an all-time high just above the 17000 milestone at the end of the week.
The decent advance in the DAX40 was accompanied by auspicious corporate earnings reports, while stronger-than-expected job creation in the US economy also contributed to the broad-based constructive sentiment among market participants.
In the fixed-income universe, German 10-year bund yields set aside part of the recent decline and rose to 2.25% on Friday.
Further gains in the DAX40 target the all-time peak of 17004 (February 2). Having said that, there is immediate contention at the February low of 16821 (February 1) seconded by the transitory 55-day SMA at 16541 and the 2024 low of 16345 (January 17). Once the index clears the latter, a potential visit to the 200-day SMA of 15950 could emerge on the horizon before the weekly low of 15915 (November 28). The October 2023 low of 14630 (October 23) comes next, before the March 2023 low of 14458 (March 20). The daily RSI rose past the 60 yardstick.
Best Performers: Dr Ing hc Porsche Prf, Deutsche Bank AG, Mercedes Benz Group
Worst Performers: Siemens Healthineers, E.ON SE, Sartorius AG VZO
Resistance levels: 17004 (4H chart)
Support levels: 16345 16284 15915 (4H chart)

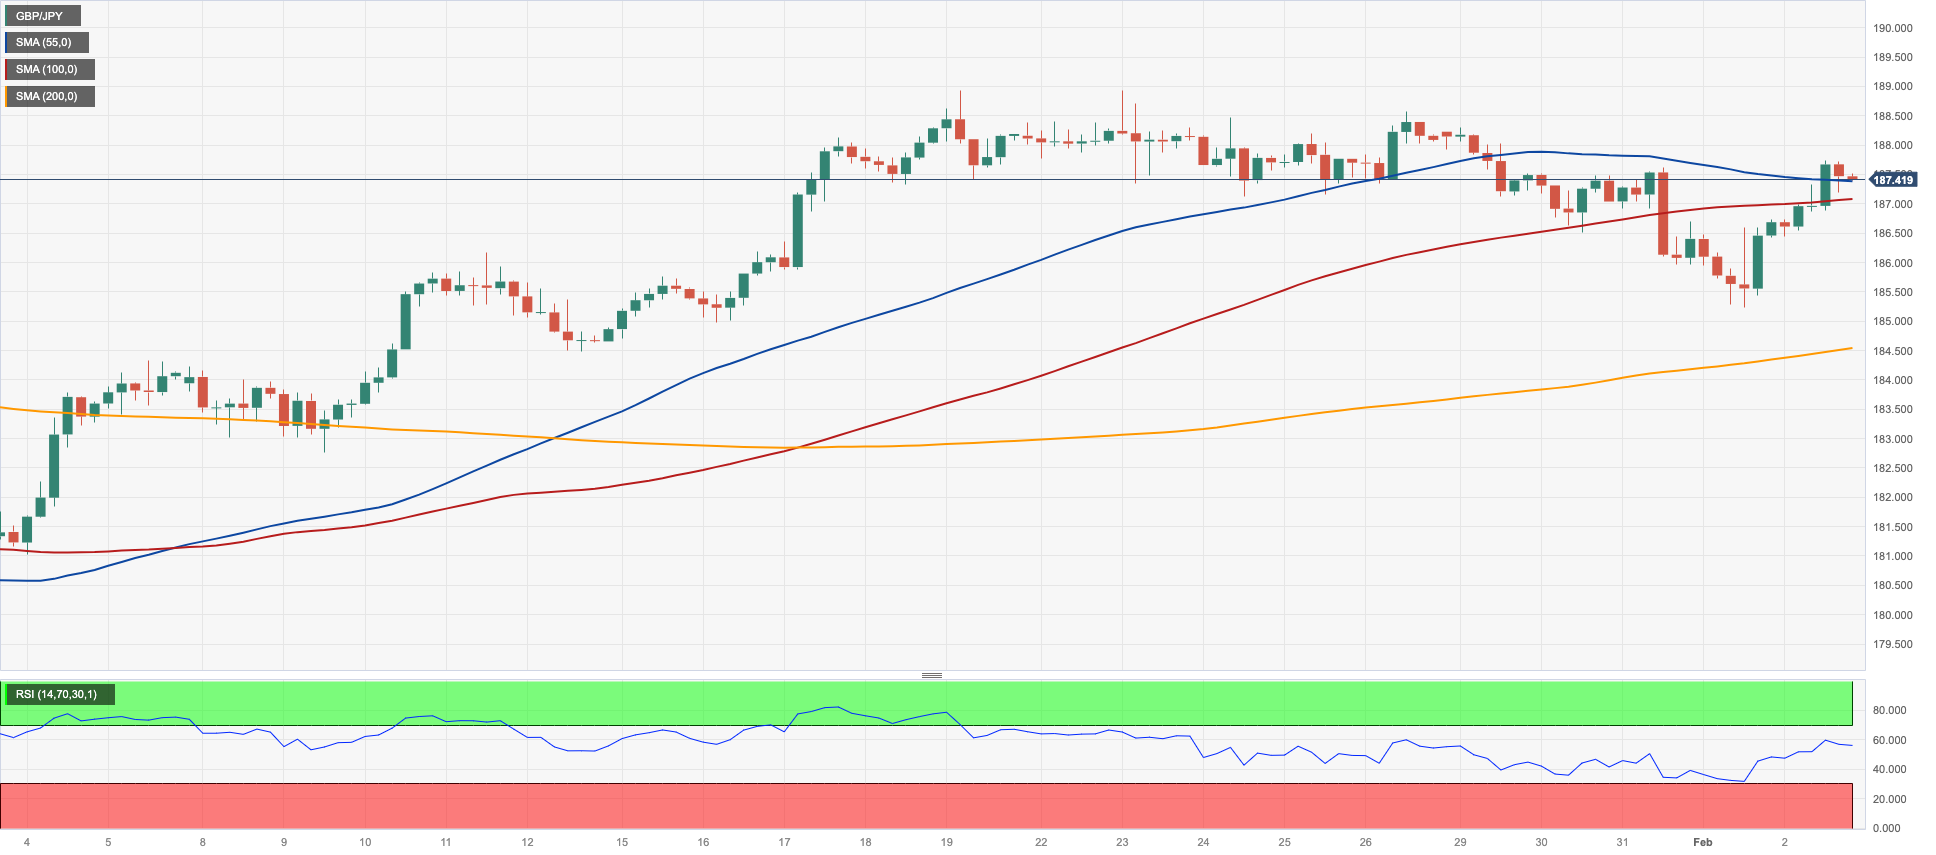
GBPJPY
The strong selling pressure around the Japanese yen favoured Friday’s decent bounce in GBP/JPY to the 187.70/75 band, adding to Thursday’s rebound from weekly lows near 185.20.
The cross, therefore, resumed its upward bias, although it could not help ending its second straight week in the negative territory.
Further weakness in GBP/JPY must now clear the February low of 185.22 (February 1) to allow for a move to short-term support at the 55-day and 100-day SMAs of 184.78 and 183.97, respectively. If the cross clears this level, it may then dispute the more significant 200-day SMA at 181.57, ahead of the December 2023 bottom of 178.33 (December 14) and the October 2023 low of 178.03 (October 3). South of here is the July 2023 low of 176.30, which precedes the May 2023 low of 167.84 (May 11). By contrast, a climb over the 2024 high of 188.93 (January 19) might lead to a test of the round number of 190.00 before the August 2015 top of 195.28 (August 18)
Resistance levels: 187.73 188.56 188.93 (4H chart)
Support levels: 185.22 184.21 181.47 (4H chart)
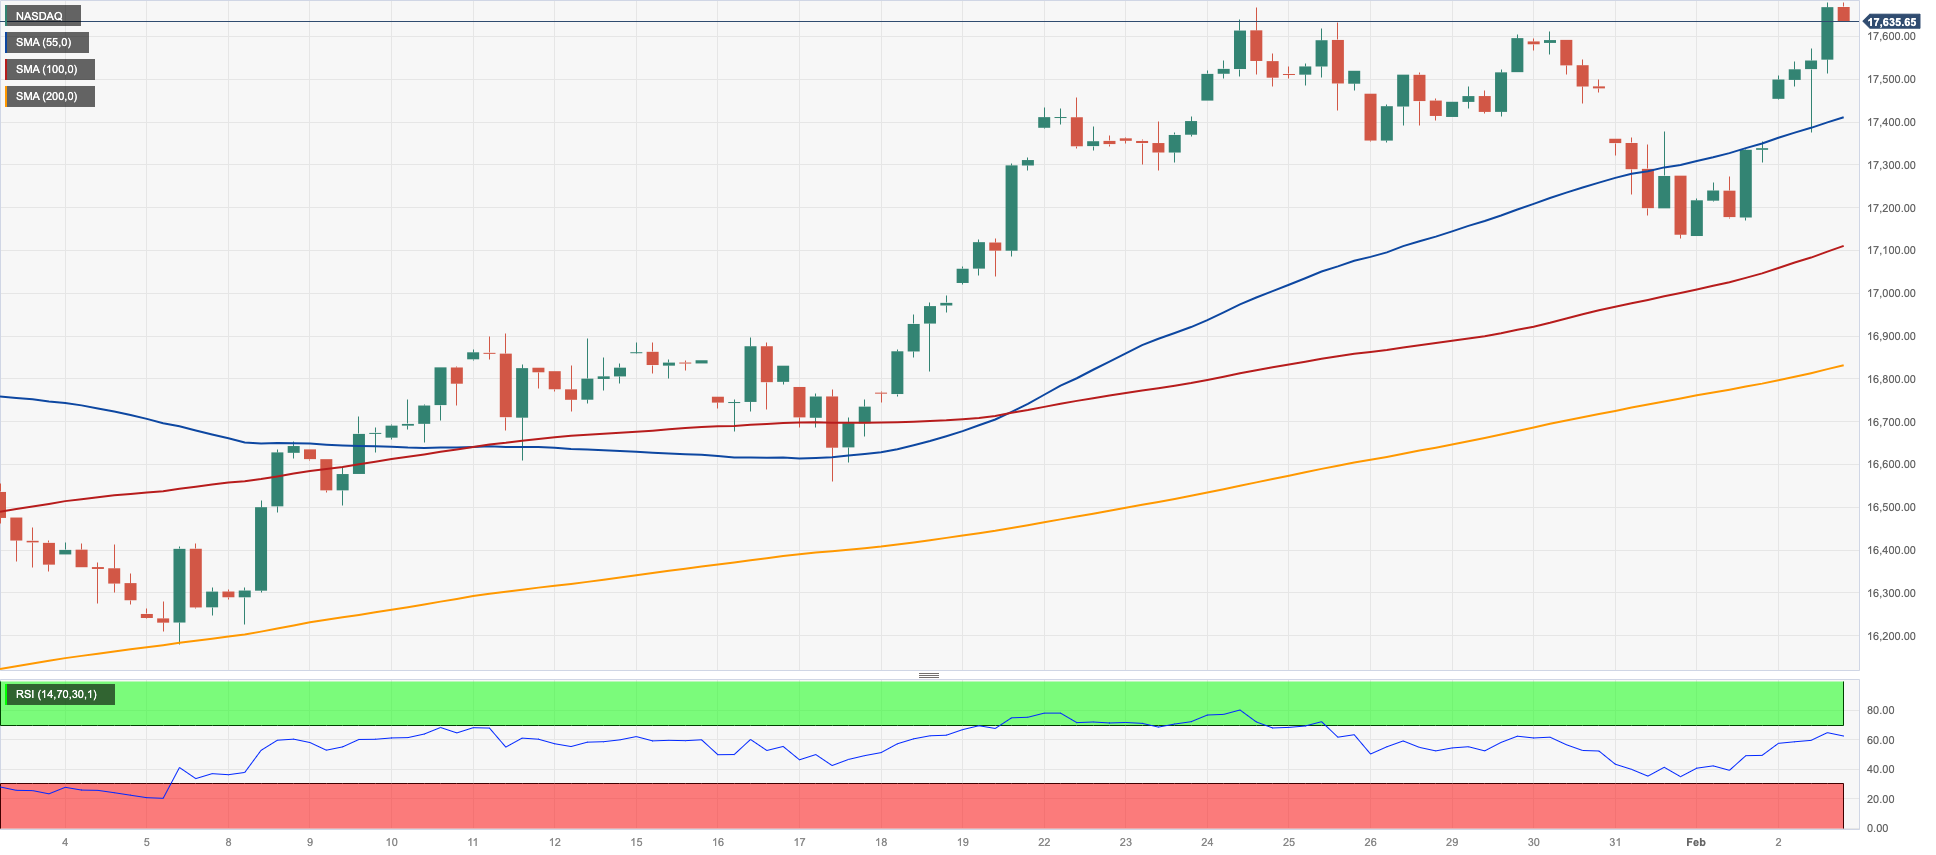
NASDAQ
In line with the generalized upbeat sentiment in the US markets, the tech benchmark Nasdaq 100 advanced to a new record high near the 17700 region at the end of the week.
In fact, the index added to Thursday’s gains after earnings reports from giants Meta and Amazon came in above expectations, while the strong job creation during January also bolstered the solid health of the domestic economy.
Further gains should motivate the Nasdaq 100 to challenge its record high of 17682 (February 2). Bearish efforts, on the flip side, should target the weekly low of 17128 (January 31) prior to the interim 55-day SMA at 16576 and the 2024 low of 16249 (January 5). If the index clears this region, it could then confront the December 2023 low of 15695 (December 4) and the crucial 200-day SMA of 15226. A deeper decline from here may result in a regression to the October 2023 bottom of 14058 (October 26) and the April 2023 low of 12724 (April 25) ahead of the March 2023 low of 11695 (March 13) and the 2023 low of 10696 (January 3). The everyday RSI flirted with the 66 level.
Top Gainers: Meta Platforms, Amazon.com, MongoDB
Top Losers: Charter Communications, Atlassian Corp Plc, Comcast
Resistance levels: 17682 (4H chart)
Support levels: 17128 16561 16249 (4H chart)
DOW JONES
US equities gauged by the Dow Jones clinched a new record high near the 38800 zone at the end of the week.
The firmer-than-expected January Nonfarm Payrolls (+353K jobs) further reinforced the perception of a “soft landing”, reinvigorated the resilience of the US economy, and boosted investors’ optimism, all despite an interest rate cut by the Fed that might come later than initially anticipated.
Furthermore, robust earnings reports from megacaps Meta and Amazon added to the generalized upbeat mood and encouraged the S&P500 to reach an all-time peak around 4975.
At the end of the week, the Dow Jones rose 0.35% to 38654, the S&P500 gained 1.07% to 4958, and the tech-focused Nasdaq Composite advanced 1.74% to 15628.
Next on the upside for the Dow Jones comes the all-time top of 38783 (February 2). Alternatively, there is instant contention at the 2024 low of 37122 (January 18), which occurs before the weekly low of 37073 (December 20, 2023). The fall of the latter indicates a potential challenge to the intermediate 55- and 100-day SMAs around 36944 and 35497, respectively. The 200-day SMA is immediately lower at 34851 and comes ahead of the weekly low of 33859 (November 7, 2023), the October 2023 low of 32327 (October 27), and the 2023 low of 31429 (March 15). The daily RSI rose to the boundaries of the 70 threshold.
Top Performers: Chevron, Caterpillar, Microsoft
Worst Performers: Walgreen Boots, Intel, J&J
Resistance levels: 38783 (4H chart)
Support levels: 38106 37122 36021 (4H chart)
MACROECONOMIC EVENTS
All Information & Updates provided by:

All information relating to the financial markets available on this page has been prepared and issued by FXStreet (Forexstreet SL, Spain, Reg: B62498233) on the basis of publicly available information and all information believed to be reliable and does not conflict with Kuwaiti local laws, and all necessary care has been taken to before the company to ensure that the facts mentioned are correct from the source.
NCM Investment nor any of its directors or employees shall in any way be held responsible for the contents of this news, and the information contained on this page is intended only to provide clients with publicly available information and should not be construed as investment advice, report or analysis and/or constitute an offer or invitation to buy or sell financial instruments of any kind.
RISK WARNING: Forex and CFDs are highly risky leveraged products, as losses can exceed deposits. Please ensure you understand all the risks and take independent advice if necessary. NCM will segregate the clients based on the criteria of the regulator and its bylaws. NCM does not provide any advisory service; the material published does not constitute advice or a recommendation for a transaction in any financial instrument. NCM accepts no responsibility for any use of the content presented and any consequences of that use. Anyone acting on the information provided does so at their own risk.