
- Contact Us:
-

-

-

-


Daily Market Updates
06 Feb 2024
EURUSD
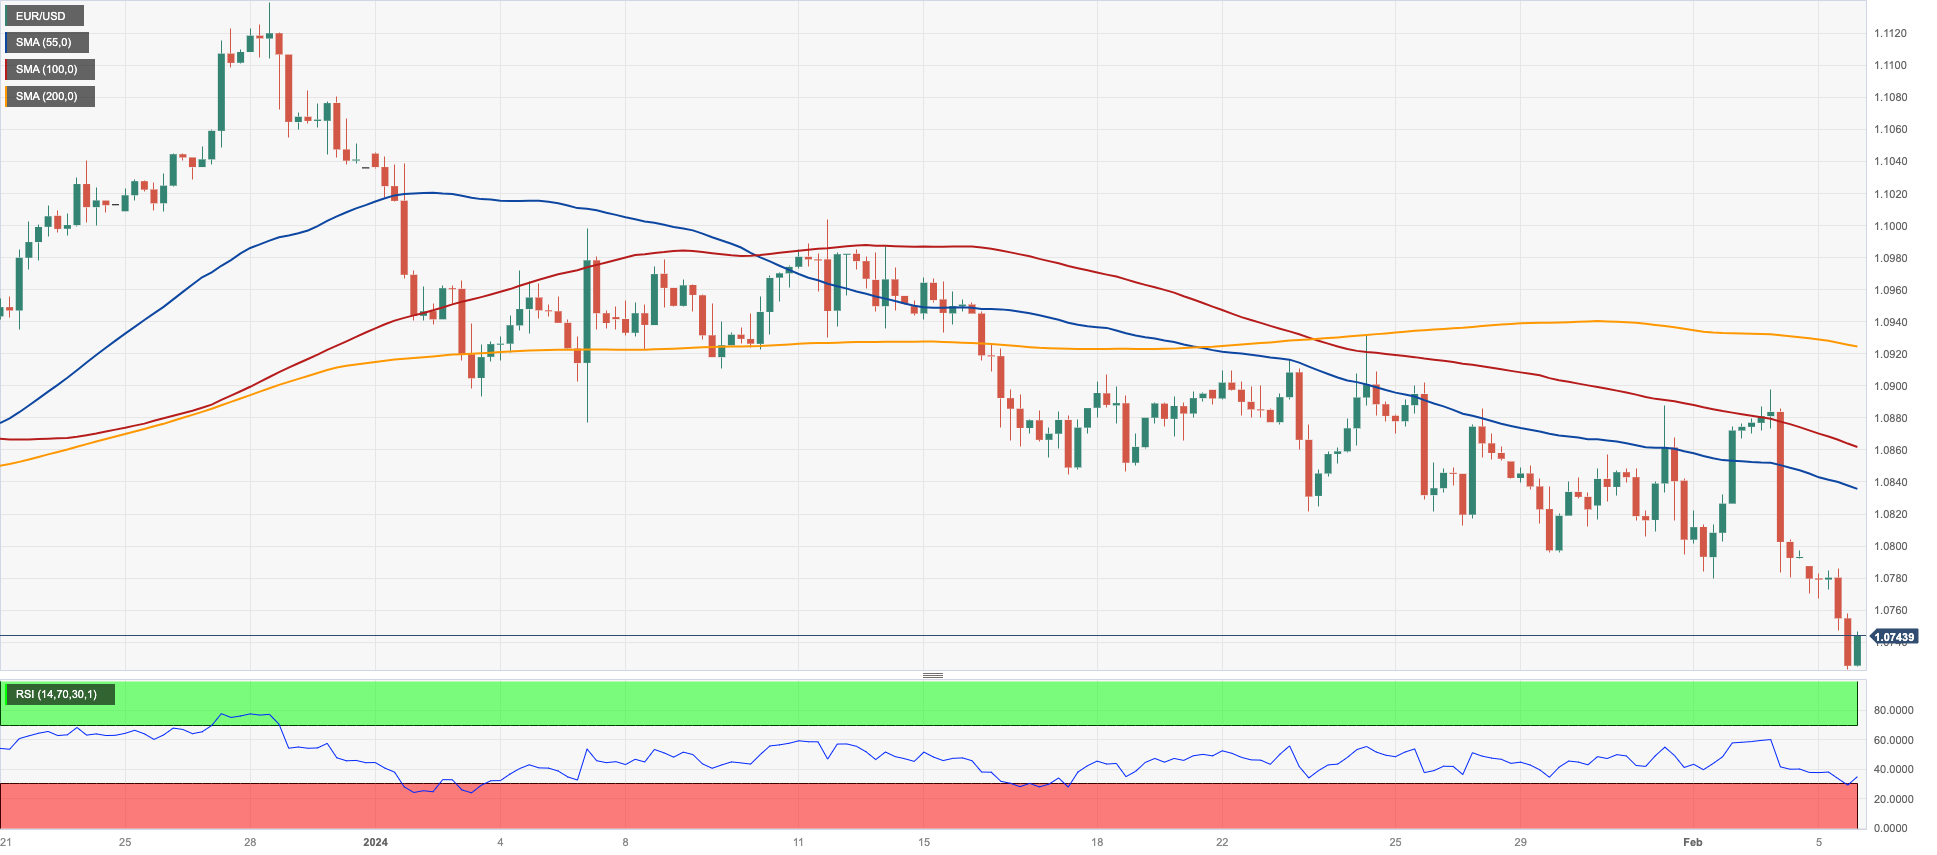
There was no respite for the downward bias in EUR/USD at the beginning of the week, as the pair retreated to the vicinity of 1.0720, where the December lows also sit.
Once again, dynamics around the Dollar weighed on the pair and the whole of the risk complex, all after market participants continued to assess Friday’s Nonfarm Payrolls, while the hawkish tilt at Powell’s interview on CBS published over the weekend also sponsored the marked decline in the pair.
In fact, Powell showed a prudent approach to the timing of an interest rate reduction at a time when he stressed that further confidence is needed before cutting rates. His views contributed to pushing further back bets for a rate cut, which now sees May or even June as more suitable candidates.
Away from the euro-dollar orbit, unconvincing prints from the Chinese services sector gauged by Caixin and released during early trade also did nothing to curb the increasing sour mood building around the pair and the broader risk complex at the beginning of a new trading week.
Back to the euro docket, Germany's trade surplus widened to €22.2B in December, and the final Services PMI ticked marginally higher to 47.7 vs. the preliminary print of 47.6. In the broader Euroland, the final Services PMI matched the advanced prints at 48.4. Finally, the Investor Confidence tracked by the Sentix index improved to -12.9 in February.
Across the ocean, the ISM Services PMI surprised to the upside at 53.4 in January.
If sellers breach below the 2024 low of 1.0723 (February 5), EUR/USD might experience a faster slide to the weekly low of 1.0495 (October 13, 2023), ahead of the 2023 low of 1.0448 (October 3) and the round level of 1.0400. The other way around, there is initial resistance at the key 200-day SMA at 1.0836 ahead of the interim 55-day SMA at 1.0908 and the weekly high of 1.0932 (January 24). Further north comes another weekly top of 1.0998 (January 5, 11), all before the December 2023 peak of 1.1139 (December 27). This level is additionally supported by the 200-week SMA of 1.1148 and comes before the 2023 high of 1.1275 (July 18). The daily RSI deflated to 34.
Resistance levels: 1.0897 1.0924 1.0998 (4H chart)
Support levels: 1.0723 1.0656 1.0516 (4H chart)
USDJPY
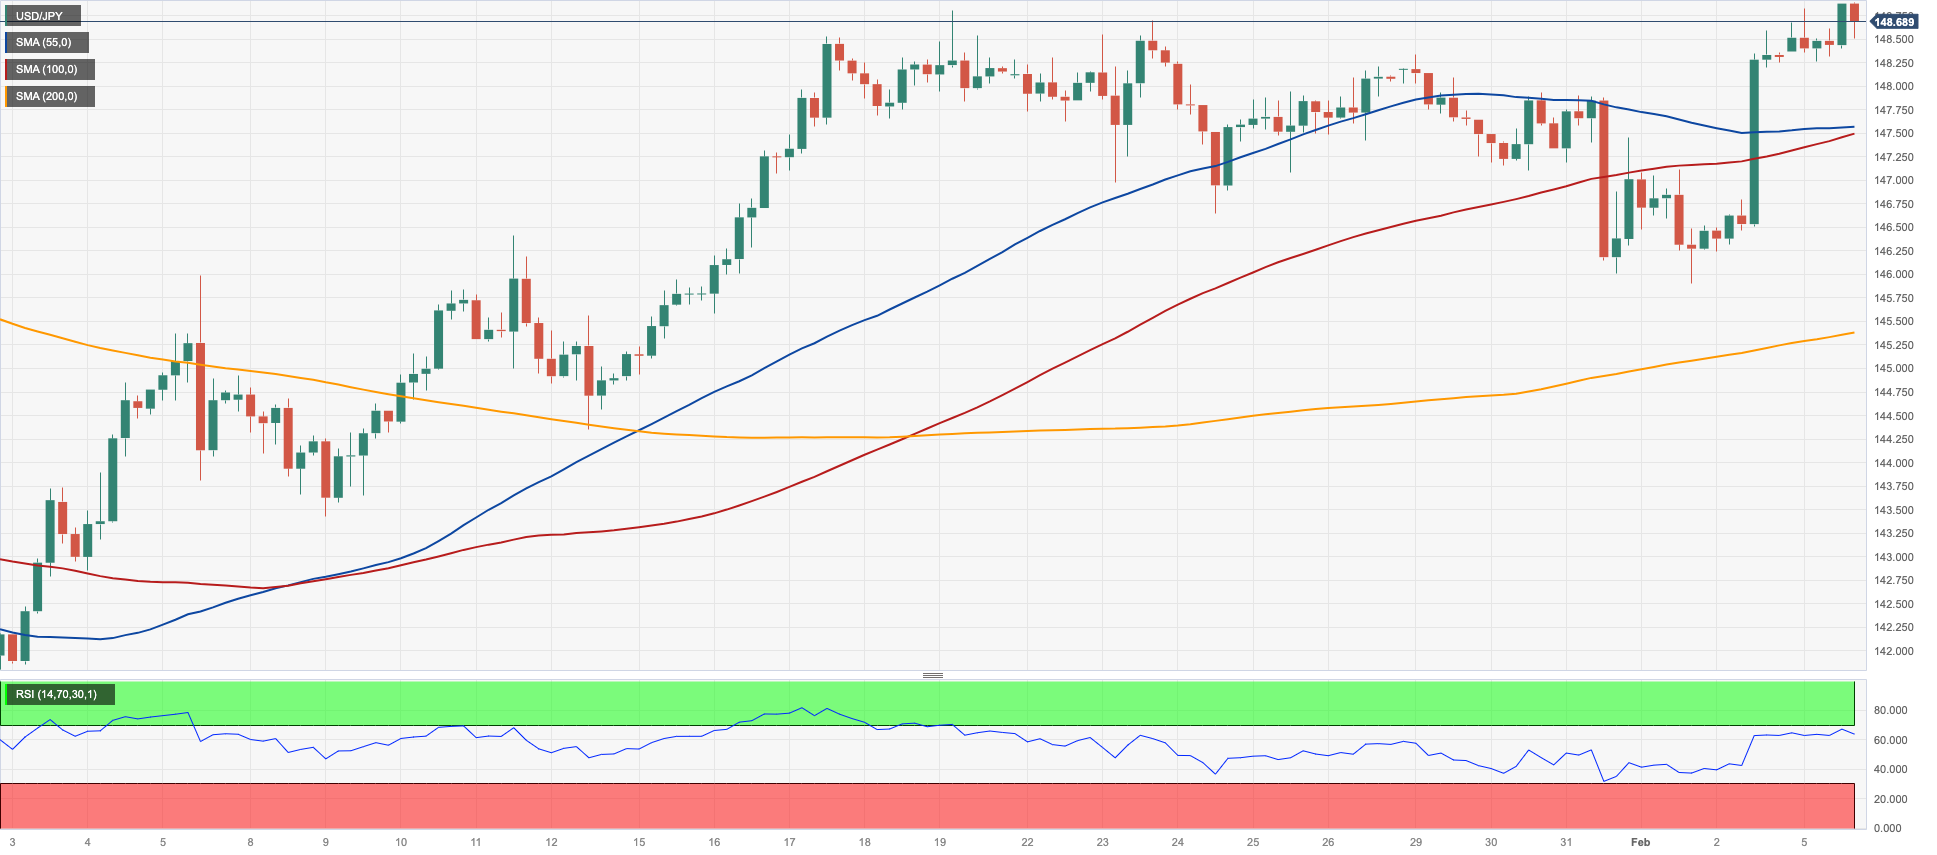
The continuation of the buying interest in the greenback associated with higher US yields across the curve lent extra support to USD/JPY and propelled it to fresh yearly highs in the area just shy of 149.00 the figure on Monday.
In fact, Powell’s hawkish comments pushed further back speculation of an interest rate cut by the Fed, while the strong-than-expected Nonfarm Payrolls recorded in January also boosted demand for the buck and lifted the USD Index (DXY) to fresh yearly peaks.
In Japan, JGB 10-year yields reversed two consecutive daily drops and regained the area beyond 0.70%.
There were no data releases scheduled for the domestic calendar on Monday.
If the recovery gains momentum, USD/JPY may revisit the 2024 high of 148.89 (February 5), followed by the primary obstacle of 150.00 and the 2023 top of 151.90 (November 13). Further up, the 2022 peak of 151.94 (October 21) comes just before the round number of 152.00. Just the opposite, immediate contention is at the so-far February low of 145.89 (February 1), prior to the preliminary 55-day SMA at 145.77. Down from here comes the important 200-day SMA of 144.66, ahead of the December 2023 bottom of 140.24 (December 28), and the round number of 140.00, all before the July low of 137.23 (July 14). The day-to-day RSI rose beyond 61.
Resistance levels: 148.89 149.67 151.43 (4H chart)
Support levels: 145.89 145.36 144.34 (4H chart)
GBPUSD
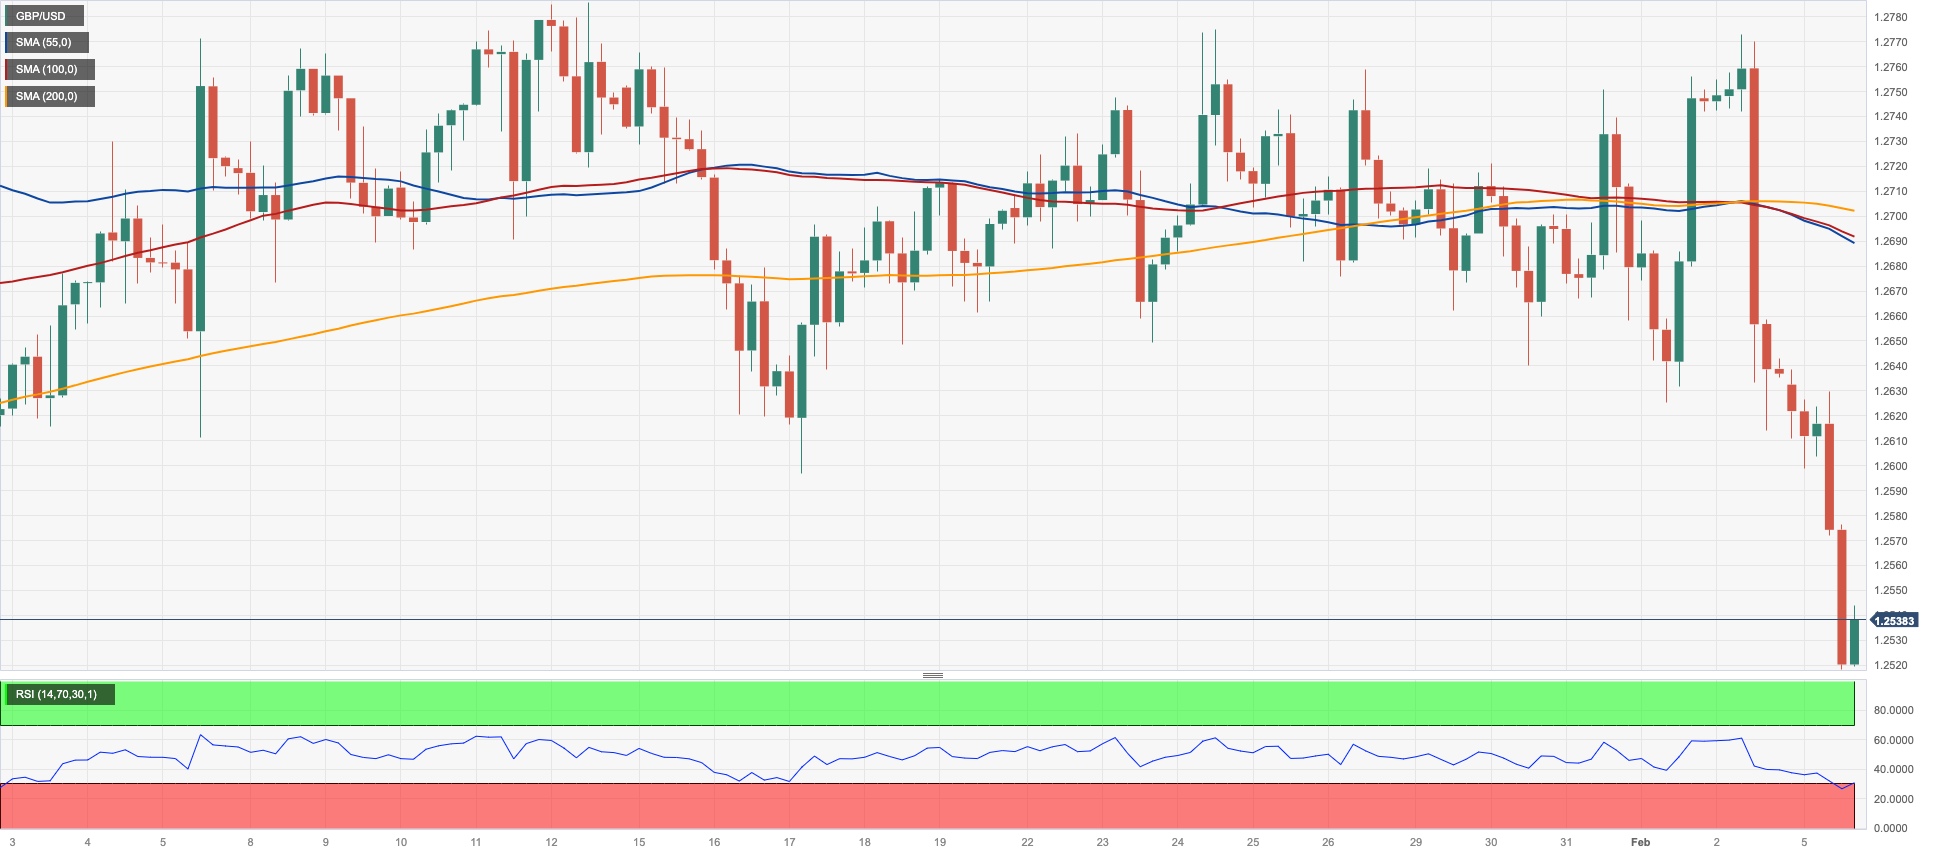
GBP/USD added to Friday’s pessimism and dropped sharply to new two-month lows near 1.2520 at the beginning of the week.
The intense leg lower in Cable followed the increasingly bullish tone in the greenback, which was particularly magnified following Friday’s NFP prints and the cautious tone from Fed’s Powell in an interview released over the weekend, which also poured cold water over expectations of an interest rate cut in the short-term horizon.
Further weakness around the quid came in tandem with extra recovery in UK 10-year gilt yields, while BoE’s H. Pill stated that, in his view, the time when rate cuts will be possible is still some way off. He pointed out that the need for a restrictive policy doesn't imply that rates have to remain at their current level indefinitely. He added that there is a need to overlook any temporary achievement of the inflation target in the coming months. Pill emphasized that the focus now is on when there is enough evidence to cut rates, not if.
In the UK, the final Services PMI improved to 54.4 in the first month of the year.
The breakdown of the 2024 low of 1.2518 (February 5) exposes the December 2023 bottom of 1.2500 (December 13). Extra weakness may cause GBP/USD to target the weekly low of 1.2187 (November 10, 2023), before striking the October 2023 low of 1.2037 (October 3), the critical 1.2000 mark, and the 2023 bottom of 1.1802 (November 10, 2023). On the upside, initial resistance aligns at the 2024 high of 1.2785 (January 12) prior to the December top of 1.2827 (December 28), followed by the weekly peak of 1.2995 (July 27, 2023), which is just shy of the key 1.3000 yardstick. The daily RSI dipped to the 37 zone.
Resistance levels: 1.2699 1.2772 1.2785 (4H chart)
Support levels: 1.2518 1.2500 1.2448 (4H chart)
GOLD
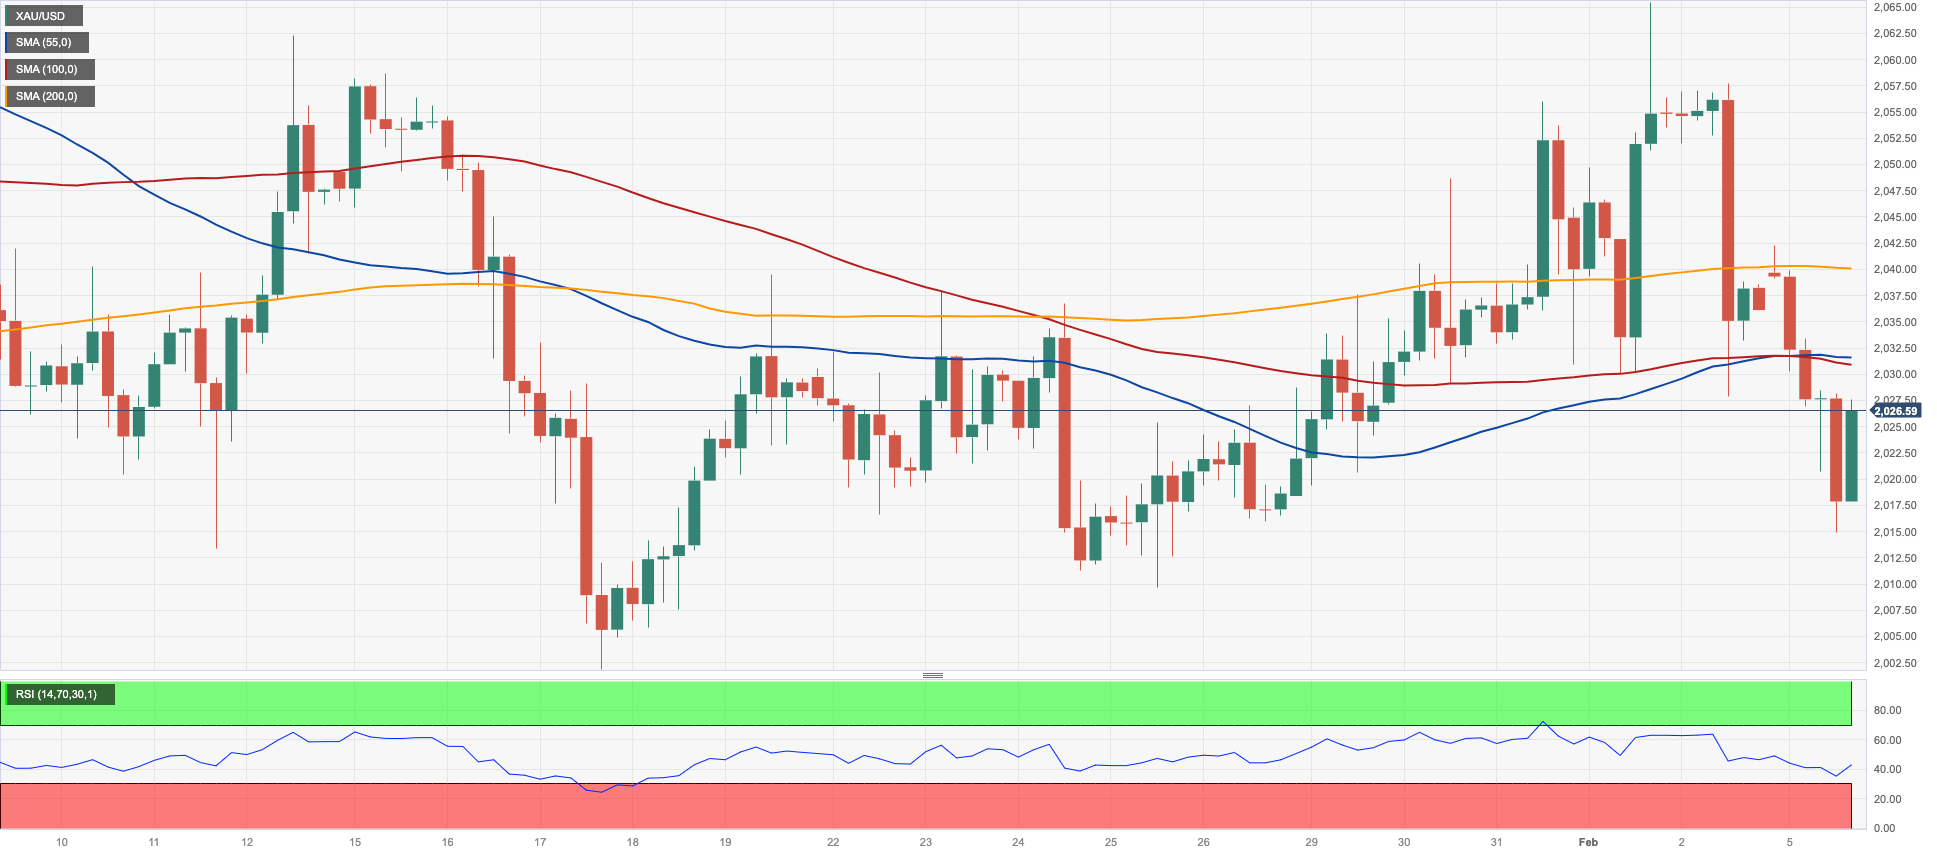
Prices of the yellow metal added to Friday’s weakness and receded to the $2015 region on Monday, or multi-session lows.
The sharp move higher in the greenback and the equally strong bounce in US yields across various maturities kept the price action around the precious metal depressed at the beginning of the week.
In the meantime, steady geopolitical concerns did nothing to soothe the downward bias in gold, as investors’ repricing of a later kickstart of a potential easing cycle by the Federal Reserve remained a key factor behind price action and sentiment in the global markets.
Further losses could drag gold to revisit the 2024 low of $2001 (January 17) ahead of the December 2023 low of $1973, which is supported by the proximity of the 200-day SMA at $1965. A deeper drop could put the November 2023 low of $1931 back on the radar ahead of the October 2023 low of $1810, seconded by the 2023 low of $1804, and the $1800 contention zone. In the other direction, occasional bullish attempts may force the metal to retest the weekly top of $2088 (December 28), which precedes the all-time peak of $2150 (December 4th, 2023).
Resistance levels: $2039 $2065 $2078 (4H chart)
Support levels: $2014 $2009 $2001 (4H chart)
CRUDE WTI
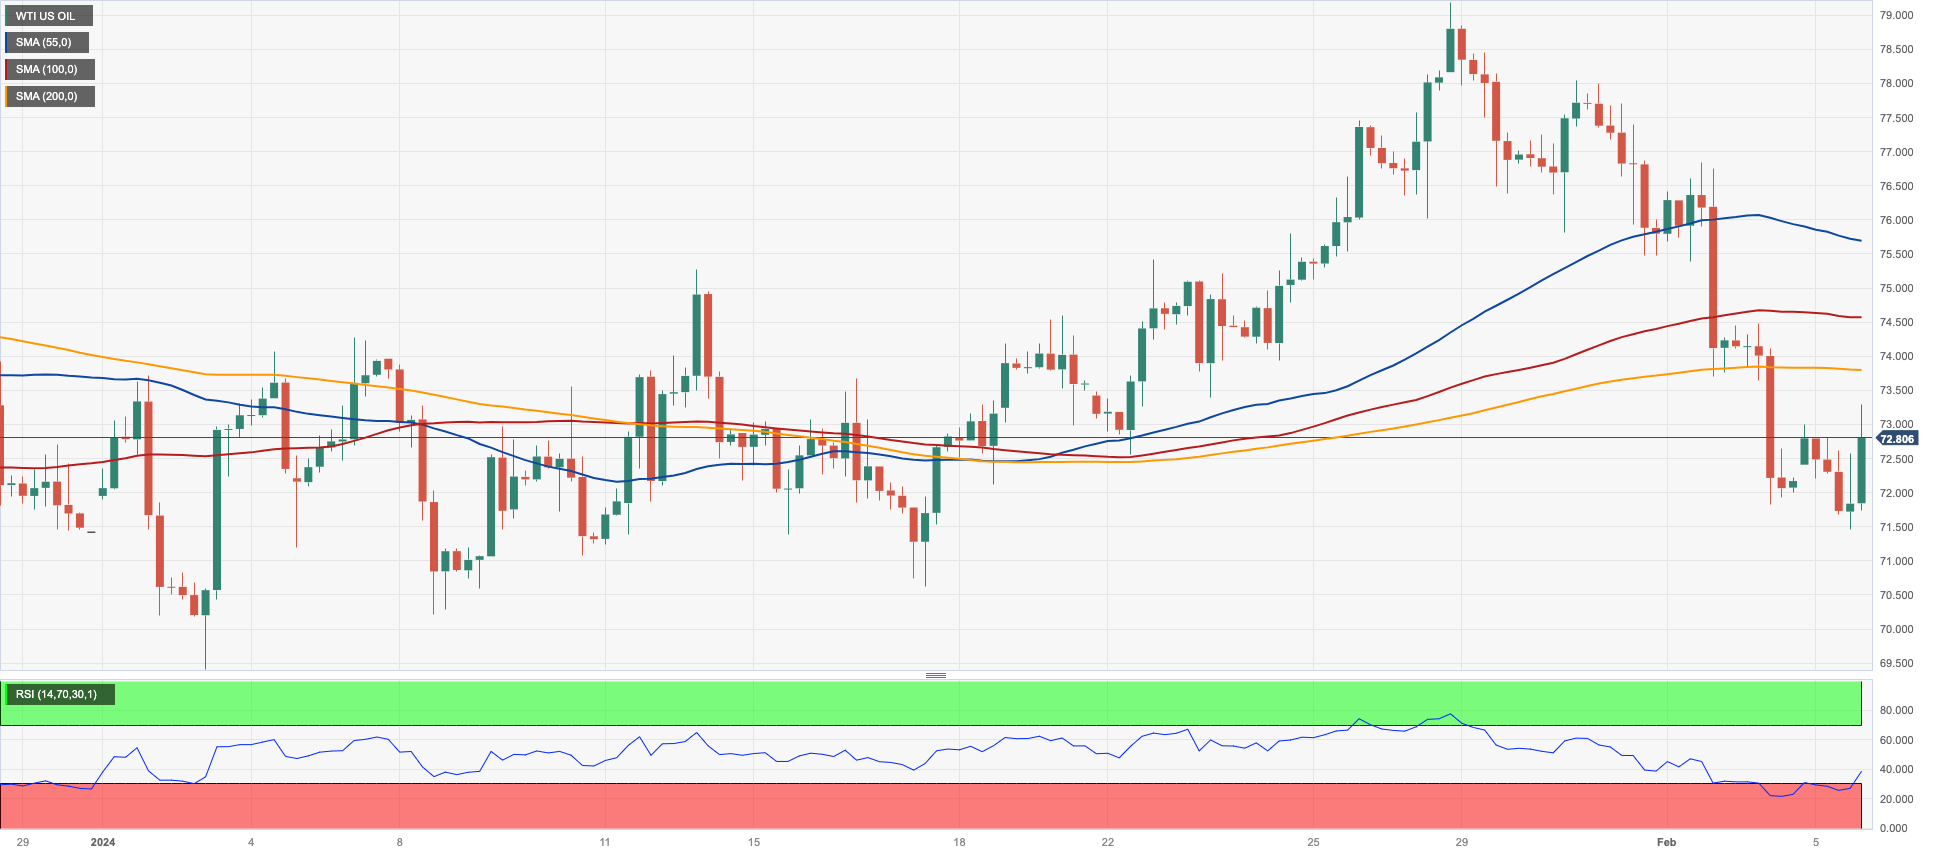
WTI prices managed to reverse a drop to three-week lows near the $71.00 mark per barrel on Monday, regaining some composure as well as the area above the $72.00 level towards the end of the NA session.
The price action around the commodity came in response to increasing speculation that the Fed might maintain its restrictive stance for longer. This view has been exacerbated following the strong job creation seen in January as well as the hawkish tone from Chair Powell’s interview over the weekend.
In the meantime, unabated geopolitical effervescence in the Middle East and the Red Sea is expected to somewhat limit bouts of weakness around the commodity for the time being.
Later in the week, the API and the EIA will report on weekly US crude oil inventories in the week to February 2.
Immediately to the downside for WTI prices now emerges the critical $70.00 barrier closely followed by the 2024 bottom of $69.31 (January 3). The breach of the latter may reveal the December 2023 low of $67.74 (December 13), before the June 2023 bottom of $66.85 (June 12). In contrast, the next upward target for WTI is the key 200-day SMA at $77.38 prior to the 2024 peak of $79.25 (January 29), which is immediately followed by the critical $80.00 barrier and comes ahead of the November 2023 high of $80.15 (November 3). Extra upside from here may take the market back to its weekly top of $89.83 (October 18, 2023), followed by the 2023 peak of $94.99 (September 28, 2023) and the August 2022 high of $97.65. Further up comes the psychological $100.00 threshold.
Resistance levels: $73.72 $76.91 $78.11 (4H chart)
Support levels: $71.43 $70.59 $69.25 (4H chart)
GER40
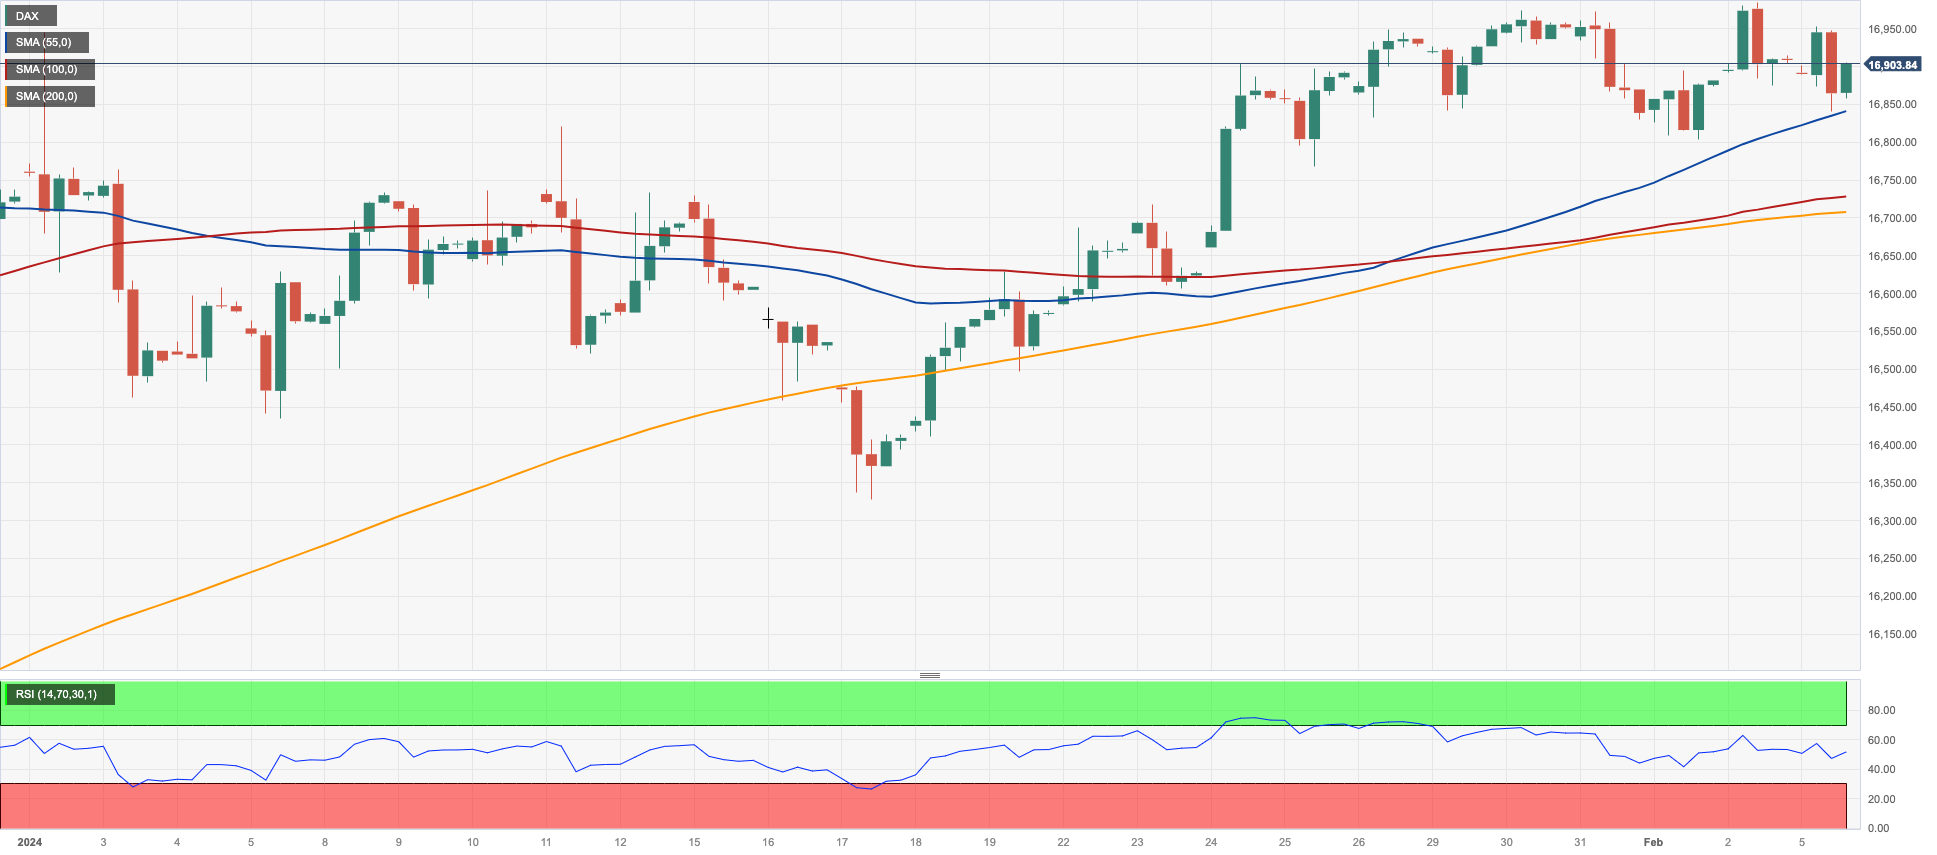
The German stock index DAX40 started the week slightly on the defensive around the 16900 zone.
Indeed, the index reversed the positive end of last week and ended with modest losses on the back of mixed corporate earnings reports, renewed Chinese jitters surrounding its stock market and the economy itself and the prospects of the tighter-for-longer stance by the Federal Reserve, as per Powell’s comments over the weekend.
In the German money market, 10-year bund yields rose to multi-day highs past 2.30%.
Further increases in the DAX40 seek the all-time high of 17004 (February 2). Having said that, there is immediate conflict at the February low of 16821 (February 1), followed by the transitory 55-day SMA at 16563 and the 2024 bottom of 16345 (January 17). Once the index clears the latter, a possible visit to the 200-day SMA of 15956 might be on the horizon before the weekly low of 15915 (November 28). The October 2023 low of 14630 (October 23) follows next, before the March 2023 low of 14458 (March 20). The daily RSI looked stable around 59.
Best Performers: Beiersdorf AG, Infineon, Hannover Rueck SE
Worst Performers: Deutsche Bank AG, Continental AG, Mercedes Benz Group
Resistance levels: 17004 (4H chart)
Support levels: 16821 16345 16317 (4H chart)
GBPJPY
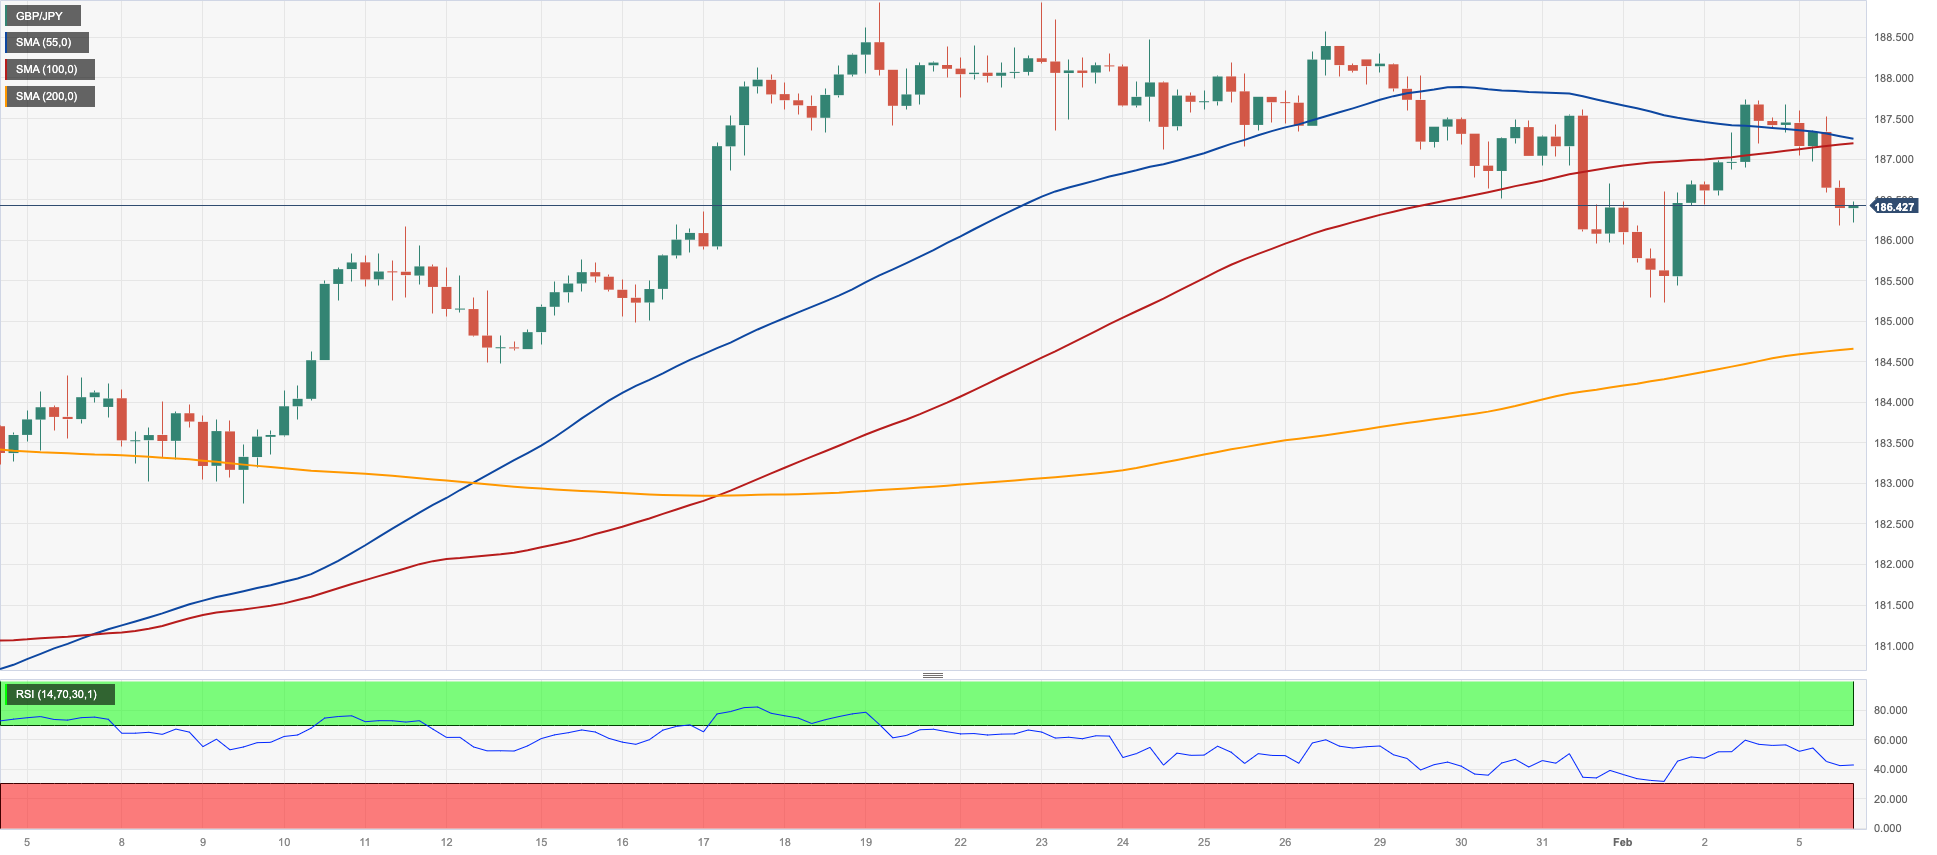
The generalized risk-off environment favoured a negative start of the week for GBP/JPY, dragging it to two-day lows near the 186.00 support on Monday.
The daily decline in the cross came amidst the firm note in the greenback across the board, while the British pound traded well on the defensive vs. its G10 peers.
Further decline in GBP/JPY must now pass the February low of 185.22 (February 1) before testing the short-term support at the 55-day and 100-day SMAs of 184.76 and 184.00, respectively. If the cross clears this level, it may challenge the more critical 200-day SMA at 181.67, ahead of the December 2023 bottom of 178.33 (December 14) and the October 2023 low of 178.03 (October 3). South of here is the July 2023 low of 176.30, which preceded the May 2023 low of 167.84 (May 11). In contrast, a rise over the 2024 top of 188.93 (January 19) would lead to a test of the round number of 190.00 before the August 2015 peak of 195.28 (August 18)
Resistance levels: 187.73 188.56 188.93 (4H chart)
Support levels: 185.22 184.61 182.75 (4H chart)
NASDAQ
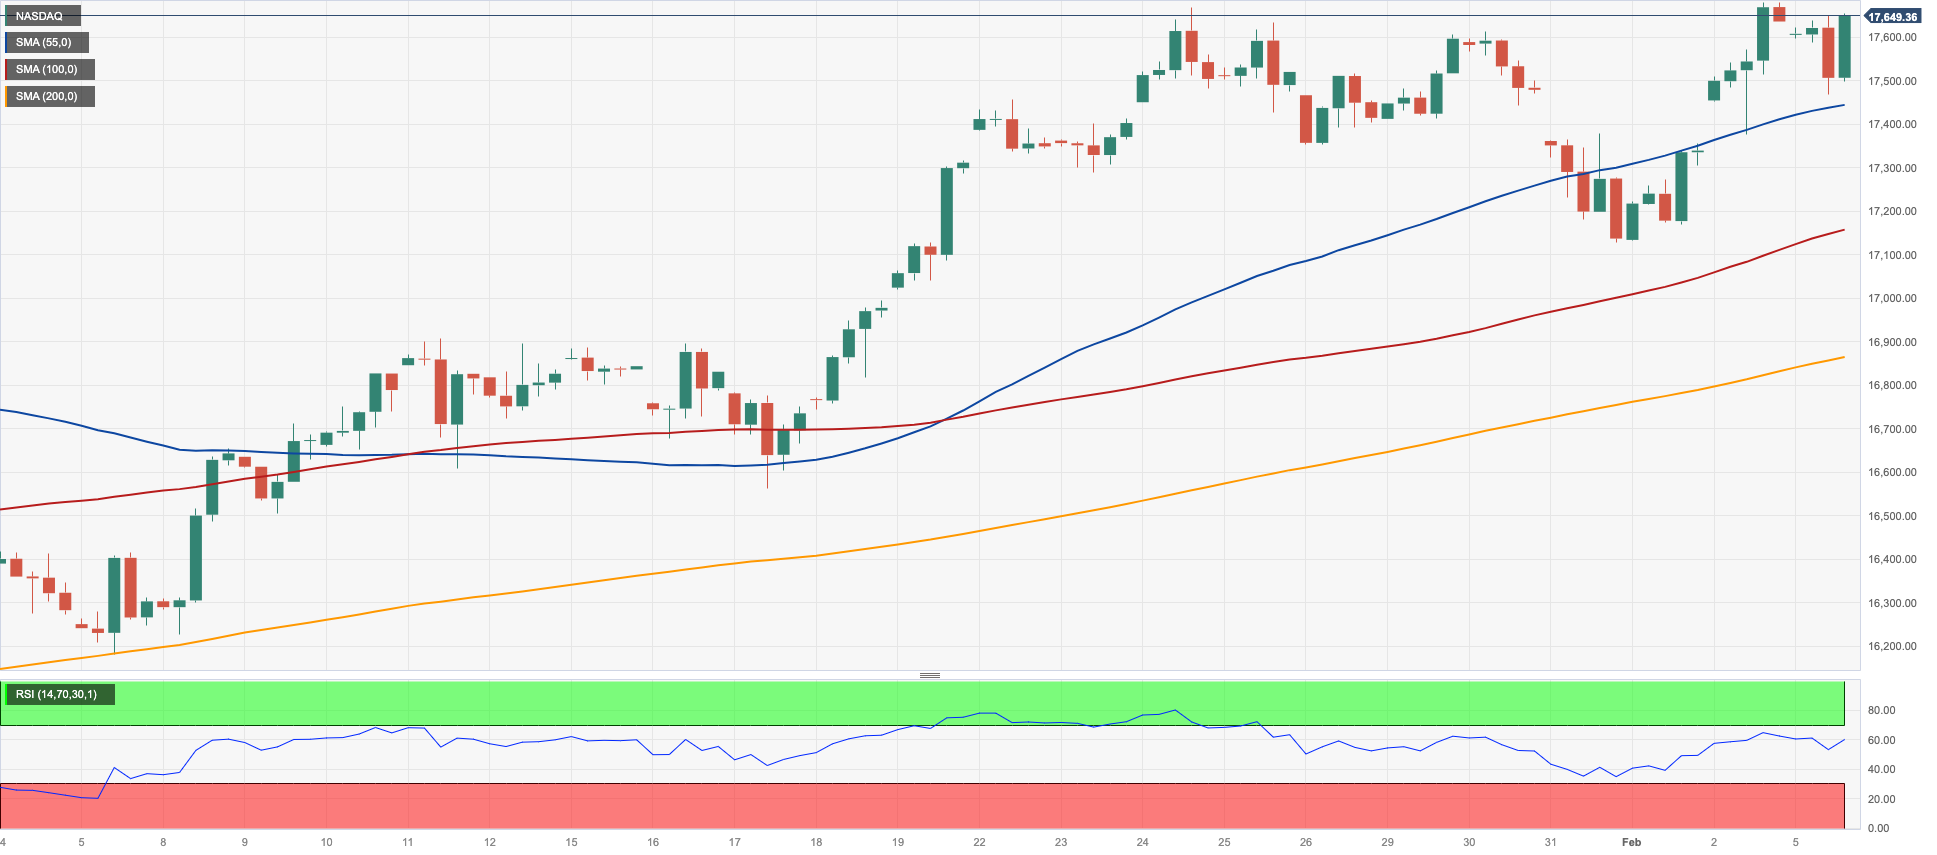
The tech sector followed its US peers and retreated modestly on Monday, dragging the benchmark Nasdaq 100 to the negative territory after two straight sessions of gains.
The move lower in the index came in tandem with the continuation of the march north in the US Dollar, at the time when investors kept assessing Powell’s hawkish remarks and the latest NFP figures, all underpinning a delay in the Fed’s decision to lower its interest rates.
Additional increases should encourage the Nasdaq 100 to target its record high of 17682 (February 2). Bearish attempts, on the other hand, should target the weekly low of 17128 (January 31) preceding the intermediate 55-day SMA at 16609 and the 2024 low of 16249 (January 5). If the index clears this zone, it may face the December 2023 low of 15695 (December 4) and the critical 200-day SMA of 15249. A further decrease from here may result in a regression to the October 2023 bottom of 14058 (October 26) and the April 2023 low of 12724 (April 25), ahead of the March 2023 low of 11695 (March 13) and the 2023 low of 10696 (January 3). The everyday RSI receded to the 65 zone.
Top Gainers: ON Semiconductor, IDEXX Labs, NVIDIA
Top Losers: Zscaler, GlobalFoundries, Charter Communications
Resistance levels: 17682 (4H chart)
Support levels: 17128 16561 16249 (4H chart)
DOW JONES
The US stock reference Dow Jones kicked off the week in a negative fashion, leaving behind at the same time two consecutive daily advances.
The corrective decline in the index came on the back of surging US yields and a robust pick-up in demand for the greenback, all following stellar Nonfarm Payrolls (+353K) and Powell’s remarks suggesting caution ahead of any decision to reduce rates.
In addition, concerns surrounding the persistent weakness in the Chinese stock market also seems to have kept buyers at bay on Monday.
At the beginning of the week, the Dow Jones retreated 0.56% to 38438, the S&P 500 deflated 0.19% to 4949, and the tech-centric Nasdaq Composite eased 0.11% to 15610.
Next on the upward for the Dow Jones is the all-time high of 38783 (February 2). Alternatively, there is instant dispute at the 2024 low of 37122 (January 18), which comes before the weekly low of 37073 (December 20, 2023). The collapse of the latter suggests a probable challenge to the intermediate 55- and 100-day SMAs at 37009 and 35535, respectively. The 200-day SMA is immediately lower at 34874, ahead of the weekly low of 33859 (November 7, 2023), the October 2023 low of 32327 (October 27), and the 2023 low of 31429 (March 15). The daily RSI dropped to the 64 region.
Top Performers: Caterpillar, Apple, Intel
Worst Performers: McDonald’s, Walgreen Boots, 3M
Resistance levels: 38783 (4H chart)
Support levels: 38106 37122 36021 (4H chart)
MACROECONOMIC EVENTS
All Information & Updates provided by:

All information relating to the financial markets available on this page has been prepared and issued by FXStreet (Forexstreet SL, Spain, Reg: B62498233) on the basis of publicly available information and all information believed to be reliable and does not conflict with Kuwaiti local laws, and all necessary care has been taken to before the company to ensure that the facts mentioned are correct from the source.
NCM Investment nor any of its directors or employees shall in any way be held responsible for the contents of this news, and the information contained on this page is intended only to provide clients with publicly available information and should not be construed as investment advice, report or analysis and/or constitute an offer or invitation to buy or sell financial instruments of any kind.
RISK WARNING: Forex and CFDs are highly risky leveraged products, as losses can exceed deposits. Please ensure you understand all the risks and take independent advice if necessary. NCM will segregate the clients based on the criteria of the regulator and its bylaws. NCM does not provide any advisory service; the material published does not constitute advice or a recommendation for a transaction in any financial instrument. NCM accepts no responsibility for any use of the content presented and any consequences of that use. Anyone acting on the information provided does so at their own risk.