
- Contact Us:
-

-

-

-


Daily Market Updates
07 Feb 2024
EURUSD
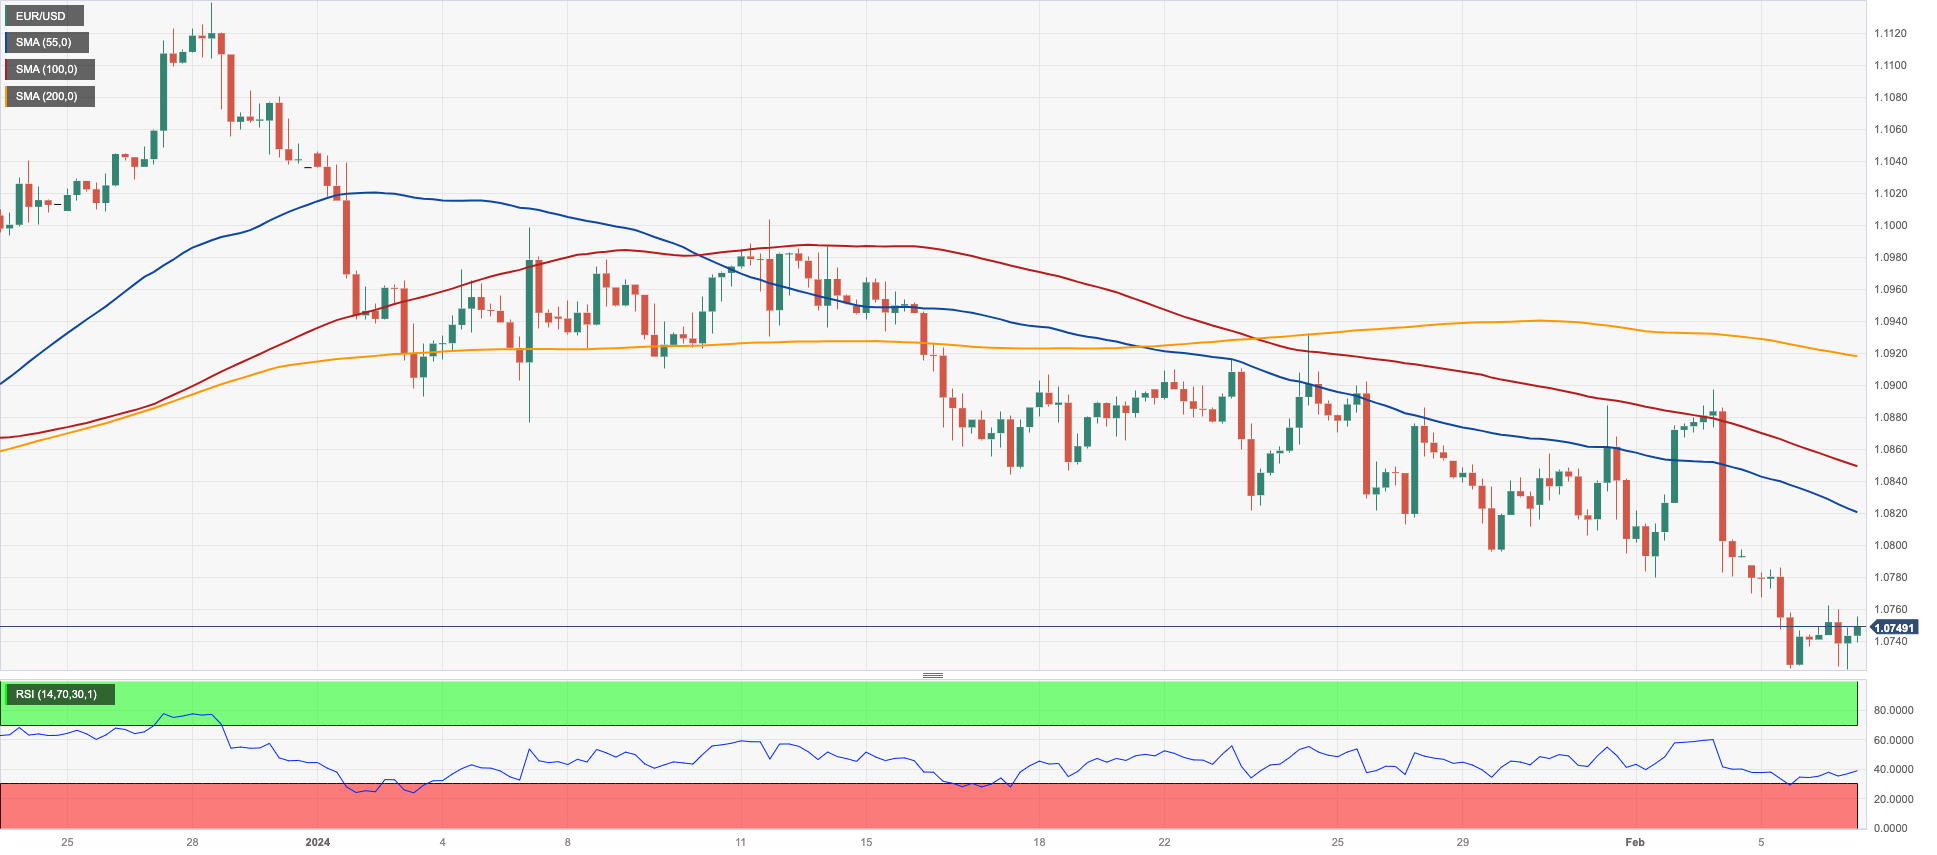
EUR/USD managed to grab some breathing space and charted modest gains near the 1.0760 zone on turnaround Tuesday.
The small rebound in spot came after two daily drops in a row, including a new 2024 low near 1.0720, all amidst the corrective pullback in the greenback and the moderated decline in US yields across the curve.
Looking at the macro environment, speculation around the potential timing of the Fed’s interest rate cuts (and some of the other G10 central banks) continued to dominate the sentiment among market participants on Tuesday.
Investors, in the meantime, now sees the Fed keeping its rates unchanged at the March event, while a probable rate cut could materialize at the May or June meetings.
On the domestic calendar, Retail Sales in the euro area contracted by 0.8% in the year to December.
In the US, the RCP/TIPP Economic Optimism Index eased to 44 in February.
If sellers break the 2024 low of 1.0722 (February 6), EUR/USD might fall quicker to the weekly low of 1.0495 (October 13, 2023), ahead of the 2023 low of 1.0448 (October 3) and the round level of 1.0400. In the other direction, there is first resistance at the important 200-day SMA at 1.00835, followed by the intermediate 55-day SMA at 1.0905 and the weekly high of 1.0932 (January 24). Further north, another weekly top of 1.0998 (January 5, 11) arrives before the December 2023 peak of 1.1139 (December 27). This level is also supported by the 200-week SMA of 1.1148, which comes before the 2023 high of 1.1275 (July 18). The daily RSI rebounded to 36.
Resistance levels: 1.0897 1.0918 1.0998 (4H chart)
Support levels: 1.0722 1.0656 1.0516 (4H chart)
USDJPY
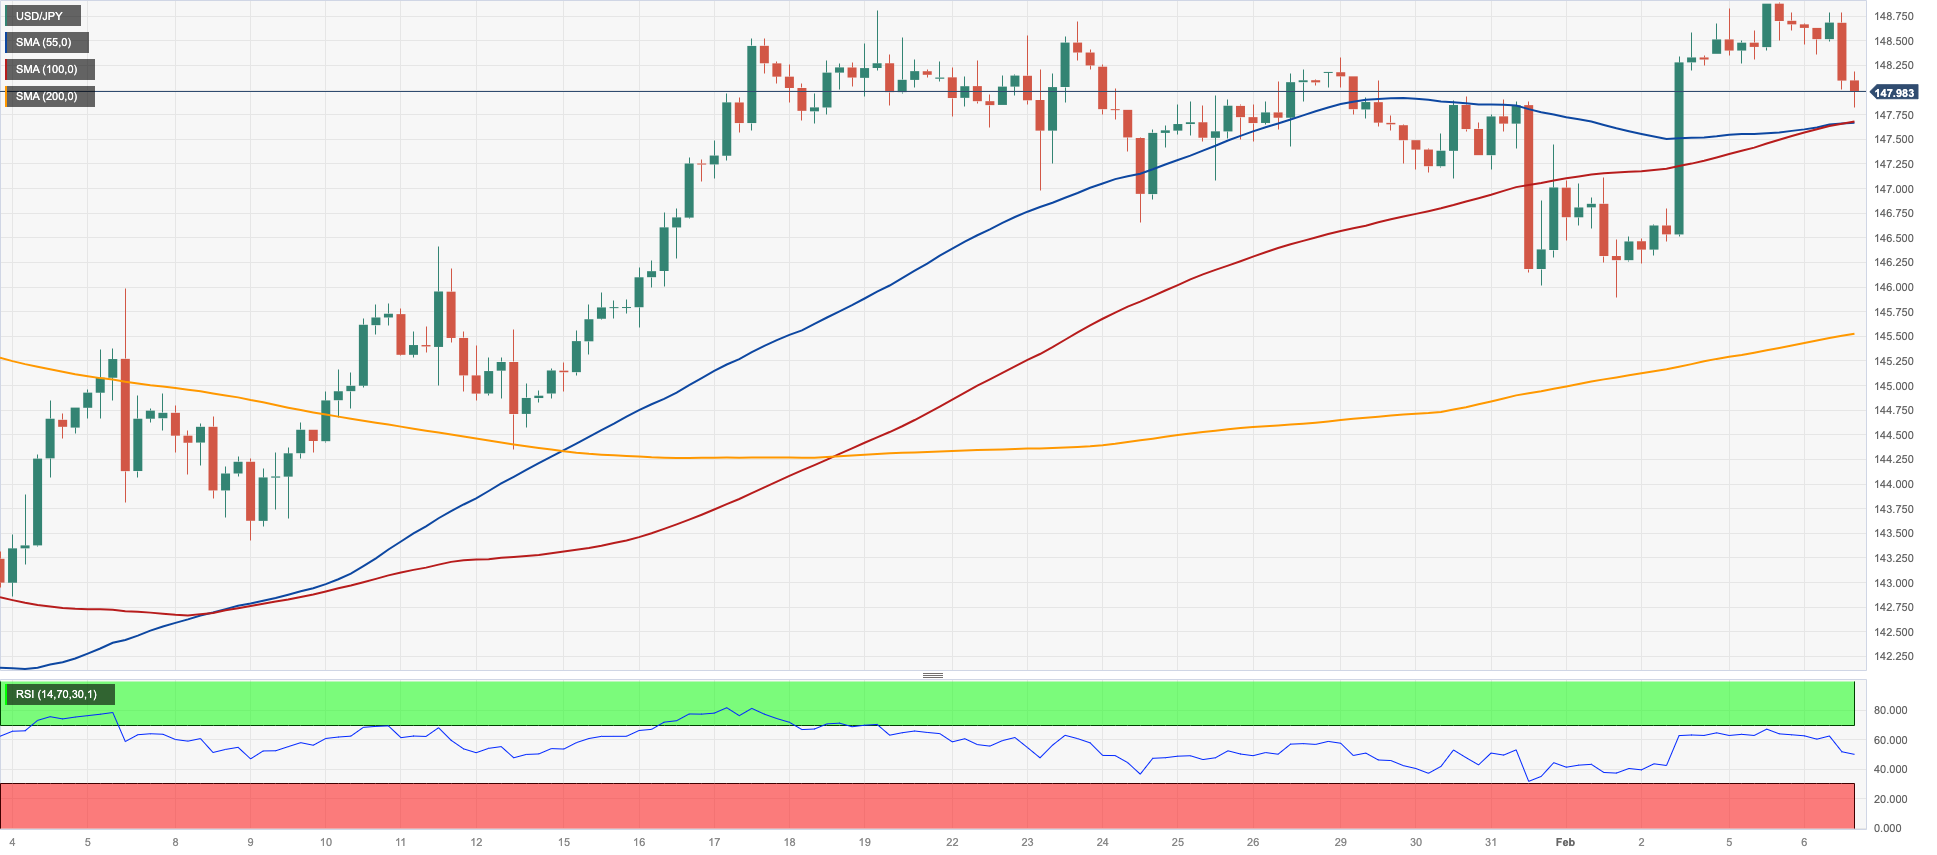
The resumption of the downward bias in the greenback in combination with diminishing US yields across different time frames prompted USD/JPY to slip back to the 148.00 neighbourhood, or two-day lows.
In Japan, Household Spending shrank more than estimated by 2.5% in the year to December.
On this, the Bank of Japan is closely observing the potential intensification of a positive cycle between wages and prices before considering a departure from accommodative policy measures. The subdued wage growth in Japan indicates that the central bank is unlikely to hasten policy normalization.
In the Japanese debt market, JGB 10-year yields rose marginally past the 0.72% level.
If the rebound gathers speed, USD/JPY might revisit the 2024 high of 148.89 (February 5), followed by the major hurdle of 150.00 and the 2023 top of 151.90 (November 13). Further up, the 2022 peak of 151.94 (October 21) occurs just before the round number of 152.00. On the contrary, immediate contention is at the so-far February low of 145.89 (February 1), which is reinforced by the preliminary 55-day SMA of 145.76. Down from here comes the crucial 200-day SMA of 144.71, ahead of the December 2023 low of 140.24 (December 28), and the round number of 140.00, all before the July low of 137.23 (July 14). The day-to-day RSI fell below 57.
Resistance levels: 148.89 149.67 151.43 (4H chart)
Support levels: 147.96 145.89 145.50 (4H chart)
GBPUSD
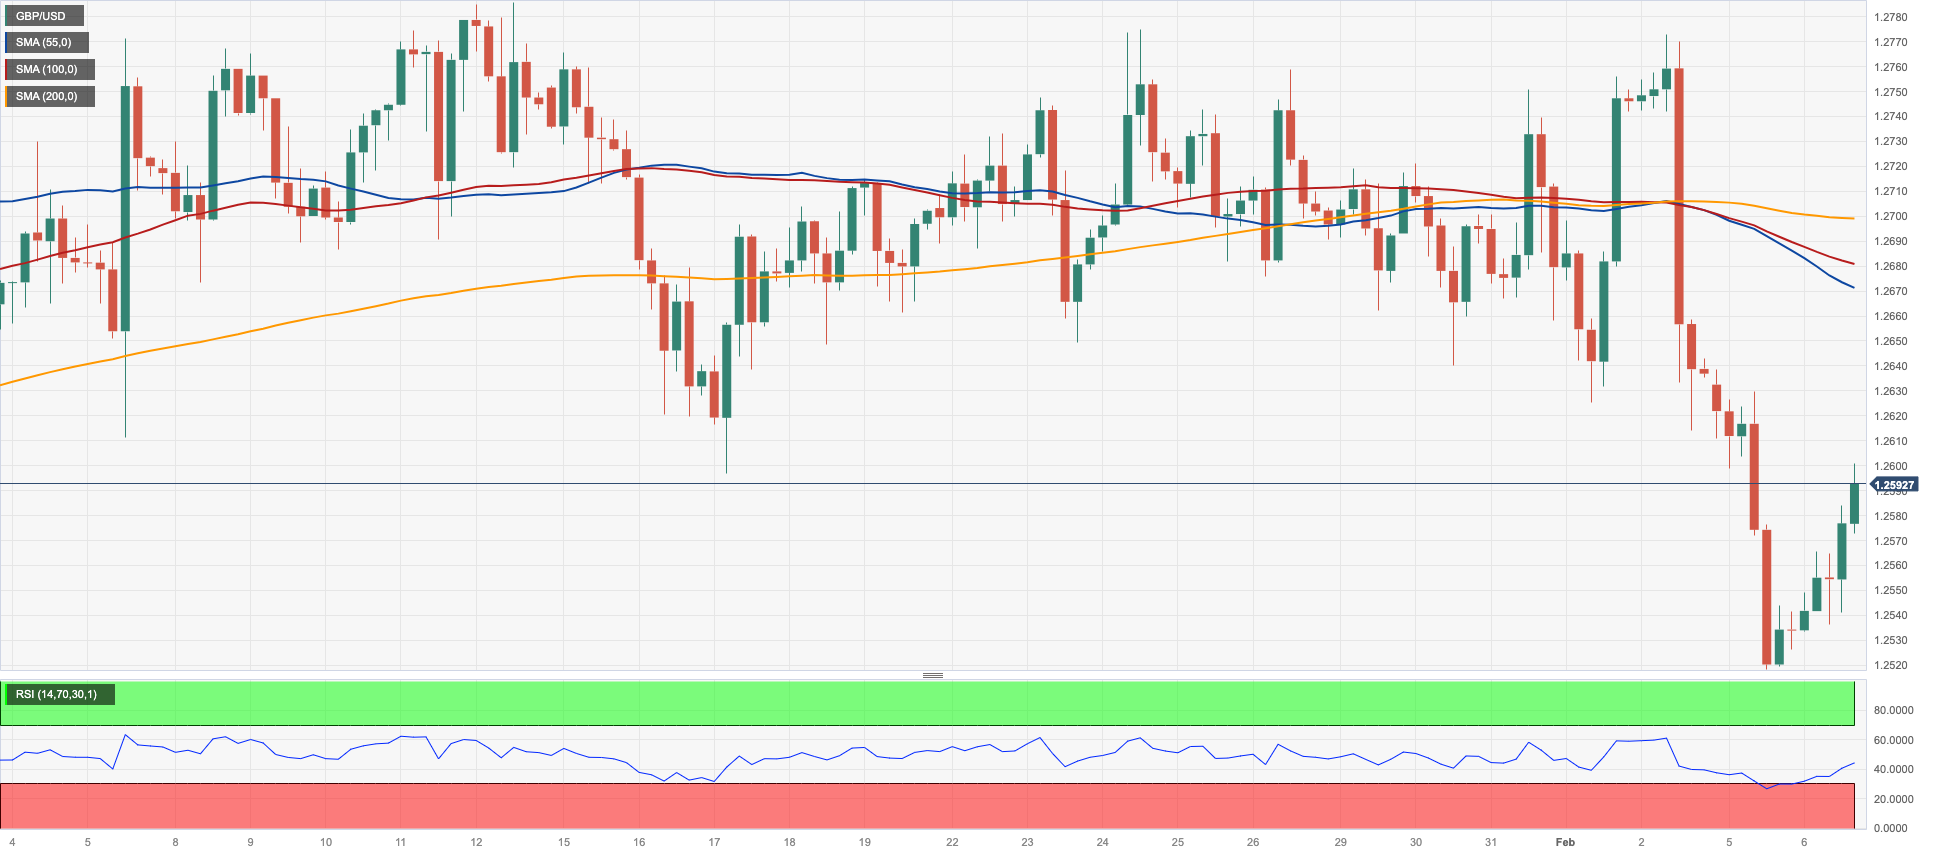
The British pound regained the smile and lifted GBP/USD back above the key 200-day SMA, flirting at the same time with the key 200-day SMA in the boundaries of 1.2600 the figure on Tuesday.
That said, Cable set aside two daily declines in a row and regained some upside traction on the back of the marked selling bias in the greenback.
In the UK, the BRC Retail Sales Monitor expanded at an annualized 1.4% in January, and the Construction PMI improved to 48.8 in the first month of the year.
The daily bounce in spot came in contrast to a retracement in UK 10-year gilt yields, which retreated to the sub-4.0% zone.
The breach of the 2024 low of 1.2518 (February 5) reveals the December 2023 low of 1.2500 (December 13). Extra weakness may drive GBP/USD to target the weekly low of 1.2187 (November 10, 2023), before touching the October 2023 low of 1.2037 (October 3), the key 1.2000 level, and the 2023 bottom of 1.1802 (November 10, 2023). On the upside, initial resistance is at the 2024 peak of 1.2785 (January 12), followed by the December high of 1.2827 (December 28), and then the weekly top of 1.2995 (July 27, 2023), which is just shy of the important 1.3000 yardstick. The daily RSI bounced past the 43 level.
Resistance levels: 1.2596 1.2696 1.2772 (4H chart)
Support levels: 1.2518 1.2500 1.2448 (4H chart)
GOLD
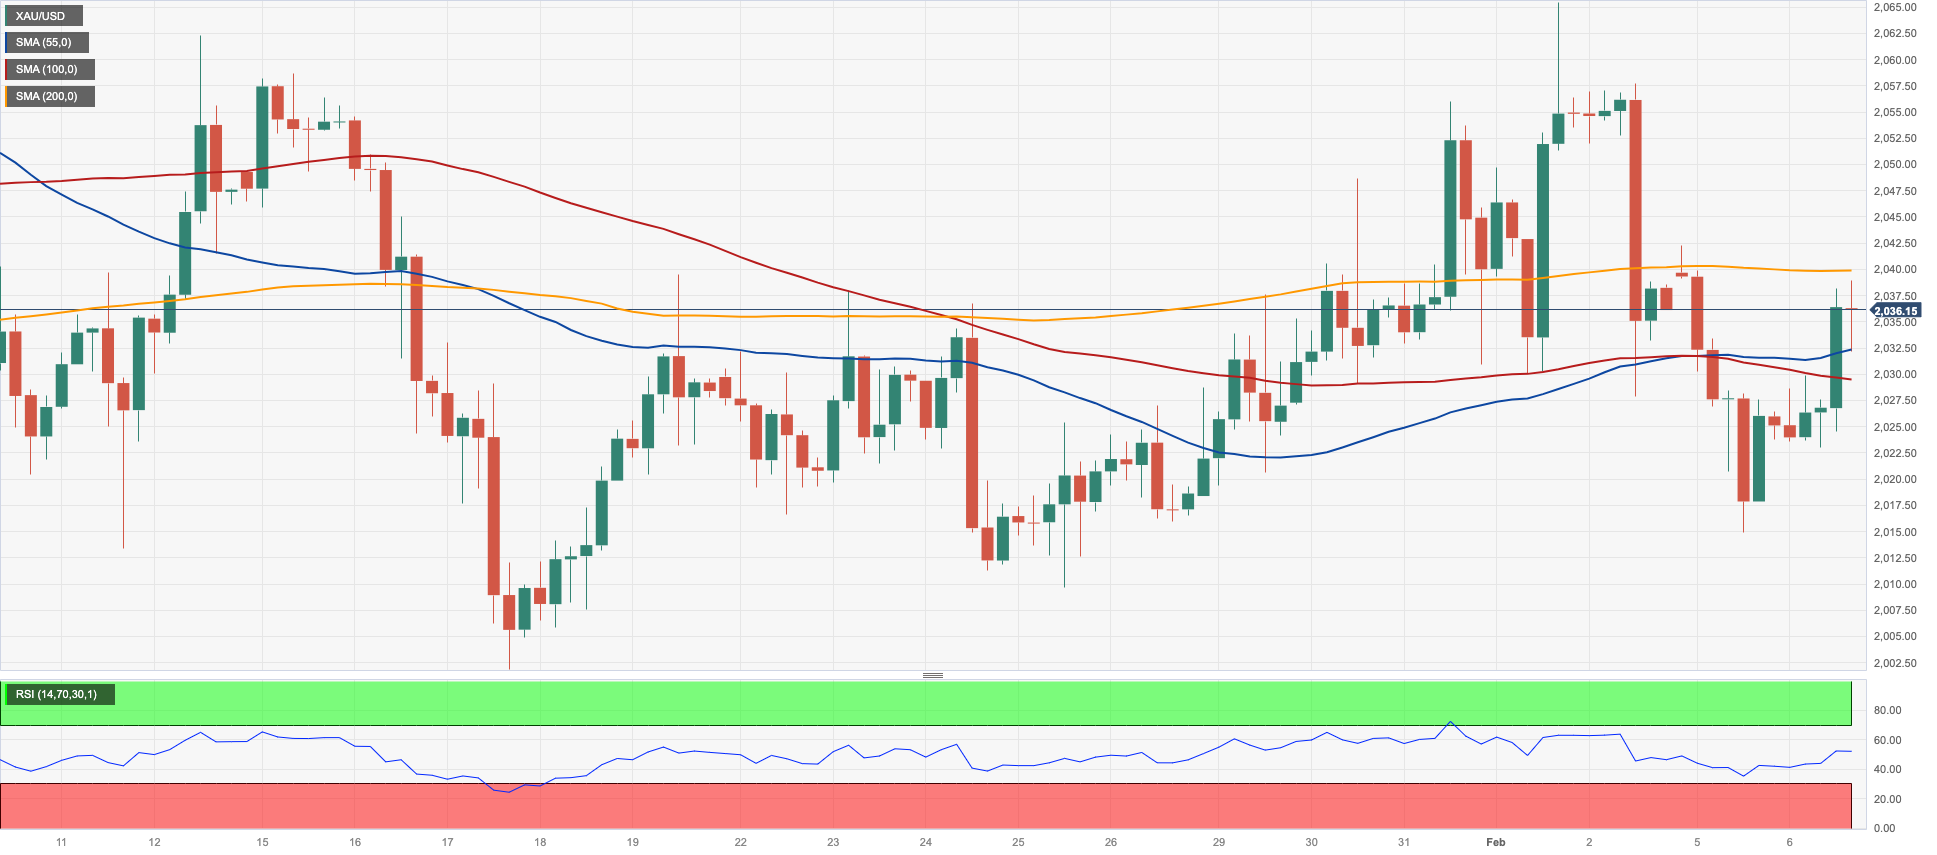
Gold prices reversed two straight sessions of losses and managed to pick up some traction in the vicinity of the $2040 region per troy ounce on Tuesday.
The daily recovery of the precious metal came in response to a marked U-turn in the greenback, which motivated the USD Index (DXY) to give away some of its recent strong gains and the corrective pullback in US yields across the board.
Meanwhile, persistent geopolitical concerns kept occasional bearish moves somehow contained, while investors continued to adjust their expectations for a delayed initiation of a potential easing cycle by the Fed.
Further losses may cause gold to revisit the 2024 bottom of $2001 (January 17), ahead of the December 2023 low of $1973, which is supported by the 200-day SMA at $1965. A deeper loss may bring the November 2023 bottom of $1931 back into focus, ahead of the October 2023 low of $1810, followed by the 2023 low of $1804 and the $1800 contention zone. On the other hand, bullish attempts may lead the metal to retest the weekly top of $2088 (December 28), which precedes the all-time peak of $2150 (December 4, 2023).
Resistance levels: $2039 $2065 $2078 (4H chart)
Support levels: $2014 $2009 $2001 (4H chart)
CRUDE WTI
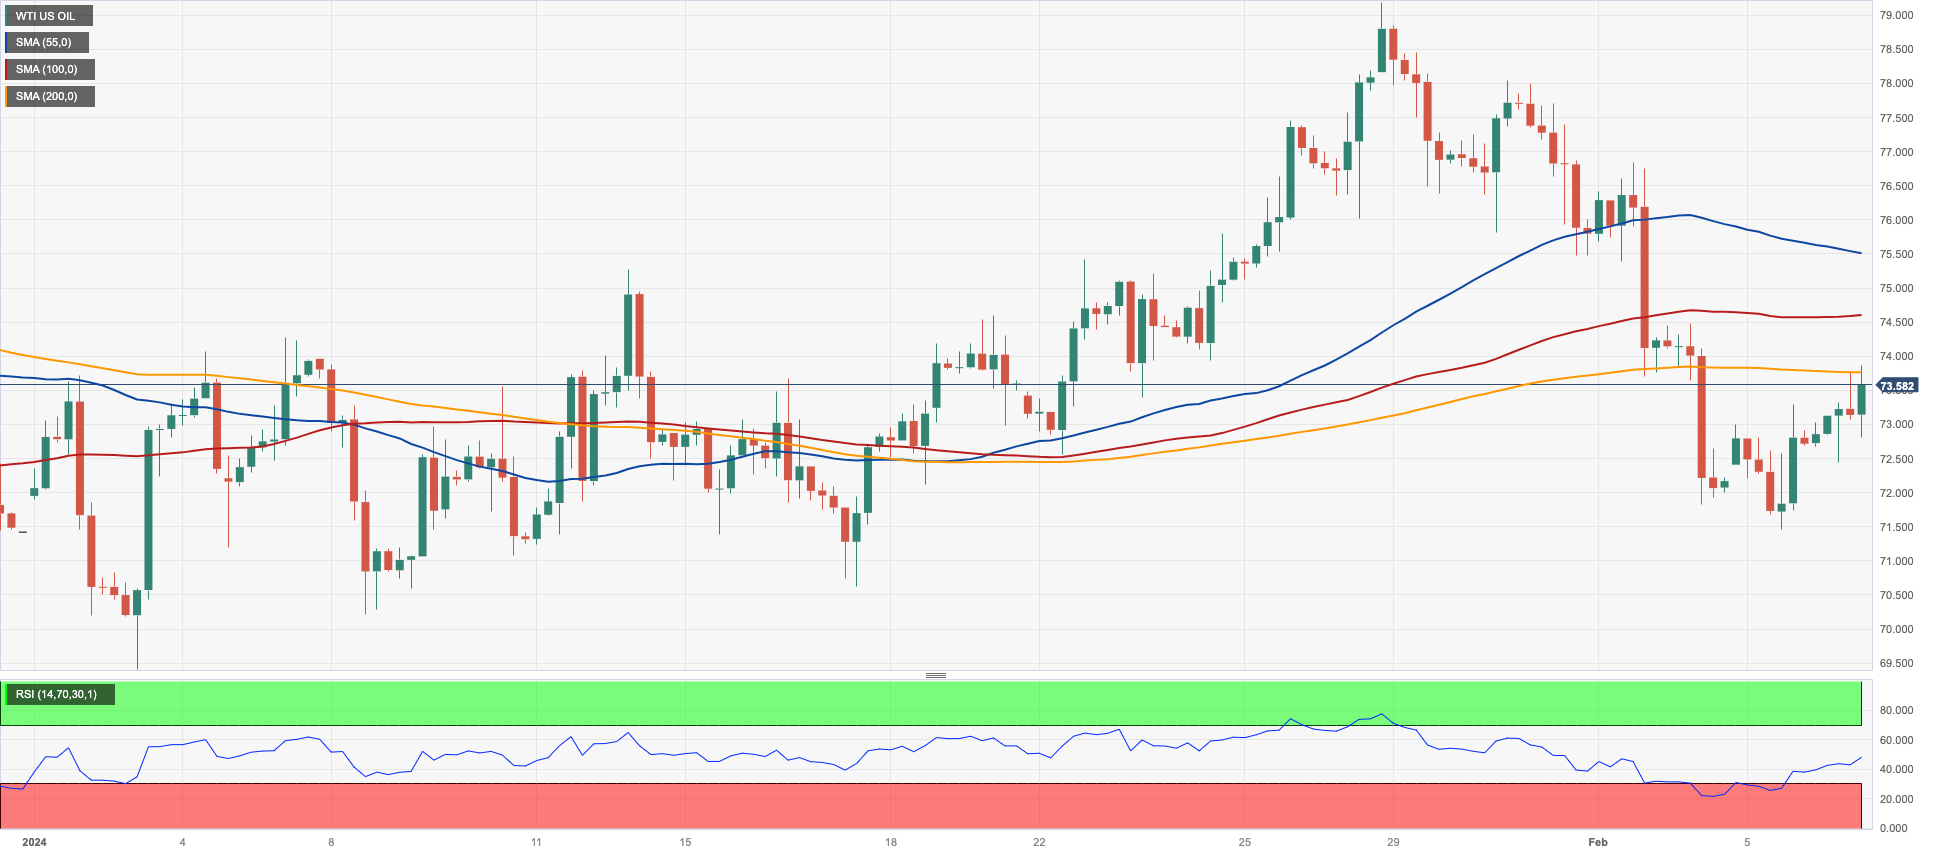
Prices of WTI advanced modestly and approached the $74.00 mark per barrel on turnaround Tuesday.
The move higher in crude oil prices came on the back of the renewed weakness hitting the greenback, while traders also kept their focus on diplomatic efforts to bring a ceasefire to the Israel-Hamas conflict, despite the fact that the Red Sea crisis remained unabated.
On another front, Saudi Arabia unexpectedly kept the prices of the Arab Light crude unchanged for its Asian clients.
Later in the week, traders’ attention is expected to be on the release of the weekly US crude oil inventories by the EIA.
The loss of the February low of $71.43 (February 5) could put the important $70.00 barrier back on the radar shortly followed by the 2024 bottom of $69.31 (January 3). The break of the latter might expose the December 2023 low of $67.74 (December 13), before the June 2023 bottom of $66.85 (June 12). In comparison, the next upward objective for WTI is the crucial 200-day SMA at $77.37, prior to the 2024 top of $79.25 (January 29), which is immediately followed by the vital $80.00 barrier and comes ahead of the November 2023 peak of $80.15 (November 3). Extra upside from here may bring the market back to its weekly high of $89.83 (October 18, 2023), seconded by the 2023 top of $94.99 (September 28, 2023) and the August 2022 high of $97.65 (August 30), all preceding the psychological $100.00 barrier.
Resistance levels: $73.78 $76.91 $78.11 (4H chart)
Support levels: $71.37 $70.59 $69.25 (4H chart)
GER40
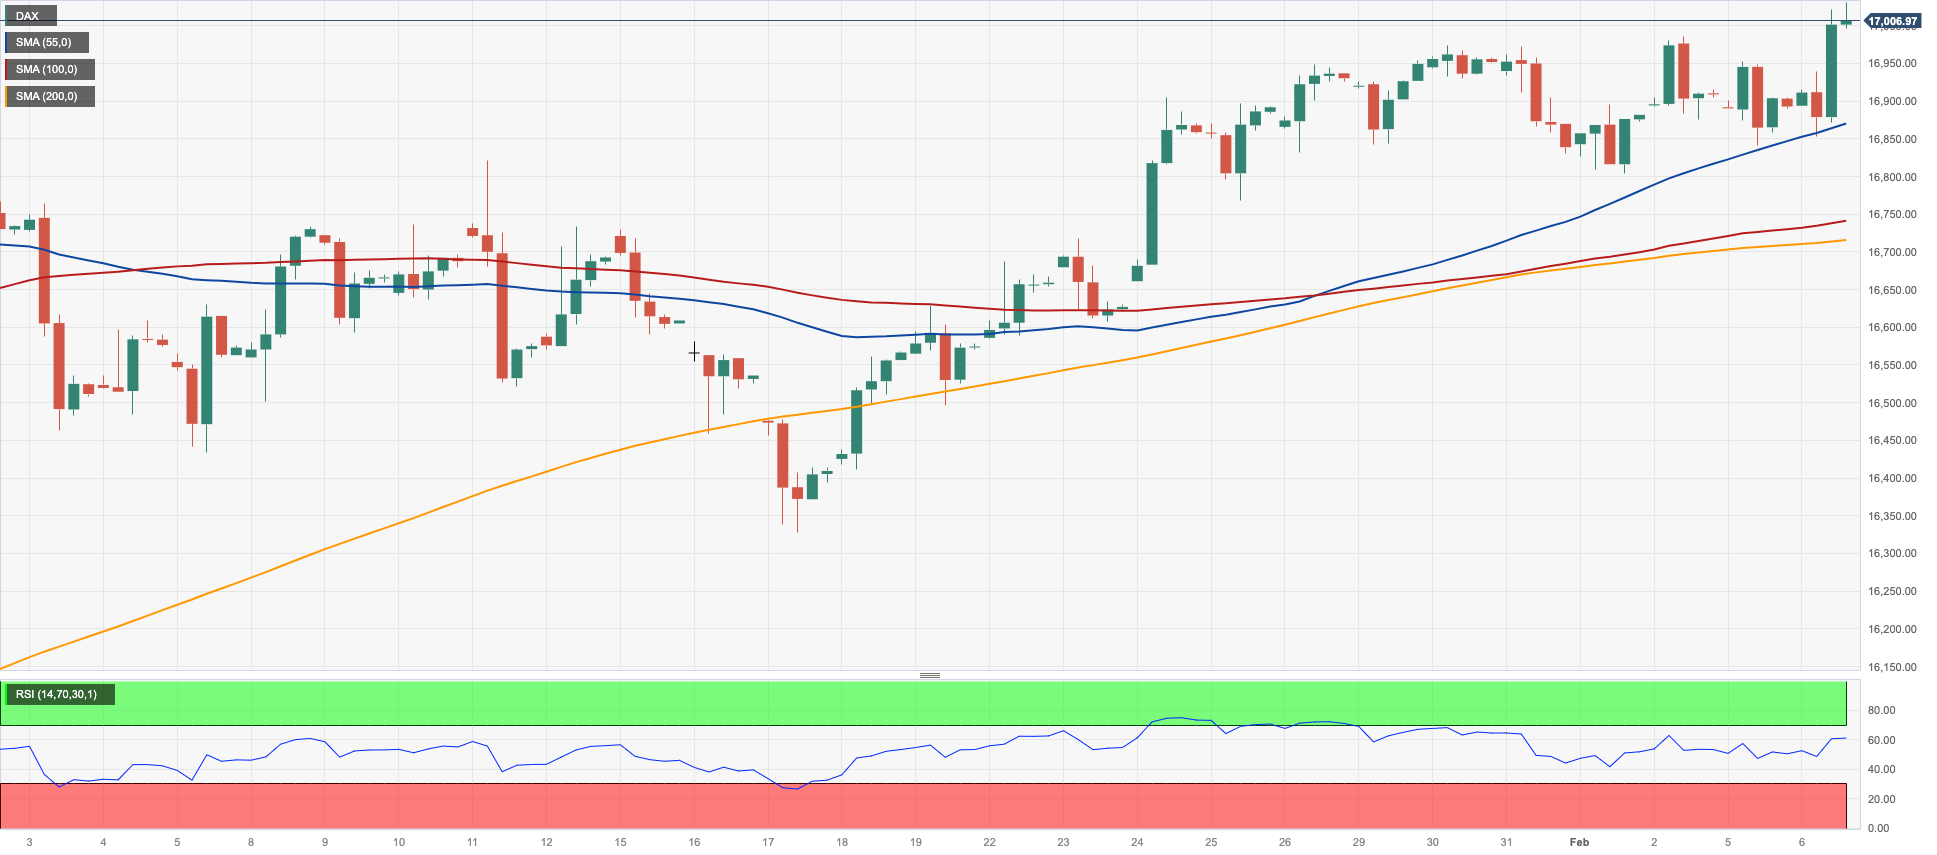
Germany’s reference DAX40 rose to a new all-time high north of the 17000 mark on Tuesday.
The constructive tone in the European markets came in response to auspicious corporate earnings reports, market chatter surrounding a potential ceasefire in the Middle East and the broad-based risk-on sentiment prevailing in the global markets.
In the fixed-income galaxy, 10-year bund yields set aside two daily advances in a row and receded to the sub-2.30% zone.
The next up-barrier for the DAX40 emerges at its all-time high of 17049 (February 6). Instead, there is immediate support at the February low of 16821 (February 1), followed by the transitory 55-day SMA at 16585 and the 2024 bottom of 16345 (January 17). Once the index clears the latter, a visit to the 200-day SMA of 15962 might be on the horizon before the weekly low of 15915 (November 28). The October 2023 low of 14630 (October 23) comes next, before the March 2023 low of 14458 (March 20). The daily RSI rose to the vicinity of 65.
Best Performers: Qiagen, Siemens Energy AG, Bayer
Worst Performers: Infineon, RWE AG ST, Dr Ing hc F Porsche Prf
Resistance levels: 17049 (4H chart)
Support levels: 16821 16345 15962 (4H chart)
GBPJPY
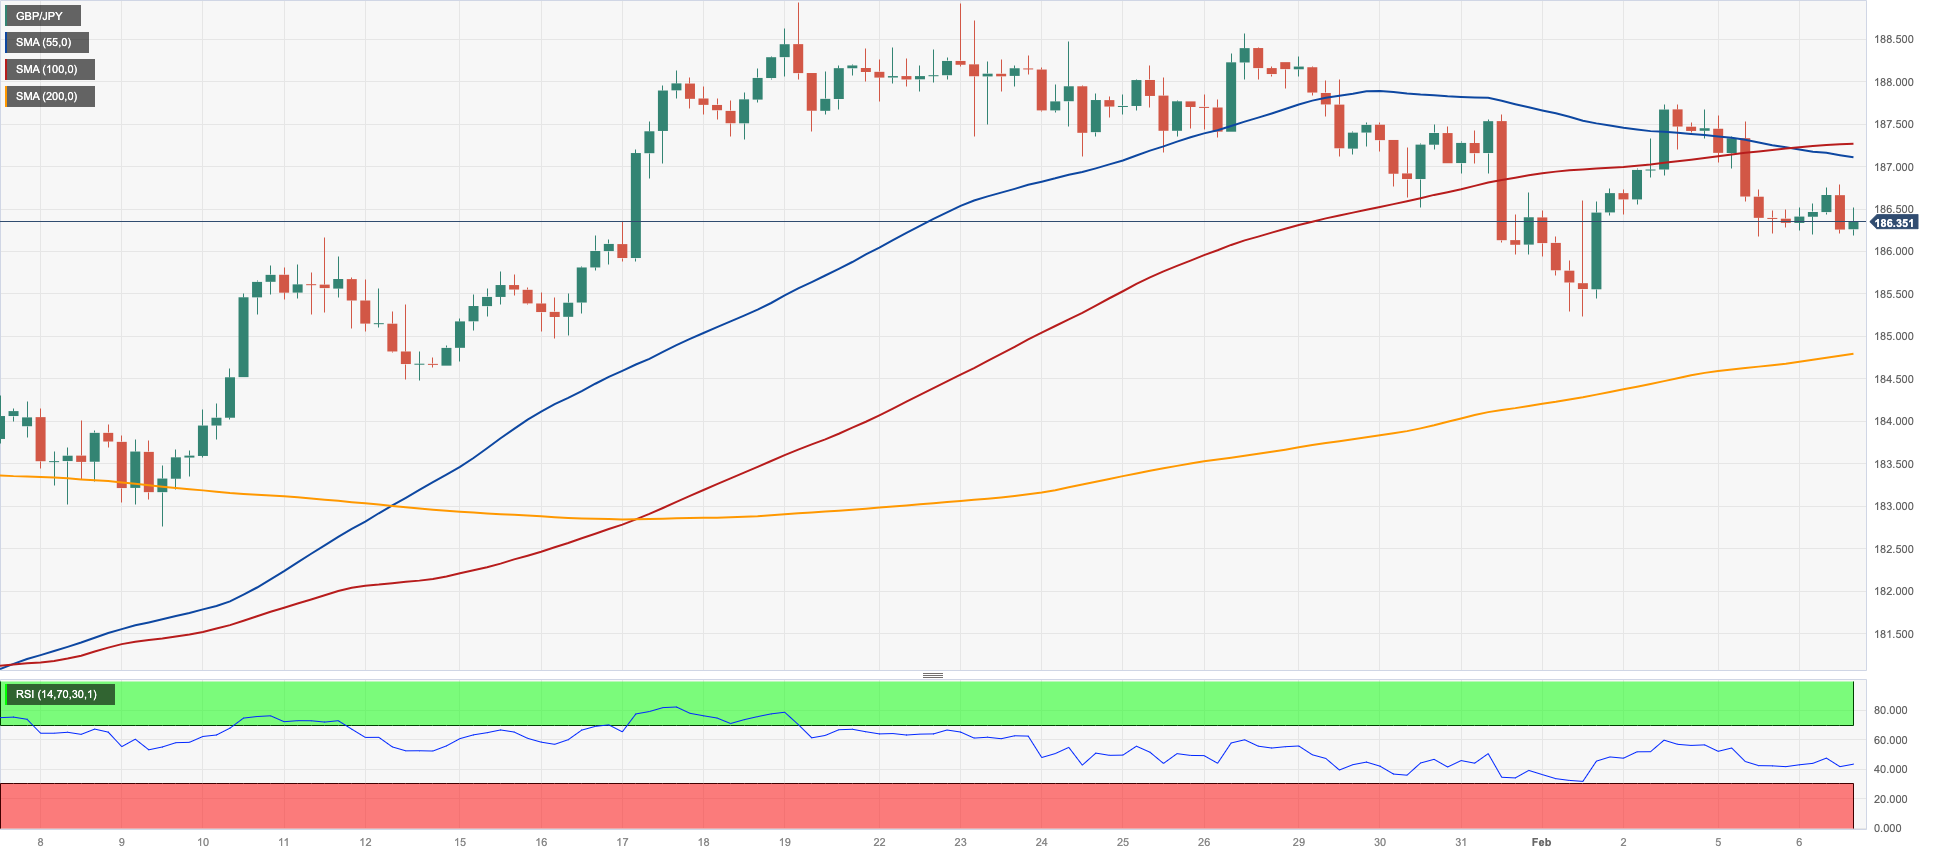
The bearish sentiment prevailed around GBP/JPY once again on Tuesday, dragging it to the lower end of the so-far weekly range near 186.20.
The constructive tone in the British pound collided with the marked appreciation of the Japanese yen, all amidst the resurgence of downside pressure around the US dollar.
Further decrease in GBP/JPY must now breach the February low of 185.22 (February 1) before challenging short-term support at the 55-day and 100-day SMAs of 184.76 and 184.03, respectively. If the cross clears this level, it may test the more significant 200-day SMA at 181.74, ahead of the December 2023 bottom of 178.33 (December 14) and the October 2023 low of 178.03 (October 3). South of here is the July 2023 low of 176.30, which precedes the May 2023 low of 167.84 (May 11). On the flip side, a gain over the 2024 top of 188.93 (January 19) would lead to a test of the round number of 190.00 before the August 2015 record of 195.28 (August 18)
Resistance levels: 187.73 188.56 188.93 (4H chart)
Support levels: 185.22 184.73 182.75 (4H chart)
NASDAQ
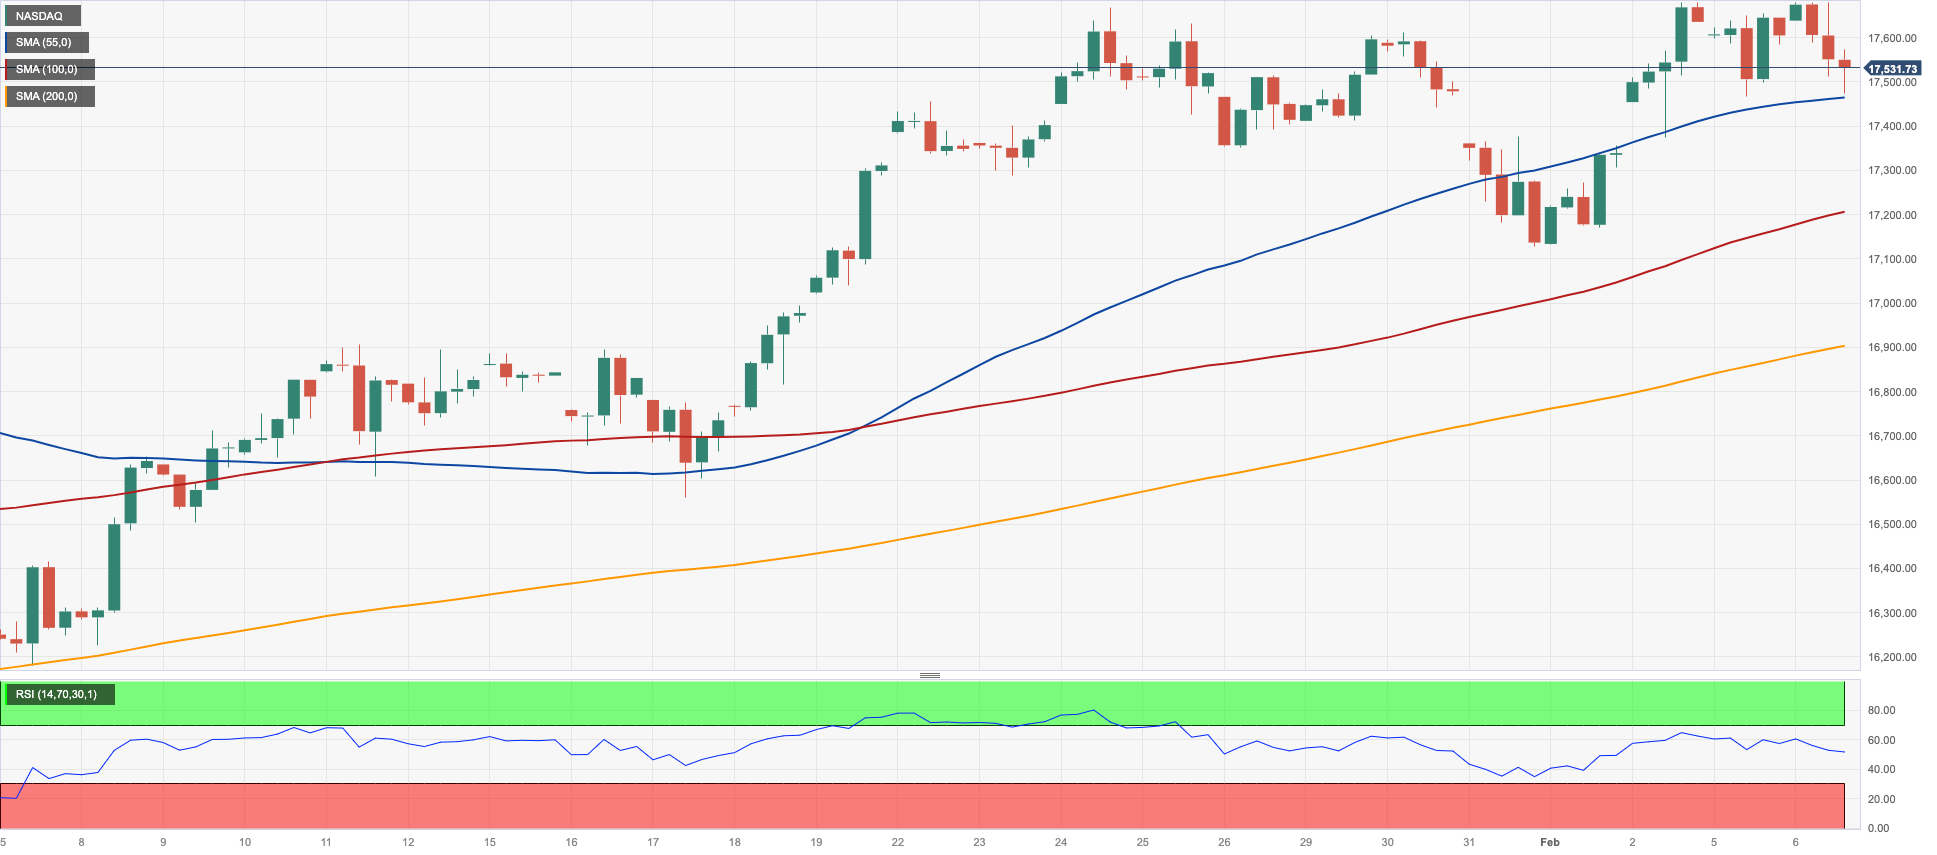
The tech sector mirrored Monday’s performance, motivating the benchmark Nasdaq 100 to flirt with two-day lows around the 17500 region on turnaround Tuesday.
This downward movement in the Nasdaq 100 was accompanied by the renewed downward trend in the dollar and the move lower in US yields across the curve, despite the persistence of the Fed’s tighter-for-longer narrative.
Additional advances should enable the Nasdaq 100 to reach its record high of 17682 (February 2). Bearish efforts, on the other hand, should target the weekly low of 17128 (January 31), which precedes the intermediate 55-day SMA at 16640 and the 2024 low of 16249 (January 5). If the index passes through this zone, it may encounter the December 2023 low of 15695 (December 4) and the key 200-day SMA of 15271. A further decline from here might result in a regression to the October 2023 bottom of 14058 (October 26) and the April 2023 low of 12724 (April 25), ahead of the March 2023 low of 11695 (March 13) and the 2023 low of 10696 (January 3). The daily RSI dropped to the 61 range.
Top Gainers: GE HealthCare, Moderna, Walgreen Boots
Top Losers: MercadoLibre, AMD, NVIDIA
Resistance levels: 17682 (4H chart)
Support levels: 17128 16561 16249 (4H chart)
DOW JONES
The US stock benchmark, the Dow Jones, reversed the negative tone seen at the beginning of the week and ended Tuesday’s session with humble gains.
This corrective upturn in the index was driven by diminishing US yields and increased selling bias in the US dollar, all against the backdrop of persistently steady speculation of a later-than-anticipated interest rate cut by the Federal Reserve.
On this, Cleveland Fed President L. Mester cautioned against the premature or hasty reduction of rates without adequate evidence indicating a sustainable and timely return of inflation to the 2% target.
All in all, the Dow Jones gained 0.05% to 38497, the S&P 500 receded 0.09% to 4938, and the tech-heavy Nasdaq Composite deflated 0.33% to 15544.
Next up for the Dow Jones is the all-time high of 38783 (February 2). Alternatively, there is immediate contention at the 2024 low of 37122 (January 18), which occurs before the weekly low of 37073 (December 20, 2023). The breakdown of the latter signals a potential challenge to the intermediate 55- and 100-day SMAs around 37071 and 35573, respectively. The 200-day SMA is immediately lower at 34897, ahead of the weekly low of 33859 (November 7, 2023), the October 2023 low of 32327 (October 27), and the 2023 low of 31429 (March 15). The daily RSI approached the 64 region.
Top Performers: Walgreen Boots, Nike, J&J
Worst Performers: Amgen, Salesforce Inc, McDonald’s
Resistance levels: 38783 (4H chart)
Support levels: 38106 37122 36021 (4H chart)
MACROECONOMIC EVENTS
All Information & Updates provided by:

All information relating to the financial markets available on this page has been prepared and issued by FXStreet (Forexstreet SL, Spain, Reg: B62498233) on the basis of publicly available information and all information believed to be reliable and does not conflict with Kuwaiti local laws, and all necessary care has been taken to before the company to ensure that the facts mentioned are correct from the source.
NCM Investment nor any of its directors or employees shall in any way be held responsible for the contents of this news, and the information contained on this page is intended only to provide clients with publicly available information and should not be construed as investment advice, report or analysis and/or constitute an offer or invitation to buy or sell financial instruments of any kind.
RISK WARNING: Forex and CFDs are highly risky leveraged products, as losses can exceed deposits. Please ensure you understand all the risks and take independent advice if necessary. NCM will segregate the clients based on the criteria of the regulator and its bylaws. NCM does not provide any advisory service; the material published does not constitute advice or a recommendation for a transaction in any financial instrument. NCM accepts no responsibility for any use of the content presented and any consequences of that use. Anyone acting on the information provided does so at their own risk.