
- Contact Us:
-

-

-

-


Daily Market Updates
08 Feb 2024
EURUSD
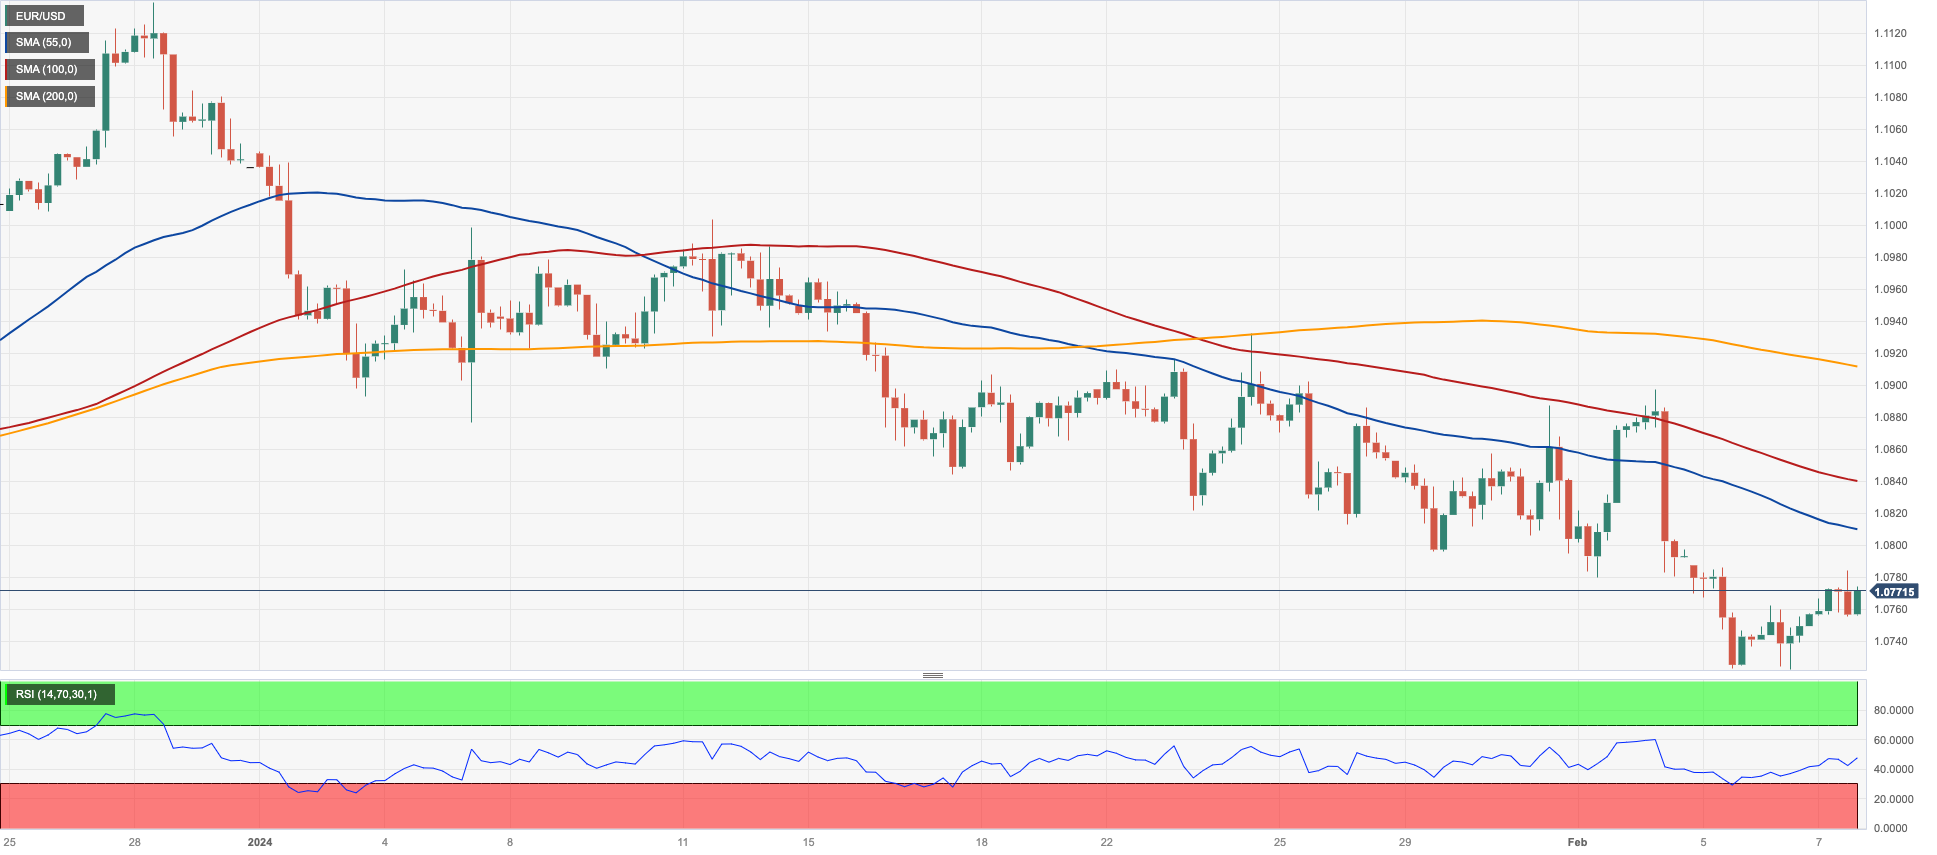
EUR/USD managed to gain some extra upside momentum and recorded a modest increase past the 1.0780 level on Wednesday, an area also coincident with the temporary 100-day SMA.
The slight rebound in the pair followed Tuesday’s gains and extended the bounce off YTD lows around 1.0720. The uptick in spot occurred amidst an inconclusive session in the greenback, which prompted the USD Index (DXY) to briefly pierce the 104.00 support against the backdrop of a slight rebound in US yields across the curve.
Regarding the broader economic landscape, speculation regarding the potential timing of interest rate cuts by the Fed continued to dominate market sentiment midweek, with investors favouring the first interest cut in May or June.
In the US docket, Mortgage Applications expanded by 3.7% in the week to February 2, while the trade deficit widened to $62.2B in December.
If sellers breach the 2024 low of 1.0722 (February 6), EUR/USD may fall further to the weekly low of 1.0495 (October 13, 2023), ahead of the 2023 low of 1.0448 (October 3) and the round level of 1.0400. In the opposite direction, the initial resistance is at the significant 200-day SMA at 1.0834, followed by the intermediate 55-day SMA at 1.0903 and the weekly high of 1.0932 (January 24). Further north, another weekly top of 1.0998 (January 5, 11) comes before the December 2023 peak of 1.1139 (December 27). This level is also supported by the 200-week SMA of 1.1148, which comes before the 2023 high of 1.1275 (July 18). The daily RSI rose to the vicinity of 38.
Resistance levels: 1.0783 1.0897 1.0912 (4H chart)
Support levels: 1.0722 1.0656 1.0516 (4H chart)
USDJPY
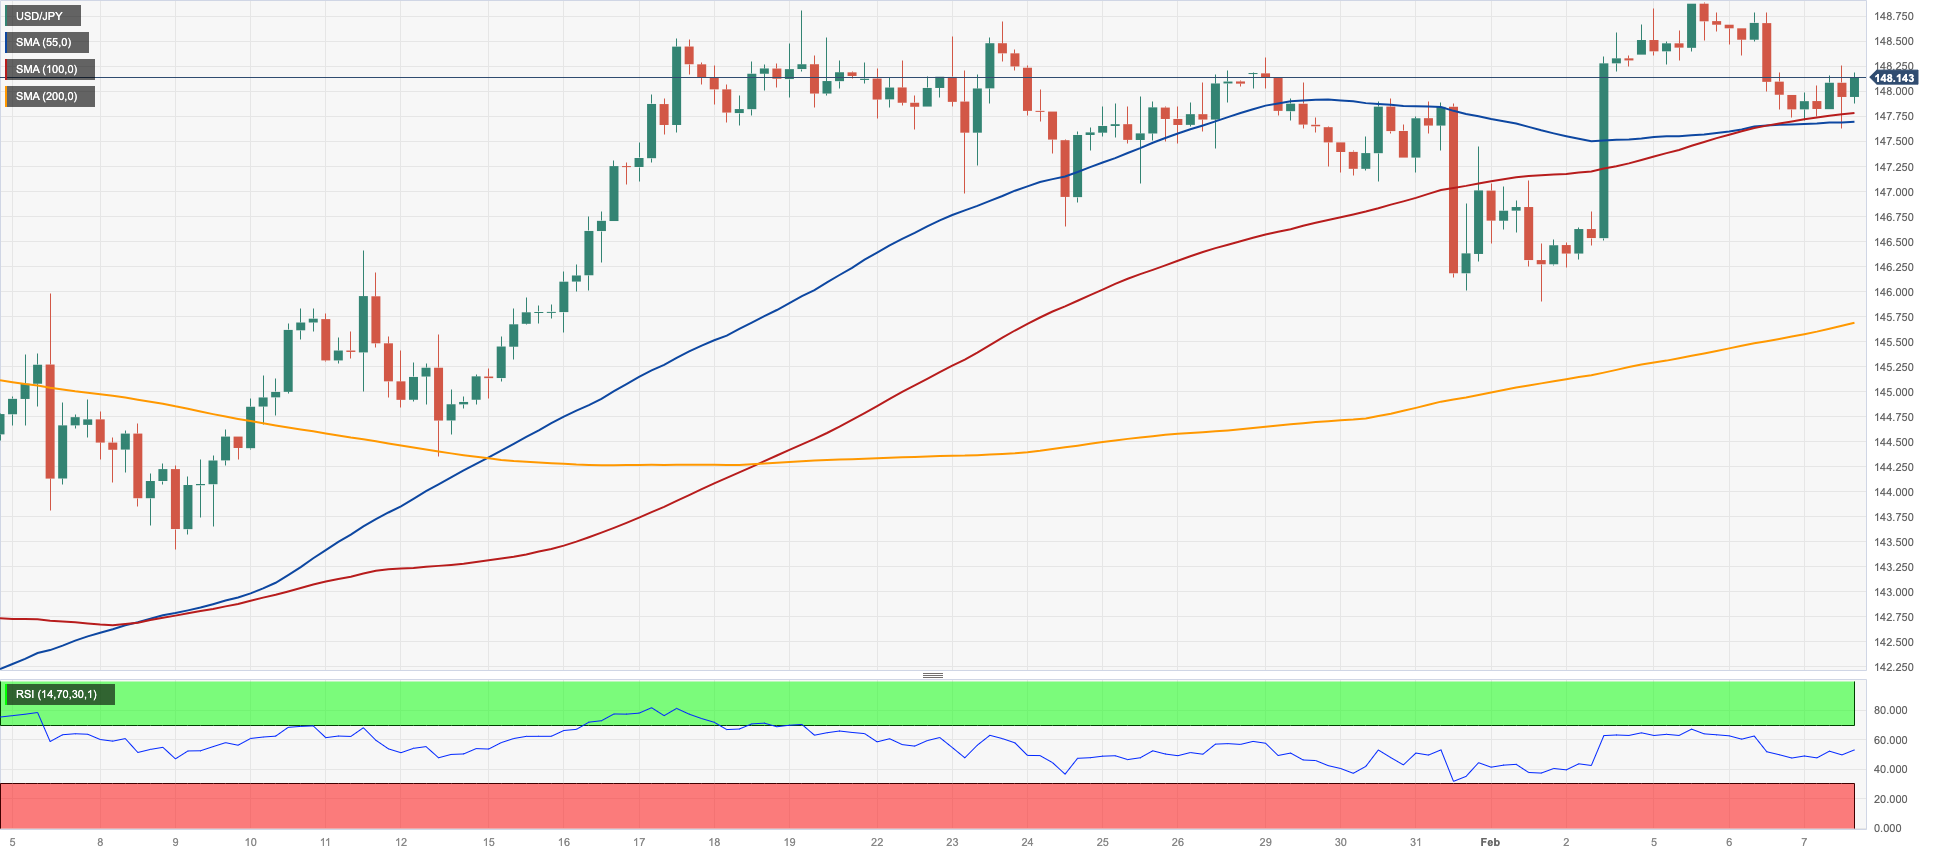
The absence of a clear direction in the US dollar, coupled with marginal developments in US yields across various timeframes, prompted USD/JPY to keep the vacillating tone just above the 148.00 hurdle on Wednesday, partially reversing the marked decline seen in the previous session.
Meanwhile, expectations of an interest rate cut by the Fed kept favouring that move at the May 1 gathering, while there are no further signals of a potential lift-off by the BoJ, at least in the next couple of months.
In the Japanese bond market, JGB 10-year yields saw a slight drop after two small daily advances.
The Japanese calendar was empty on Wednesday.
If the rally accelerates, USD/JPY might revisit the 2024 high of 148.89 (February 5), followed by the main obstacle of 150.00 and the 2023 top of 151.90 (November 13). Further north, the 2022 peak of 151.94 (October 21) comes right before the round number of 152.00. In contrast, immediate contention is at the so-far February low of 145.89 (February 1), which is supported by the preliminary 55-day SMA of 145.76. Down from here comes the critical 200-day SMA of 144.77, ahead of the December 2023 bottom of 140.24 (December 28), and the round number of 140.00, all before the July low of 137.23 (July 14). The day-to-day RSI looked stable below 58.
Resistance levels: 148.89 149.67 151.43 (4H chart)
Support levels: 147.63 145.89 145.64 (4H chart)
GBPUSD
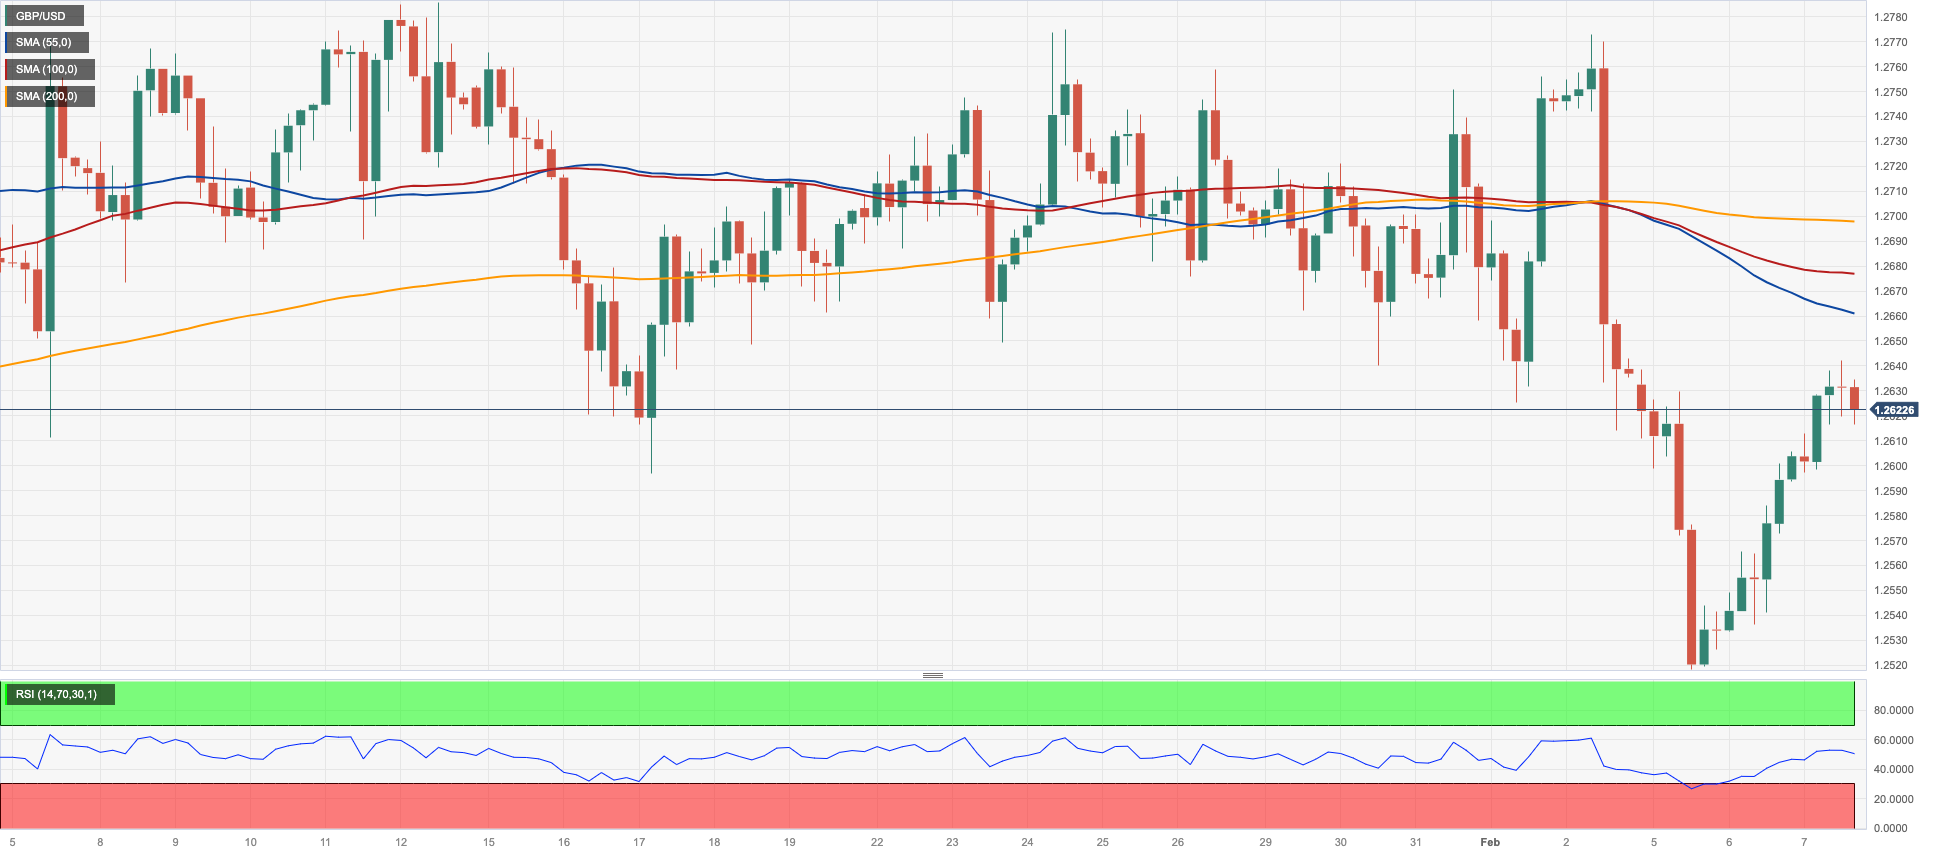
The British pound kept the optimism intact on Wednesday, pushing GBP/USD further beyond the crucial 200-day SMA (1.2561) and revisiting the 1.2640 zone, or three-day highs.
Cable’s price action, in the meantime, continued to trim recent steep losses to the 2024 low near 1.2520 (February 5), reversing course and gathering extra upward traction, primarily due to the lack of direction in the dollar.
This daily rebound in the currency pair occurred in tandem with a rebound in UK 10-year gilt yields, which poked above the 4.00% hurdle.
There were no data releases across the Channel on Wednesday.
The break of the 2024 low of 1.2518 (February 5), discloses the December 2023 low of 1.2500 (December 13). Extra weakness may force GBP/USD to seek the weekly low of 1.2187 (November 10, 2023), before reaching the October 2023 low of 1.2037 (October 3), the critical 1.2000 mark, and the 2023 bottom of 1.1802 (November 10, 2023). On the upside, initial resistance is at the transitory 55-day SMA at 1.2664 seconded by the 2024 peak of 1.2785 (January 12). Further up aligns the December high of 1.2827 (December 28), and finally the weekly top of 1.2995 (July 27, 2023), which is just shy of the critical 1.3000 level. The daily RSI rose over the 46 yardstick.
Resistance levels: 1.2641 1.2693 1.2772 (4H chart)
Support levels: 1.2518 1.2500 1.2448 (4H chart)
GOLD
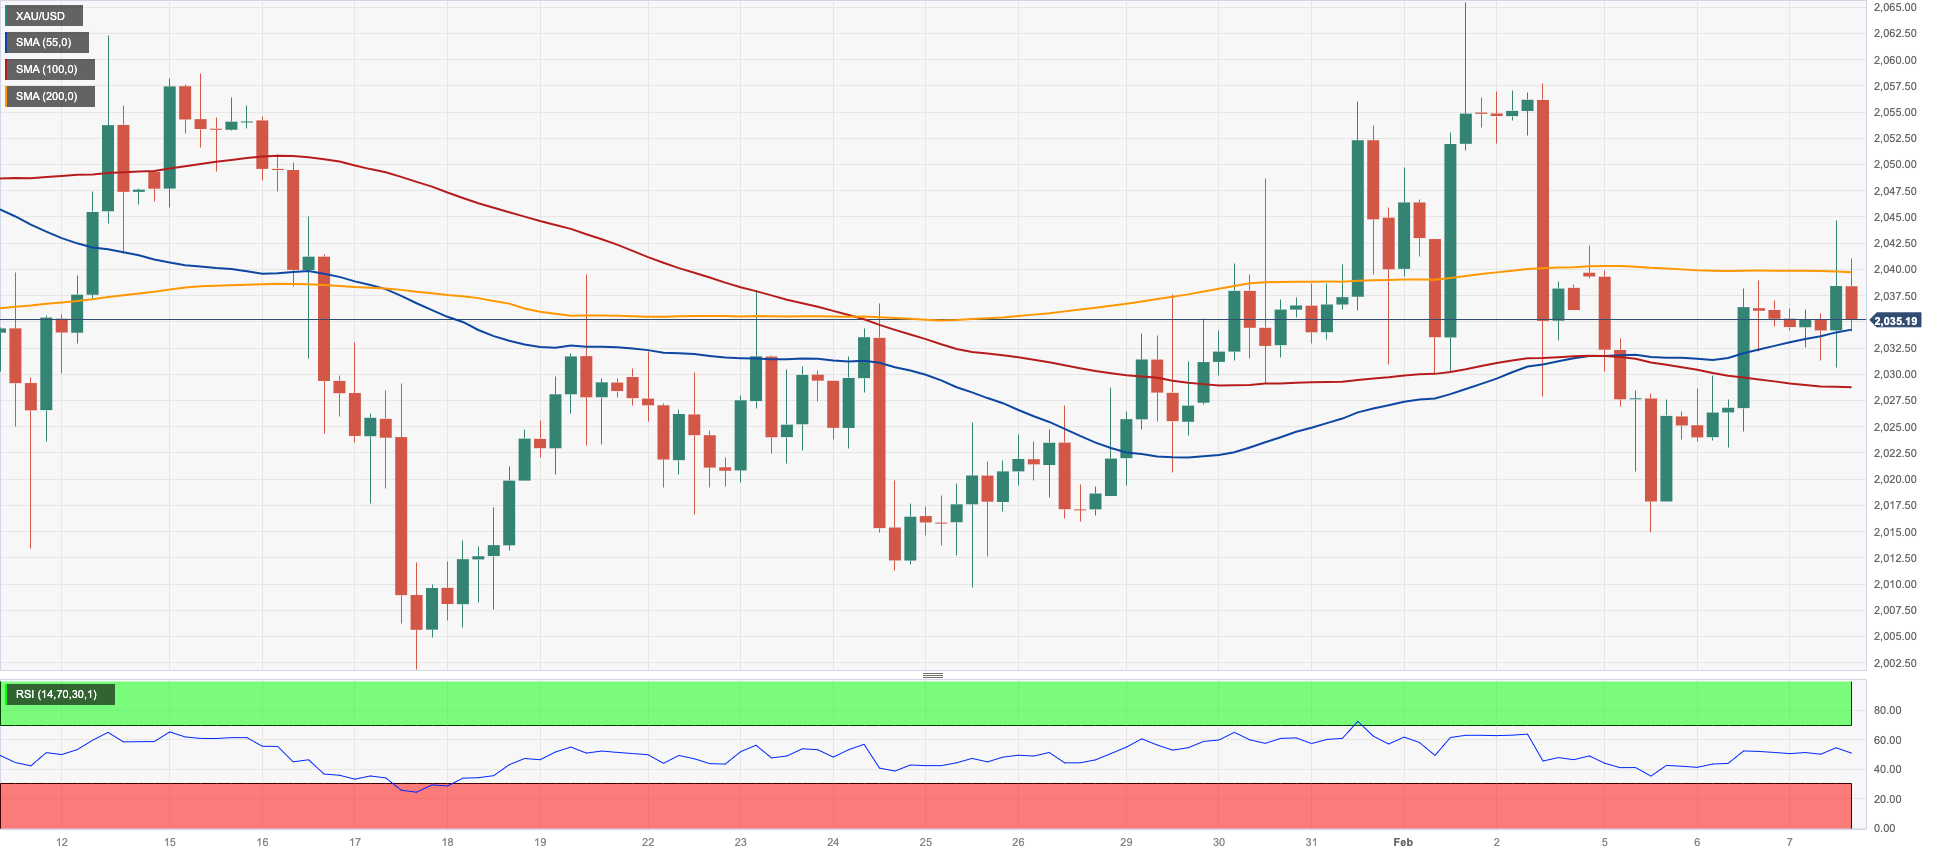
Gold prices traded in an irresolute fashion following Tuesday’s decent recovery, ending the session around in the $2030/40 band per troy ounce on Wednesday.
The precious metal's daily mood circled around the equally directionless note in the dollar and US yields across the curve, all amidst omnipresent geopolitical concerns as well as steady prospects of the Fed’s easing in May or June.
Further losses may drive gold to revisit its 2024 low of $2001 (January 17), ahead of the December 2023 low of $1973, which is supported by the 200-day SMA at $1965. A deeper drop might bring the November 2023 bottom of $1931 back into focus, ahead of the October 2023 low of $1810, then the 2023 low of $1804 and the $1800 contention zone. Just the opposite, bullish attempts may push the metal to retest the weekly high of $2088 (December 28), which precedes the all-time top of $2150 (December 4, 2023).
Resistance levels: $2044 $2065 $2078 (4H chart)
Support levels: $2014 $2009 $2001 (4H chart)
CRUDE WTI
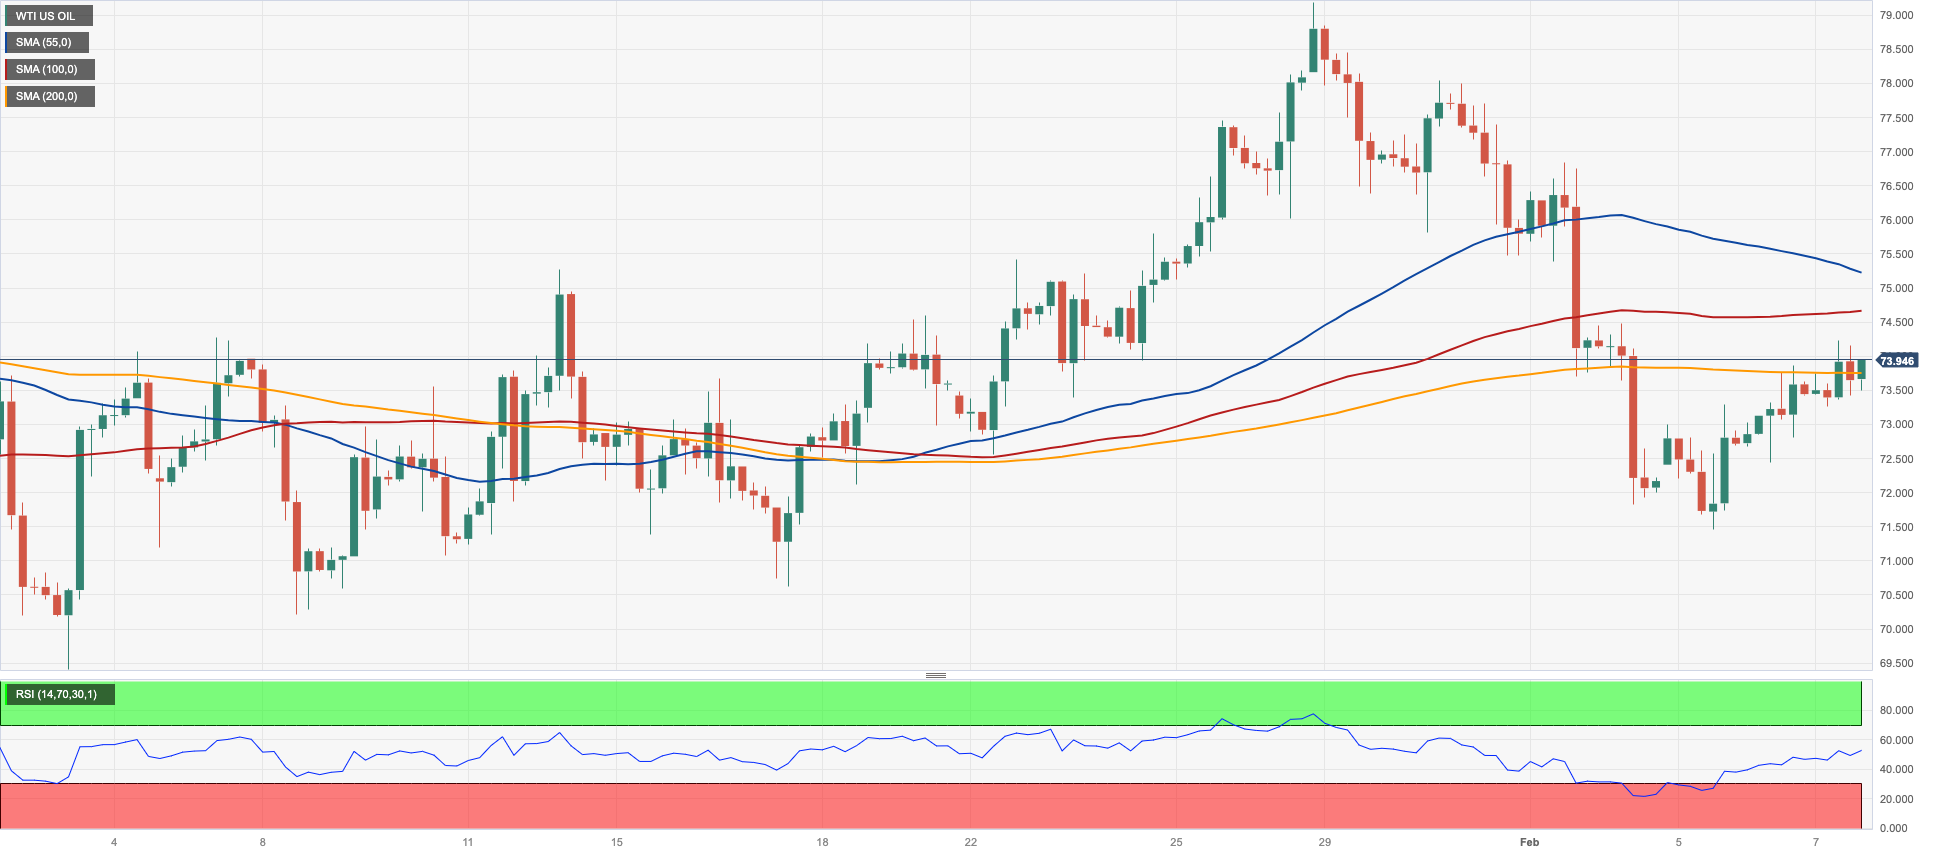
WTI prices built on recent gains and surpassed the $74.00 mark per barrel on Wednesday.
The uptick in crude oil was mainly driven by the larger-than-estimated weekly drop in gasoline inventories and distillate stocks, according to the EIA’s report.
On the latter, the agency reported that US crude oil inventories increased by 5.520M barrels in the week to February 2, while supplies at Cushing dropped by 0.033M barrels, Weekly Distillate Stocks went down by 3.221M barrels, and gasoline stockpiles decreased more than expected by 3.146M barrels.
Still around the agency, traders kept the constructive tone and maintained their assessment after the EIA revised its projection for the growth of domestic oil production in 2024 on Tuesday. The revised forecast indicates a significant decrease compared to the growth seen last year, with the prediction that production levels will not reach the record highs seen in December 2023 until February 2025.
On another front, the IEA stated on Wednesday that India is projected to become the primary catalyst for global oil demand growth from 2023 to 2030. This forecast suggests that India will narrowly surpass China, the current leading importer, in driving the increase in oil demand during this period.
Also adding to the commodity’s daily gains emerged the geopolitical factor as well as the absence of upside traction in the greenback.
The loss of the February low of $71.43 (February 5) might bring the critical $70.00 barrier back into focus, followed by the 2024 bottom of $69.31 (January 3). The breach of the latter might reveal the December 2023 low of $67.74 (December 13), before the June 2023 bottom of $66.85. (June 12). The other way around, the next upward target for WTI is the critical 200-day SMA at $77.36, prior to the 2024 top of $79.25 (January 29), which is immediately followed by the essential $80.00 barrier and comes before the November 2023 peak of $80.15 (November 3). Extra upside from here may push the market back to its weekly high of $89.83 (October 18, 2023), followed by the 2023 top of $94.99 (September 28, 2023) and the August 2022 peak of $97.65 (August 30), all preceding the psychological $100.00 barrier.
Resistance levels: $74.17 $76.91 $78.11 (4H chart)
Support levels: $71.37 $70.59 $69.25 (4H chart)
GER40
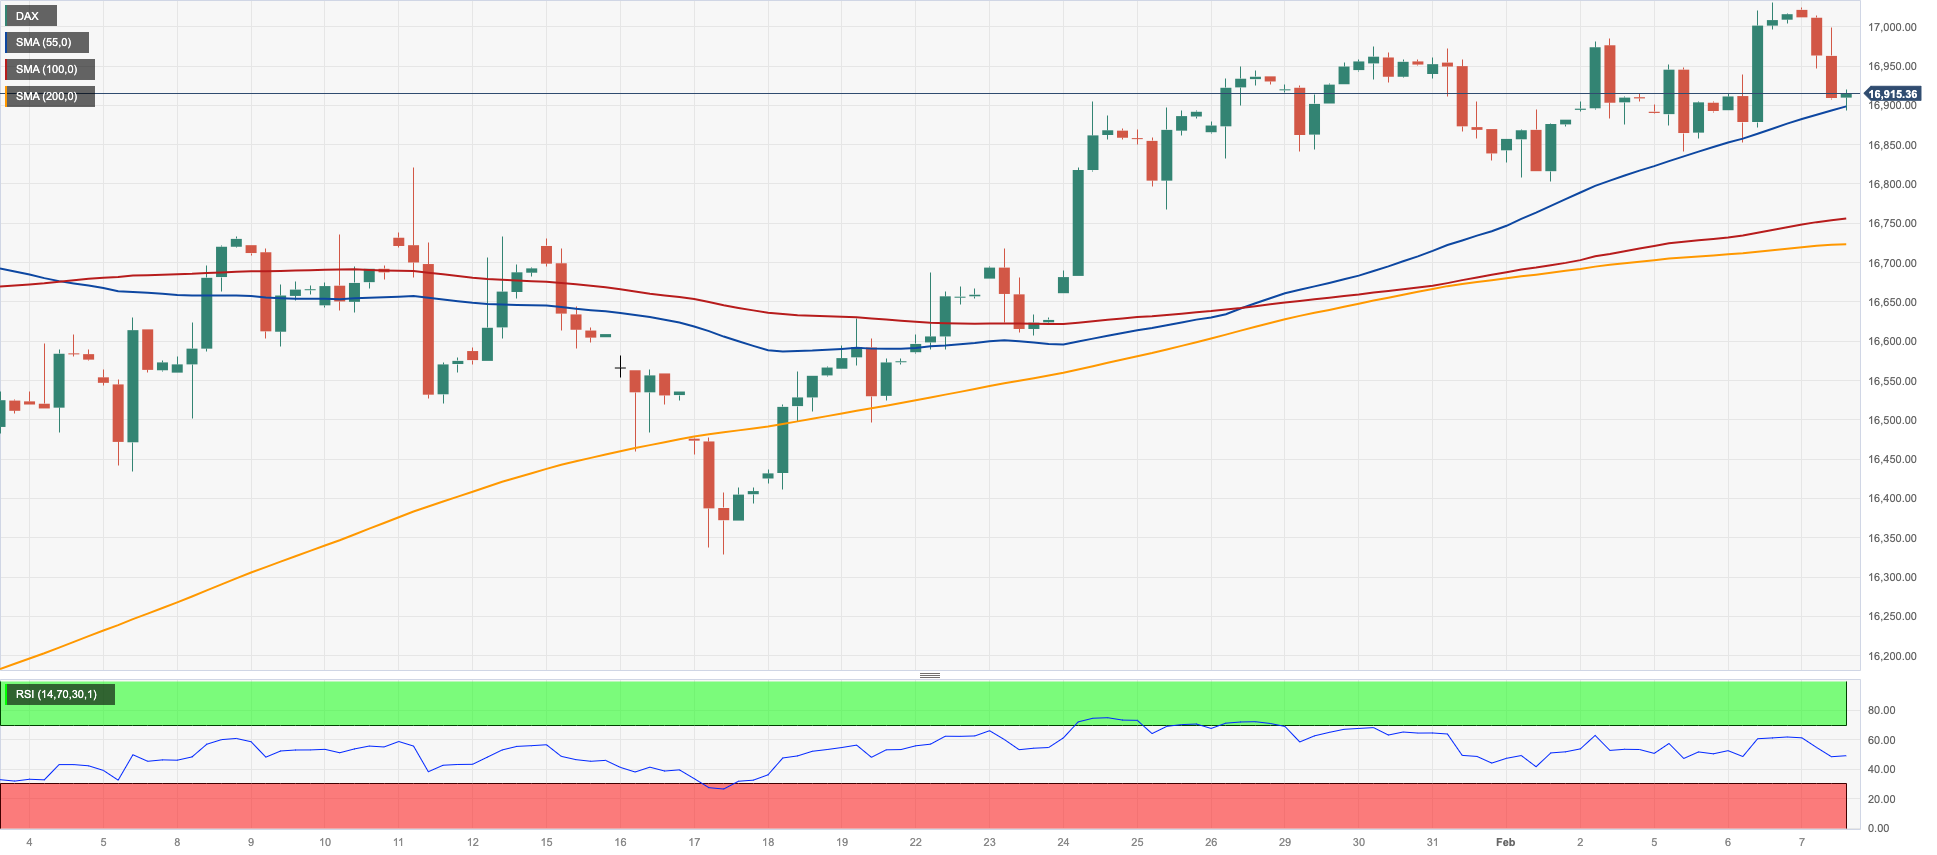
The German DAX40 dropped markedly and returned to the sub-17000 region on Wednesday.
The positive atmosphere in the risk complex failed to lend further support to European markets due to the drag from declining banking shares and additional losses from energy giants.
Adding to the sour sentiment around German equities, Industrial Production in the country contracted for the seventh month in a row in December, this time by 1.6%, which further underpinned the gloomy prospects for that economy in the current year.
In the realm of fixed-income securities, 10-year bund yields reversed Tuesday’s pullback and rose past the 2.30% mark.
The next upward hurdle for the DAX40 appears at its all-time high of 17049. (February 6). Instead, there is immediate support at the February low of 16821 (February 1), followed by the transitory 55-day SMA at 16603 and the 2024 bottom at 16345 (January 17). Once the index clears the latter, a visit to the 200-day SMA of 15967 is possible before the weekly low of 15915 (November 28). The October 2023 low of 14630 (October 23) follows next, before the March 2023 low of 14458. (March 20). The daily RSI dropped below 58.
Best Performers: Sartorius AG VZO, Hannover Rueck SE, BMW ST
Worst Performers: Deutsche Bank AG, Deutsche Post, Infineon
Resistance levels: 17049 (4H chart)
Support levels: 16821 16380 16345 (4H chart)
GBPJPY
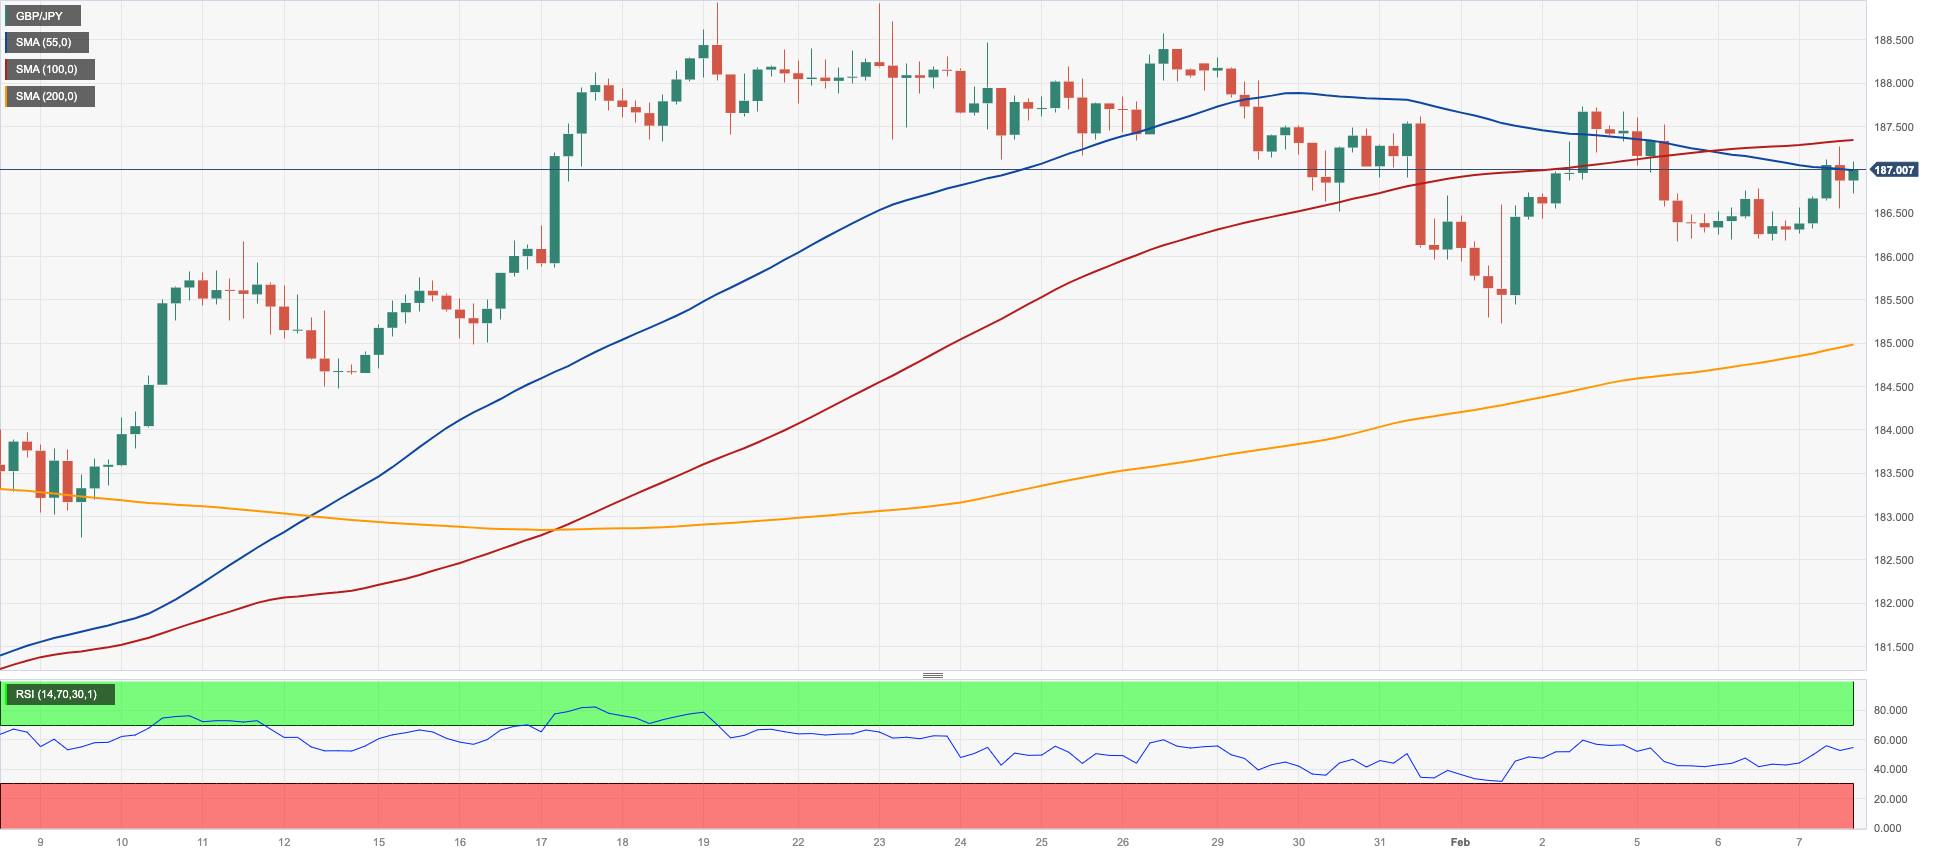
Finally, GBP/JPY managed to gather some buying interest, advancing to two-day tops near 187.30 on Wednesday after two straight sessions of losses.
The positive momentum in the British pound added to the slight depreciation of the Japanese currency, all against the backdrop of a broad-based risk-on mood and the modest bearish tone in the greenback.
A further drop in GBP/JPY must now break the February low of 185.22 (February 1) before attacking short-term support at the 55-day and 100-day SMAs of 184.79 and 184.08, respectively. If the cross clears this level, it might confront the more critical 200-day SMA at 181.82, ahead of the December 2023 bottom of 178.33 (December 14) and the October 2023 low of 178.03 (October 3). The loss of this region could spark a potential test of the July 2023 low of 176.30, which precedes the May 2023 low of 167.84 (May 11). On the other hand, a rise over the 2024 top of 188.93 (January 19) would lead to a test of the round number of 190.00 before the August 2015 record of 195.28 (August 18)
Resistance levels: 187.73 188.56 188.93 (4H chart)
Support levels: 185.22 184.47 182.75 (4H chart)
NASDAQ
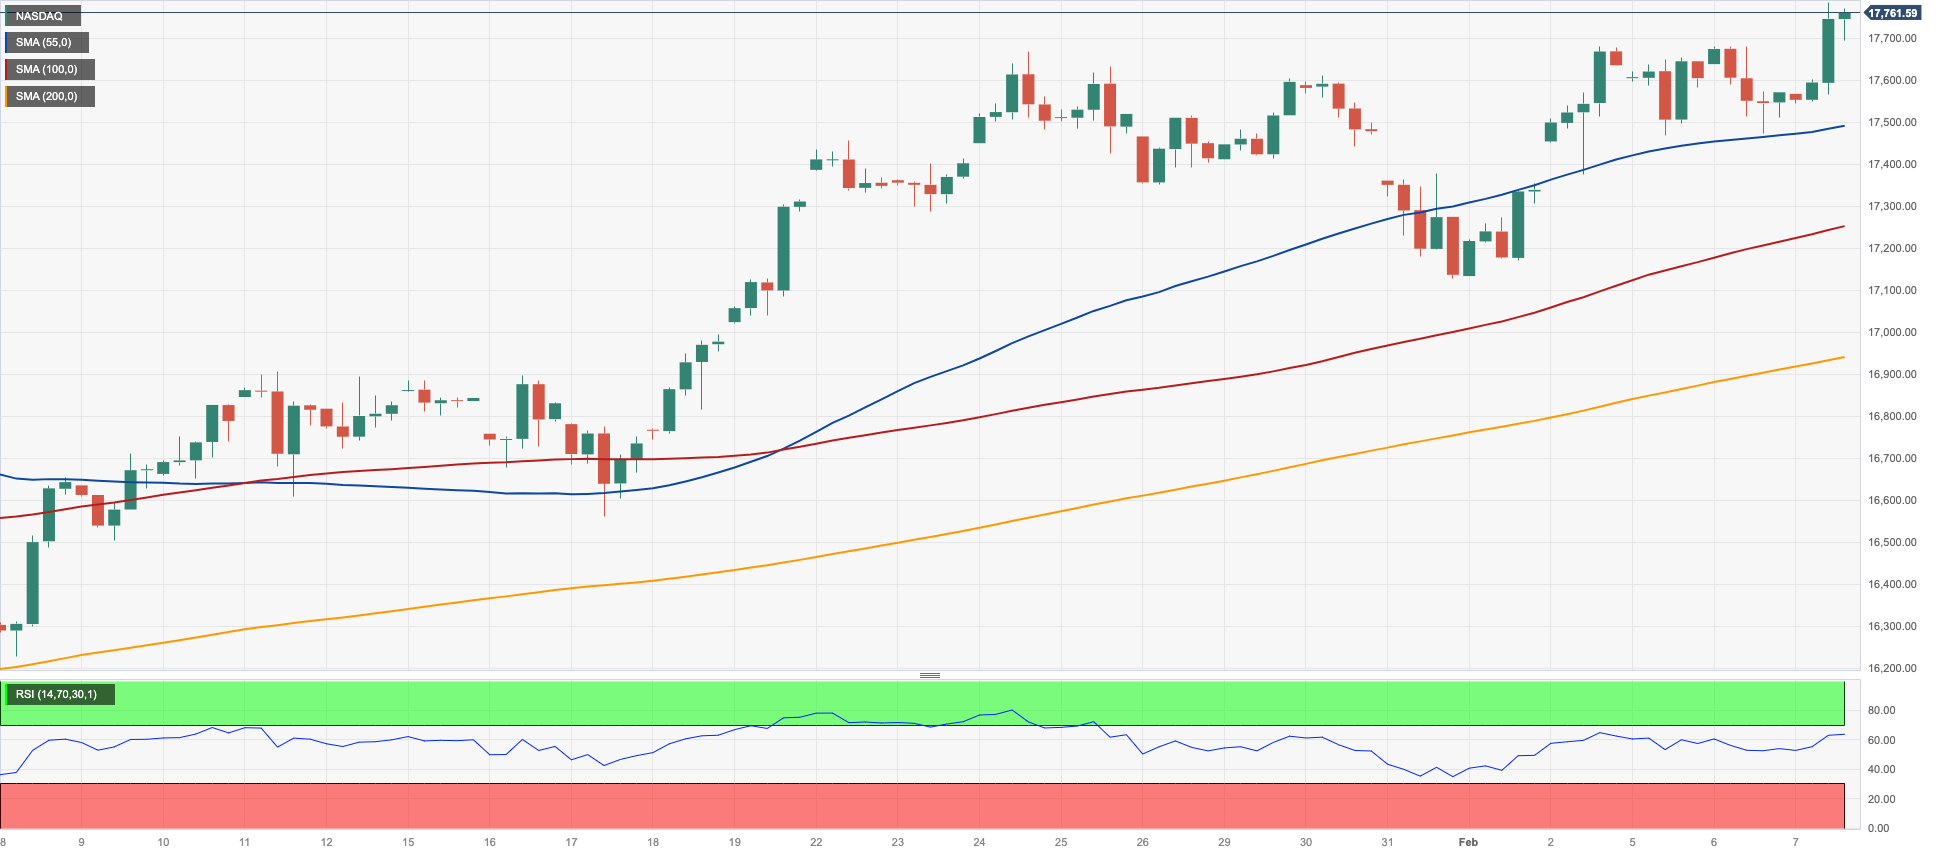
In line with its US peers, the Nasdaq 100 added to Tuesday’s gains and rose to a new all-time peak near the 17800 level on Wednesday.
The generalized upbeat mood among investors in combination with the prevailing appetite for risk-linked assets lent extra legs to the US tech sector, while the marginal moves in both the greenback and US yields also contributed to the continuation of the constructive bias in the key index.
Additional rises should allow the Nasdaq 100 to challenge its record high of 17784 (February 7). Bearish attempts, on the other hand, should target the weekly low of 17128 (January 31), which precedes the intermediate 55-day SMA of 16676 and the 2024 low of 16249 (January 5). If the index moves through this zone, it may come across the December 2023 low of 15695 (December 4) and the critical 200-day SMA of 15296. A further drop from here may result in a regression to the October 2023 bottom of 14058 (October 26) and the April 2023 low of 12724 (April 25), ahead of the March 2023 low of 11695 (March 13) and the 2023 low of 10696 (January 3). The day-to-day RSI rose past 67.
Top Gainers: Palo Alto Networks, CrowdStrike Holdings, Zscaler
Top Losers: Amgen, Gilead, Warner Bros Discovery
Resistance levels: 17784 (4H chart)
Support levels: 17128 16740 16249 (4H chart)
DOW JONES
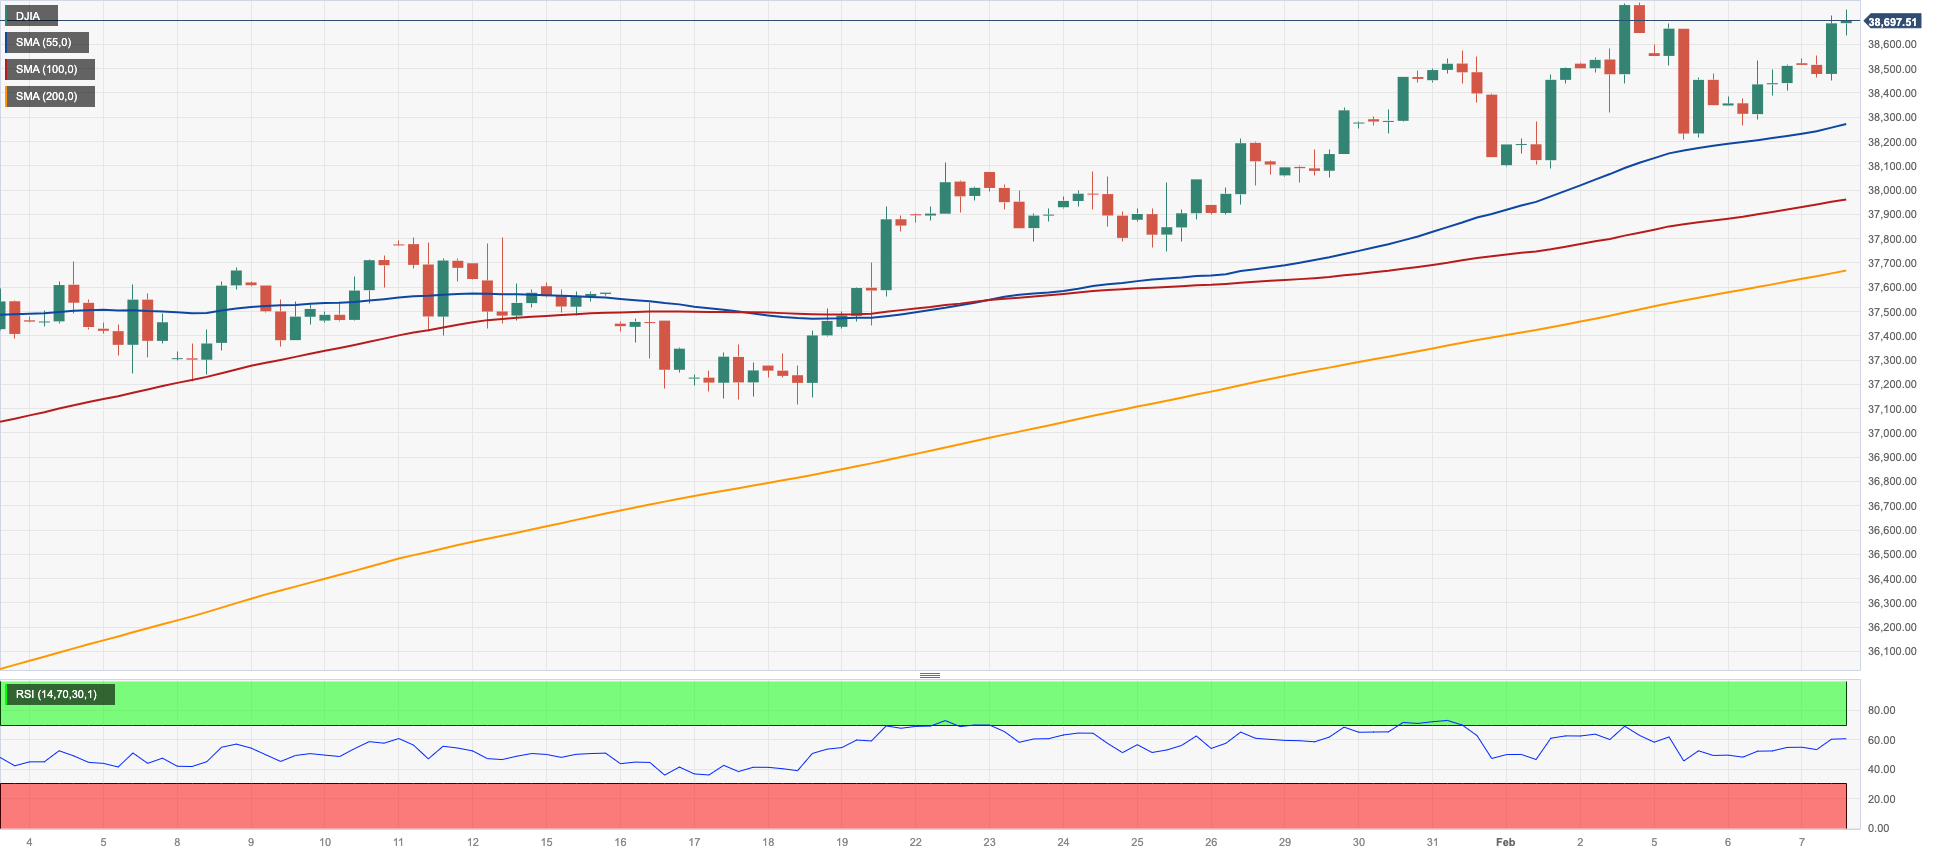
US equities measured by the Dow Jones added to Tuesday’s advance and traded at shouting distance from the recently recorded all-time high on Wednesday.
Extra gains in the index followed auspicious corporate earnings results and marginal moves in the dollar and US yields across the curve, all amidst steady expectations of a Fed’s rate cut in H1 2024.
On this, Fed Chair Jerome Powell dismissed the possibility of a March interest rate cut, and traders are now eagerly anticipating new signals from central bankers regarding the timing of potential policy adjustments (May or June).
Minneapolis Fed President Neel Kashkari indicated on Wednesday his current expectation of two to three rate cuts this year, whereas Fed Governor Adriana Kugler emphasized the necessity for further assurances before considering a rate reduction.
On Wednesday, the Dow Jones rose 0.47% to 38701, the S&P 500 advanced 0.86% to 4996, and the tech-focused Nasdaq Composite gained 0.98% to 15762.
The Dow Jones is set to reach its all-time high of 38783 (February 2). Having said that, there is immediate dispute at the 2024 low of 37122 (January 18), which comes before the weekly low of 37073. (December 20, 2023). The latter's collapse indicates a likely challenge to the intermediate 100-day SMA at 35611 prior to the 200-day SMA at 34921. The breakdown of this region could put the weekly low of 33859 (November 7, 2023) back on the radar ahead of the October 2023 low of 32327 (October 27), and the 2023 low of 31429 (March 15). The daily RSI approached 67.
Top Performers: Home Depot, Microsoft, Boeing
Worst Performers: Amgen, Verizon, Walgreen Boots
Resistance levels: 38783 (4H chart)
Support levels: 38106 37122 36021 (4H chart)
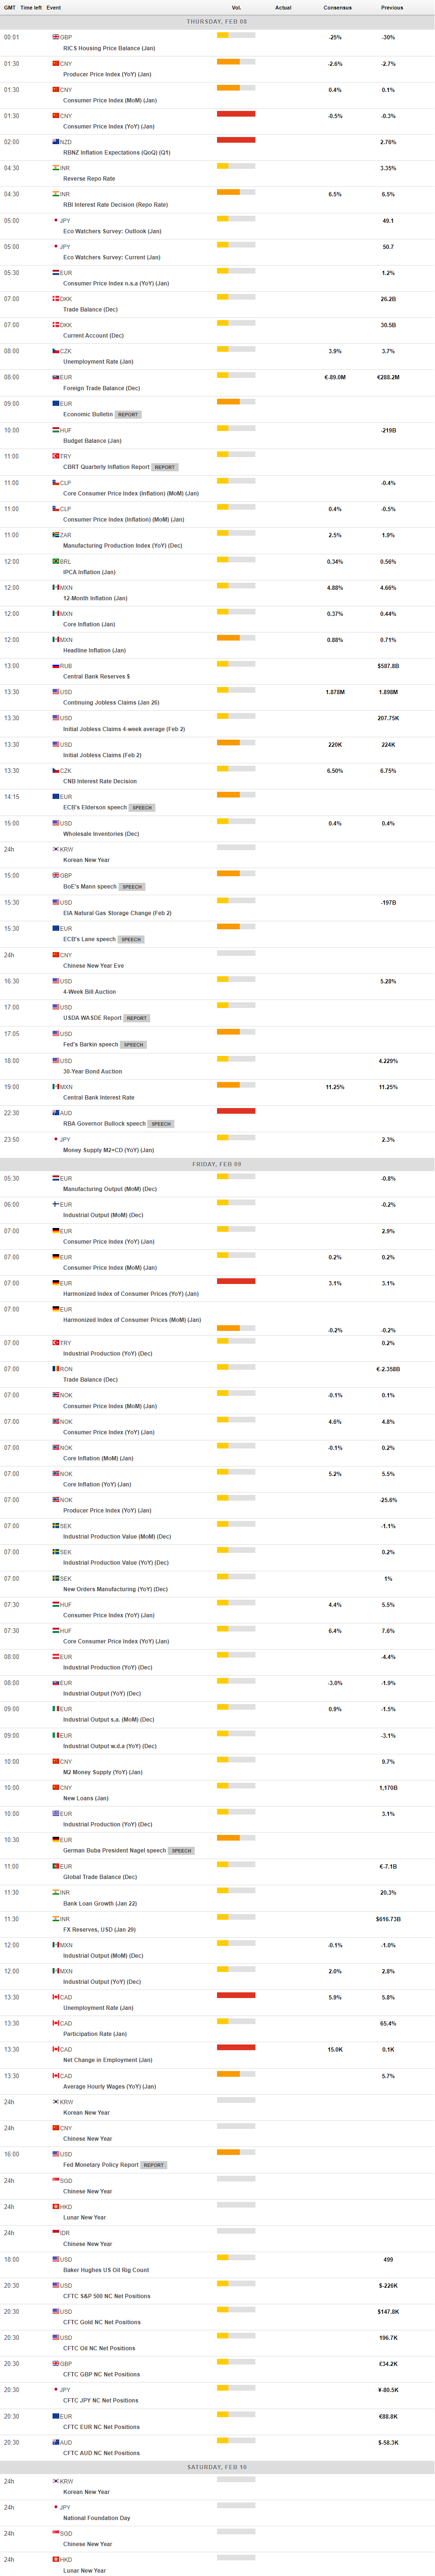
MACROECONOMIC EVENTS
All Information & Updates provided by:

All information relating to the financial markets available on this page has been prepared and issued by FXStreet (Forexstreet SL, Spain, Reg: B62498233) on the basis of publicly available information and all information believed to be reliable and does not conflict with Kuwaiti local laws, and all necessary care has been taken to before the company to ensure that the facts mentioned are correct from the source.
NCM Investment nor any of its directors or employees shall in any way be held responsible for the contents of this news, and the information contained on this page is intended only to provide clients with publicly available information and should not be construed as investment advice, report or analysis and/or constitute an offer or invitation to buy or sell financial instruments of any kind.
RISK WARNING: Forex and CFDs are highly risky leveraged products, as losses can exceed deposits. Please ensure you understand all the risks and take independent advice if necessary. NCM will segregate the clients based on the criteria of the regulator and its bylaws. NCM does not provide any advisory service; the material published does not constitute advice or a recommendation for a transaction in any financial instrument. NCM accepts no responsibility for any use of the content presented and any consequences of that use. Anyone acting on the information provided does so at their own risk.