
- Contact Us:
-

-

-

-


Daily Market Updates
12 Feb 2024
EURUSD
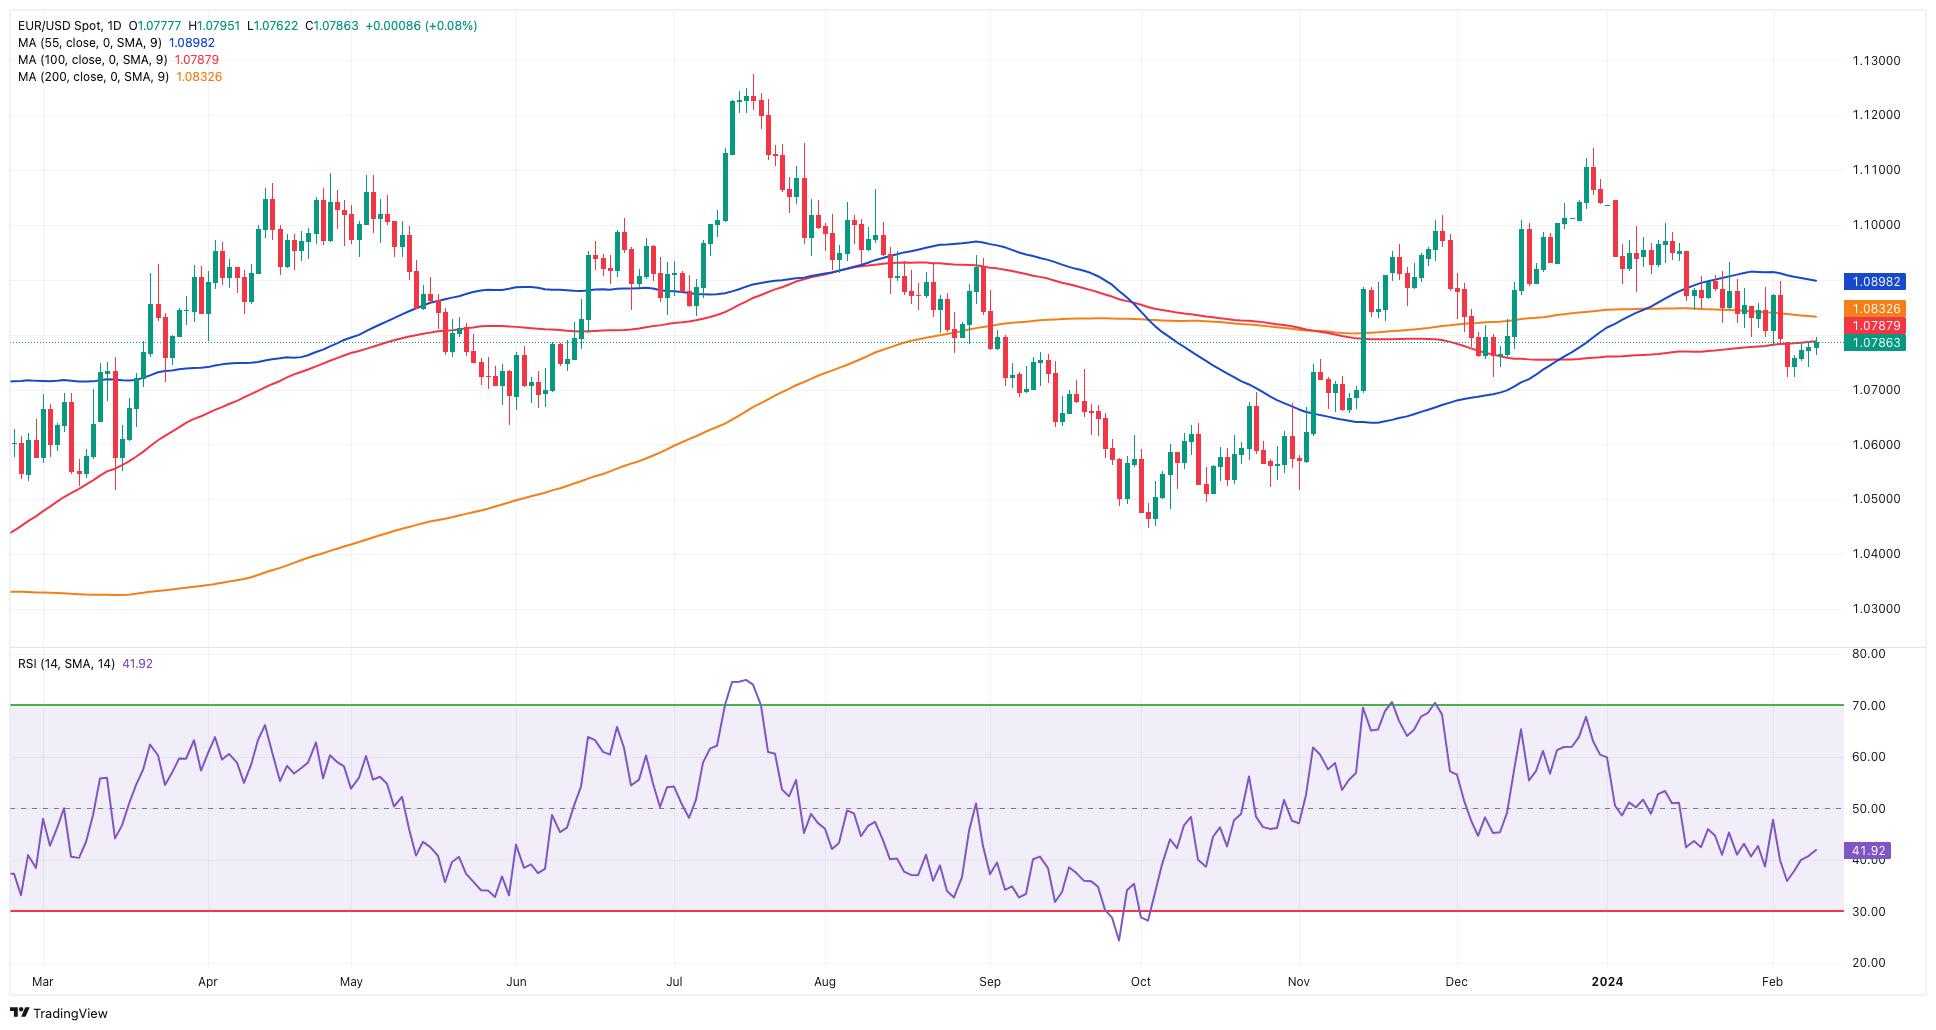
EUR/USD managed to clinch four consecutive daily advances for the first time since early December on Friday.
Indeed, the erratic performance in the greenback allowed spot and the risk complex in general to regain some composure following Monday’s Powell-led sharp bounce in the USD Index (DXY), which climbed to new yearly tops past 104.00 the figure.
The daily uptick in spot came amidst extra gains in US yields across different time frames, always against the backdrop of further investors’ repricing of a potential interest rate cut by the Fed at the May 1 event.
Regarding the ECB, market participants see less than a 50% probability of a rate reduction at the April gathering, in line with many officials’ views that the bank is in no rush to start trimming its policy rates.
On the domestic docket, final inflation figures in Germany saw the CPI rise 2.9% in the year to January and 0.2% from a month earlier.
In the US, the Department of Labor (DoL) revised the December CPI and saw a monthly gain of 0.2% and 0.3% when it came to the core reading.
The immediate target of the ongoing EUR/USD’s recovery is the significant 200-day SMA at 1.0832, seconded by the intermediate 55-day SMA at 1.0898 and the weekly high of 1.0932 (January 24). Further north, another weekly top of 1.0998 (January 5, 11) occurs just before the 1.1000 threshold and the December 2023 peak of 1.1139 (December 27). This level is also supported by the 200-week SMA at 1.1148, which comes before the 2023 top of 1.1275 (July 18). In the opposite direction, if sellers breach the 2024 low of 1.0722 (February 6), spot may go even further to the weekly low of 1.0495 (October 13, 2023), ahead of the 2023 low of 1.0448 (October 3) and the round level of 1.0400. The daily RSI increased to approximately 41.
Resistance levels: 1.0794 1.0897 1.0912 (4H chart)
Support levels: 1.0722 1.0656 1.0516 (4H chart)
USDJPY
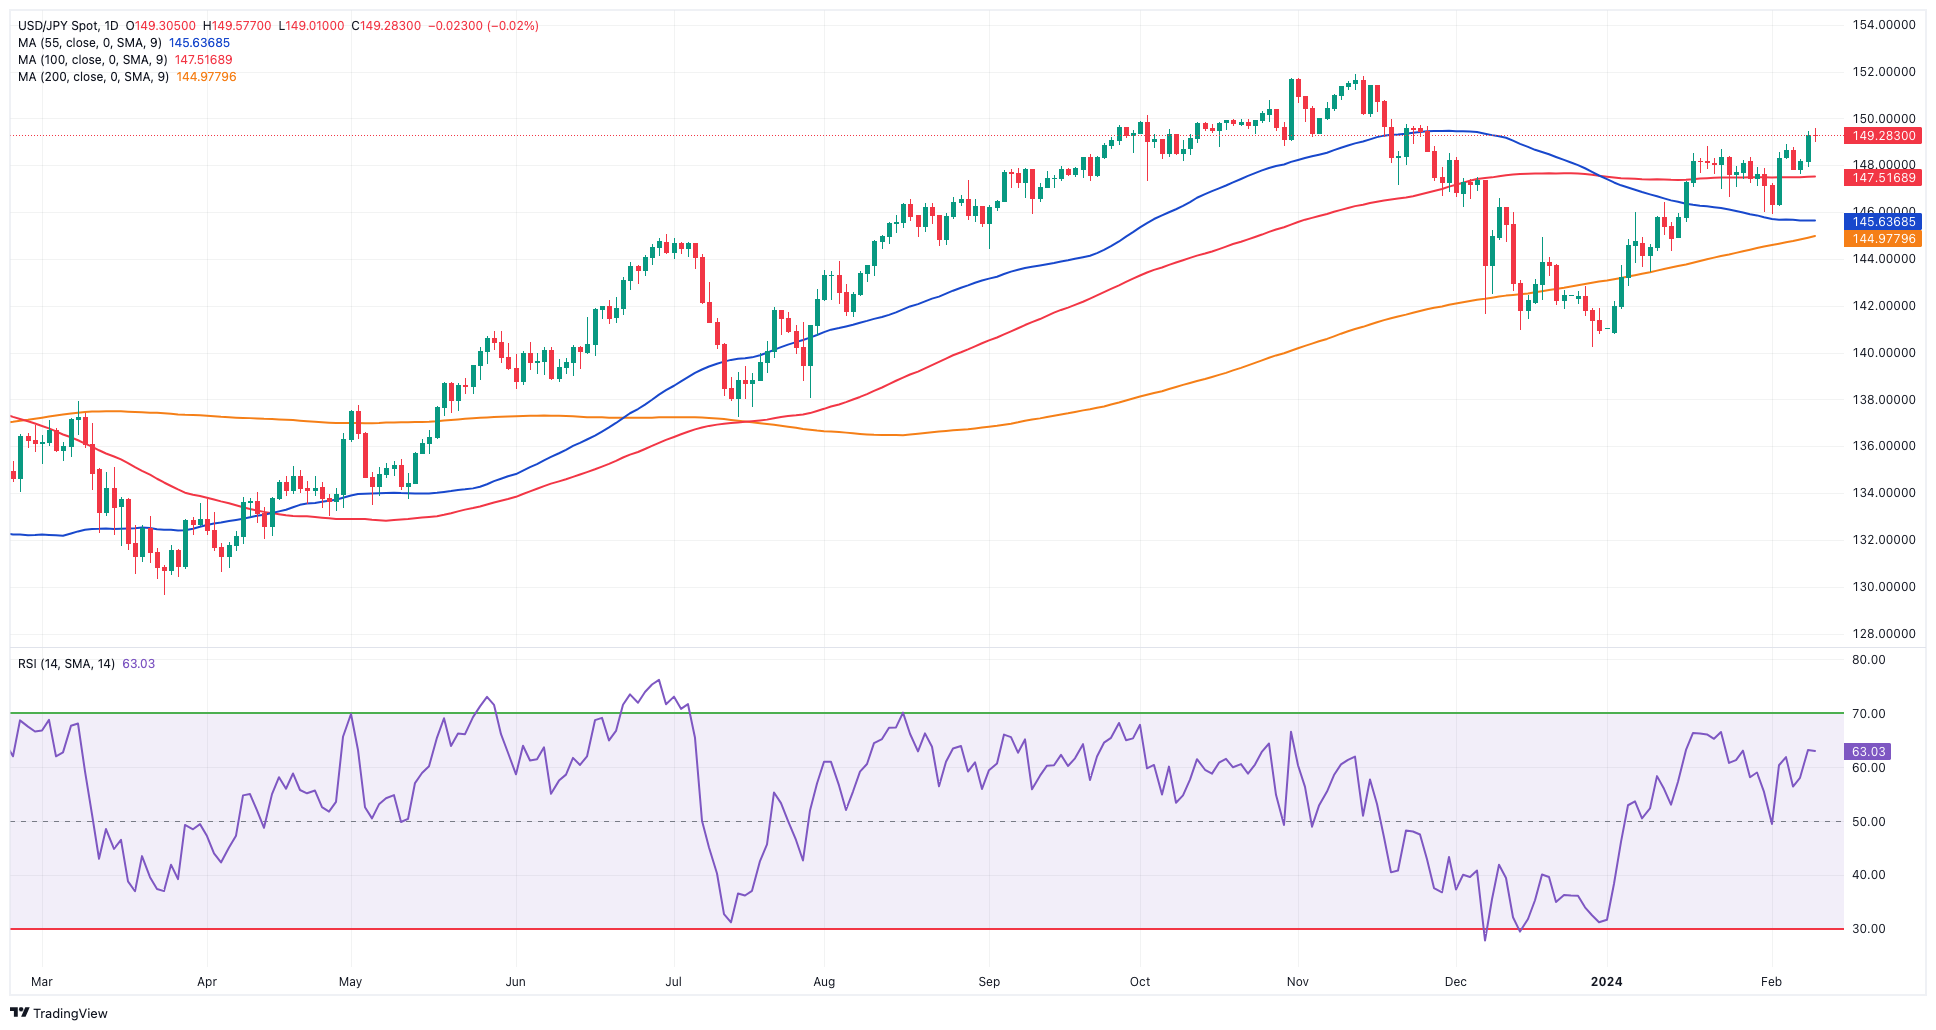
USD/JPY charted an inconclusive session and ended the week around Thursday’s closing levels near 149.30 not before hitting a new 2024 peak around 149.60 on Friday.
The pair’s vacillating price action was accompanied by an equally directionless mood in the greenback, while US and Japanese yields edged higher.
On another front, BoJ Governor K. Ueda expressed a cautious tone, echoing the sentiments of Deputy Governor Uchida from the previous day. Ueda cautioned that despite the possibility of discontinuing negative interest rates, the accommodating financial conditions are expected to persist.
If the rebound develops, USD/JPY might revisit the 2024 high of 149.57 (February 9), followed by the primary barrier of 150.00 and the 2023 top of 151.90 (November 13). Further north, the 2022 peak of 151.94 (October 21) comes right before the round number of 152.00. Instead, the immediate focus is on the February low of 145.89 (February 1), which is supported by the preliminary 55-day SMA at 145.75. Down from here comes the crucial 200-day SMA of 144.8492 prior to the December 2023 low of 140.24 (December 28), and the round figure of 140.00, all before the July low of 137.23 (July 14). The day-to-day RSI looked stable above 63.
Resistance levels: 149.57 149.67 151.43 (4H chart)
Support levels: 147.61 145.89 144.34 (4H chart)
GBPUSD
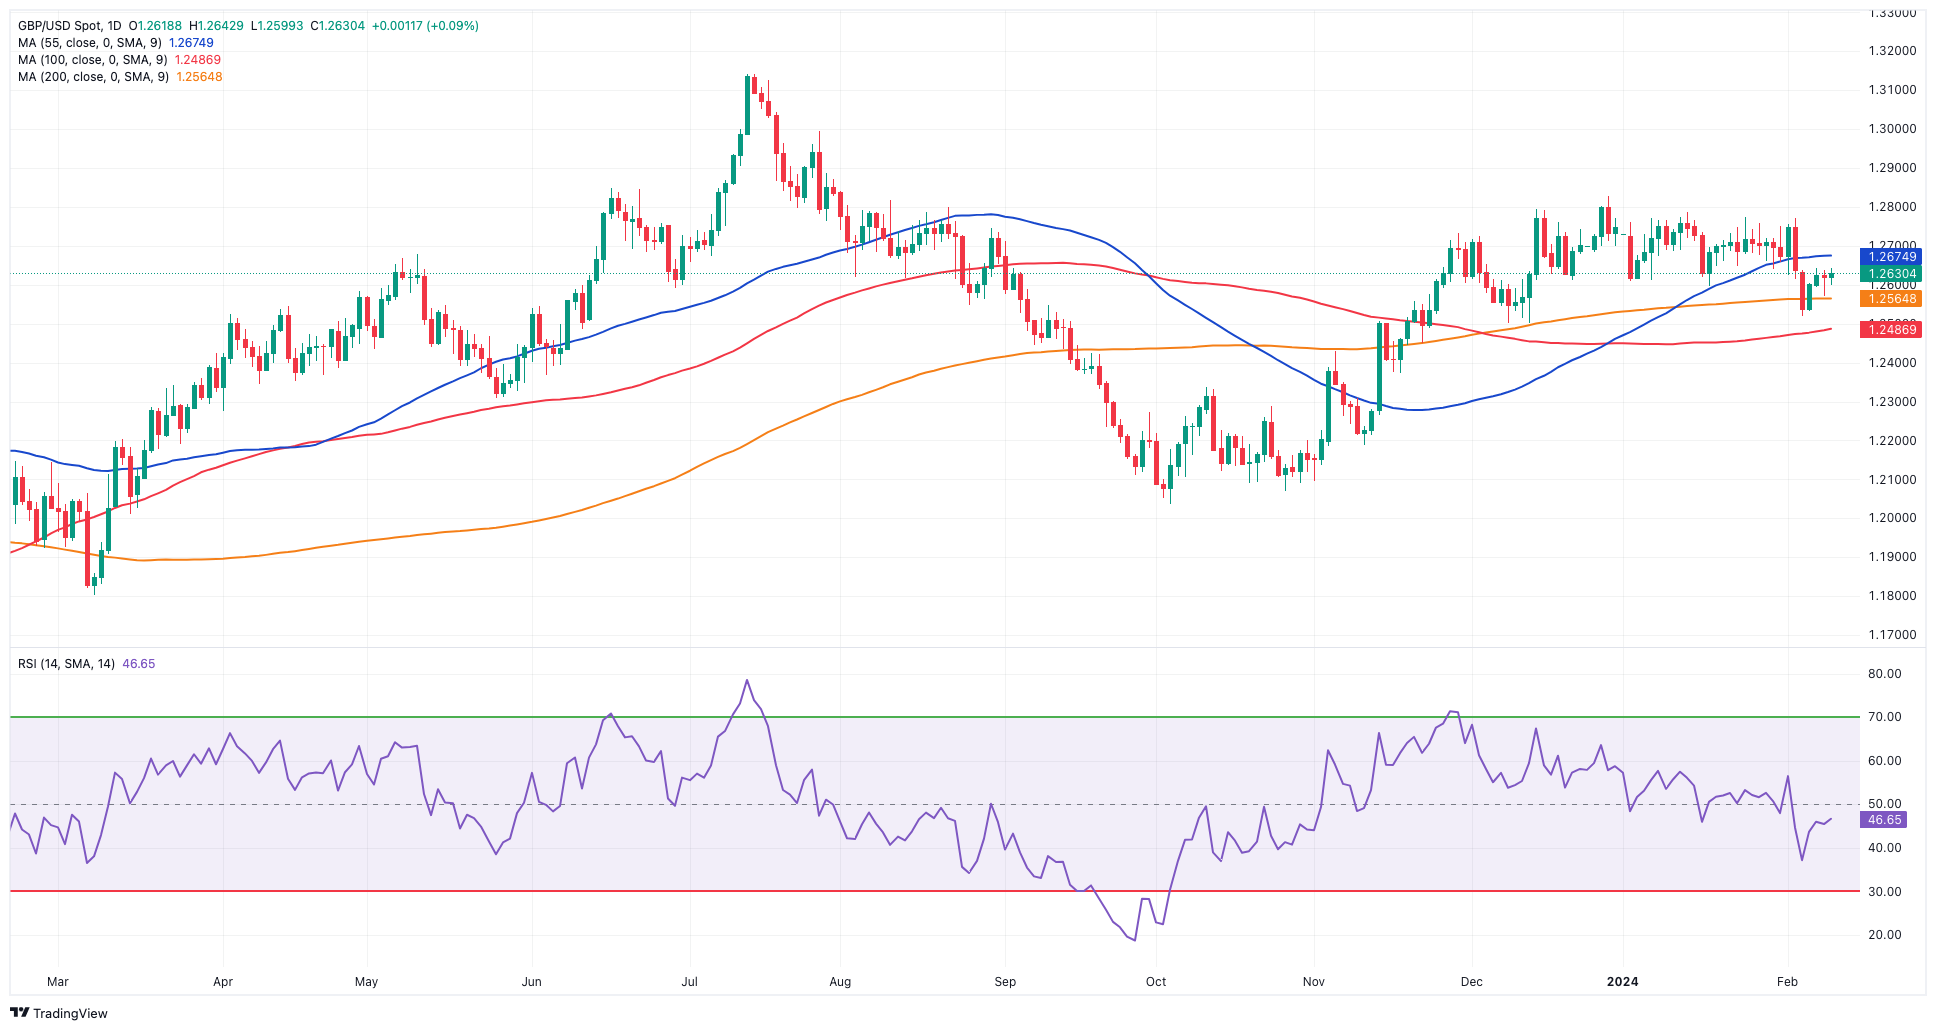
The dollar’s inconsistent price action allowed the British pound to gather some legs and prompt GBP/USD to advance modestly, leaving behind at the same time Thursday’s pullback.
The daily improvement in Cable came in tandem with the generalized constructive sentiment in the broad risk-linked space, while the rise to two-month tops in UK 10-year gilts also underpinned the positive mood in the quid.
Absent releases in the UK docket, BoE’s Haskel was in the spotlight after he stated that while the signs of lower inflation are promising, they are not conclusive. He emphasized the necessity for further evidence regarding the diminished persistence of inflation to cease advocating for higher interest rates. Describing the February decision as finely balanced, he expressed the intention to prolong the wait a bit more.
The break of the 2024 low of 1.2518 (February 5) reveals the December 2023 low of 1.2500 (December 13). Extra weakness may cause GBP/USD to target the weekly low of 1.2187 (November 10, 2023), before reaching the October 2023 low of 1.2037 (October 3), the critical 1.2000 mark, and the 2023 bottom of 1.1802 (November 10, 2023). On the upside, the 55-day SMA at 1.2668 provides transitory resistance, seconded by the 2024 high at 1.2785 (January 12). Further up is the December top of 1.2827 (December 28), ahead of the weekly peak of 1.2995 (July 27, 2023), which is just shy of the critical 1.3000 threshold. The RSI on the daily chart ticked a tad higher to around 47.
Resistance levels: 1.2643 1.2690 1.2772 (4H chart)
Support levels: 1.2571 1.2500 1.2448 (4H chart)
GOLD
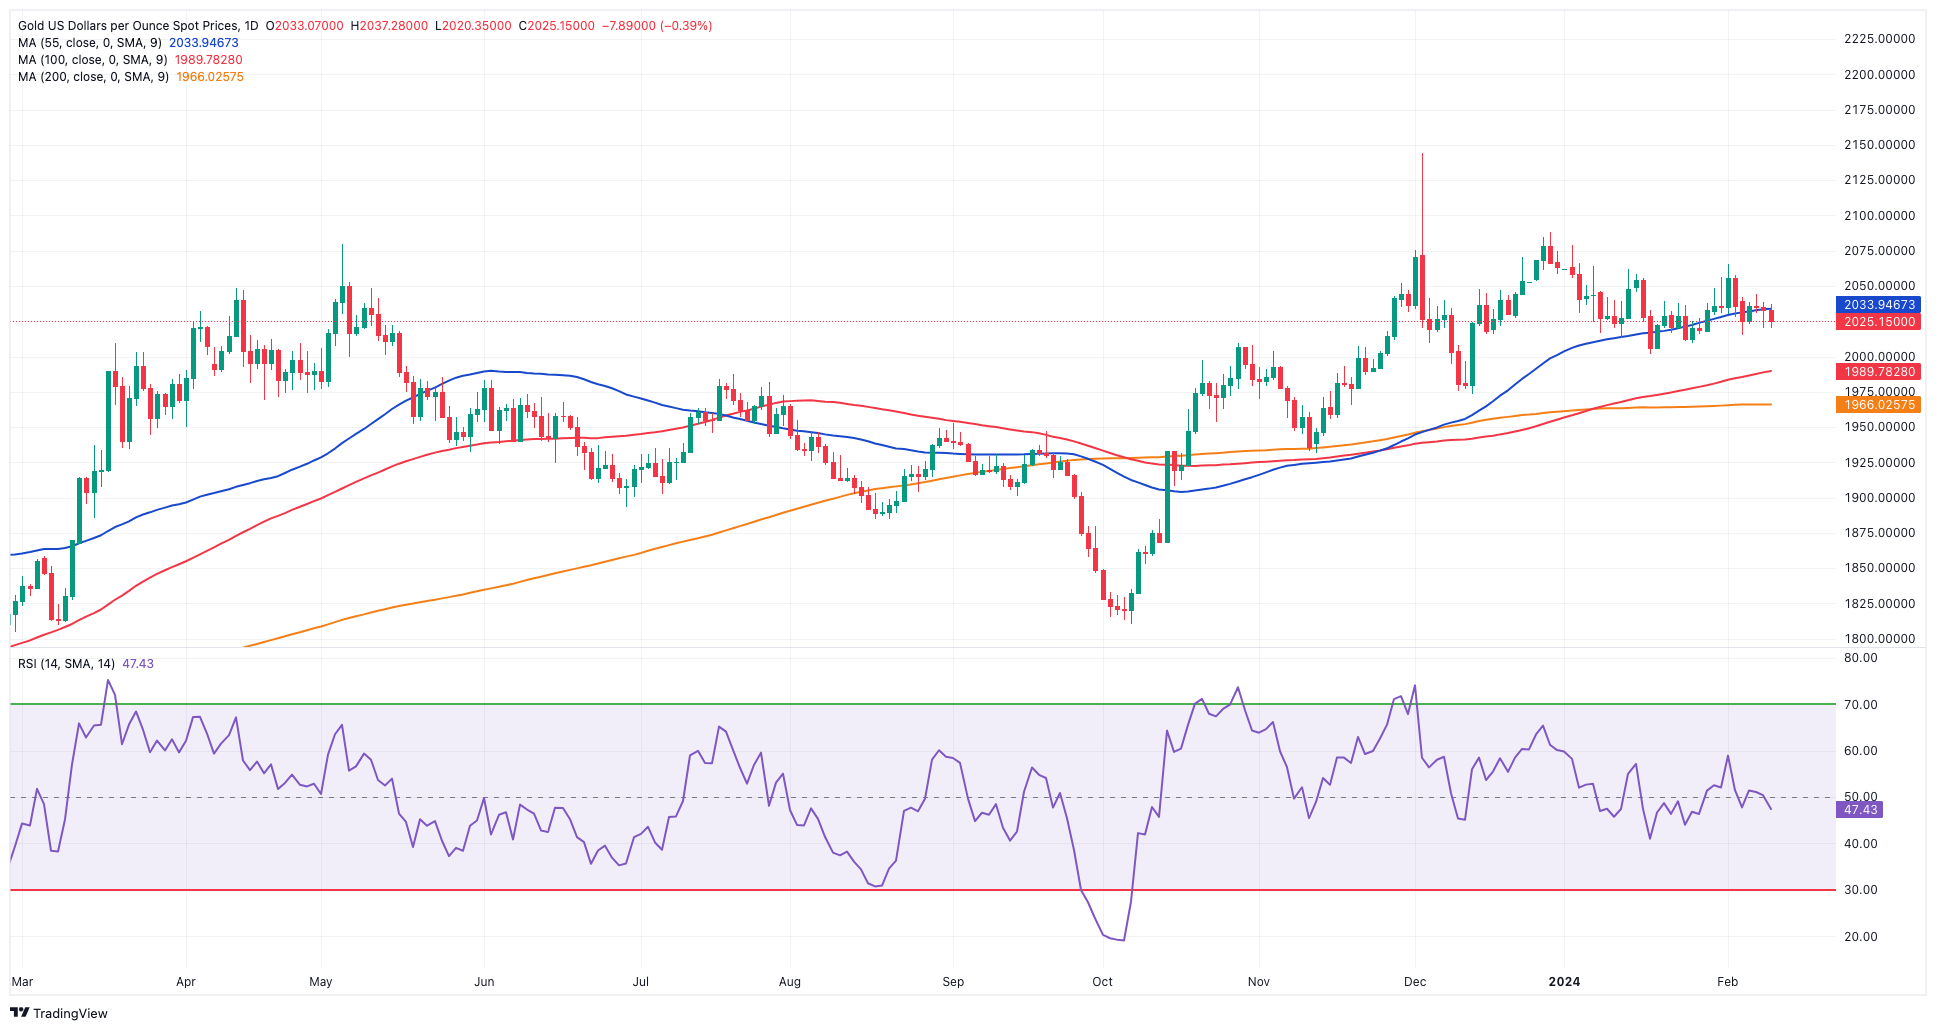
Gold prices retreated for the third consecutive session on Friday, briefly testing the $2020 region per troy ounce and rounding up a negative weekly performance on Friday.
Persistently high US yields across different maturities in combination with the rising perception that the Federal Reserve might keep its restrictive monetary policy conditions to at least May continued to weigh on the sentiment surrounding the precious metal at the end of the week.
Meanwhile, gold prices are expected to remain under the microscope ahead of the upcoming release of US inflation figures tracked by the CPI in the first month of the year, while unbated geopolitical woes kept bearish attempts somewhat contained for the time being.
Further losses may send gold to its 2024 low of $2001 (January 17), ahead of the December 2023 low of $1973, which is supported by the 200-day SMA at $1965. A deeper drop might bring the November 2023 bottom of $1931 back into view, ahead of the October 2023 low of $1810, the 2023 low of $1804, and the $1800 contention zone. Having said that, bullish attempts may force the metal to retest the weekly high of $2088 (December 28), which precedes the all-time top of $2150 (December 4, 2023).
Resistance levels: $2044 $2065 $2078 (4H chart)
Support levels: $2014 $2009 $2001 (4H chart)
CRUDE WTI
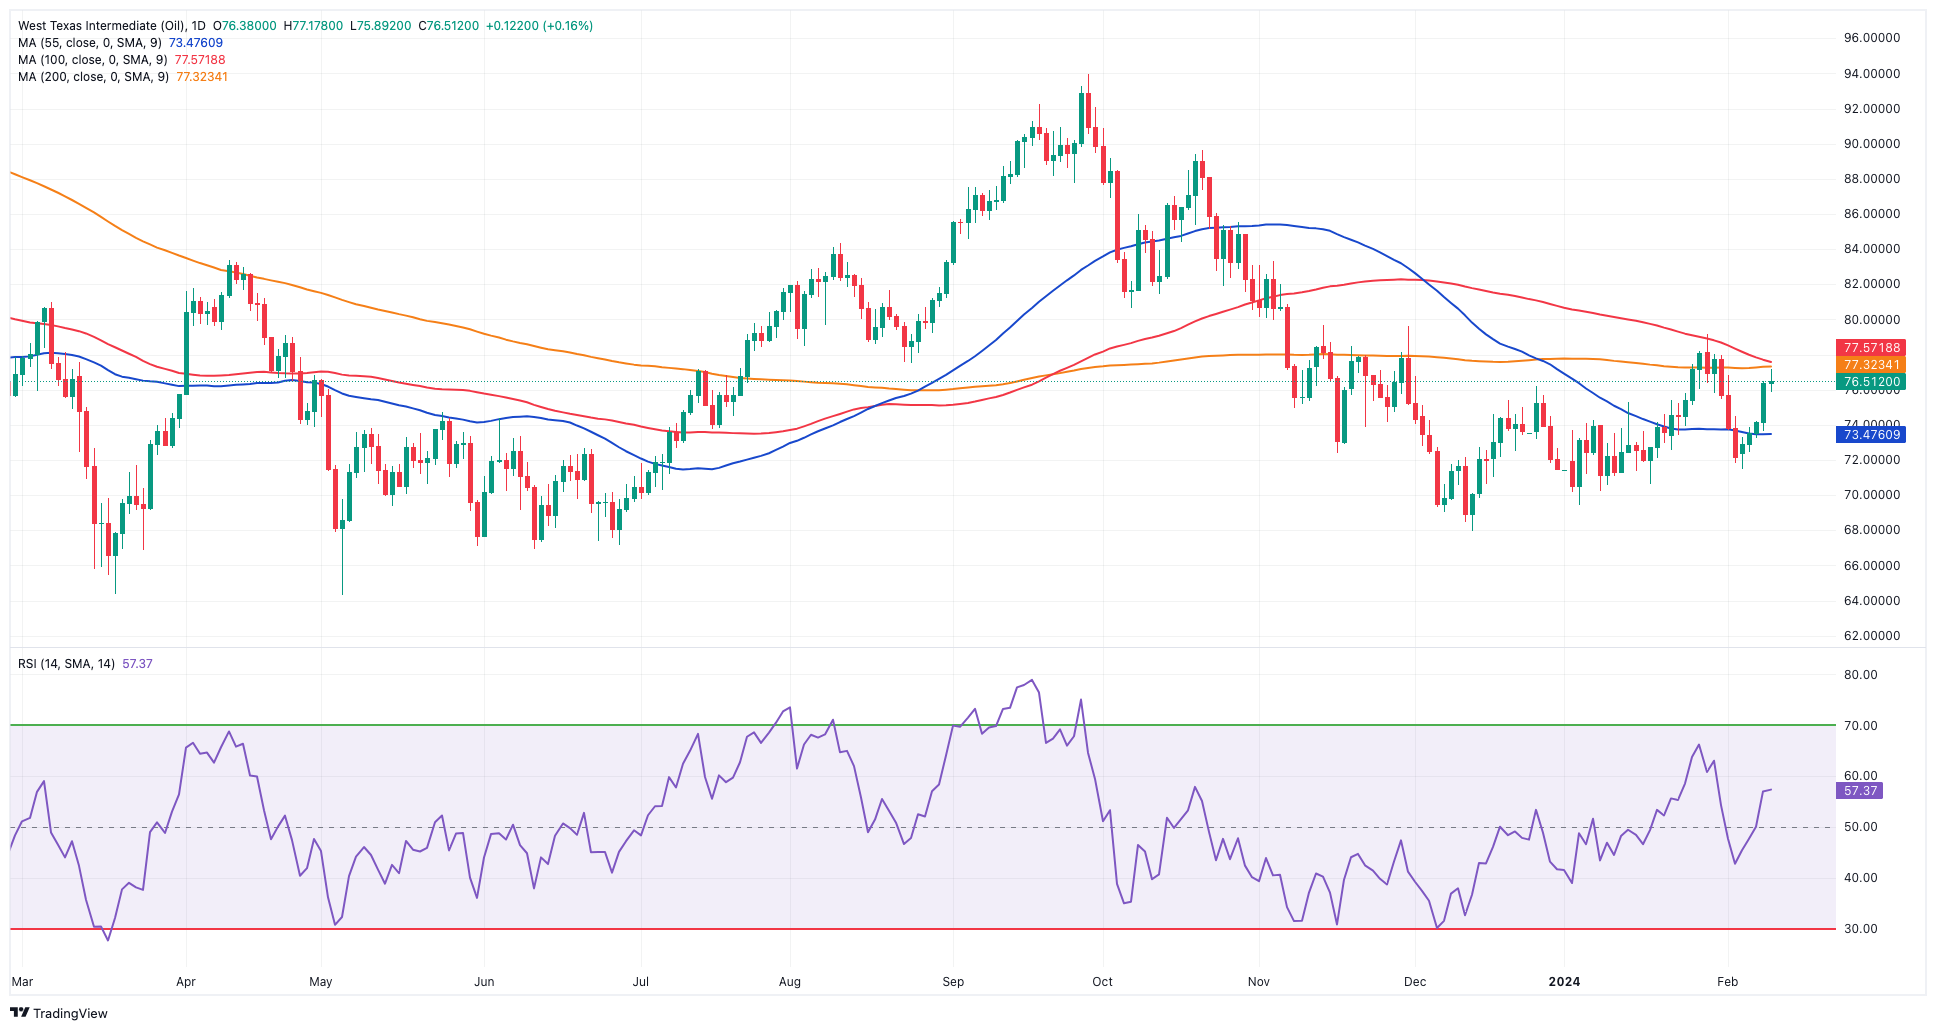
Prices of the American benchmark for sweet light crude oil partially reversed last week’s deep sell-off, briefly retesting the area beyond the $77.00 mark per barrel, or multi-day highs, and closing around $76.50 on Friday.
The tight supply narrative bolstered crude oil prices at the end of the week in combination with persistent concerns around the Israel-Hamas conflict and the Red Sea crisis.
Also propping up the upside bias in crude oil prices emerged the marked weekly drop in US distillate stocks and gasoline inventories, as reported by the EIA on Wednesday, while US production climbed to 13.3M barrels and gasoline futures rose past $2.36 per gallon on Friday, levels last seen in mid-October.
Closing the weekly calendar, the US oil rig count remained unchanged in the week to February 9, keeping the US total active oil rigs at 499.
The next up-barrier for WTI appears at the critical 200-day SMA at $77.39, prior to the 2024 high of $79.25 (January 29), which is immediately followed by the key $80.00 barrier and the November 2023 top of $80.15 (November 3). Extra gains from here may push the commodity back to its weekly peak of $89.83 (October 18, 2023), prior to the 2023 high of $94.99 (September 28, 2023) and the August 2022 top of $97.65 (August 30), all before the psychological $100.00 barrier. The other way around, the loss of the February low of $71.43 (February 5) may bring the important $70.00 barrier back into sight, followed by the 2024 bottom of $69.31 (January 3). The breakdown of the latter might pave the way for a move to the December 2023 low of $67.74 (December 13), which comes before the June 2023 low of $66.85 (June 12).
Resistance levels: $77.25 $78.11 $79.25 (4H chart)
Support levels: $73.81 $71.37 $70.59 (4H chart)
GER40
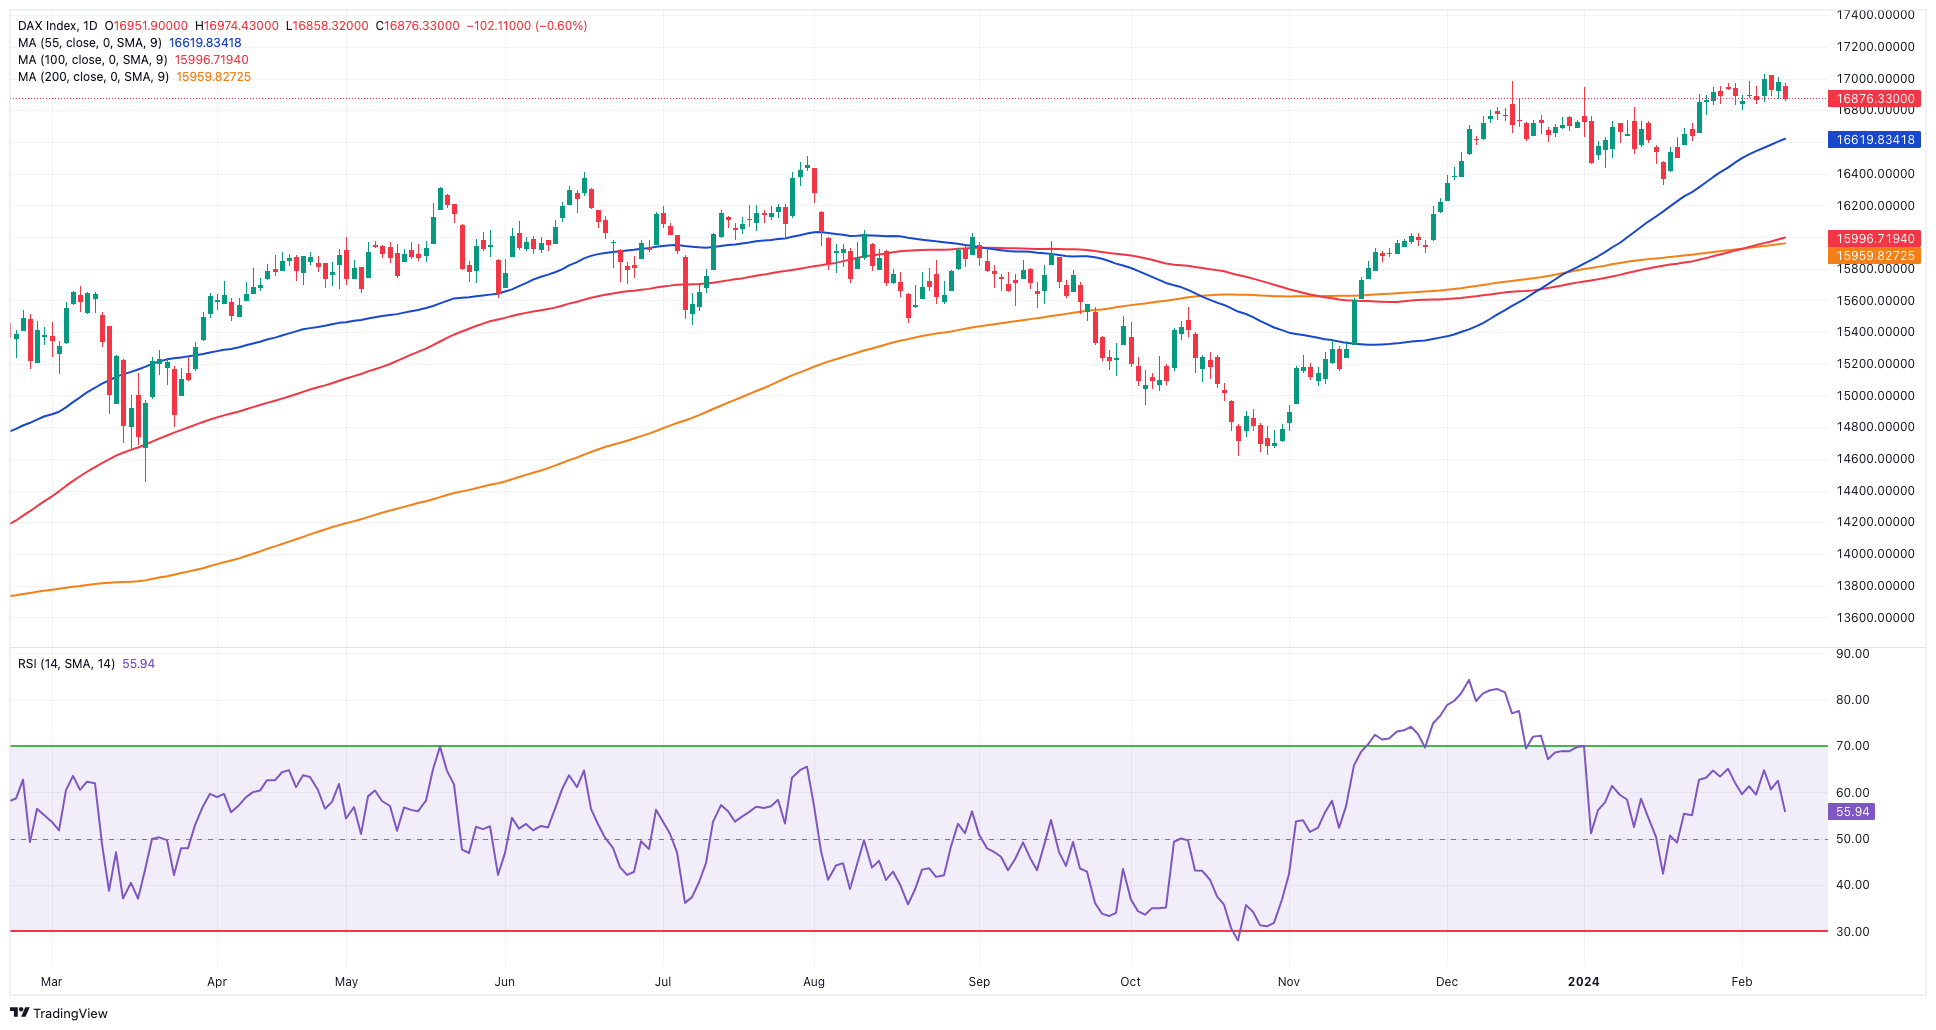
In line with most of its European peers, Germany’s benchmark DAX40 ended the week on a negative note around the 16900 zone.
The index maintained a choppy performance throughout the week amidst positive corporate earnings results, firm sentiment in the tech sector, and shrinking bets on an interest rate cut by the ECB in the relatively short term.
On the latter, the probability of a rate reduction at the April gathering is below 50%.
The corrective decline in the index also came in tandem with further gains in 10-year bund yields, which rose to multi-week tops near 2.40%.
The DAX40's next upward hurdle is its all-time high at 17049 (February 6). Instead, there is immediate contention at the February low of 16821 (February 1), seconded by the temporary 55-day SMA at 16641 and the 2024 bottom at 16345 (January 17). Once the index clears the latter, a visit to the 200-day SMA at 15979 is expected before the weekly low of 15915 (November 28). The October 2023 low of 14630 (October 23) follows next, before the March 2023 low of 14458 (March 20). The daily RSI slipped back to the proximity of 57.
Best Performers: Infineon, Rheinmetall AG, Commerzbank
Worst Performers: Siemens AG, Brenntag AG, Vonovia
Resistance levels: 17049 (4H chart)
Support levels: 16821 16434 16345 (4H chart)
GBPJPY
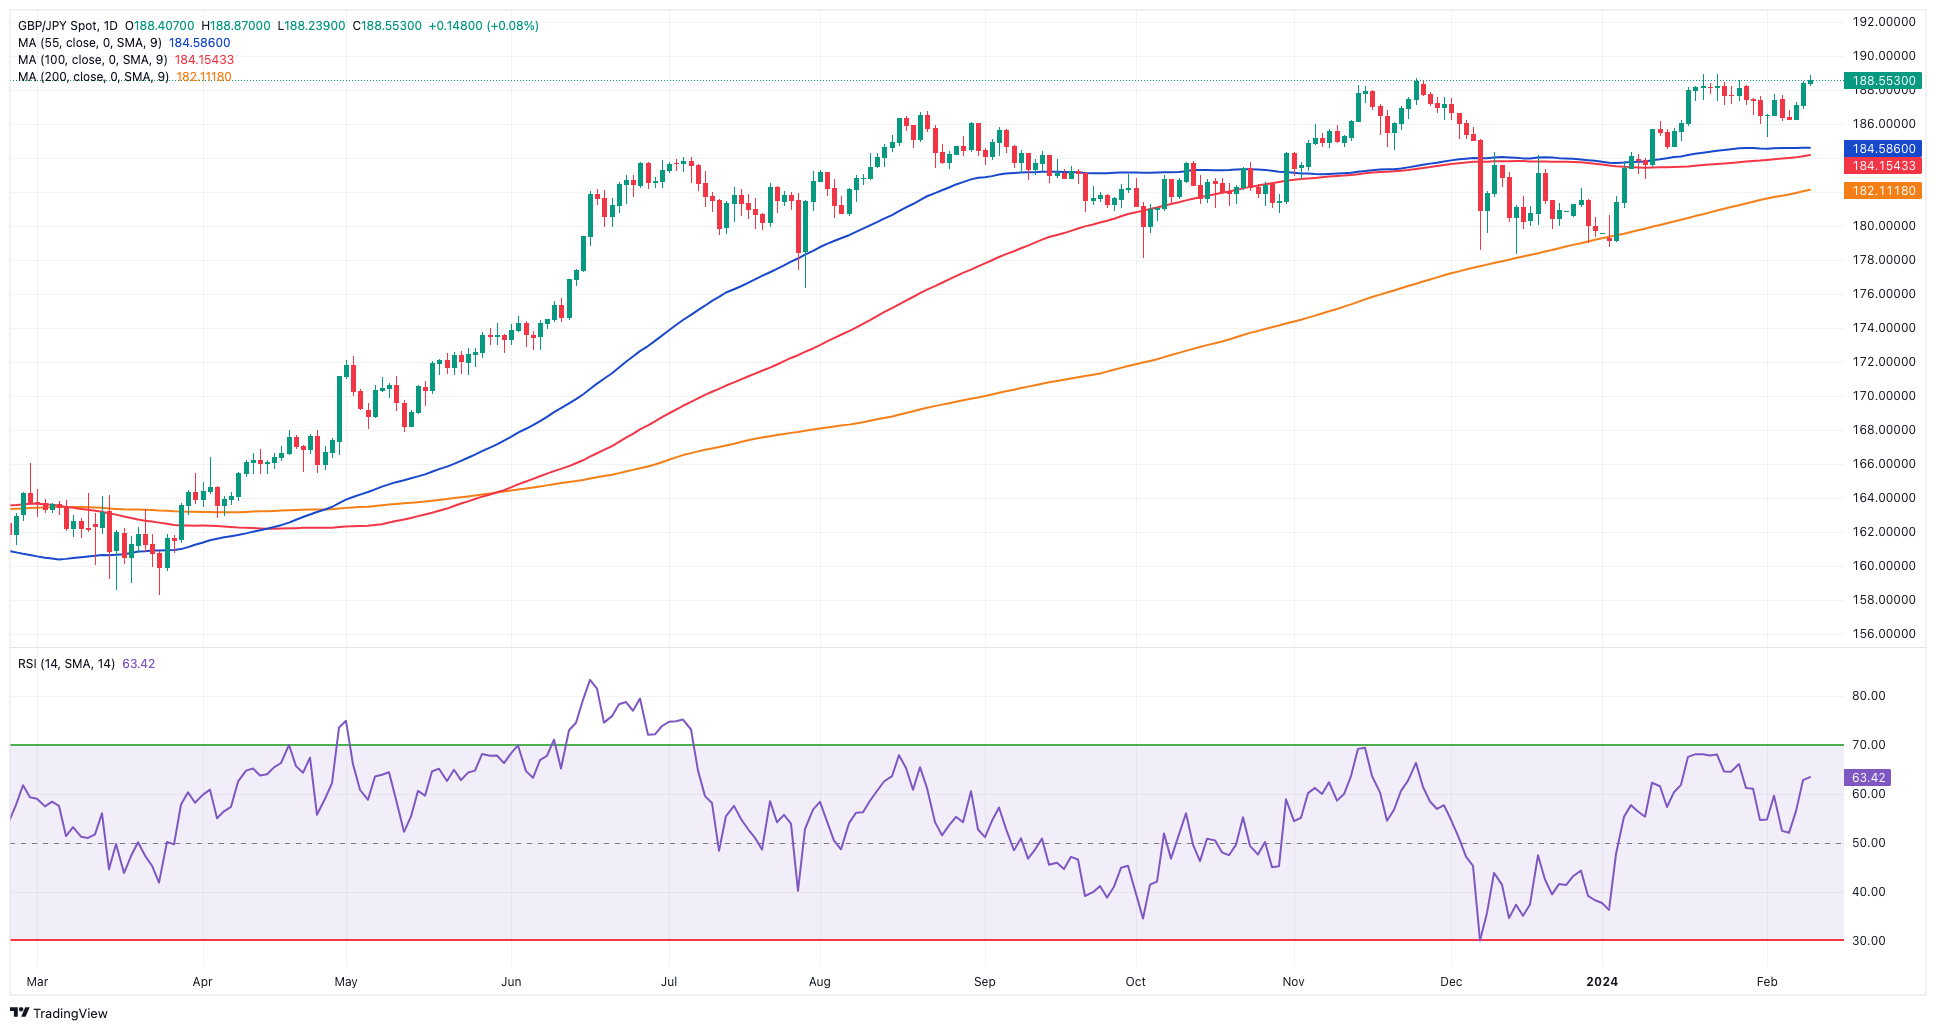
The broad-based risk-on sentiment encouraged GBP/JPY to extend its weekly bounce and advance for the third straight session on Friday, this time coming just short of the so-far yearly peaks near the 189.00 hurdle.
The positive price action in sterling in combination with the absence of traction from the Japanese yen in either direction contributed to the continuation of the march north in the cross on Friday.
Immediately to the upside for GBP/JPY is the 2024 high of 188.93 (January 19), which is ahead of the round number of 190.00 and the August 2015 record of 195.28. On the flip side, if bears regain initiative, spot may retest the February low of 185.22 (February 1) before attempting to breach the interim support at the 55-day and 100-day SMAs of 184.86 and 184.18. If the cross clears this level, it may meet the more critical 200-day SMA at 182.01, before the December 2023 bottom of 178.33 (December 14) and the October 2023 low of 178.03 (October 3). The loss of this region could put a test of the July 2023 bottom of 176.30 back on the radar before the May 2023 low of 167.84. The everyday RSI rose to the boundaries of 63.
Resistance levels: 188.86 188.93 189.99 (4H chart)
Support levels: 186.18 185.22 184.47 (4H chart)
NASDAQ
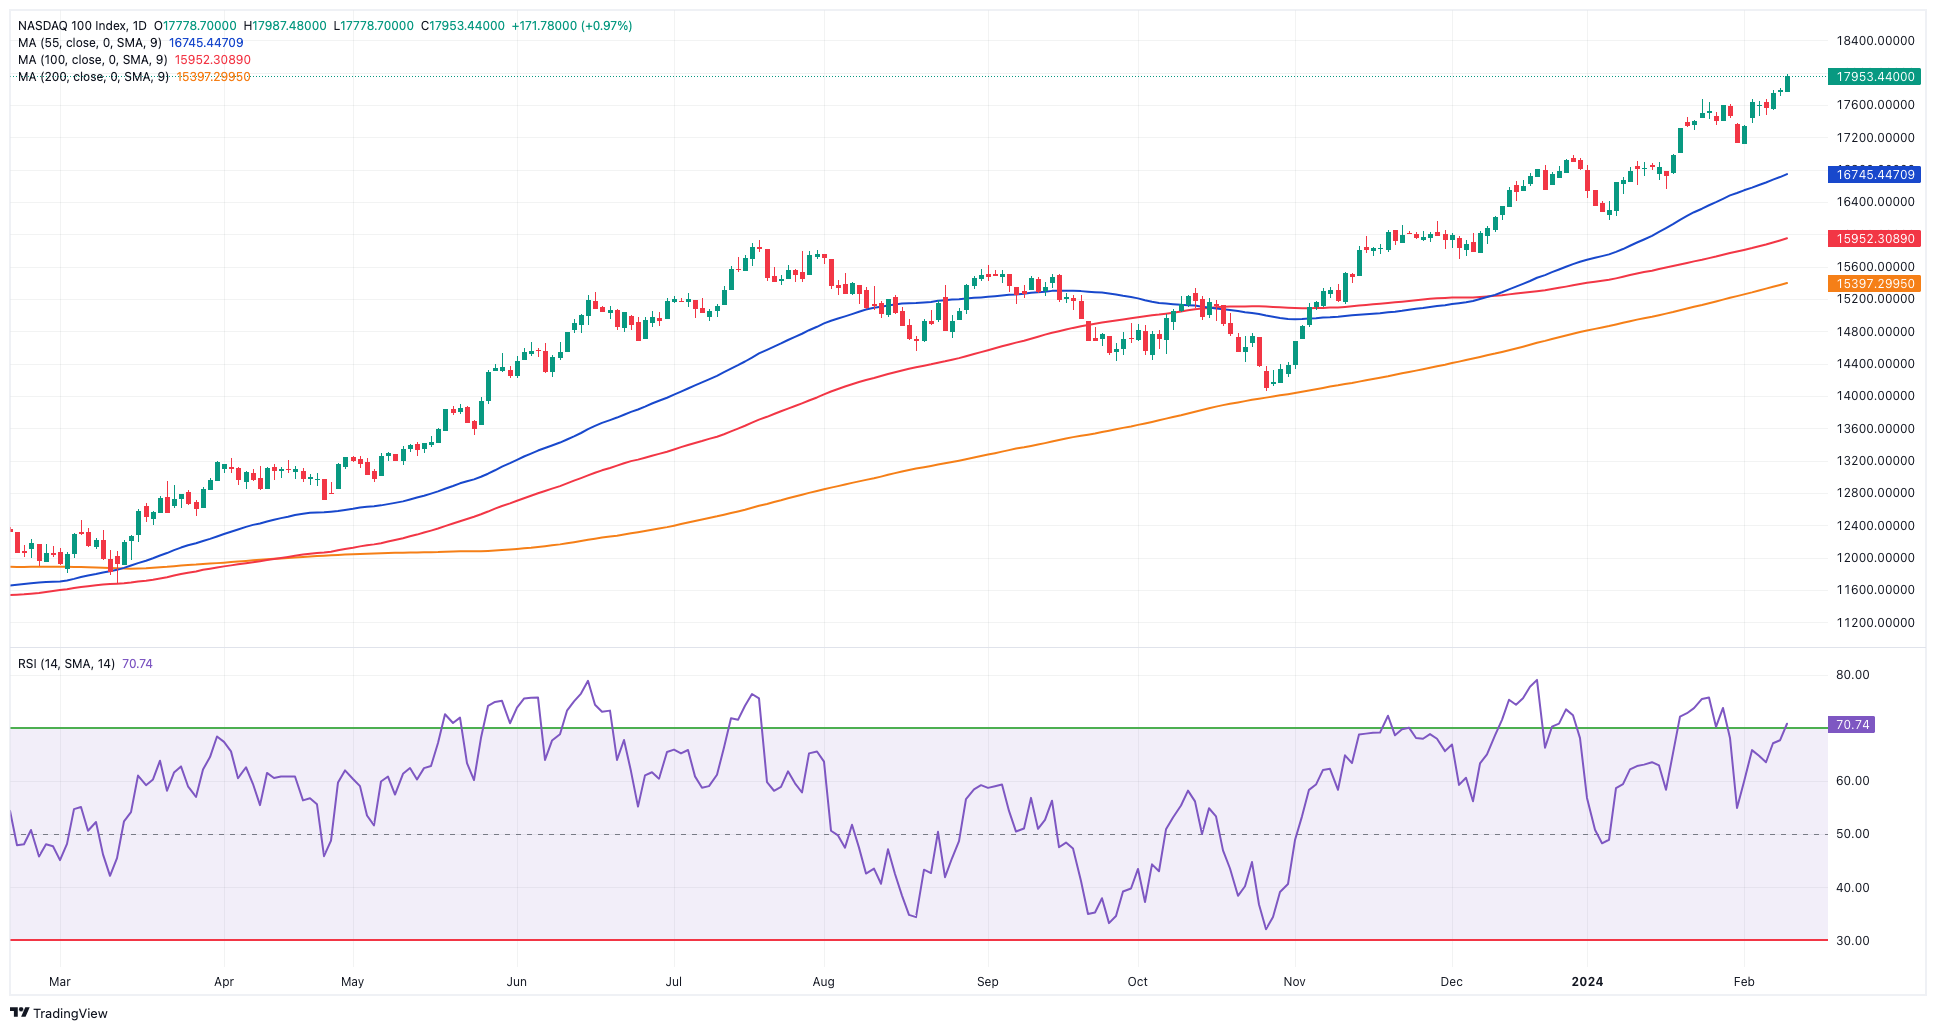
Further optimism in the US tech sector lifted the reference Nasdaq 100 to a new all-time high in levels just shy of the 18000 milestone on Friday. That said, the index closed its fifth straight week in positive territory.
The steady upbeat mood in AI-related stocks sustained the upside bias in the tech index, helped at the same time by auspicious corporate earnings reports and a mixed revision of the December inflation figures by the Department of Labor (DoL), which showed a lower monthly increase in the hedline CPI.
The Nasdaq 100 printed a new record high of 17987 on February 9. Conversely, occasional bearish attempts should target the weekly low of 17128 (January 31), which comes before the intermediate 55-day SMA of 16746 and the 2024 low of 16249 (January 5). If the index moves through this zone, it might reach the December 2023 low of 15695 (December 4) and the critical 200-day SMA of 15346. The loss of this region could prompt a drop to the October 2023 bottom of 14058 (October 26) to start emerging on the horizon prior to the April 2023 low of 12724 (April 25), the March 2023 low of 11695 (March 13) and the 2023 low of 10696 (January 3). On the daily chart, the RSI entered the overbought zone near 71.
Top Gainers: Applied Materials, Lam Research, MongoDB
Top Losers: Take-Two, Moderna, DexCom
Resistance levels: 17987 (4H chart)
Support levels: 17128 16561 16249 (4H chart)
DOW JONES
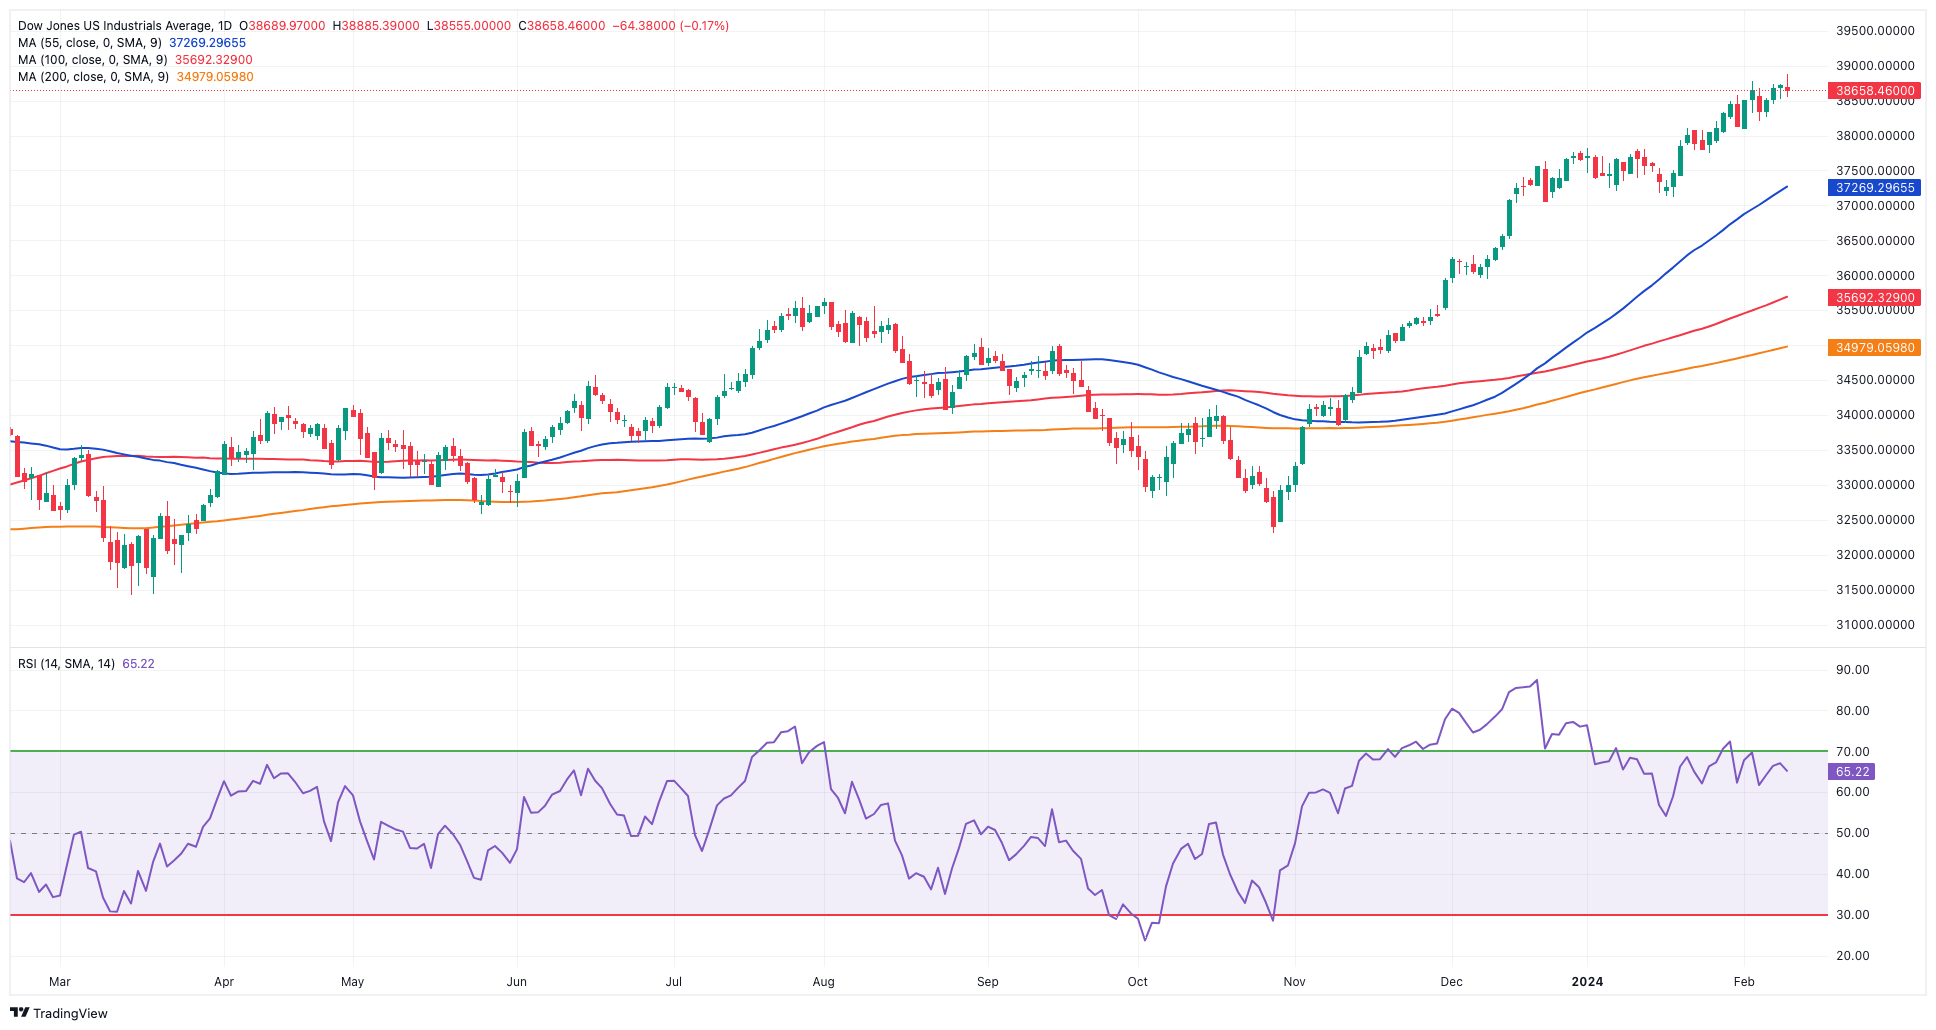
Unlike its US peers, the Dow Jones set aside three daily sessions of gains and retreated modestly on Friday. Despite the daily pullback, the index managed to keep the weekly positive streak intact for the fifth time.
While the S&P 500 closed above the 5000 milestone for the first time ever and the tech reference Nasdaq Composite briefly surpassed the 16000 barrier, equities tracked by the Dow Jones could not follow suit amidst a weaker dollar, higher yields, and caution ahead of the release of US CPI next week.
In the meantime, Fed officials continued to show no rush for the central bank to start reducing its interest rates. Following comments from Boston Fed S. Collins and Richmond Fed T. Barkin on Thursday, Dallas Fed L. Logan remarked on Friday that significant strides have been achieved regarding inflation, but there is still more work to be done. He described the labour market as "very tight" but noted signs of loosening. Emphasizing the importance of carefully examining data, he expressed a lack of urgency in adjusting rates. Building confidence in inflation is imperative, according to him, as the current state of the U.S. economy is favorable. He highlighted a high level of focus on potential risks that could impede progress on inflation.
At the end of the week, the Dow Jones dropped 0.14% to 38671, the S&P 500 gained 0.57% to 5026, and the tech-centric Nasdaq Composite rose 1.25% to 15990.
Immediately to the upside for the Dow Jones aligns the all-time top of 38783 (February 2). On the other hand, there is direct support at the 2024 low of 37122 (January 18), which comes before the weekly low of 37073 (December 20, 2023). The latter's decline implies a possible challenge to the intermediate 100-day SMA at 35693 before the 200-day SMA at 34971. The collapse of this sector may send the weekly low of 33859 (November 7, 2023) back to the forefront, ahead of the October 2023 low of 32327 (October 27) and the 2023 low of 31429 (March 15). The daily RSI eased to the sub-66 area.
Top Performers: Intel, Microsoft, IBM
Worst Performers: Chevron, Walt Disney, Caterpillar
Resistance levels: 38783 (4H chart)
Support levels: 38106 37122 36021 (4H chart)
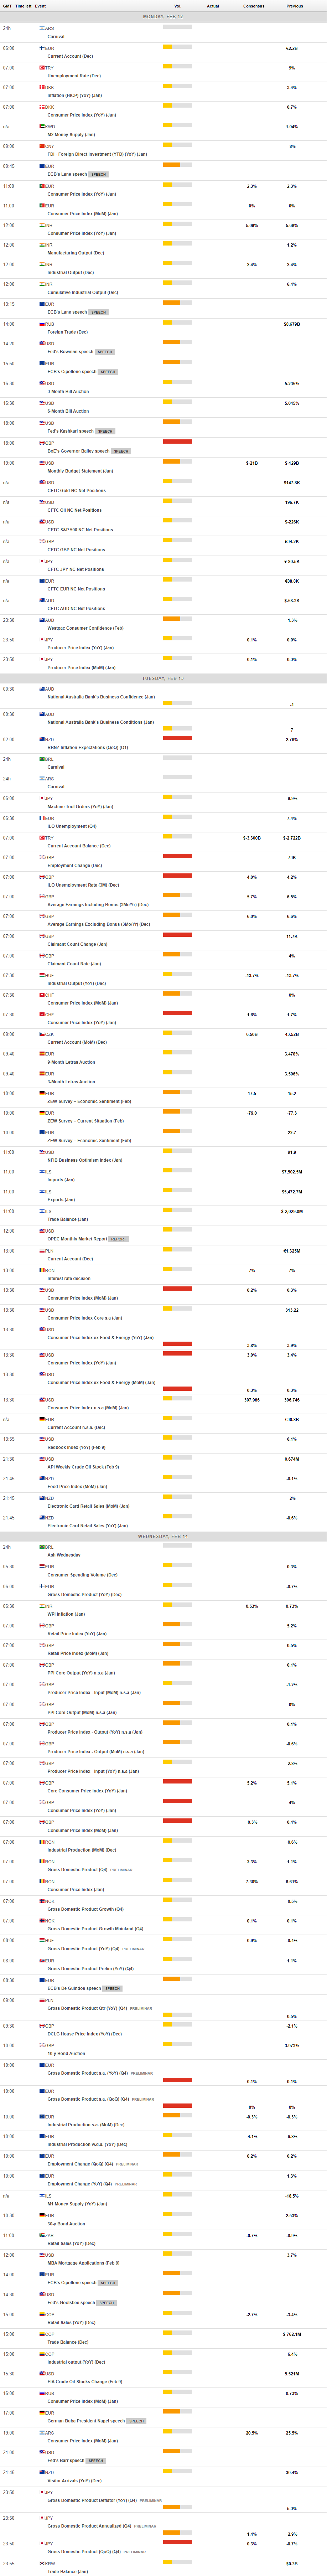
MACROECONOMIC EVENTS
All Information & Updates provided by:

All information relating to the financial markets available on this page has been prepared and issued by FXStreet (Forexstreet SL, Spain, Reg: B62498233) on the basis of publicly available information and all information believed to be reliable and does not conflict with Kuwaiti local laws, and all necessary care has been taken to before the company to ensure that the facts mentioned are correct from the source.
NCM Investment nor any of its directors or employees shall in any way be held responsible for the contents of this news, and the information contained on this page is intended only to provide clients with publicly available information and should not be construed as investment advice, report or analysis and/or constitute an offer or invitation to buy or sell financial instruments of any kind.
RISK WARNING: Forex and CFDs are highly risky leveraged products, as losses can exceed deposits. Please ensure you understand all the risks and take independent advice if necessary. NCM will segregate the clients based on the criteria of the regulator and its bylaws. NCM does not provide any advisory service; the material published does not constitute advice or a recommendation for a transaction in any financial instrument. NCM accepts no responsibility for any use of the content presented and any consequences of that use. Anyone acting on the information provided does so at their own risk.