
- Contact Us:
-

-

-

-


Daily Market Updates
13 Feb 2024
EURUSD
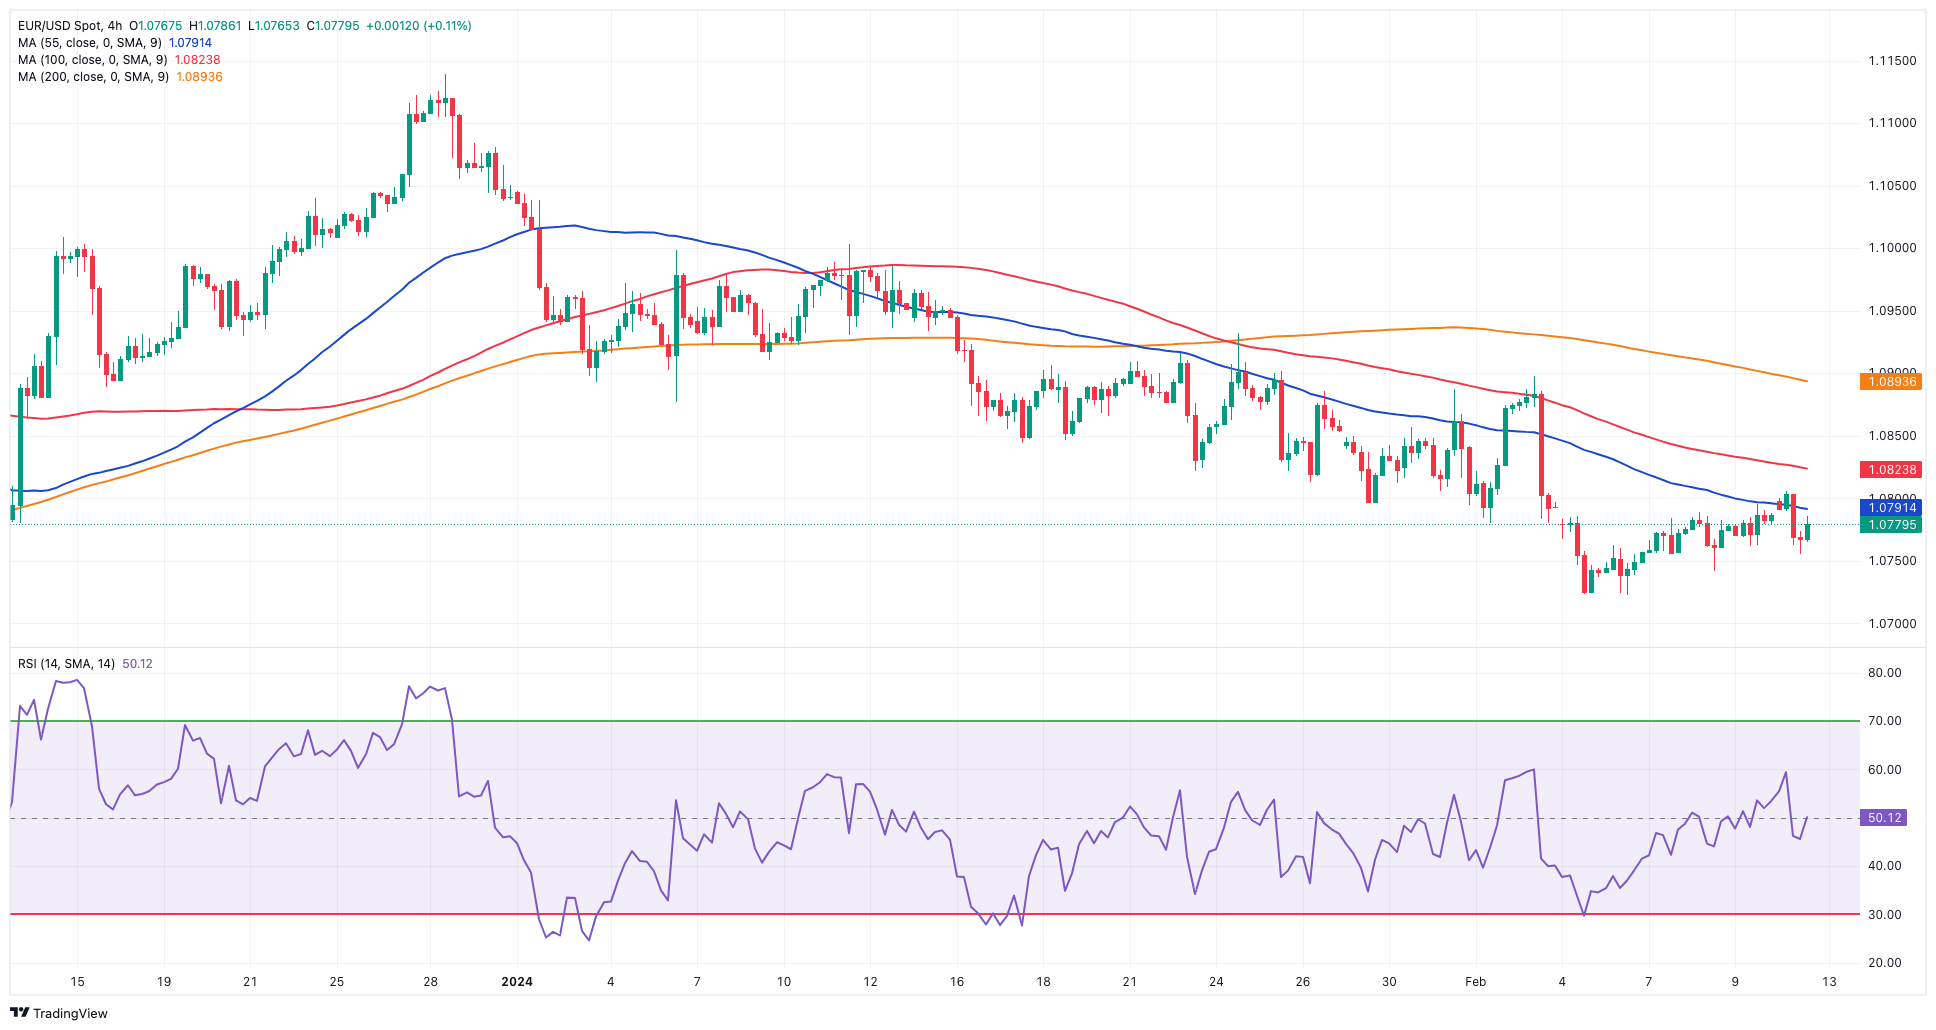
EUR/USD managed to advance just beyond 1.0800 the figure at the beginning of the week, although the move lacked follow-through, and the pair eventually retreated to the 1.0770 zone, where it settled for the day.
The greenback traded in an equally flattish mood in the low 104.00s amidst a slight pullback in the short end of the US yield curve and small gains in the belly and the long end, all against the backdrop of rising prudence ahead of the release of US inflation figures measured by the CPI on Tuesday.
Meanwhile, market participants continued to factor in a probable interest rate cut by the Federal Reserve in May, while ECB’s F. Panetta said that a rate cut is “fast approaching” at an interview over the weekend.
The US and euro dockets were empty on Monday.
The immediate aim of the present EUR/USD rebound is the important 200-day SMA at 1.0830, followed by the intermediate 55-day SMA at 1.0895 and the weekly high at 1.0932 (January 24). Further north, another weekly top of 1.0998 (January 5, 11) reinforces the 1.1000 threshold and comes ahead of the December 2023 peak of 1.1139 (December 27). This level is also supported by the 200-week SMA at 1.1148, and precedes the 2023 high of 1.1275 (July 18). In the other direction, if sellers break through the 2024 low of 1.0722 (February 6), spot may go much lower to the weekly low of 1.0495 (October 13, 2023), ahead of the 2023 low of 1.0448 (October 3) and the round level of 1.0400. The daily RSI slipped back to the 40 area.
Resistance levels: 1.0805 1.0897 1.0912 (4H chart)
Support levels: 1.0722 1.0656 1.0516 (4H chart)
USDJPY
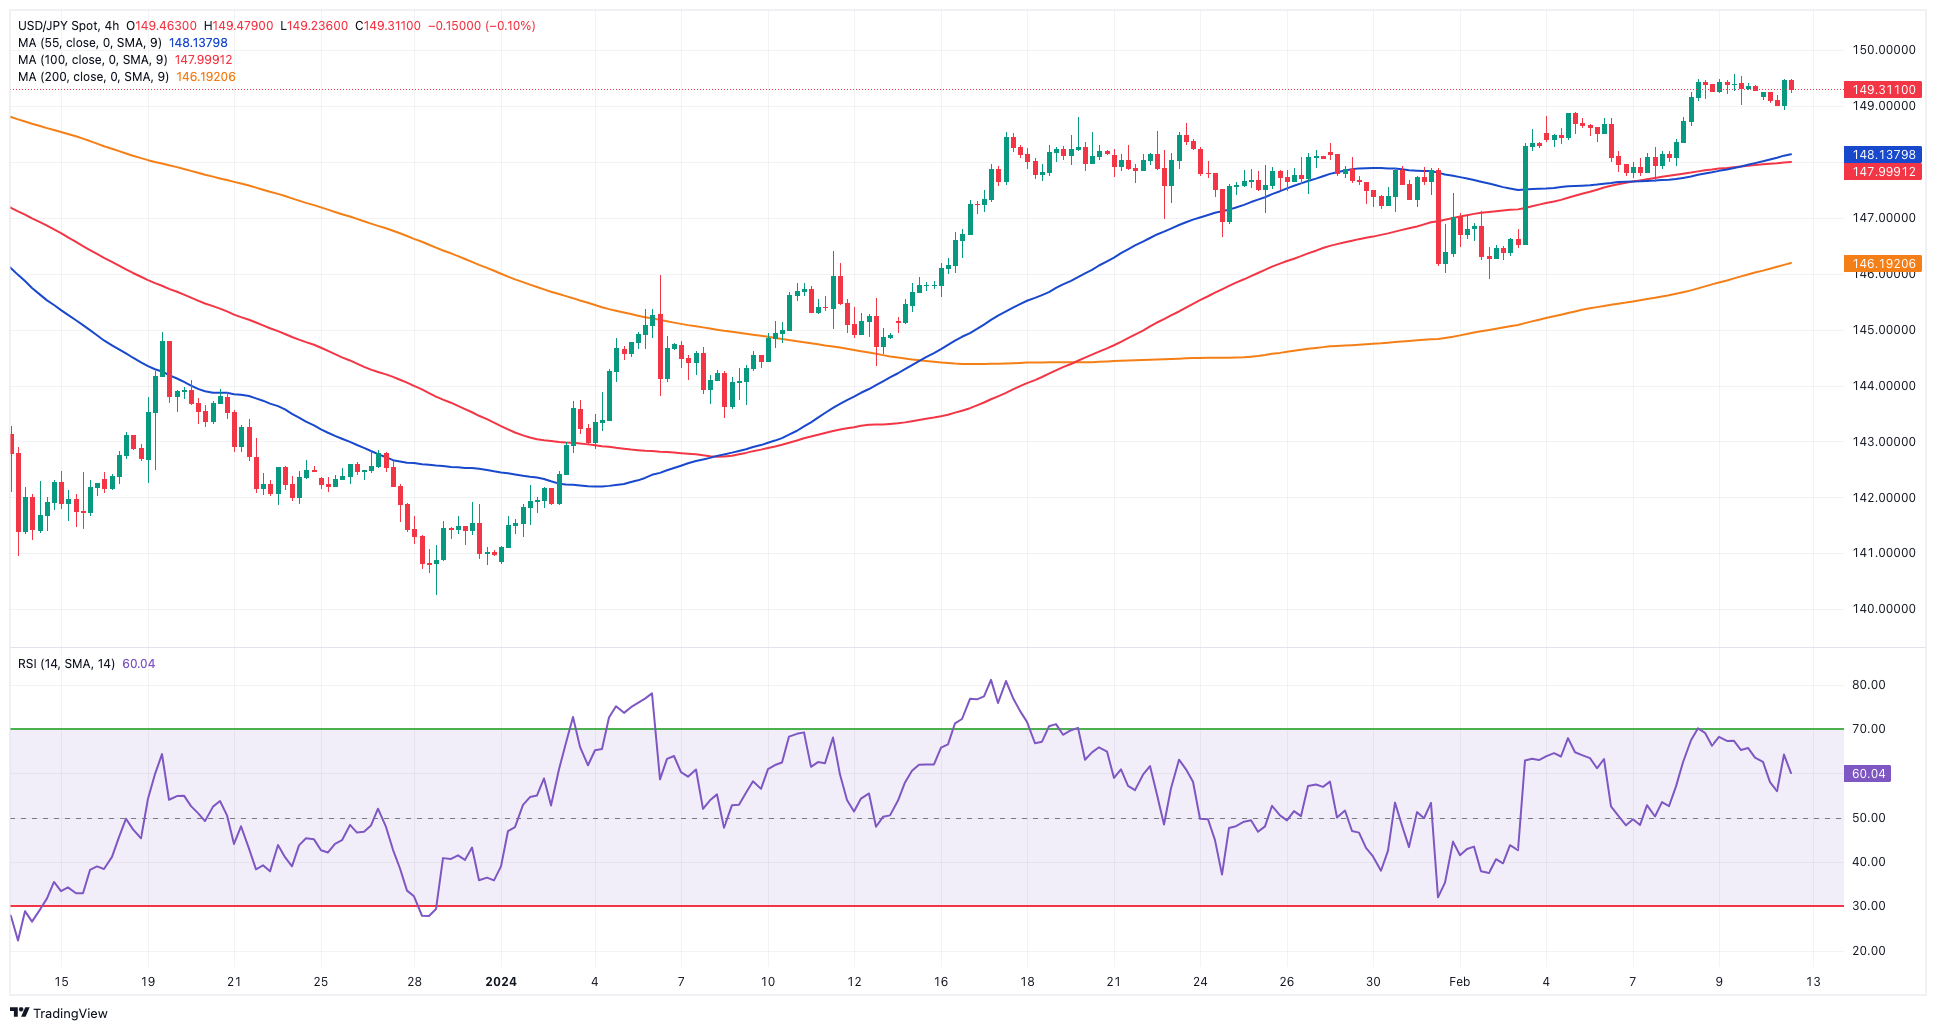
USD/JPY advanced marginally and reversed Friday’s slight decline, keeping business in the upper end of the range and near recent yearly highs in the 149.55/60 band on Monday.
Price action in spot came on the back of the muted performance of the dollar, while US yields traded mixed across different time frames vs. a decent gain in JGB 10-year yields, which set aside two daily drops in a row.
There were no data releases in the Japanese calendar on Monday, leaving all attention to the publication of January Producer Prices on Tuesday.
If the rally continues, USD/JPY may revisit the 2024 high of 149.57 (February 9), followed by the major barrier of 150.00 and the 2023 top of 151.90 (November 13). Further north, the 2022 peak of 151.94 (October 21) occurs immediately before the round number of 152.00. Just the opposite, the current focus is on the February low of 145.89 (February 1), which is supported by the preliminary 55-day SMA at 145.75. Down from here comes the critical 200-day SMA of 144.99 before the December 2023 bottom of 140.24 (December 28), and the round number of 140.00, all before the July low of 137.23 (July 14). The day-to-day RSI remained flat around 63.
Resistance levels: 149.57 149.67 151.43 (4H chart)
Support levels: 147.61 145.89 144.34 (4H chart)
GOLD
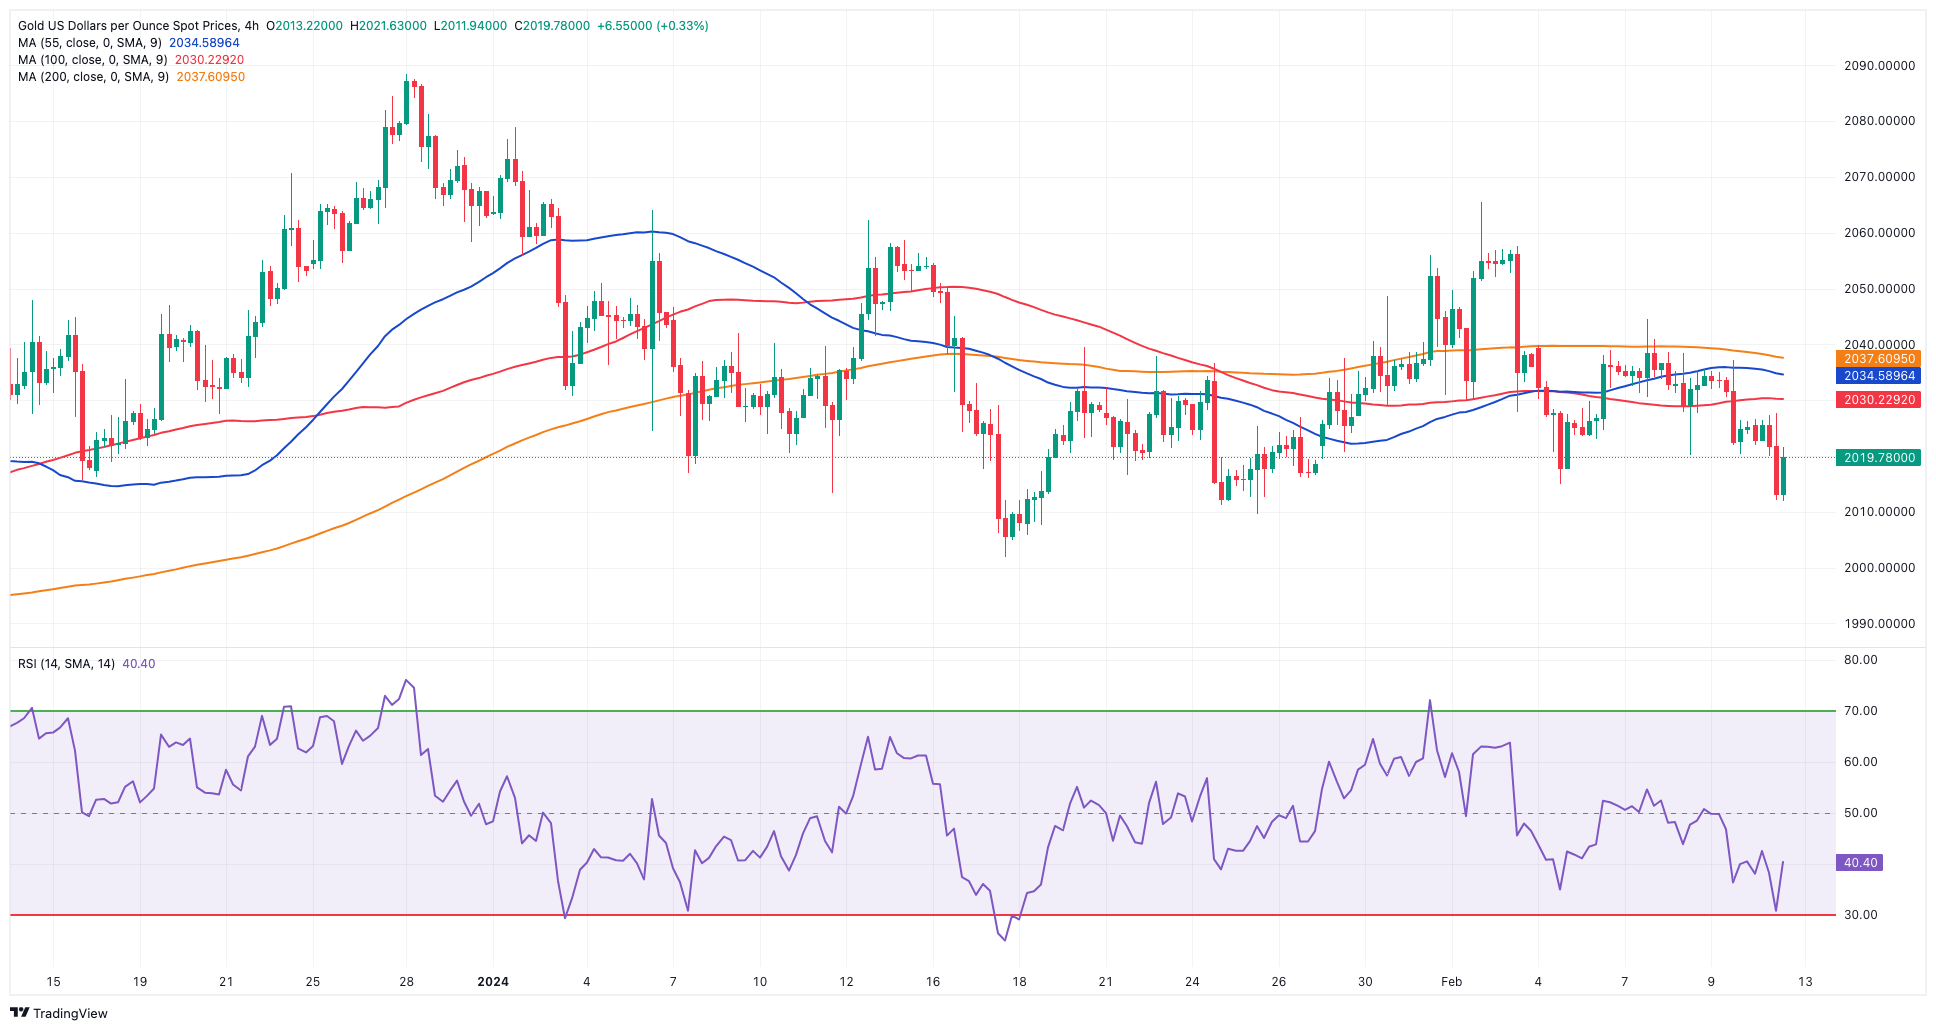
Gold prices experienced their fourth consecutive decline on Monday, briefly dipping to the $2010 region per troy ounce, a multi-session retracement.
The daily pullback in the yellow metal came in spite of mixed US yields across various maturity periods, coupled with a marginal pullback in the greenback, all amidst growing speculation that the Fed may maintain its tight monetary policy stance at least until May.
In the meantime, attention remains focused on gold prices as market participants await the release of US inflation data tracked by the CPI for the month of January.
Further losses may push gold to its 2024 bottom of $2001 (January 17), ahead of the December 2023 low of $1973, which is supported by the 200-day SMA at $1965. A further plunge might bring the November 2023 bottom of $1931 back into focus, ahead of the October 2023 low of $1810, the 2023 low of $1804, and the $1800 contention zone. However, bullish attempts may cause the metal to retest the weekly high of $2088 (December 28), which precedes the all-time top of $2150 (December 4, 2023).
Resistance levels: $2037 $2044 $2065 (4H chart)
Support levels: $2011 $2001 $1973 (4H chart)
CRUDE WTI
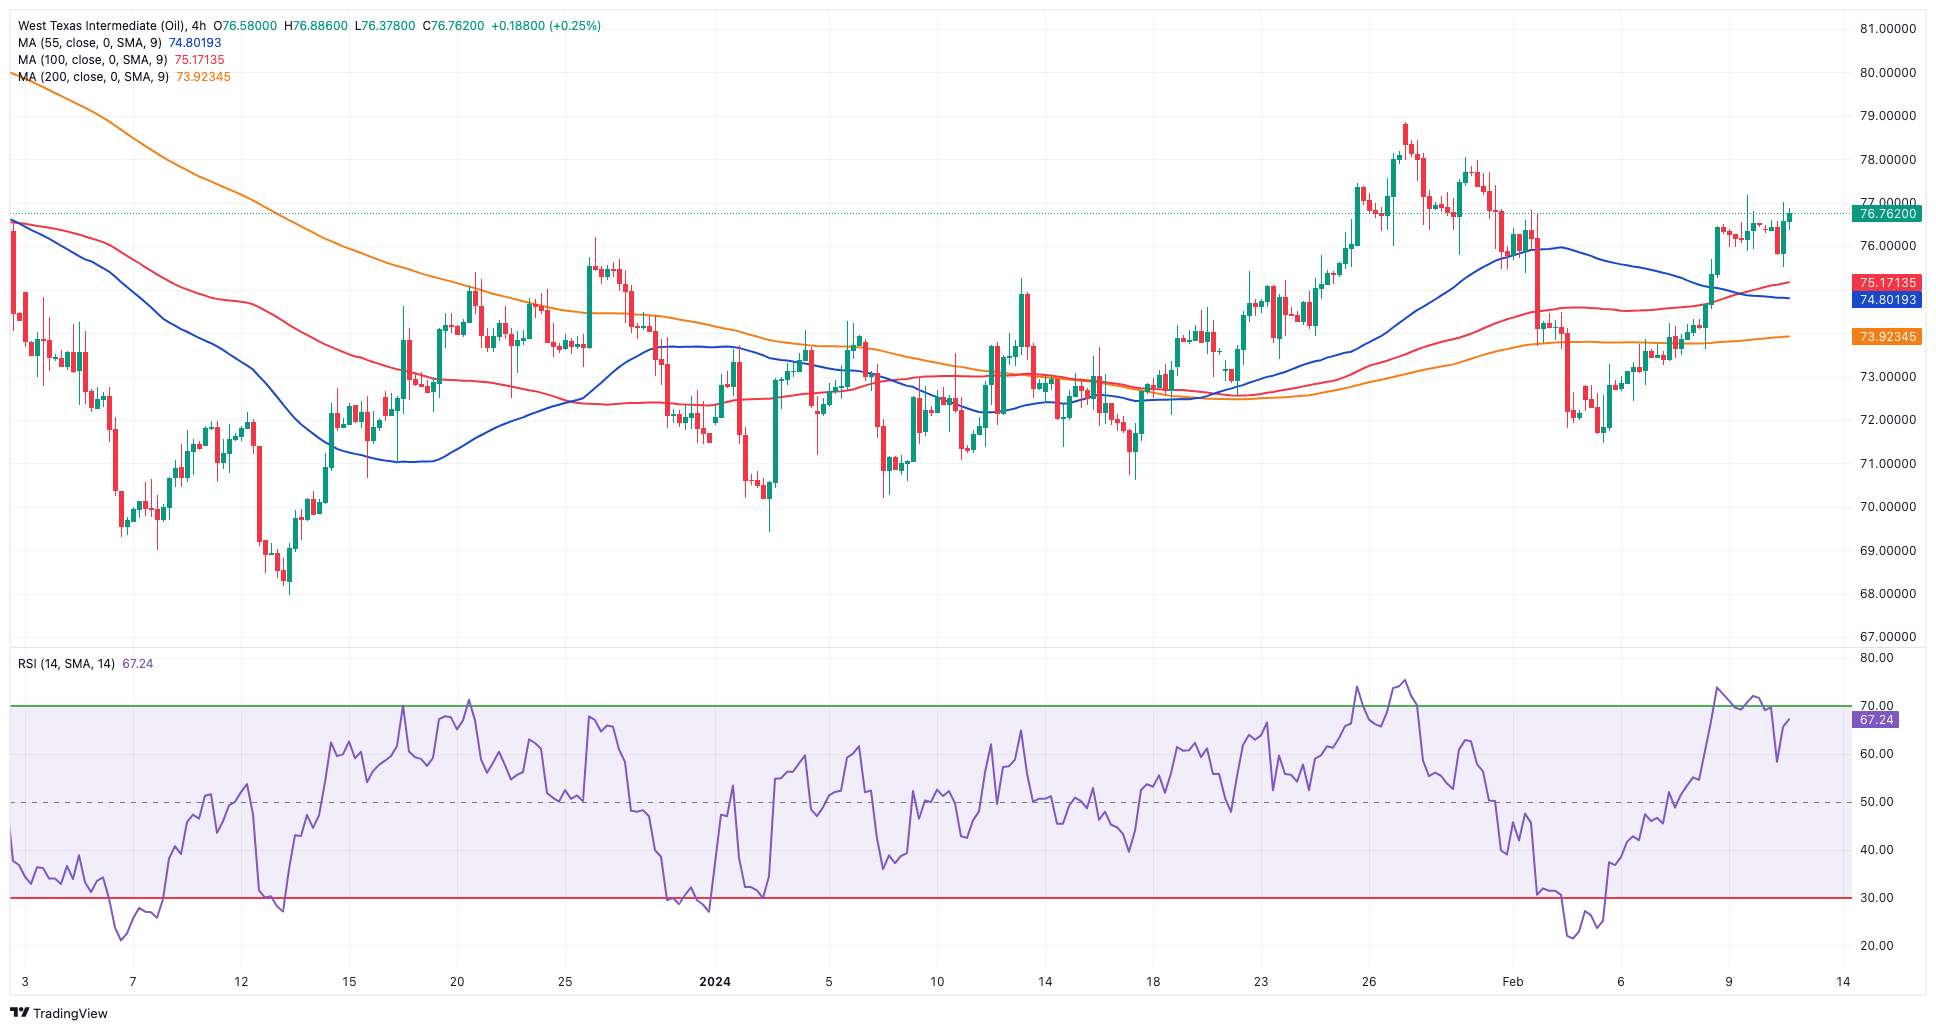
WTI prices quickly reversed the initial knee-jerk to the vicinity of $75.50 per barrel and reclaimed the area just beyond the $77.00 level at the beginning of the week.
Indeed, after a slight profit-taking move, bulls remained in control on the back of persistent geopolitical jitters, while the tight supply narrative maintained the positive streak in the commodity for the sixth session in a row on Monday.
Later in the week, all the attention is expected to be on the release of US inflation figures on February 13, ahead of the EIA’s weekly report on US crude oil inventories the following day.
The next upward hurdle for WTI occurs at the significant 200-day SMA at $77.43, prior to the 2024 high of $79.25 (January 29), which is immediately followed by the major $80.00 barrier and the November 2023 top of $80.15 (November 3). Extra gains from here may drive the commodity back to its weekly peak of $89.83 (October 18, 2023), ahead of the 2023 high of $94.99 (September 28, 2023) and the August 2022 top of $97.65 (August 30), all before the psychological $100.00 barrier. Alternatively, the loss of the February low of $71.43 (February 5) may bring the critical $70.00 barrier back into sight, followed by the 2024 bottom of $69.31 (January 3). The breach of the latter may open the door to a move to the December 2023 low of $67.74 (December 13), which comes before the June 2023 low of $66.85 (June 12).
Resistance levels: $77.25 $78.11 $79.25 (4H chart)
Support levels: $73.88 $71.37 $70.59 (4H chart)
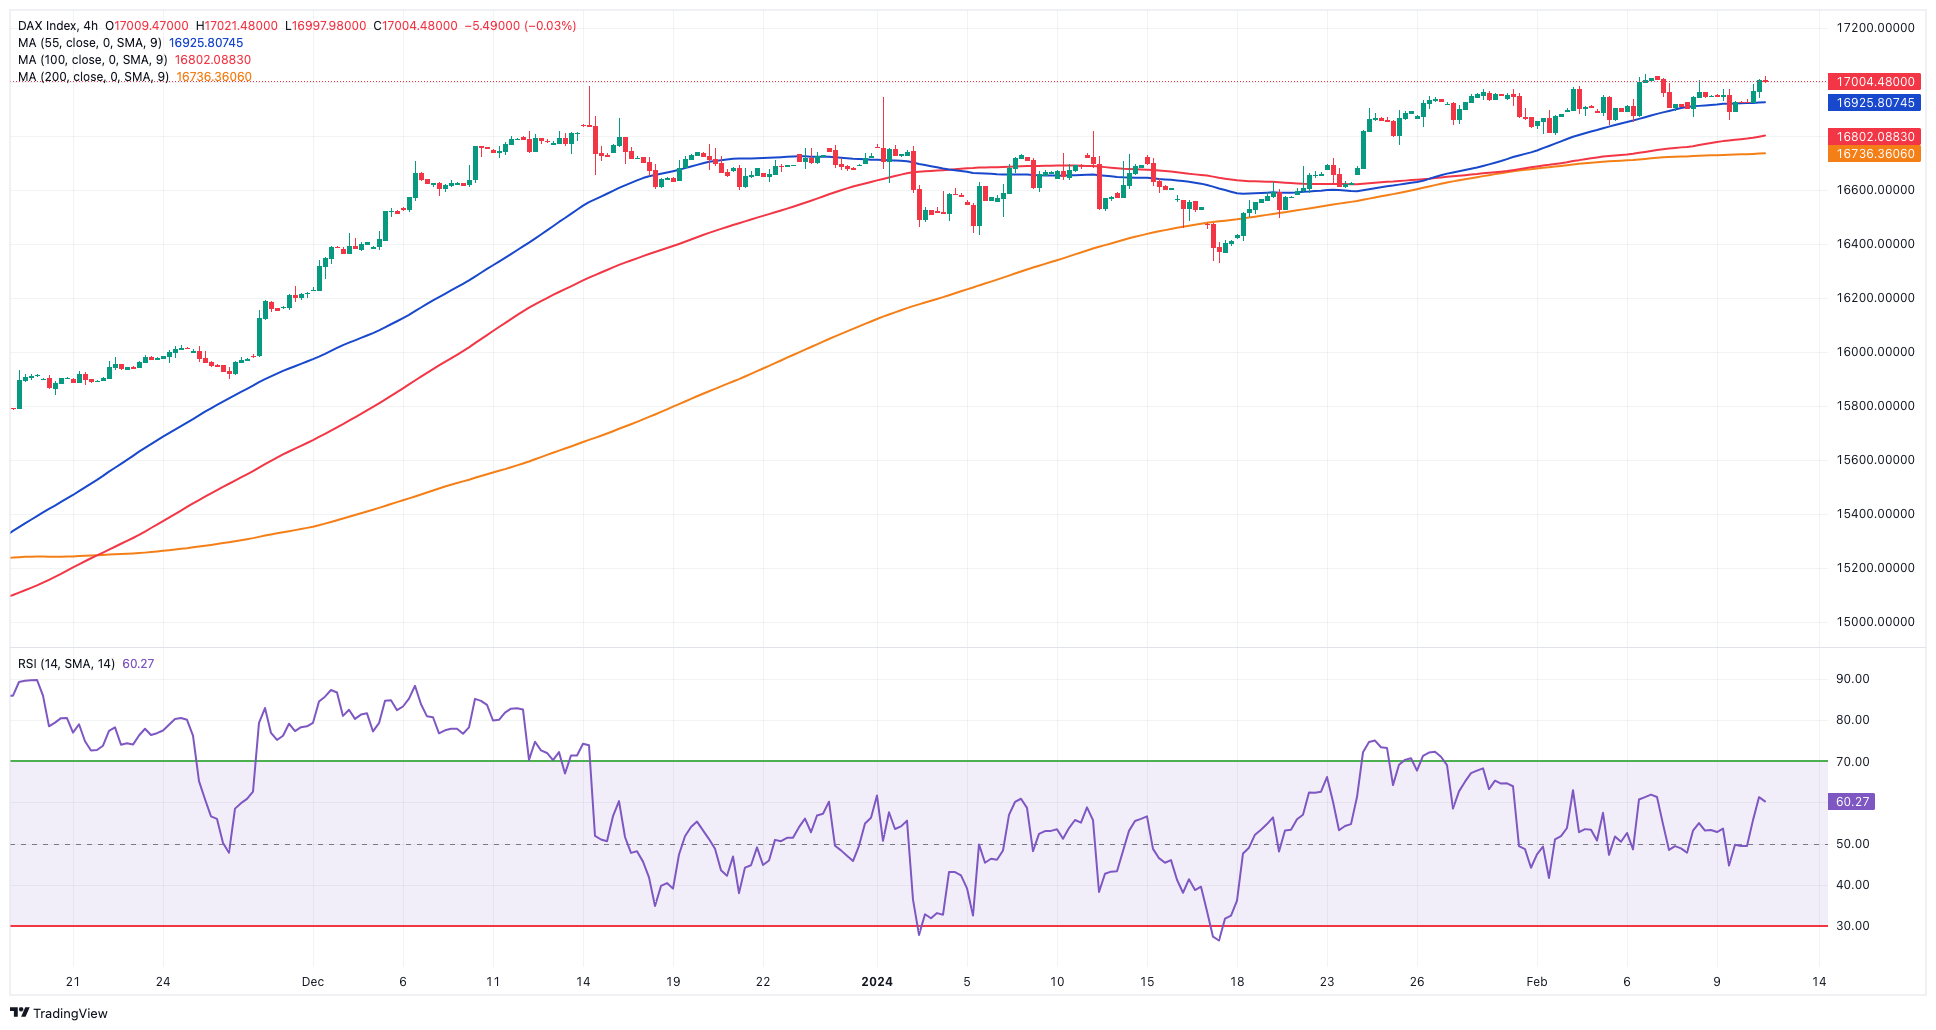
GER40
European markets kicked off the new trading week in a “sea of green”, lifting Germany’s benchmark DAX40 to the proximity of its all-time high past the 17000 threshold.
The generalized upbeat mood among investors followed positive results from corporate earnings reports, while uncertainty around the potential timing of the start of the ECB easing cycle also helped with the upward bias.
The auspicious performance of the DAX40 came in contrast to the small downtick in 10-year bund yields, which halted three consecutive daily advances.
The DAX40's next upward barrier is its all-time high of 17049 (February 6). The other way around, there is immediate support at the February low of 16821 (February 1), which is followed by the temporary 55-day SMA at 16661 and the 2024 bottom at 16345 (January 17). Once the index clears the latter, it is likely to reach the 200-day SMA at 15985 before dropping to the weekly low of 15915 (November 28). The October 2023 low of 14630 (October 23) comes next, before the March 2023 low of 14458 (March 20). The daily RSI climbed to the boundaries of 62.
Best Performers: Siemens Energy AG, Rheinmetall AG, Zalando SE
Worst Performers: Sartorius AG VZO, Airbus Group, SAP
Resistance levels: 17049 (4H chart)
Support levels: 16821 16462 16345 (4H chart)
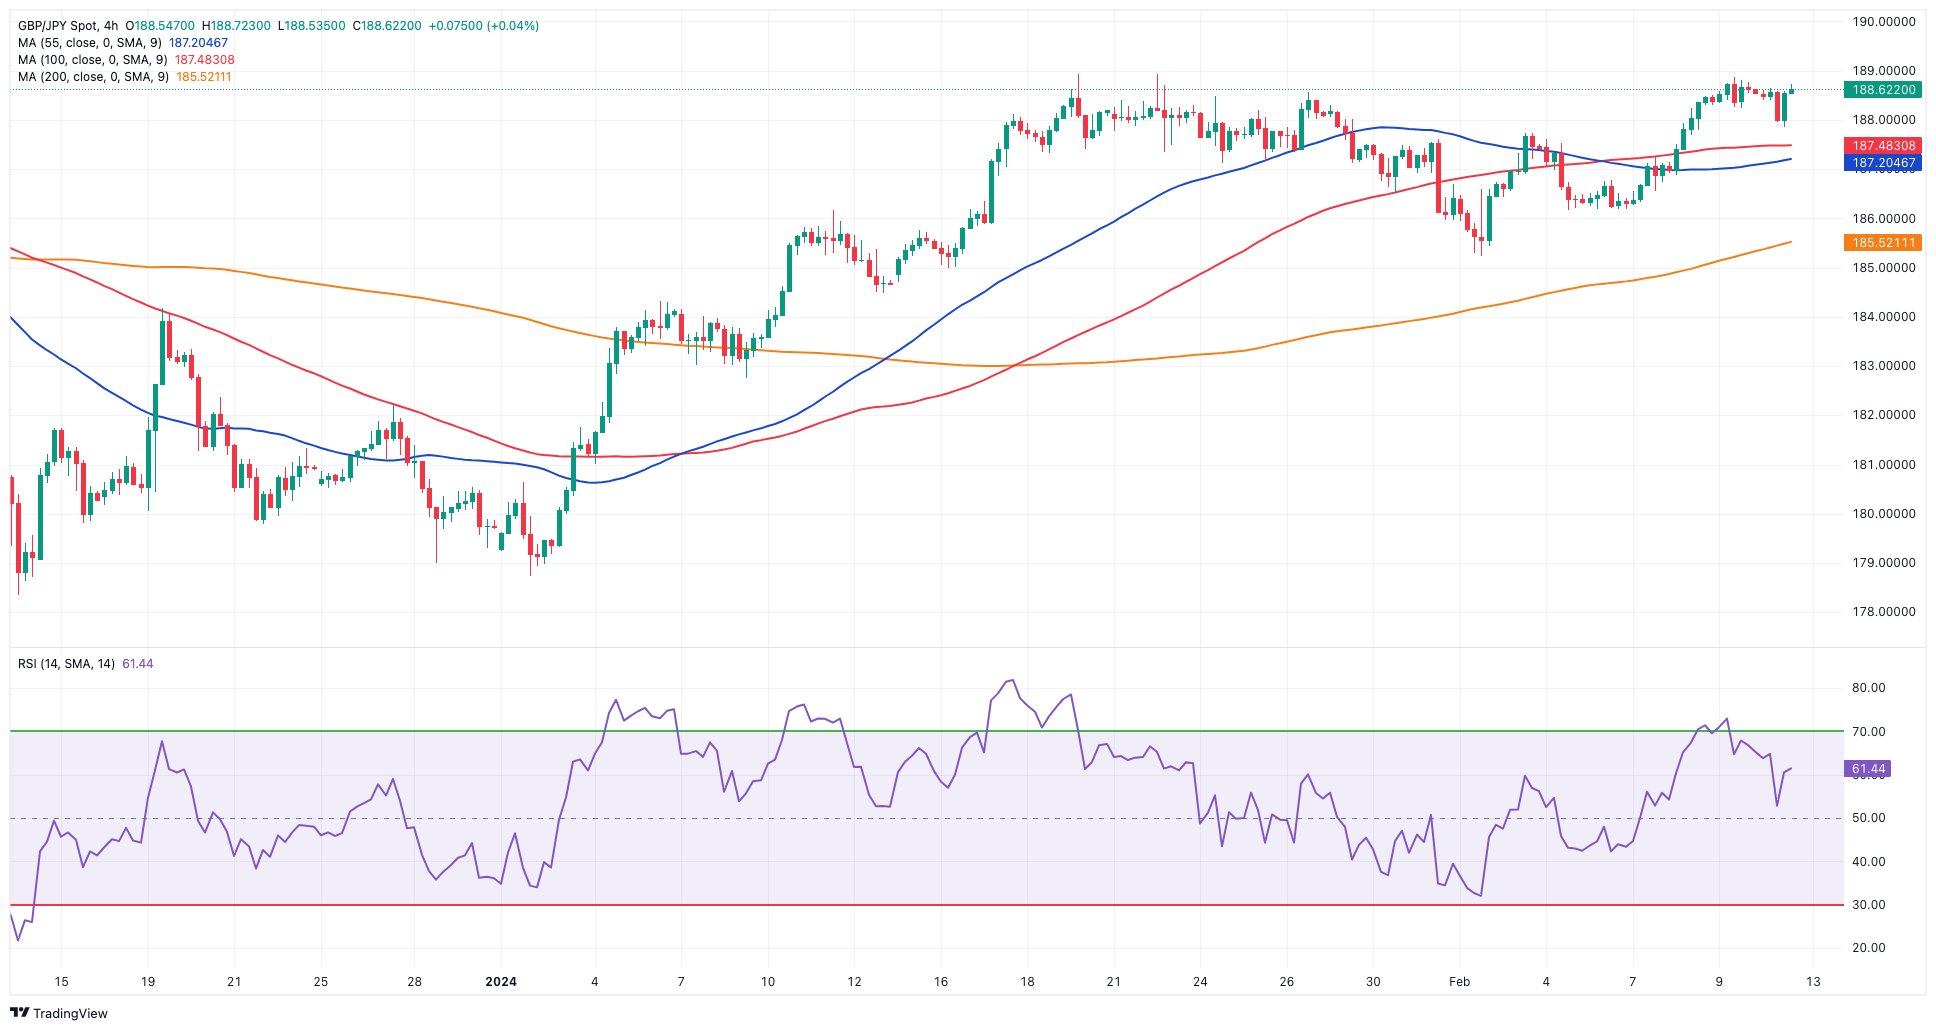
GBPJPY
The mild advance in the British pound seems to have been enough to prompt the fourth session in a row of gains in GBP/JPY, which remained at shouting distance from the yearly peaks just below the 189.00 level on Monday.
The small retracement in the Japanese yen also propped up the upward bias in the cross, which continued to face a strong hurdle in the area just ahead of 189.00.
A sustainable break above this region could encourage the cross to embark on a probable visit to the June 2015 highs near 196.00.
GBP/JPY continues to face the next hurdle at the 2024 high of 188.93 (January 19) surpassing the round number of 190.00 and the August 2015 record of 195.28. If bears gain control, spot may return to its February low of 185.22 (February 1) before attempting to break through intermediate support at the 55-day and 100-day SMAs of 184.86 and 184.18, respectively. If the cross breaks over this level, it may target the more critical 200-day SMA at 182.01, before the December 2023 bottom of 178.33 (December 14) and the October 2023 low of 178.03. (October 3). The failure of this zone may bring a test of the July 2023 bottom at 176.30 before the May 2023 low of
Resistance levels: 188.86 188.93 189.99 (4H chart)
Support levels: 187.85 186.18 185.22 (4H chart)
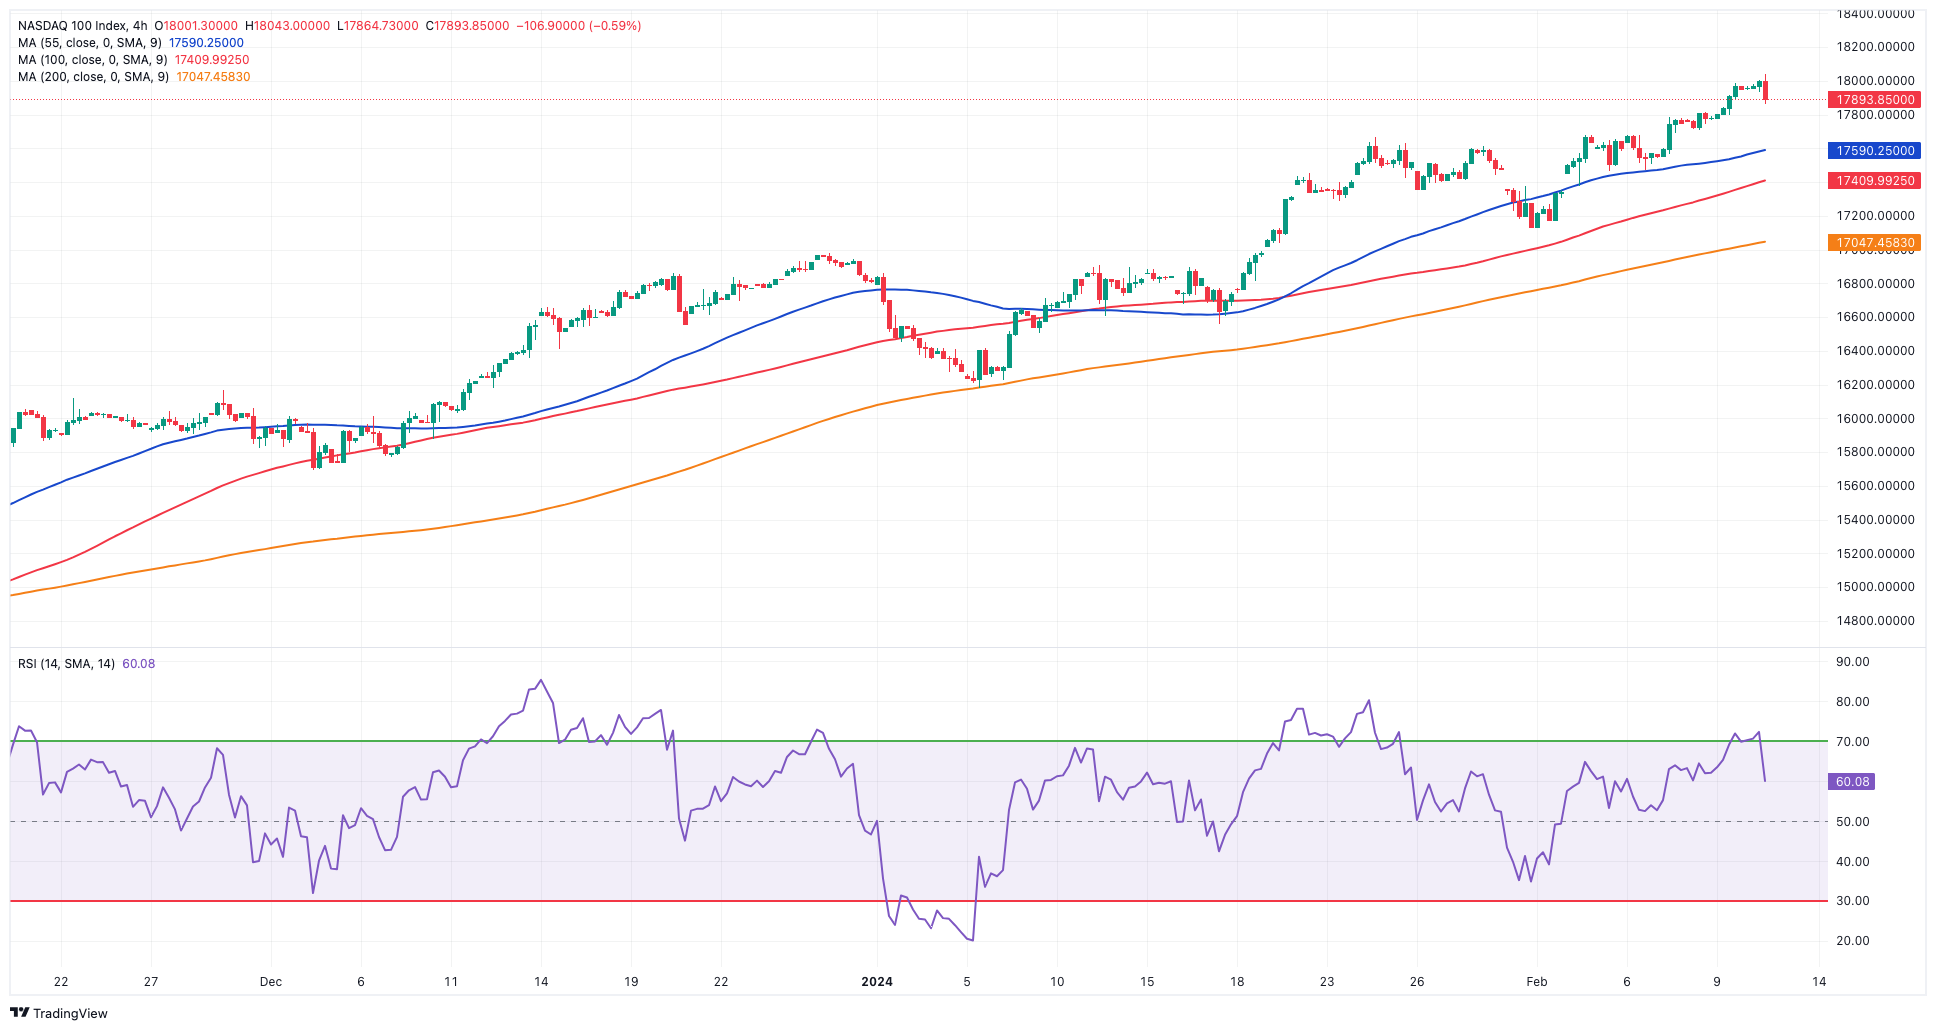
NASDAQ
On Monday, the Nasdaq 100 reached a record high just above the significant 18000 milestone, although that bullish attempt ran out of impetus and eventually dragged the index back to negative territory.
The mix of some profit-taking and caution ahead of the release of US inflation readings on Tuesday appears to have sponsored the knee-jerk in the tech index, while the weak dollar and declining yields limited the downside potential at the beginning of the week.
It is worth mentioning that the market value of chip maker NVIDIA surpassed that of Amazon for the first time in approximately two decades, driven by investors' fervour for artificial intelligence.
The Nasdaq 100 reached a new high of 18041 on February 12. Having said that, bearish attempts should initially target the weekly low of 17128 (January 31), which comes before the intermediate 55-day SMA of 16783 and the 2024 low of 16249 (January 5). If the index moves through this zone, it might hit the December 2023 low of 15695 (December 4) and the key 200-day SMA of 15371. The loss of this area may cause a decline to the October 2023 bottom of 14058 (October 26) to begin looming on the horizon prior reaching the April 2023 low of 12724 (April 25), the March 2023 low of 11695 (March 13), and the 2023 low of 10696 (January 3). In the daily chart, the RSI slipped back below the 70 mark.
Top Gainers: Diamondback, Airbnb, The Trade Desk
Top Losers: Constellation Energy, Tesla, CrowdStrike Holdings
Resistance levels: 18041 (4H chart)
Support levels: 17128 16561 16249 (4H chart)
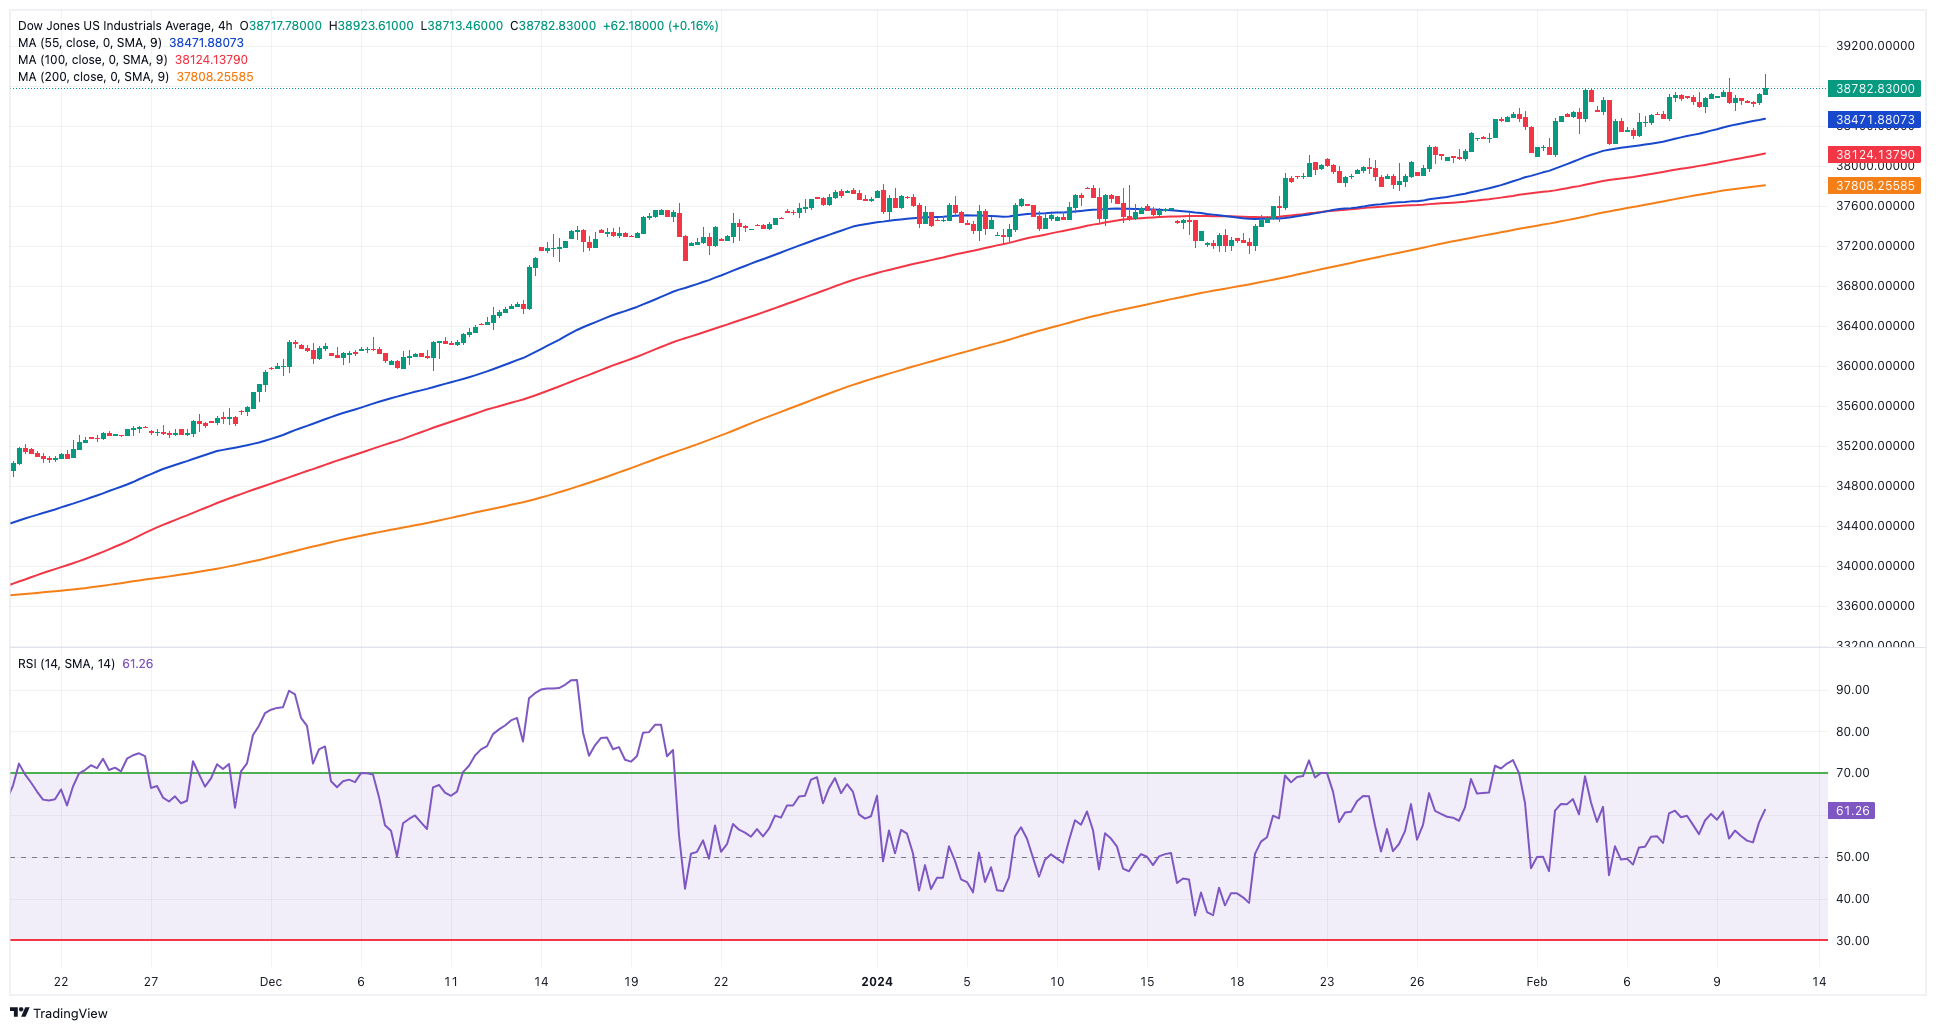
DOW JONES
In tandem with most US markets, the Dow Jones climbed further and reached a new all-time top at shouting distance from the 39000 threshold on Monday.
Adding to the prevailing optimism, the S&P 500 extended its move north of the 5000 mark and clinched fresh tops, while the tech reference Nasdaq Composite poked once again with the area beyond 16000.
In the meantime, hopes of further auspicious results from corporate earnings reports and prospects of interest rate cuts by the Fed in the next few months continued to underpin the broad-based bullish mood among investors.
At the beginning of the week, the Dow Jones gained 0.56% to 38887, the S&P 500 rose 0.10% to 5031, and the tech-heavy Nasdaq Composite dropped 0.13% to 15970.
Immediately on the upside for the Dow Jones aligns the all-time high of 38927 (February 12). Instead, there is immediate support at the 2024 low of 37122 (January 18), which comes before the weekly low of 37073 (December 20, 2023). The breakdown of this level suggests a potential challenge to the intermediate 100-day SMA at 35736 before the 200-day SMA at 34999. Down from here emerges the weekly low of 33859 (November 7, 2023) prior to the October 2023 low of 32327 (October 27) and the 2023 low of 31429 (March 15). The daily RSI rose past 68.
Top Performers: Intel, Goldman Sachs, Nike
Worst Performers: Salesforce Inc, Microsoft, UnitedHealth
Resistance levels: 38927 (4H chart)
Support levels: 38106 37122 36021 (4H chart)
MACROECONOMIC EVENTS

All Information & Updates provided by:

All information relating to the financial markets available on this page has been prepared and issued by FXStreet (Forexstreet SL, Spain, Reg: B62498233) on the basis of publicly available information and all information believed to be reliable and does not conflict with Kuwaiti local laws, and all necessary care has been taken to before the company to ensure that the facts mentioned are correct from the source.
NCM Investment nor any of its directors or employees shall in any way be held responsible for the contents of this news, and the information contained on this page is intended only to provide clients with publicly available information and should not be construed as investment advice, report or analysis and/or constitute an offer or invitation to buy or sell financial instruments of any kind.
RISK WARNING: Forex and CFDs are highly risky leveraged products, as losses can exceed deposits. Please ensure you understand all the risks and take independent advice if necessary. NCM will segregate the clients based on the criteria of the regulator and its bylaws. NCM does not provide any advisory service; the material published does not constitute advice or a recommendation for a transaction in any financial instrument. NCM accepts no responsibility for any use of the content presented and any consequences of that use. Anyone acting on the information provided does so at their own risk.