
- Contact Us:
-

-

-

-


Daily Market Updates
14 Feb 2024
EURUSD
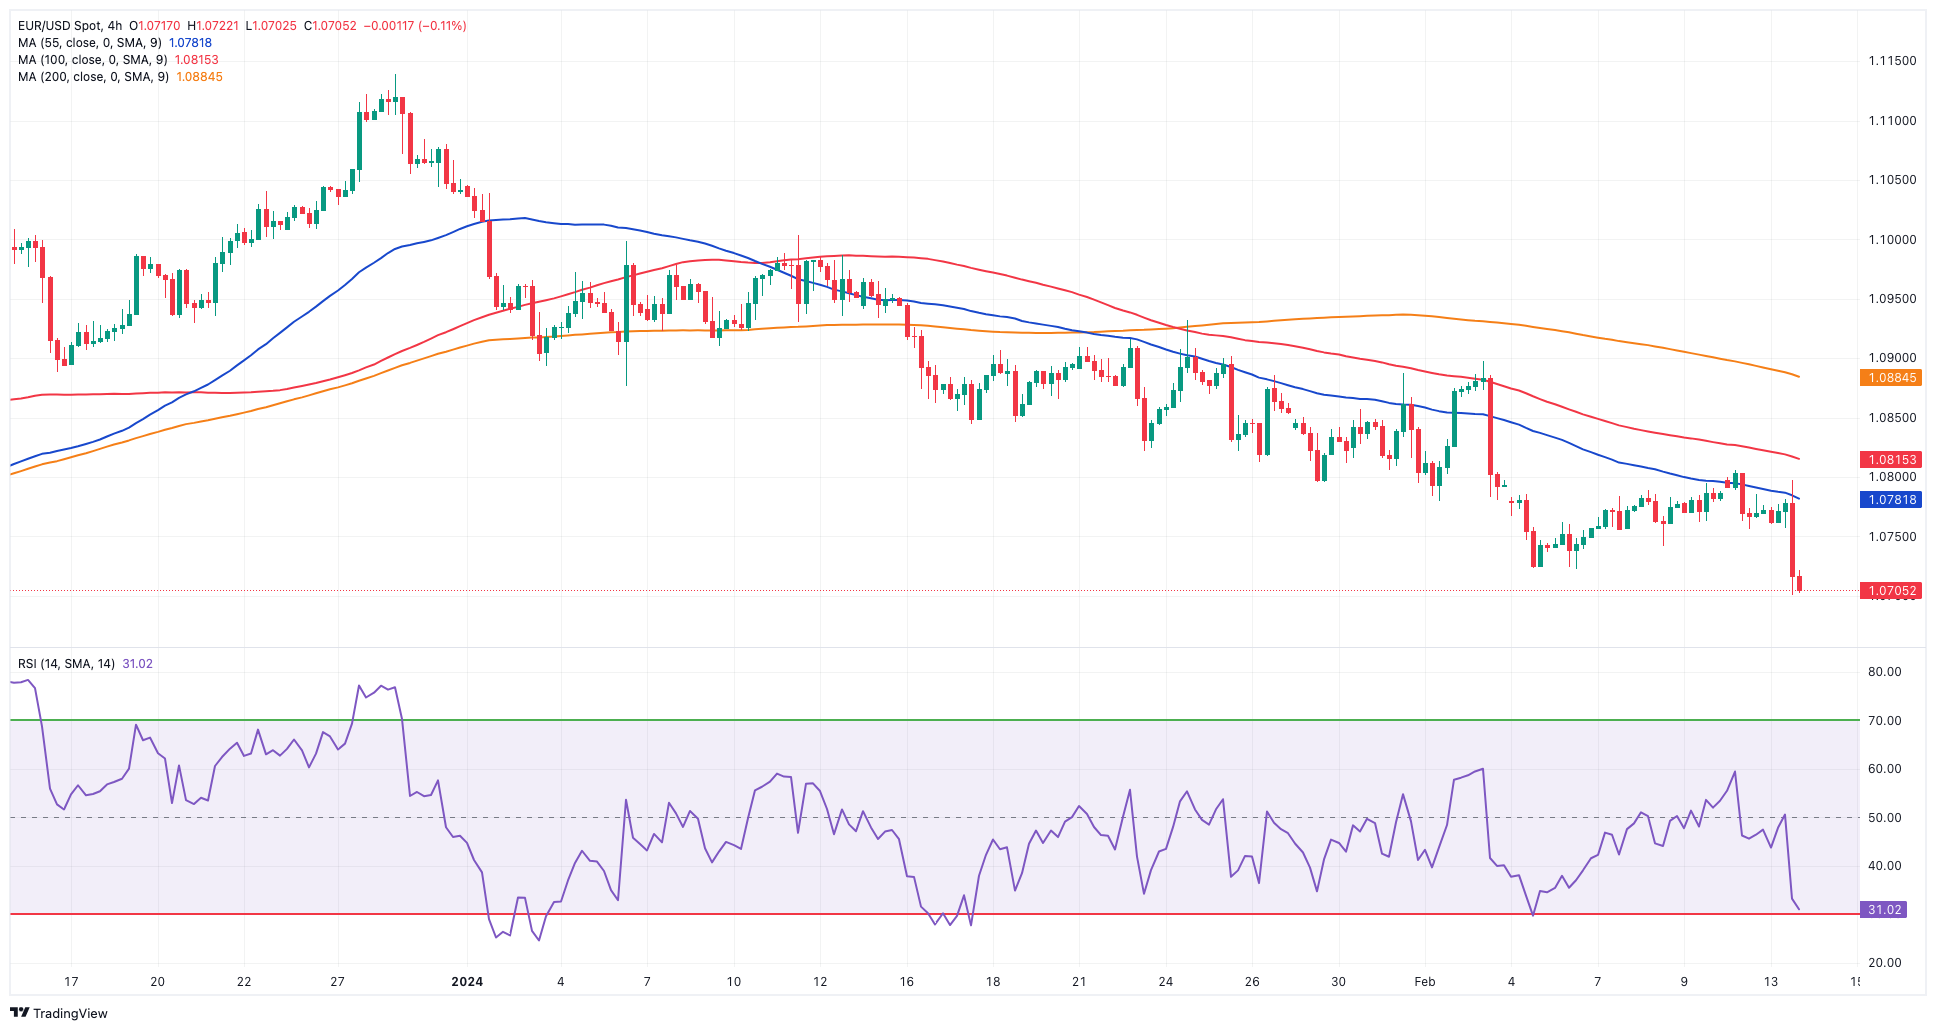
The CPI-driven strong rebound in the greenback prompted EUR/USD to sharply retreat and challenge the 1.0700 region on turnaround Tuesday, printing at the same time new yearly lows.
On the flip side of the coin, the greenback rose to levels last seen in mid-November, around 104.90, boosted by the advance to multi-week tops in US yields across different timeframes after US inflation figures rose more than initially forecasted in January.
Indeed, tracked by the headline CPI, consumer prices rose 3.1% YoY and held steady at 3.9% over the last twelve months when it comes to the Core CPI. On a monthly basis, the headline CPI rose by 0.3% and the Core print gained 0.4% MoM, both readings also coming above estimates.
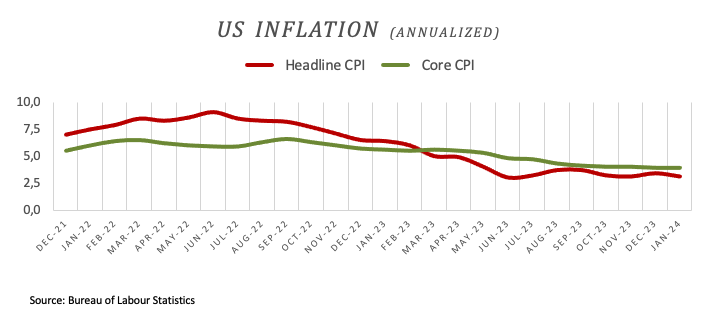
The stronger-than-expected inflation prints immediately prompted investors to start pencilling in a potential rate cut in June, while the probability of a similar move in May was drastically reduced to around 35%, according to CME Group’s FedWatch Tool.
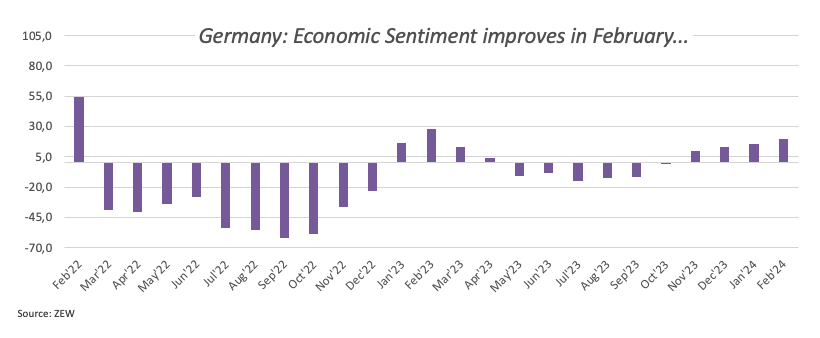
On the domestic docket, the Economic Sentiment in both Germany and the broader Euroland continued to improve in February, this time to 19.9 and 25.0, respectively.
The immediate target of the current EUR/USD comeback is the crucial 200-day SMA at 1.0829, followed by the intermediate 55-day SMA at 1.0890 and the weekly high at 1.0932 (January 24). Further north, another weekly top of 1.0998 (January 5, 11) strengthens the 1.1000 threshold and arrives ahead of the December 2023 peak of 1.1139 (December 27). This level is also supported by the 200-week SMA at 1.1148, which precedes the 2023 high of 1.1275 (July 18). In the other direction, if sellers break through the 2024 low of 1.0700 (February 13), spot may fall further to the weekly low of 1.0495 (October 13, 2023), ahead of the 2023 low of 1.0448 (October 3) and the round level of 1.0400. The daily RSI dropped to the sub-35 zone.
Resistance levels: 1.0805 1.0897 1.0932 (4H chart)
Support levels: 1.0700 1.0656 1.0516 (4H chart)
USDJPY
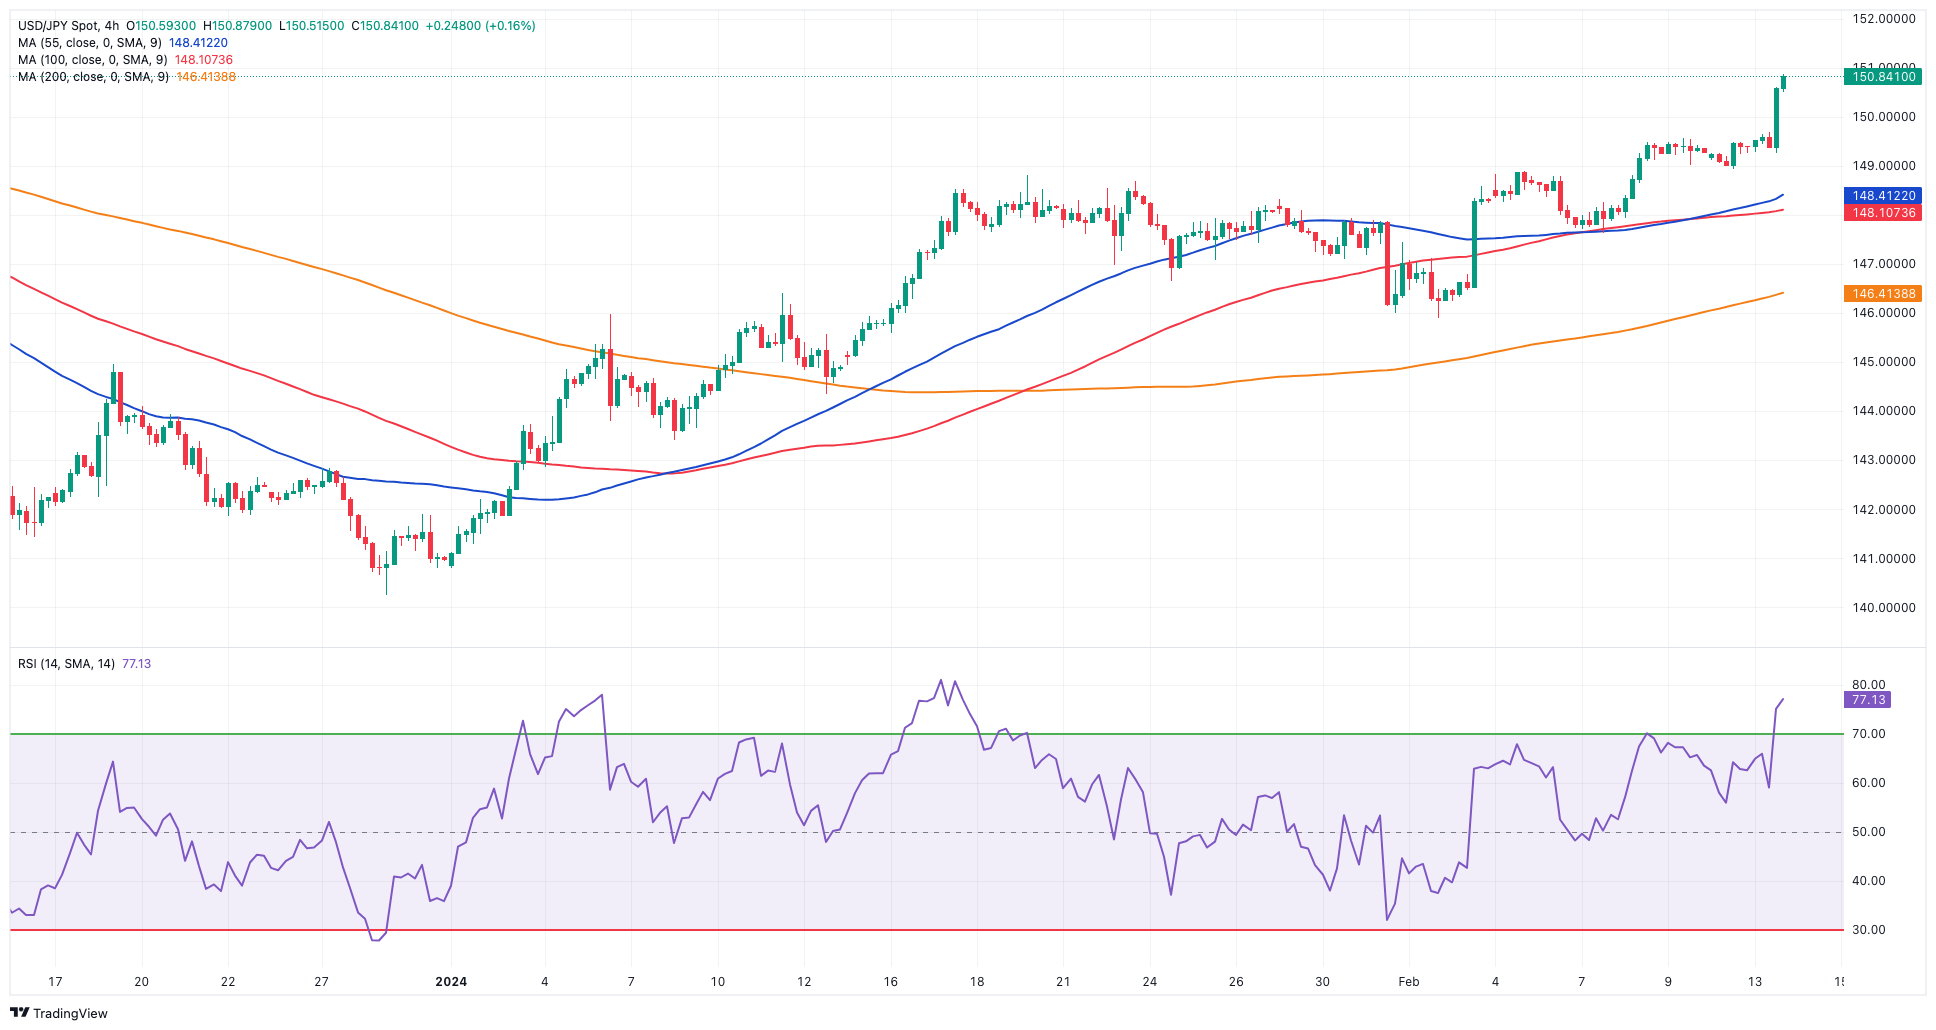
USD/JPY rose well north of the key 150.00 hurdle on Tuesday, an area last visited in mid-November.
Indeed, the pair gathered extra steam after higher-than-expected US inflation figures in January sparked a change of heart around the greenback, lifting the USD Index (DXY) to fresh yearly highs.
By the same token, US yields climbed to multi-week tops across the curve on the back of further repricing of a rate cut by the Fed, which is now seen in June.
In Japan, Producer Prices came in flat on a monthly basis in January and rose 0.2% over the last twelve months.
If the recovery continues, USD/JPY may confront the 2023 high of 151.90 (November 13). Further north, the 2022 top of 151.94 (October 21) comes just before the round number of 152.00. Quite the opposite, the present focus is on the February low of 145.89 (February 1), which is supported by the preliminary 55-day SMA at 145.78. The important 200-day SMA of 145.07 precedes the December 2023 bottom of 140.24 (December 28), as well as the round number of 140.00, all before the July low of 137.23 (July 14). The everyday RSI flirted with the overbought region near 70.
Resistance levels: 150.80 151.43 151.90 (4H chart)
Support levels: 148.92 147.61 145.89 (4H chart)
GBPUSD
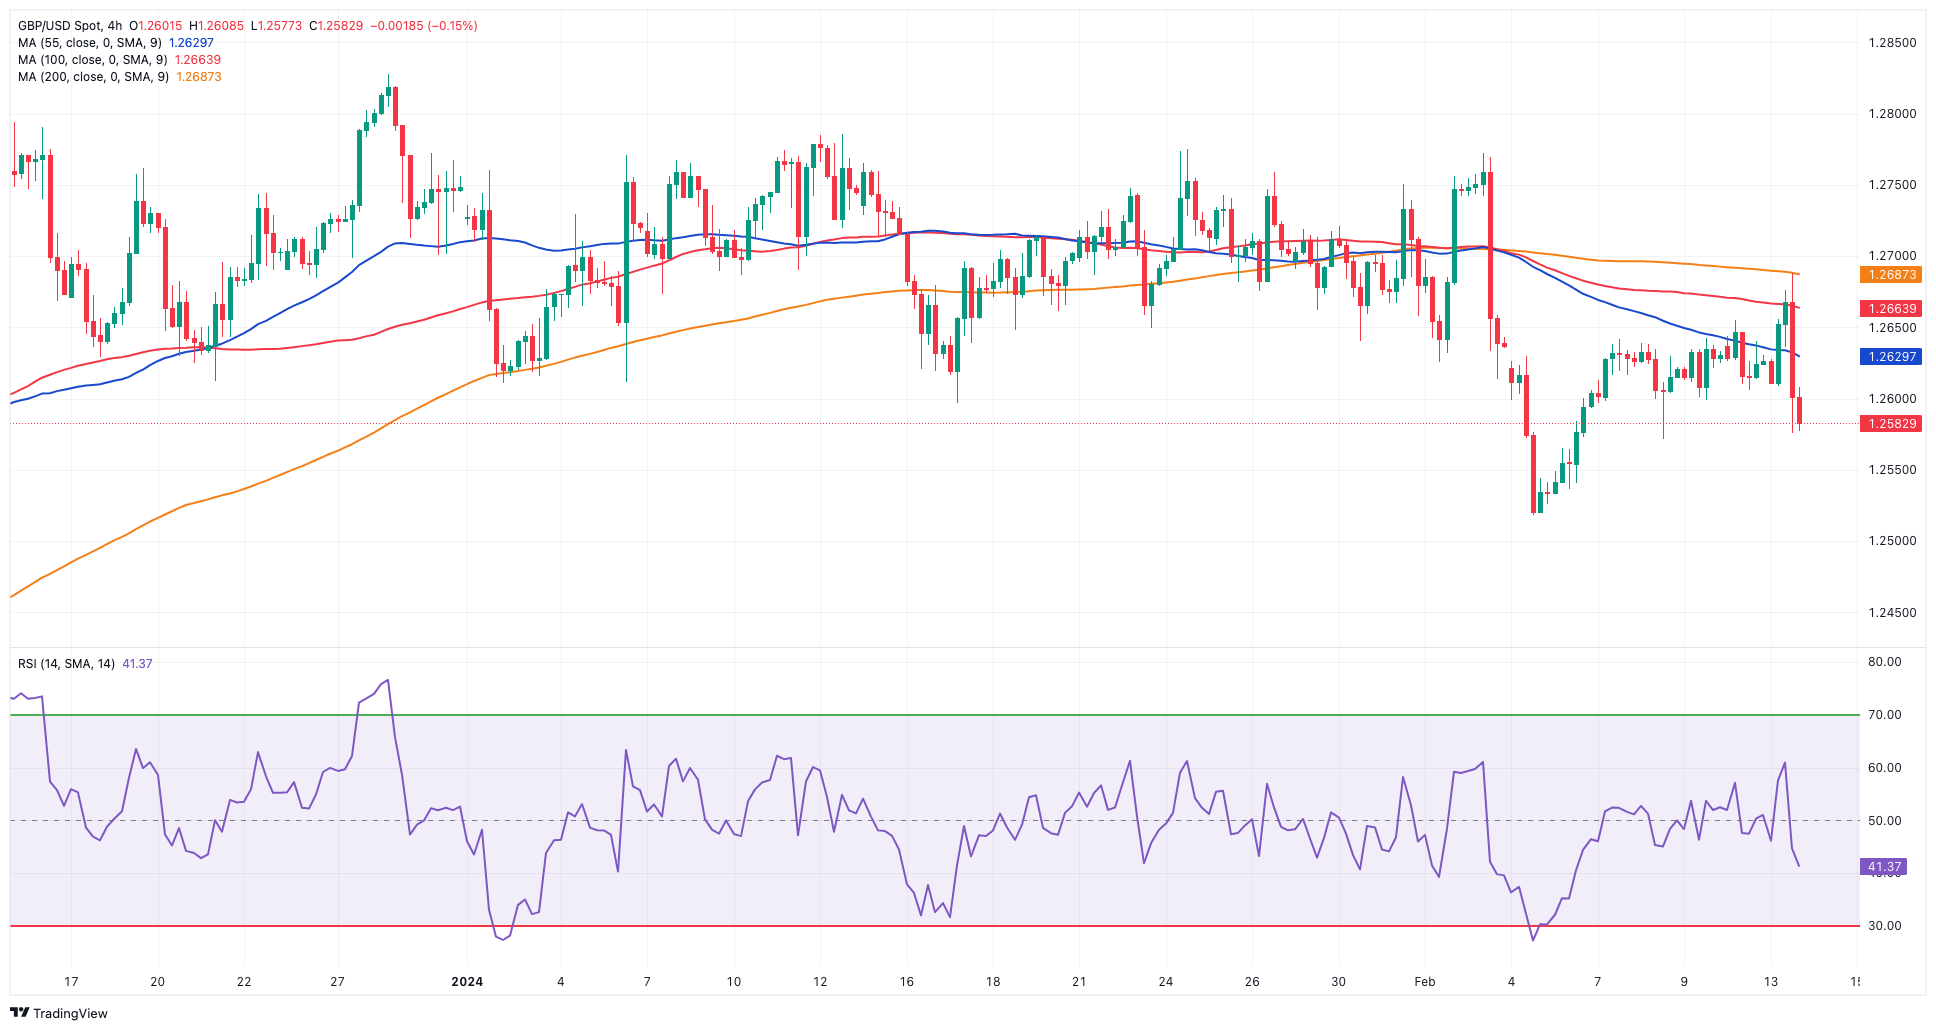
In line with the rest of the risk-linked universe, the British pound surrendered its initial move to multi-session tops and eventually succumbed to the sharp bounce in the greenback, dragging GBP/USD to the vicinity of 1.2570, where some initial contention appears to have emerged.
In fact, the dollar gathered strong upside pressure after US inflation figures surprised to the upside in January, magnifying at the same time speculation of a potential interest rate cut by the Fed at the June 12 gathering.
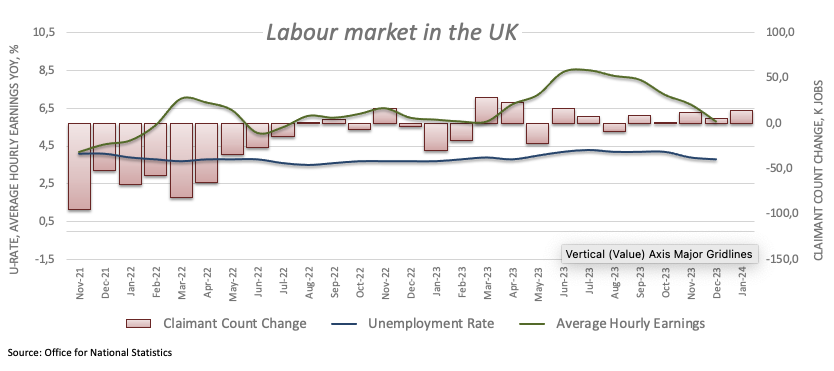
In the UK, auspicious prints from the domestic labour market report lent support to the quid and propelled Cable to fresh tops after the jobless rate eased to 3.8% in December. the Employment Change increased by 72K individuals, Average Earnings Inc. Bonus rose 5.8% from a year earlier, and the Claimant Count Change rose by 14.1K people.
Breaching the 2024 low of 1.2518 (February 5), reveals the December 2023 bottom of 1.2500 (December 13). Extra weakness may cause GBP/USD to target the weekly low of 1.2187 (November 10, 2023), before reaching the October 2023 low of 1.2037 (October 3), seconded by the critical 1.2000 mark, and the 2023 bottom of 1.1802 (November 10, 2023). On the upside, the weekly top at 1.2683 offers initial resistance, ahead of the 2024 peak at 1.2785 (January 12). Further up is the December high of 1.2827 (December 28), prior to the weekly top of 1.2995 (July 27, 2023), which is just shy of the crucial 1.3000 yardstick. The RSI on the daily chart dropped to the vicinity of 43.
Resistance levels: 1.2654 1.2688 1.2772 (4H chart)
Support levels: 1.2575 1.2500 1.2448 (4H chart)
GOLD
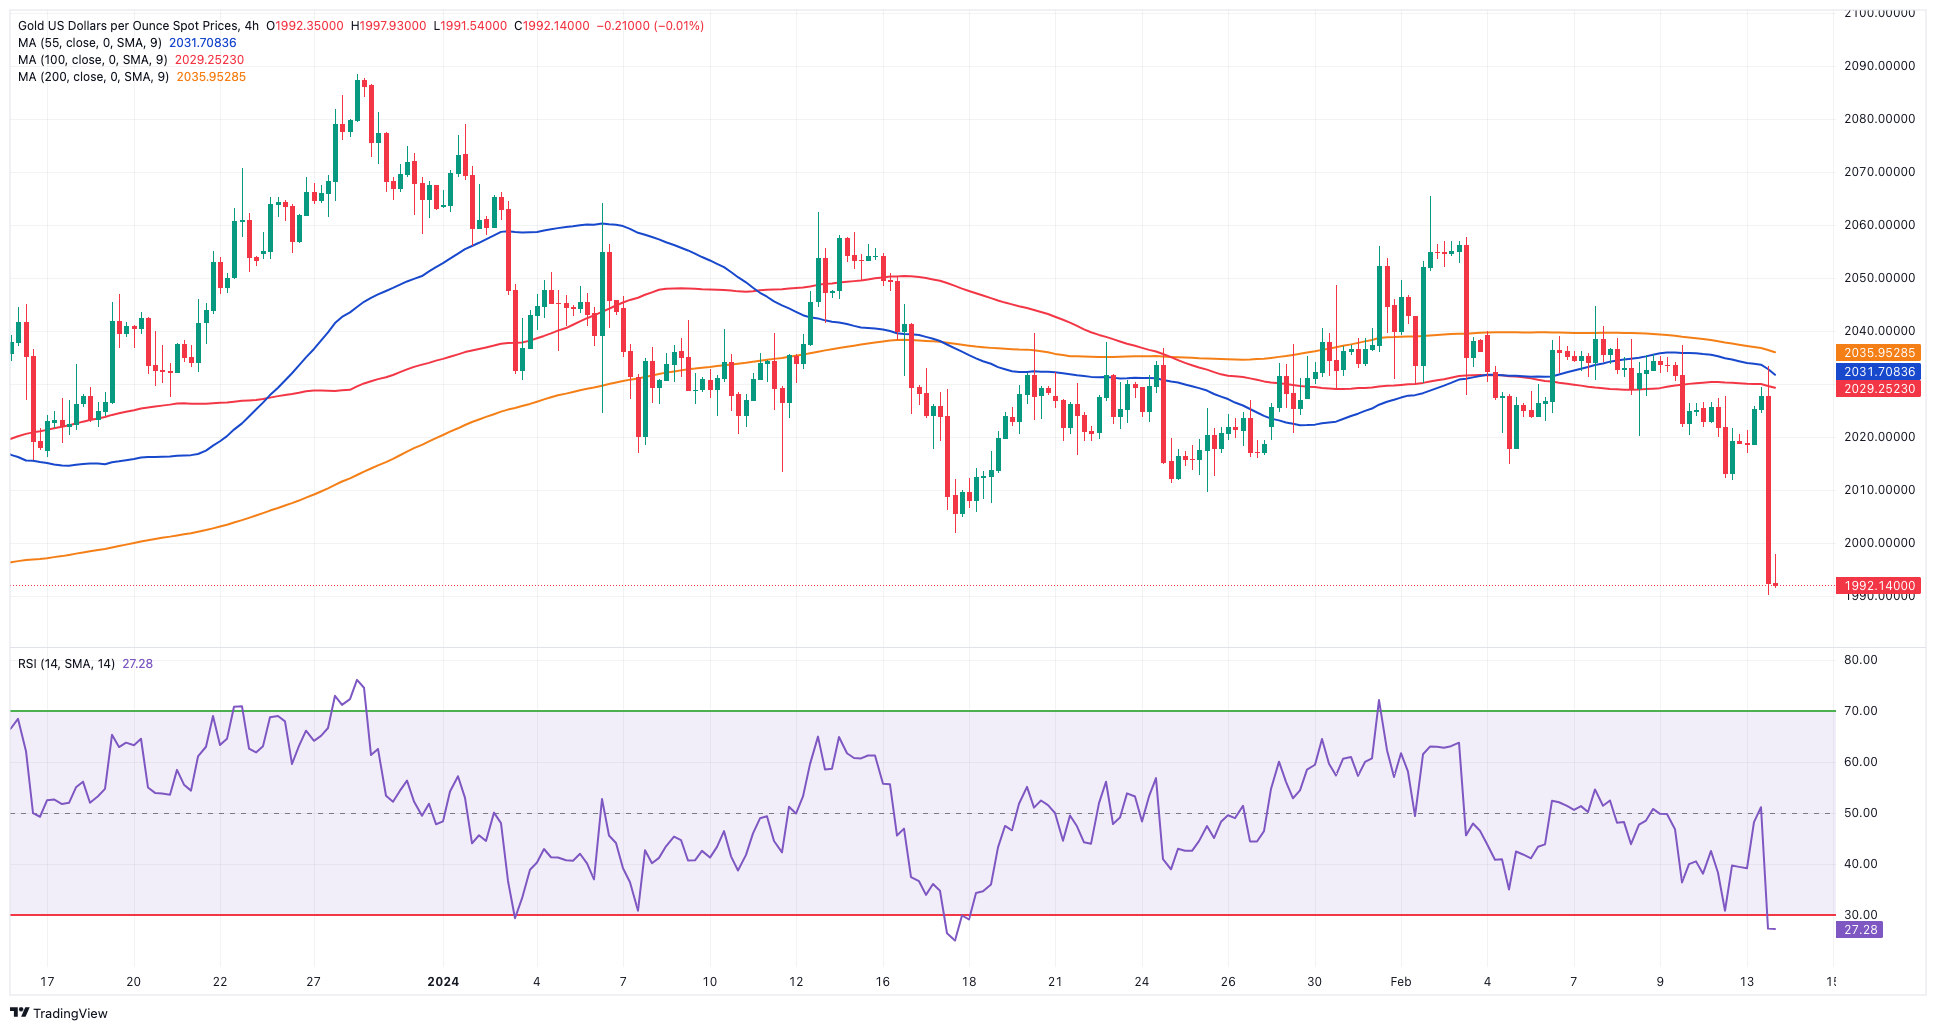
There was no respite for the downward trend in gold prices on turnaround Tuesday.
The yellow metal retreated for the fifth consecutive session, this time accelerating its decline to the sub-$2,000 region per troy ounce for the first time since mid-December, an area also coincident with the transitory 100-day SMA.
The persistent deterioration of the precious metal this came was magnified by the sharp uptick in the dollar and the equally strong march north in US yields across the curve, all following the positive surprise from US inflation figures for the month of January.
Further losses may send gold to the December 2023 low of $1,973, which is supported by the 200-day SMA at $1,965. A further drop might bring the November 2023 bottom of $1,931 back into view, ahead of the October 2023 low of $1,810, the 2023 low of $1,804, and the $1,800 contention zone. Instead, bullish attempts may push the metal to revisit the February peak of $2,065 (February 1) ahead of the weekly high of $2,088 (December 28), and the all-time top of $2,150. (December 4, 2023).
Resistance levels: $2,035 $2,044 $2,065 (4H chart)
Support levels: $1,990 $1,973 $1,965 (4H chart)
CRUDE WTI
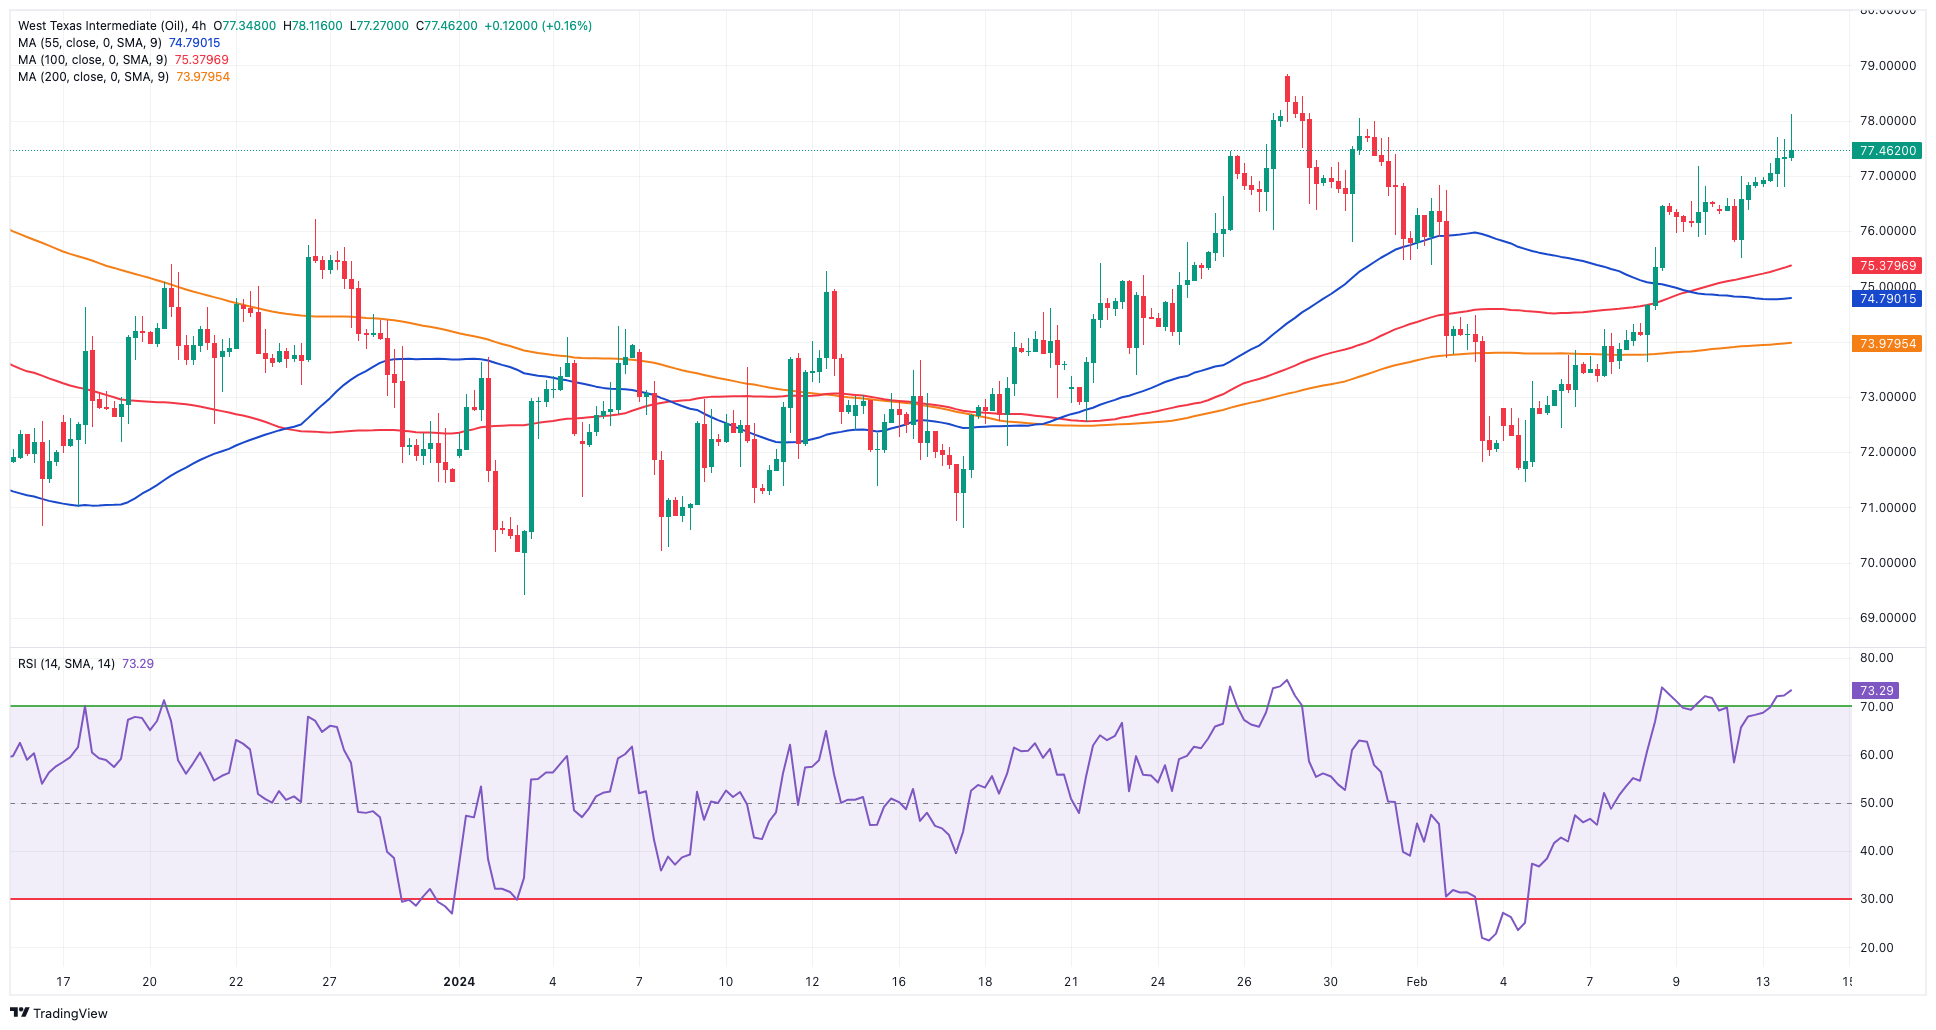
Prices of WTI extended their positive streak for yet another session, this time surpassing the $78.00 mark per barrel on Tuesday.
Persistent geopolitical concerns on the Russia-Ukraine front, the Middle East, and the Red Sea crisis continued to underpin higher crude oil prices, while the upbeat tone from the OPEC’s monthly report also added to the ongoing rally.
On the latter, the cartel maintained its projection for robust growth in global oil demand throughout this year and 2025 while also revising its economic growth forecasts upward for both years, citing additional upside potential. Additionally, global oil demand is expected to increase by 2.25 mbpd in 2024 and by 1.85 mbpd in 2025. These forecasts remained unchanged from the previous month.
The next upward obstacle for WTI is at the February top at $78.44, prior to the 2024 peak of $79.25 (January 29), which is immediately followed by the huge $80.00 barrier and the November 2023 high of $80.15 (November 3). Extra gains from here may propel the commodity back to its weekly top of $89.83 (October 18, 2023), ahead of the 2023 peak of $94.99 (September 28, 2023) and the August 2022 high of $97.65 (August 30), all before the psychological $100.00 barrier. Having said. that, the loss of the February low of $71.43 (February 5) might bring the important $70.00 barrier back into view, followed by the 2024 bottom of $69.31 (January 3). The breakdown of the latter may open the way for a transfer to the December 2023 low of $67.74 (December 13), prior to the June 2023 low of $66.85 (June 12).
Resistance levels: $78.44 $79.25 $79.56 (4H chart)
Support levels: $75.50 $73.95 $71.37 (4H chart)
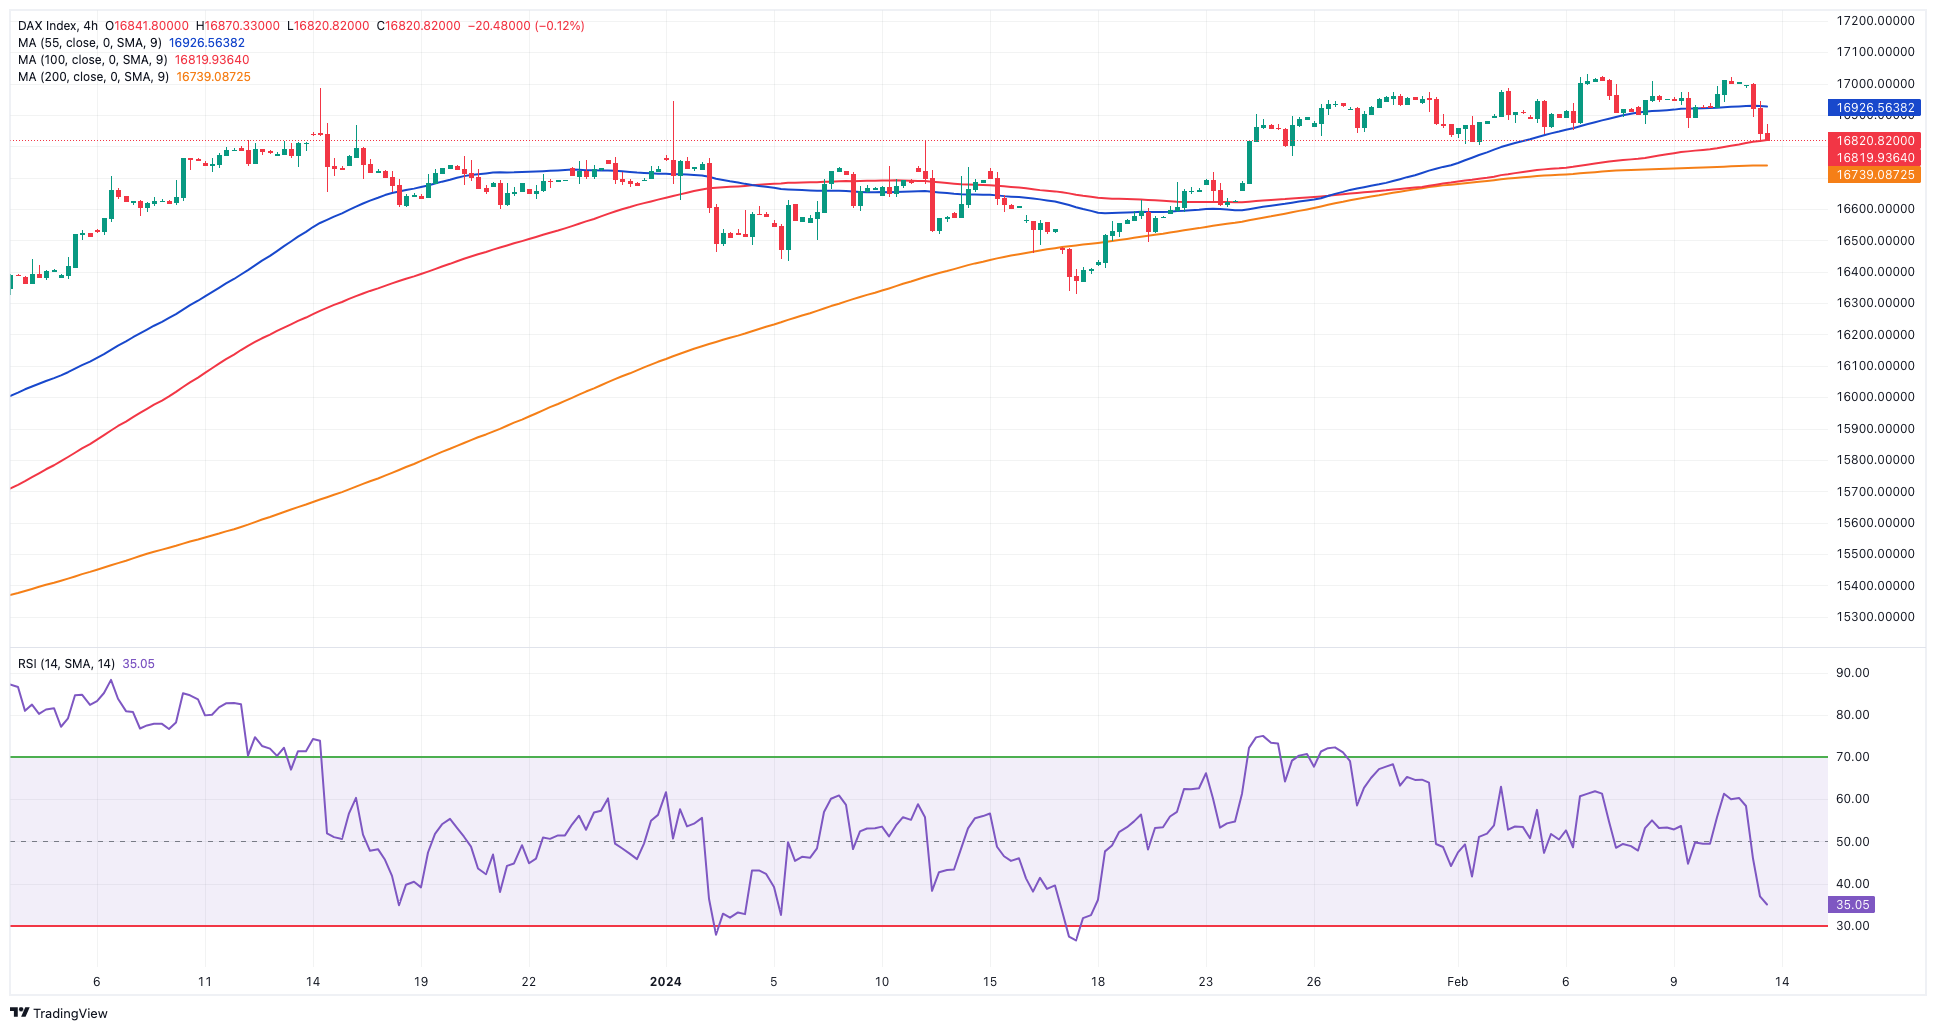
GER40
Red was the prevailing colour in markets across the old continent on Tuesday.
Against that, the German reference DAX40 flirted with monthly lows near the 16,800 region, leaving behind the quite auspicious start of the week.
In fact, European stocks dropped along with their US peers after another firm print of US inflation for the month of January, showing that consumer prices rose more than initially estimated, adding to the idea that the Fed could push back its intentions to reduce its interest rates.
On the other side, ECB’s Board member P. Lane suggested that the next move by the central bank would surely be a rate cut, although its timing remains largely data-dependent.
The downtick in the index came in contrast to another rise in 10-year bund yields, which climbed to levels last seen in early December 2023, past 2.40%.
The DAX40's next upward hurdle is its all-time top at 17,049 (February 6). In the opposite direction, the February low of 16,821 (February 1) provides immediate support, followed by the temporary 55-day SMA at 16,677 and the 2024 bottom at 16,345 (January 17). Once the index clears the latter, it is expected to reach the 200-day SMA at 15,990 before falling to the weekly low of 15,915. (November 28). The October 2023 low of 14,630 (October 23) follows next, before the March 2023 low of 14,458 (March 20). The daily RSI dropped to the vicinity of 53.
Best Performers: Rheinmetall AG, Hannover Rueck SE, Munich Re Group
Worst Performers: Infineon, SAP, Vonovia
Resistance levels: 17,049 (4H chart)
Support levels: 16,821 16,488 16,345 (4H chart)
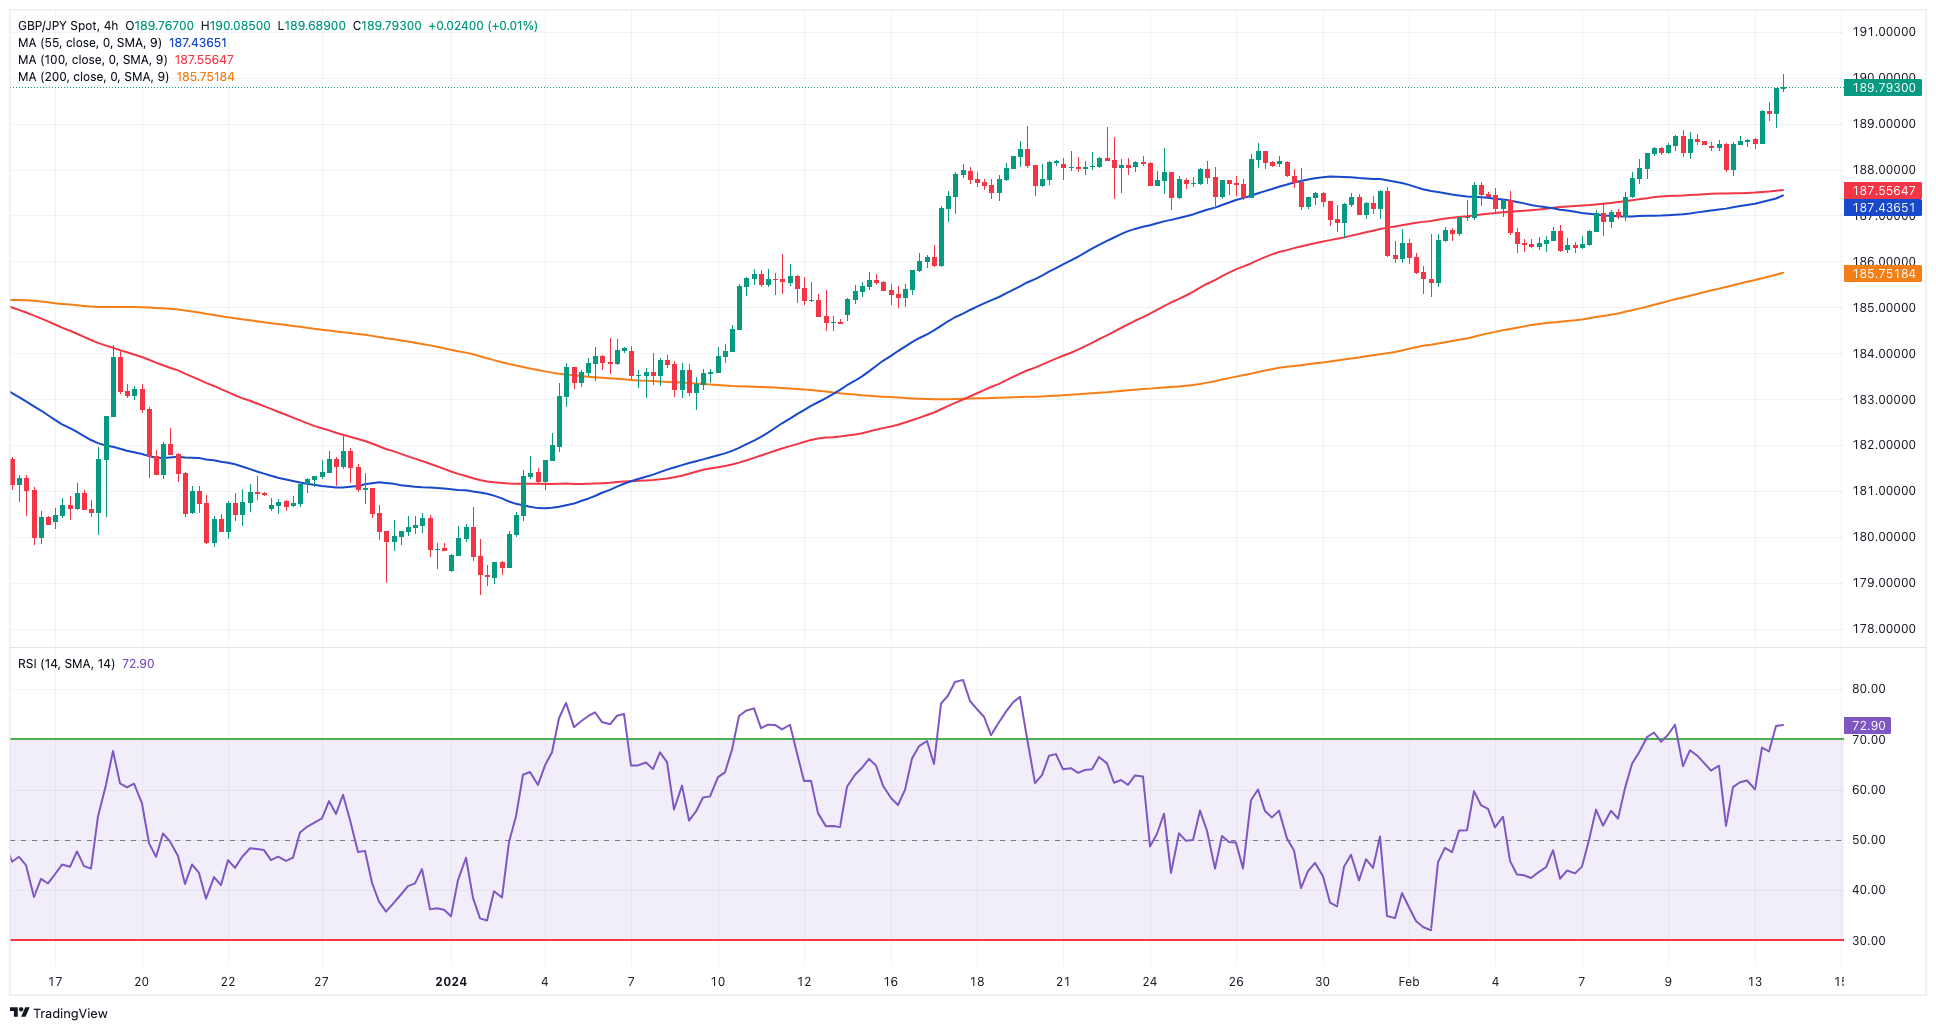
GBPJPY
The increased depreciation of the Japanese yen lent extra wings to GBP/JPY on Tuesday, pushing it to new 2024 peaks just beyond 190.00 the figure.
In fact, the higher-than-predicted US CPI supported the strong bounce in the greenback in detriment of the broader risk complex, keeping the British pound depressed while sustaining the intense selling bias in the yen.
Next on the upside for GBP/JPY aligns the 2024 high of 190.08 (February 13), prior to the August 2015 record of 195.28. If bears regain control, spot might fall to its February low of 185.22 (February 1) before attempting to break through intermediate support at the 55-day and 100-day SMAs of 184.91 and 184.34, respectively. If the cross breaches this level, it may aim for the more important 200-day SMA at 182.20, before the December 2023 bottom of 178.33 (December 14) and the October 2023 low of 178.03 (October 3). A deeper pullback could put a test of the July 2023 bottom at 176.30 back on the radar ahead of the May 2023 low of 167.84 (May 11).
Resistance levels: 190.08 195.28 195.88 (4H chart)
Support levels: 187.85 185.78 185.22 (4H chart)
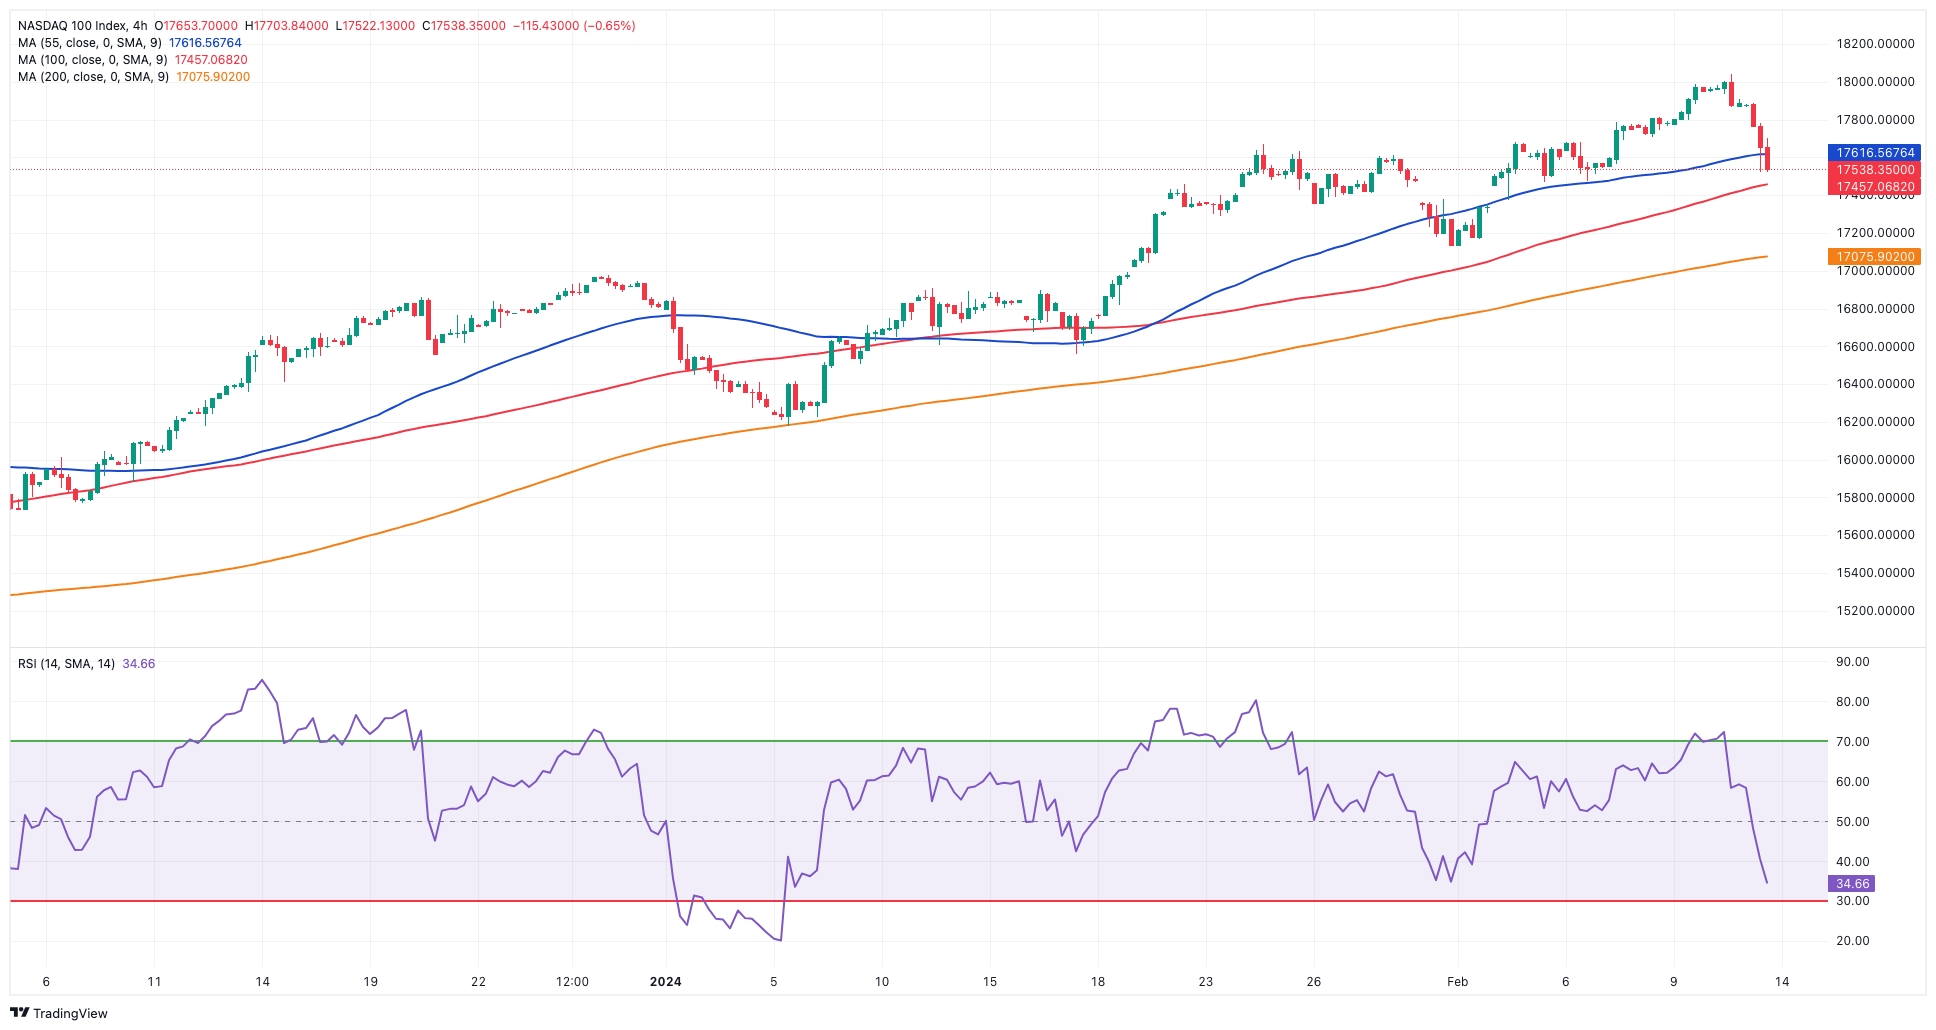
NASDAQ
The tech benchmark Nasdaq 100 retreated to multi-day lows on Tuesday, revisiting at the same time the 17,500 region.
The index added to the pessimism seen at the beginning of the week, this time in response to the strong rebound in both the greenback and US yields across the board.
The renewed weakness in the US tech sector came after a higher-than-expected US CPI in January contributed to the view that the Federal Reserve might now delay even further the start of its easing cycle, with the month of June now emerging as quite a likely candidate.
The Nasdaq 100 hit a new high of 18,041 on February 12. Just the opposite, bearish attempts should first target the weekly low of 17,128 (January 31), which comes before the intermediate 55-day SMA of 16,809 and the 2024 low of 16,249 (January 5). If the index goes through this zone, it might reach the December 2023 low of 15,695 (December 4) and the critical 200-day SMA of 15,393. The breach of this region may lead a slide to the October 2023 bottom of 14,058 (October 26), before hitting the April 2023 low of 12,724 (April 25), the March 2023 low of 11,695 (March 13), and the 2023 low of 10,696 (January 3). The daily chart shows the RSI deflating to the 55 zone.
Top Gainers: Electronic Arts, American Electric Power, O’Reilly Automotive
Top Losers: Biogen, Marriott Int, Illumina
Resistance levels: 18,041 (4H chart)
Support levels: 17,518 17,128 16,561 (4H chart)
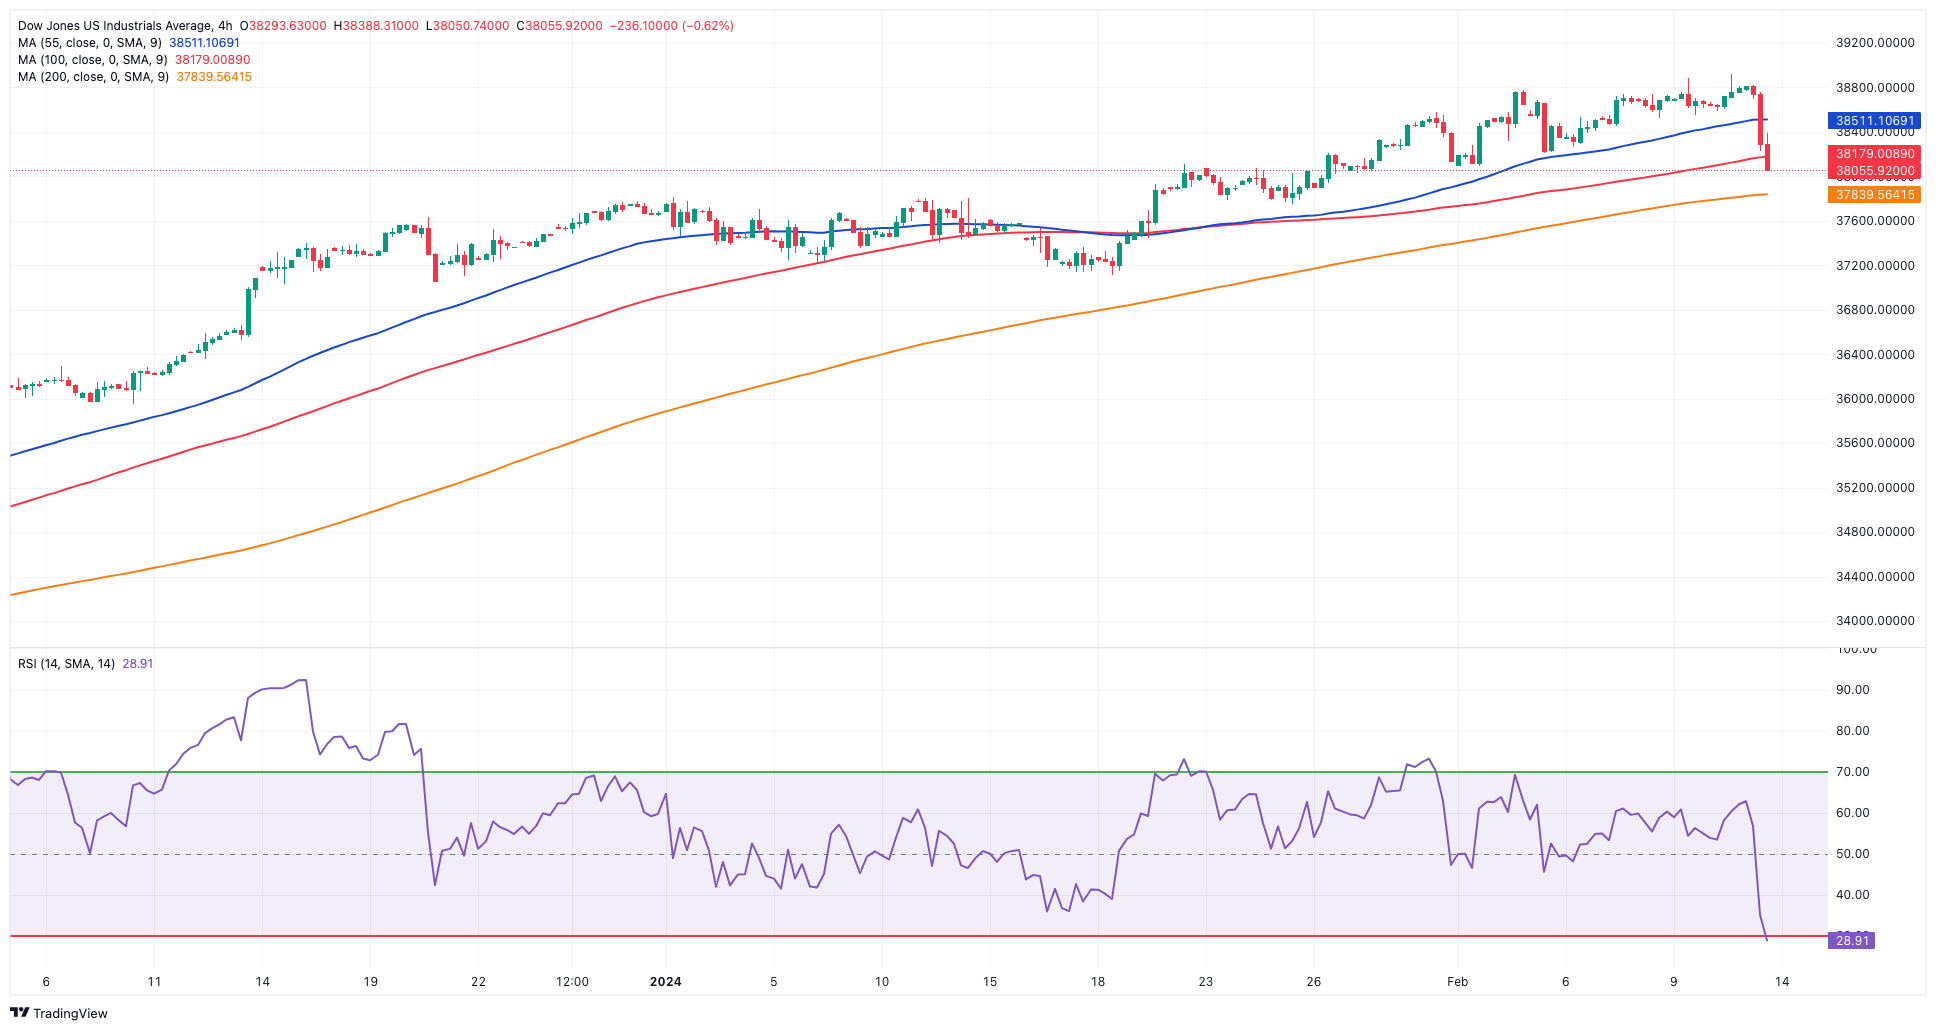
DOW JONES
US equities measured by the Dow Jones and the rest of their peers retreated markedly on Tuesday, easing from recent important tops.
That said, the Dow Jones dropped to multi-session lows and approached the 38,000 region on the back of investors’ repricing of an interest rate cut by the Fed around June, all after US inflation figures continued to run hot in the first month of the year, according to CPI data released by the Bureau of Labor Statistics.
Indeed, the probability of a rate cut in May shrank further to around 33%, while a similar move in June is near 52%, as per the FedWatch Tool by CME Group.
On Tuesday, the Dow Jones dropped 1.79% to 38101, the S&P 500 retreated 1.74% to 4934, and the tech-focused Nasdaq Composite eased 2.04% to 15617.
Immediately to the upside for the Dow Jones comes its all-time high of 38927 (February 12). The other way around, there is interim support at the 55-day SMA at 37292 seconded by the 2024 low of 37122 (January 18), which comes before the weekly low of 37073 (December 20, 2023). The loss of this level signals a possible challenge to the intermediate 100-day SMA at 35772 before the 200-day SMA at 35020. The weekly low of 33859 (November 7, 2023) precedes the October 2023 low of 32327 (October 27) and the 2023 low of 31429 (March 15). The daily RSI plummeted to the 50 region.
Top Performers: Walt Disney, UnitedHealth, Visa A
Worst Performers: Walgreen Boots, Goldman Sachs, Dow
Resistance levels: 38927 (4H chart)
Support levels: 38085 37122 36021 (4H chart)
MACROECONOMIC EVENTS

All Information & Updates provided by:

All information relating to the financial markets available on this page has been prepared and issued by FXStreet (Forexstreet SL, Spain, Reg: B62498233) on the basis of publicly available information and all information believed to be reliable and does not conflict with Kuwaiti local laws, and all necessary care has been taken to before the company to ensure that the facts mentioned are correct from the source.
NCM Investment nor any of its directors or employees shall in any way be held responsible for the contents of this news, and the information contained on this page is intended only to provide clients with publicly available information and should not be construed as investment advice, report or analysis and/or constitute an offer or invitation to buy or sell financial instruments of any kind.
RISK WARNING: Forex and CFDs are highly risky leveraged products, as losses can exceed deposits. Please ensure you understand all the risks and take independent advice if necessary. NCM will segregate the clients based on the criteria of the regulator and its bylaws. NCM does not provide any advisory service; the material published does not constitute advice or a recommendation for a transaction in any financial instrument. NCM accepts no responsibility for any use of the content presented and any consequences of that use. Anyone acting on the information provided does so at their own risk.