
- Contact Us:
-

-

-

-


Daily Market Updates
15 Feb 2024
EURUSD
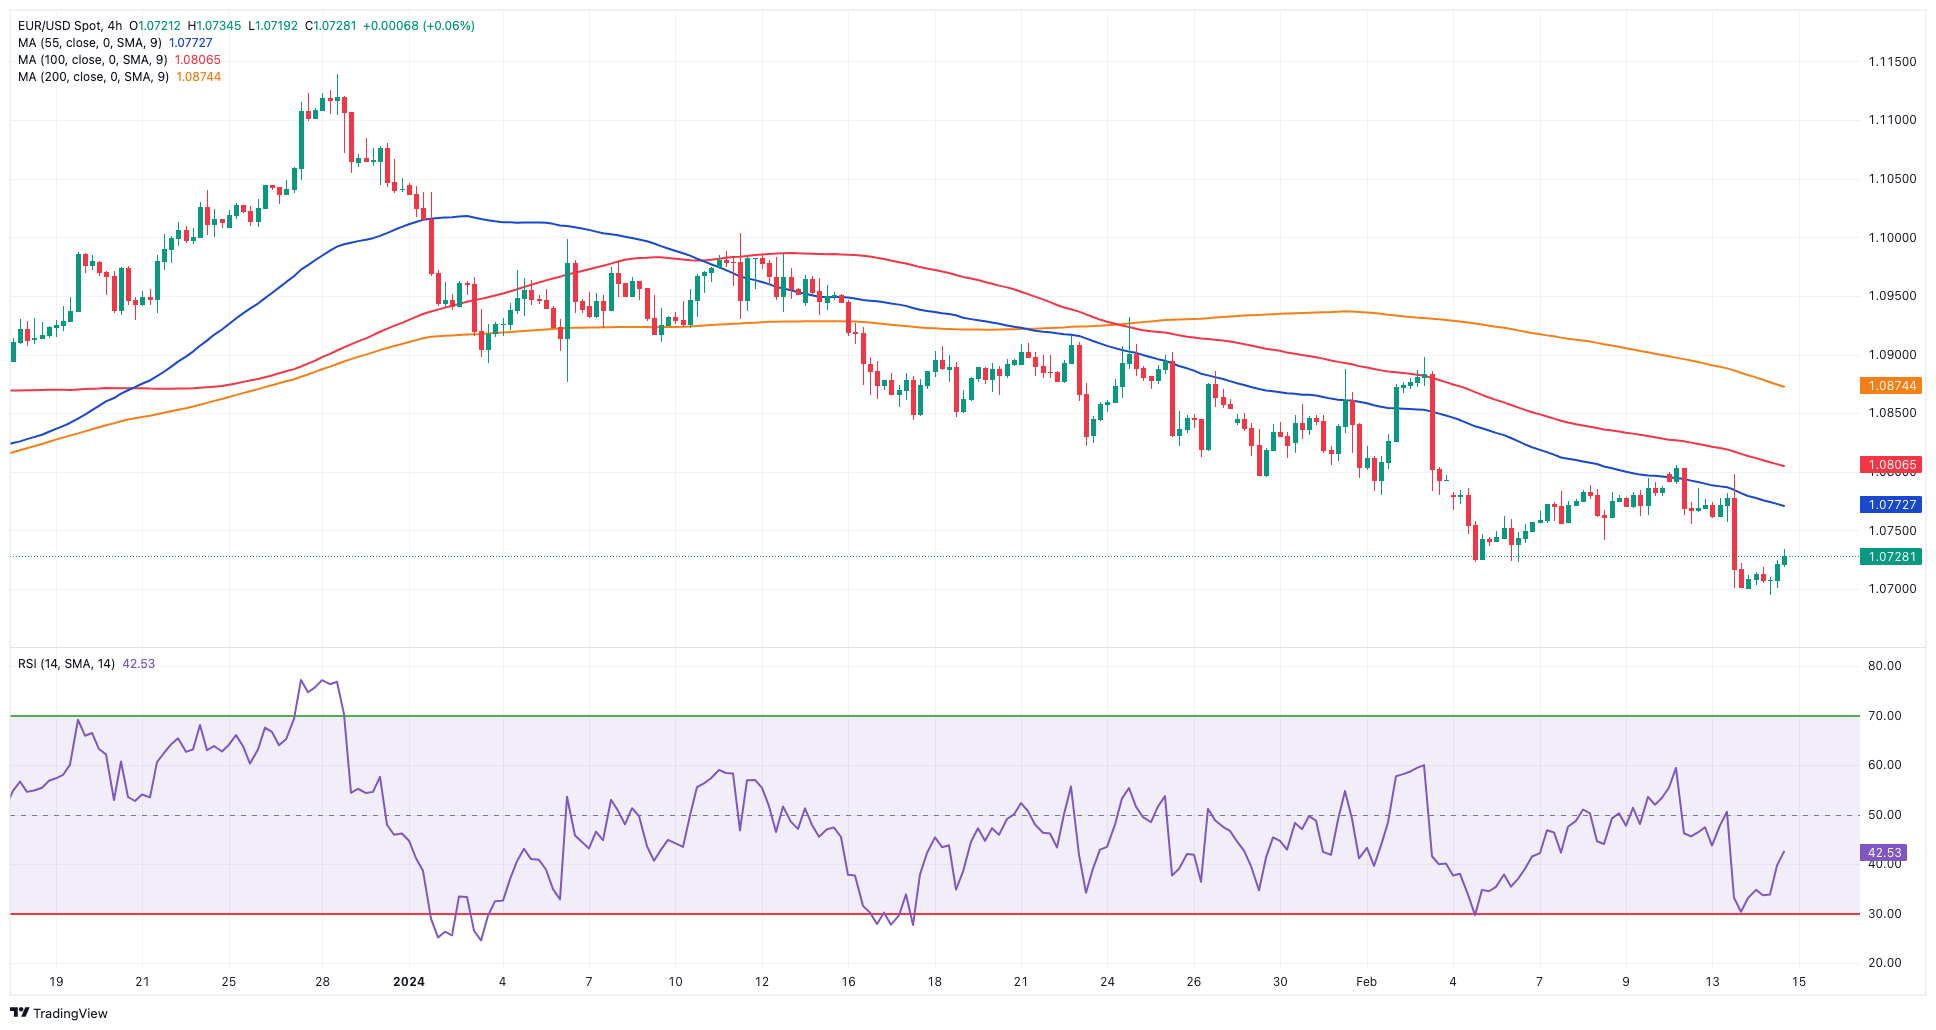
Some profit-taking in the greenback allowed some breathing room for the risk-linked galaxy, encouraging EUR/USD to bounce off earlier YTD lows in the sub-1.0700 region on Wednesday.
On the other hand, both the USD Index (DXY) and US yields declined in response to the prevailing risk-on mood, as investors sold the buck following earlier tops just pips away from the 105.00 barrier, an area last visited in mid-November.
Looking at central banks, the ECB’s de Guindos suggested that more time is needed before reducing rates, while Chicago Fed Governor Goolsbee said there is no need to wait until inflation hits the Fed’s 2.0% target to ease policy.
On the domestic calendar, another revision saw the Q4 GDP in the euro area come in at 0% QoQ and expand by 0.1% over the last twelve months. In addition, Industrial Production in the bloc expanded by 1.2% in the year to December.
In the US, Mortgage Applications contracted by 2.3% in the week to February 9, according to MBA.
The immediate downside target for EUR/USD emerges at the 2024 low of 1.0694 (February 14), seconded by the weekly low of 1.0495 (October 13, 2023), the 2023 low of 1.0448 (October 3) and the round level of 1.0400. In the other direction, initial resistance comes at the crucial 200-day SMA at 1.0828, prior to the intermediate 55-day SMA at 1.0885 and the weekly high at 1.0932 (January 24). Further north, another weekly top of 1.0998 (January 5, 11) strengthens the 1.1000 threshold and arrives ahead of the December 2023 peak of 1.1139 (December 27). This level is also supported by the 200-week SMA at 1.1148 and precedes the 2023 high of 1.1275 (July 18). The daily RSI leapt to the boundaries of 37.
Resistance levels: 1.0805 1.0871 1.0932 (4H chart)
Support levels: 1.0694 1.0656 1.0516 (4H chart)
USDJPY
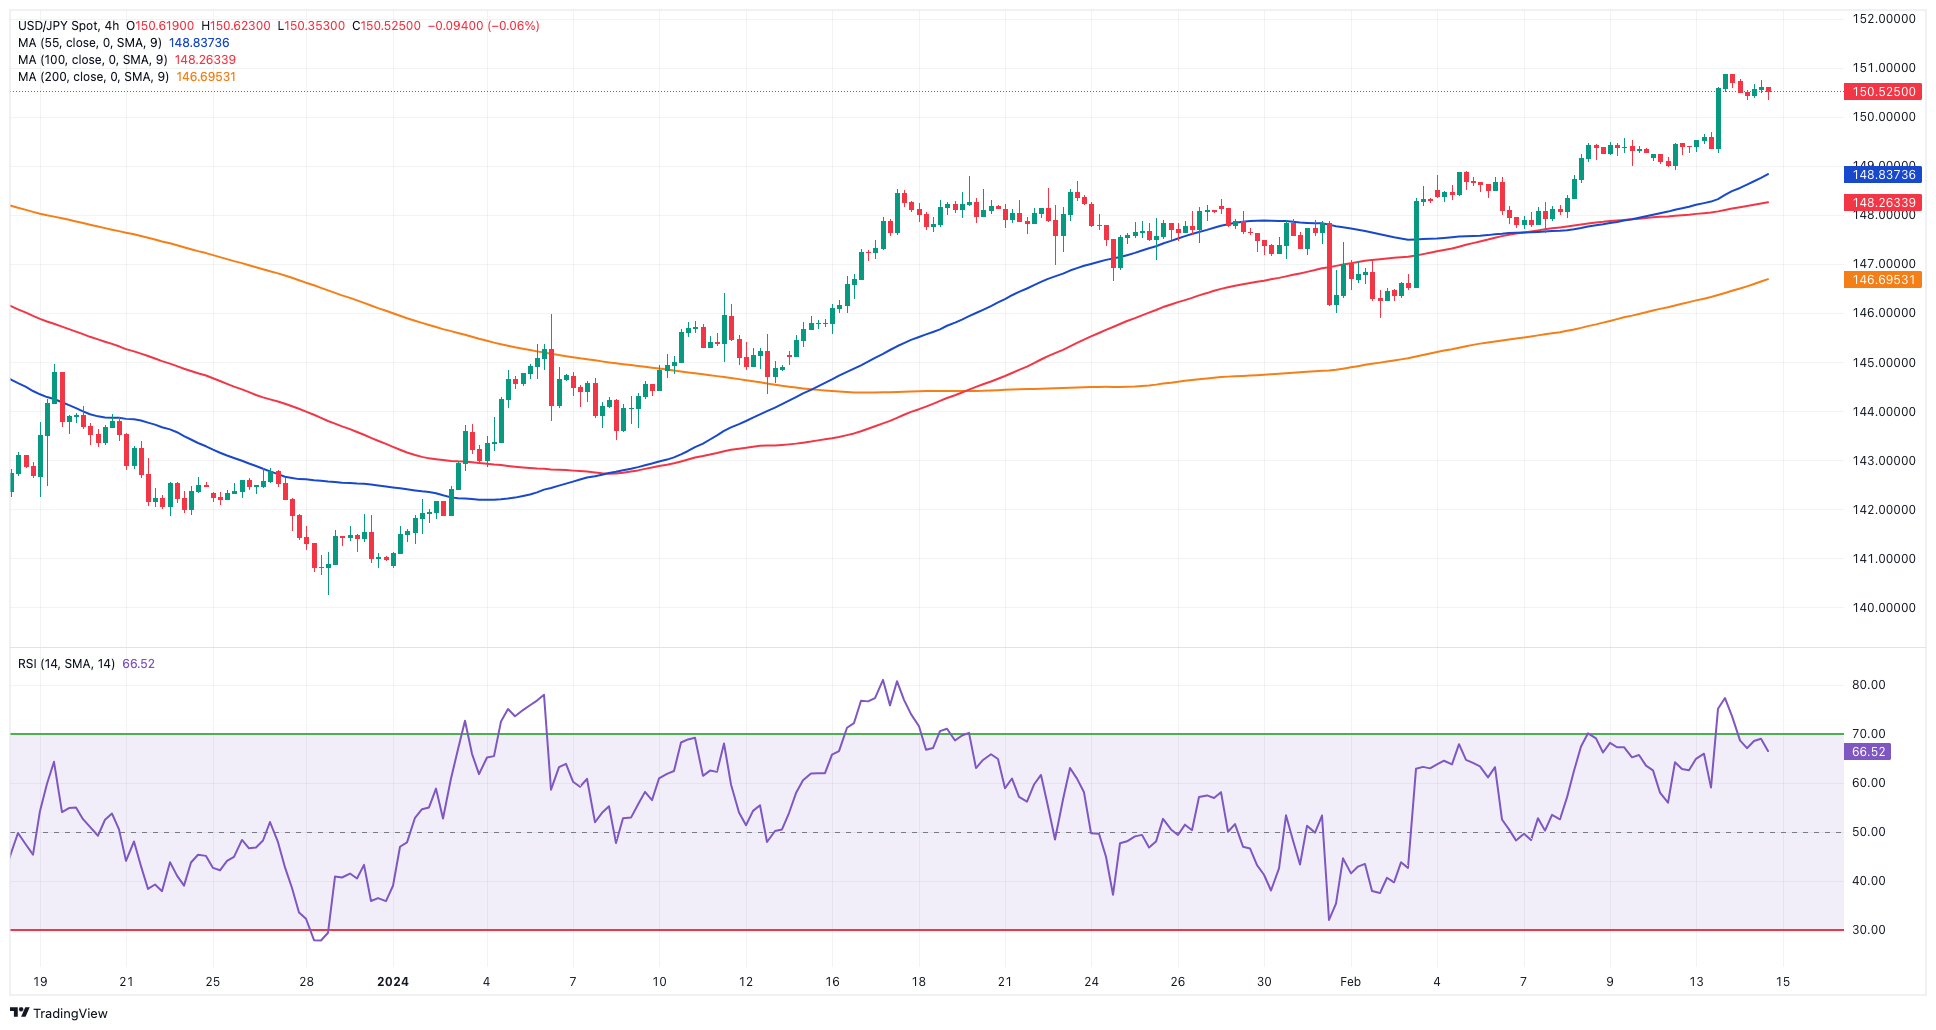
USD/JPY saw its ongoing rally somewhat tempered on Wednesday, as the pair retreated modestly following two consecutive daily gains.
The pair’s negative performance came on the back of the corrective decline in the greenback, which was also propped up by declining yields across the US curve, while speculation of a June rate cut by the Fed remained well on the rise.
In the Japanese bond market, JGB 10-year yields rose to multi-week tops past 0.76%.
There were no data releases on the domestic calendar midweek.
If bulls regain the upper hand, they could motivate USD/JPY to challenge the 2024 peak of 150.88 (February 13) ahead of the 2023 high of 151.90 (November 13). Further north, the 2022 top of 151.94 (October 21) is slightly ahead of the round number of 152.00. Quite the opposite, the current focus is on the February low of 145.89 (February 1), which is supported by the preliminary 55-day SMA of 145.84. The significant 200-day SMA of 145.15 precedes the December 2023 bottom of 140.24 (December 28) and the round number of 140.00, all before the July low of 137.23 (July 14). The daily RSI deflated to the 67 region.
Resistance levels: 150.88 151.43 151.90 (4H chart)
Support levels: 148.92 147.61 145.89 (4H chart)
GBPUSD
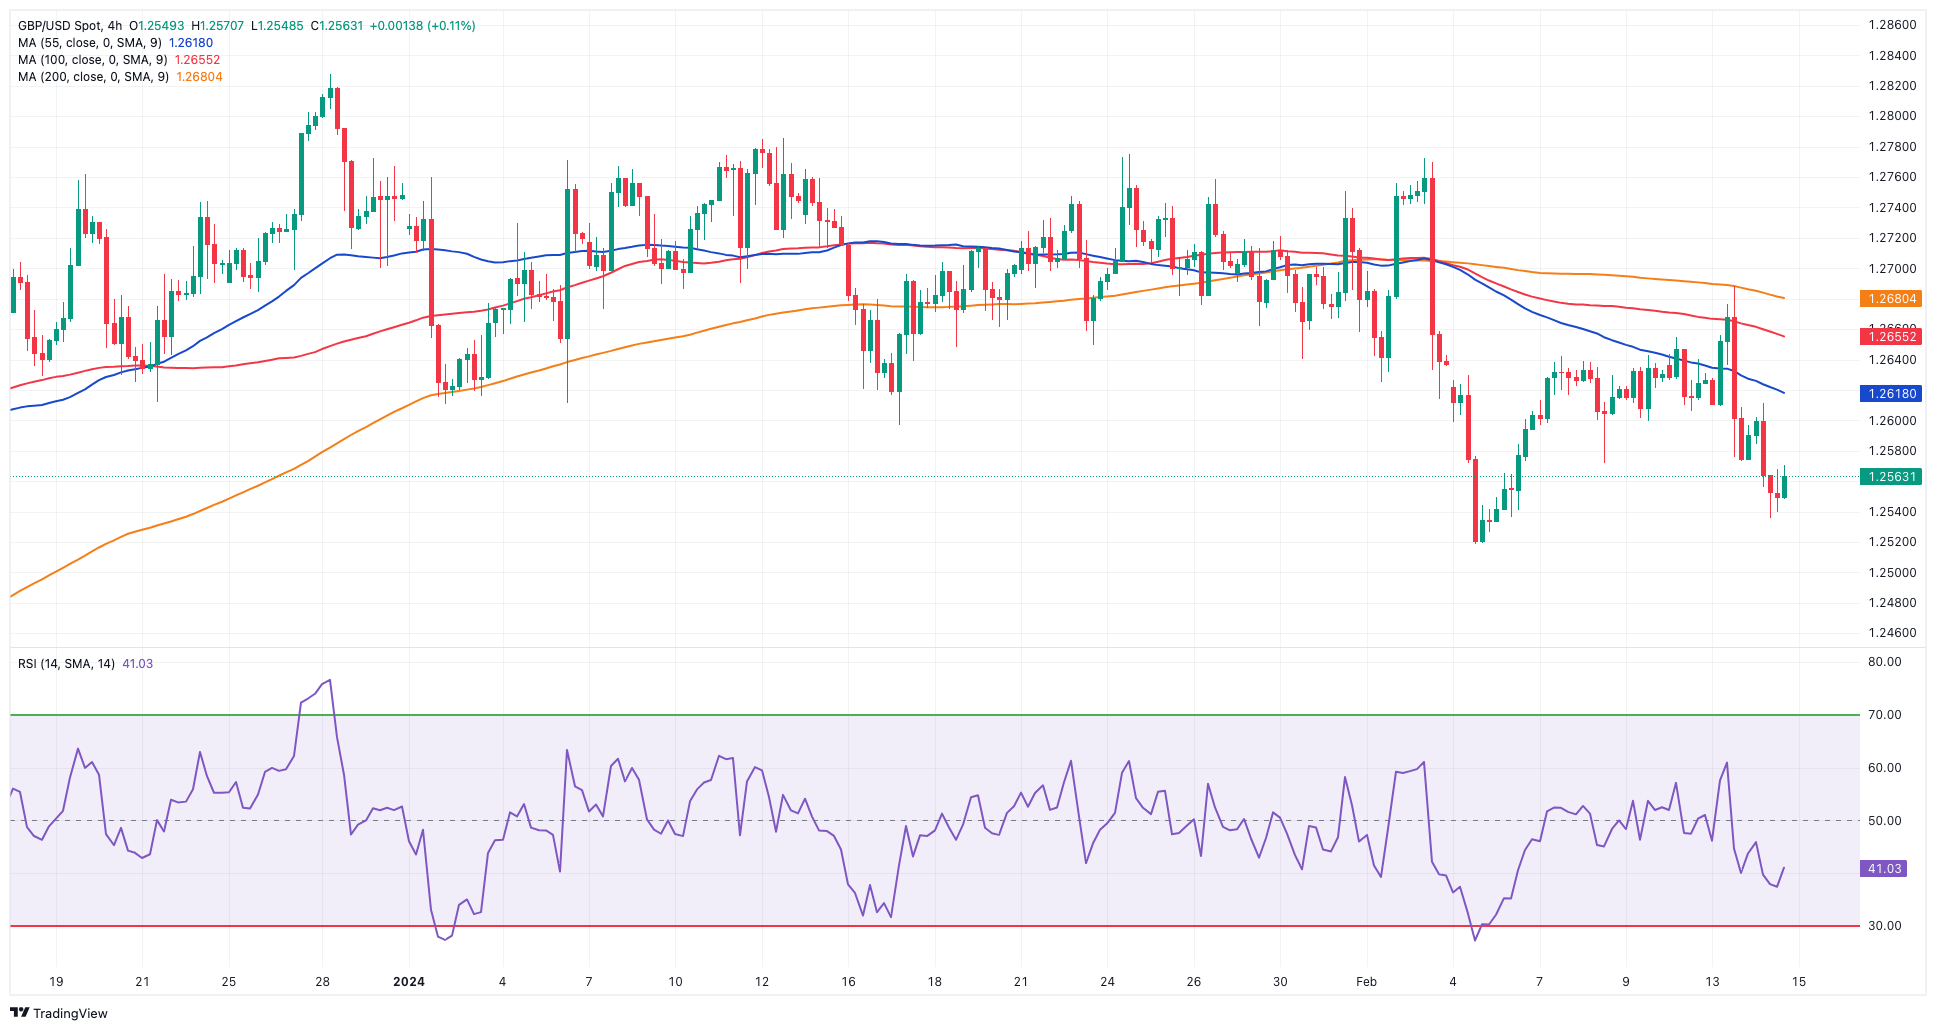
GBP/USD added to Tuesday’s pullback and retreated to multi-session lows near 1.2530 despite the decent retracement in the greenback vs. most of its G10 peers.
However, lower-than-expected UK inflation data for the month of January weighed on the British pound and kept Cable on the back foot against the backdrop of reinvigorated speculation of rate cuts by the BoE in the near term.
Regarding the above, headline CPI in the UK rose by 4.0% in the year to January and 5.1% when it came to the Core CPI, both prints coming in below estimates, although holding steady from the December readings.
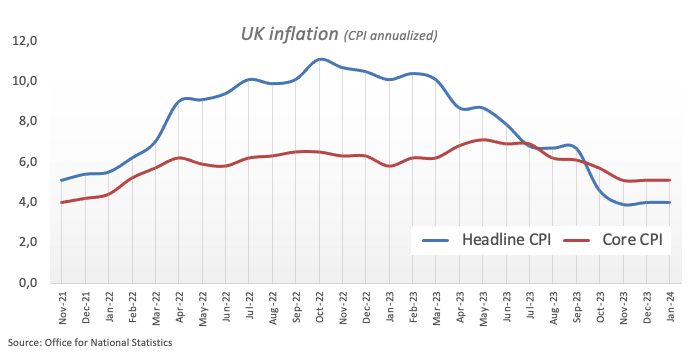
Still on the docket, Bank of England Governor Andrew Bailey expressed optimism regarding the latest inflation data, noting that it indicated greater downward pressure than initially anticipated by the central bank. Additionally, he remarked that there were indications of the British economy gaining momentum.
In the UK debt market, 10-year gilt yields retreated to multi-day lows near the 4.0% level.
Breaking the 2024 low of 1.2518 (February 5) exposes the December 2023 bottom of 1.2500 (December 13). Extra weakness may force GBP/USD to target the weekly low of 1.2187 (November 10, 2023), before hitting the October 2023 low of 1.2037 (October 3), the key 1.2000 level and the 2023 bottom of 1.1802 (November 10, 2023). On the upside, the weekly top at 1.2683 provides early resistance, ahead of the 2024 peak at 1.2785 (January 12). Further higher, the December high of 1.2827 (December 28) precedes the weekly top of 1.2995 (July 27, 2023), which is just shy of the critical 1.3000 yardstick. The RSI on the daily chart decreased to around 40.
Resistance levels: 1.2611 1.2683 1.2772 (4H chart)
Support levels: 1.2535 1.2500 1.2448 (4H chart)
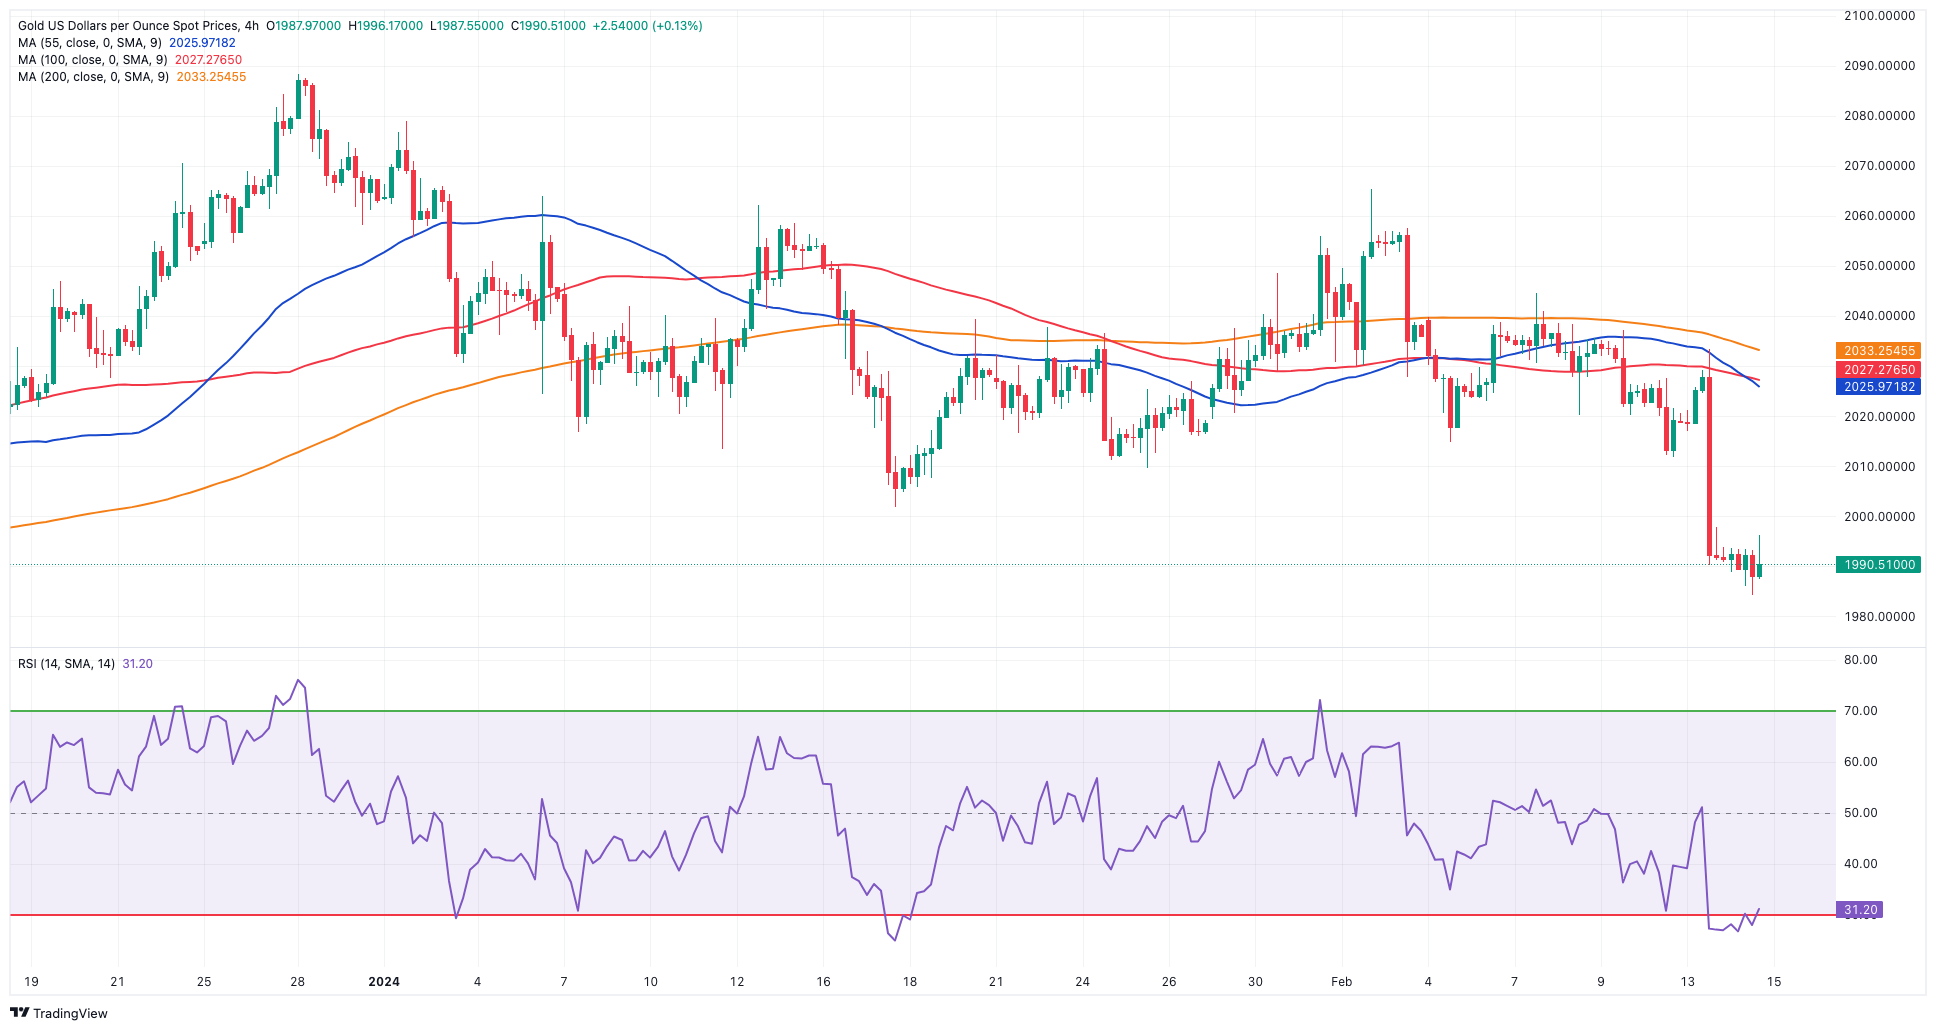
GOLD
Further downside pressure saw prices of the precious metal drop to new lows around $1,985 per troy ounce on Wednesday.
The marginal retracement in the yellow metal was in tandem with a corrective decline in the greenback and a marked pullback in US yields across different time frames.
In the meantime, bullion remains at the centre of the ongoing debate surrounding the potential timing of an interest rate cut by the Federal Reserve, which so far appears likely to be announced at the June 12 meeting.
Further losses might push gold below its December 2023 low of $1,973, which is supported by the 200-day SMA at $1,965. A further loss might put the November 2023 low of $1,931 back into view, ahead of the October 2023 low of $1,810, the 2023 low of $1,804, and the $1,800 contention zone. Instead, bullish attempts may take the metal back to its February peak of $2,065 (February 1), ahead of the weekly high of $2,088 (December 28) and all-time top of $2,150. (December 4, 2023).
Resistance levels: $2,031 $2,044 $2,065 (4H chart)
Support levels: $1,984 $1,973 $1,965 (4H chart)
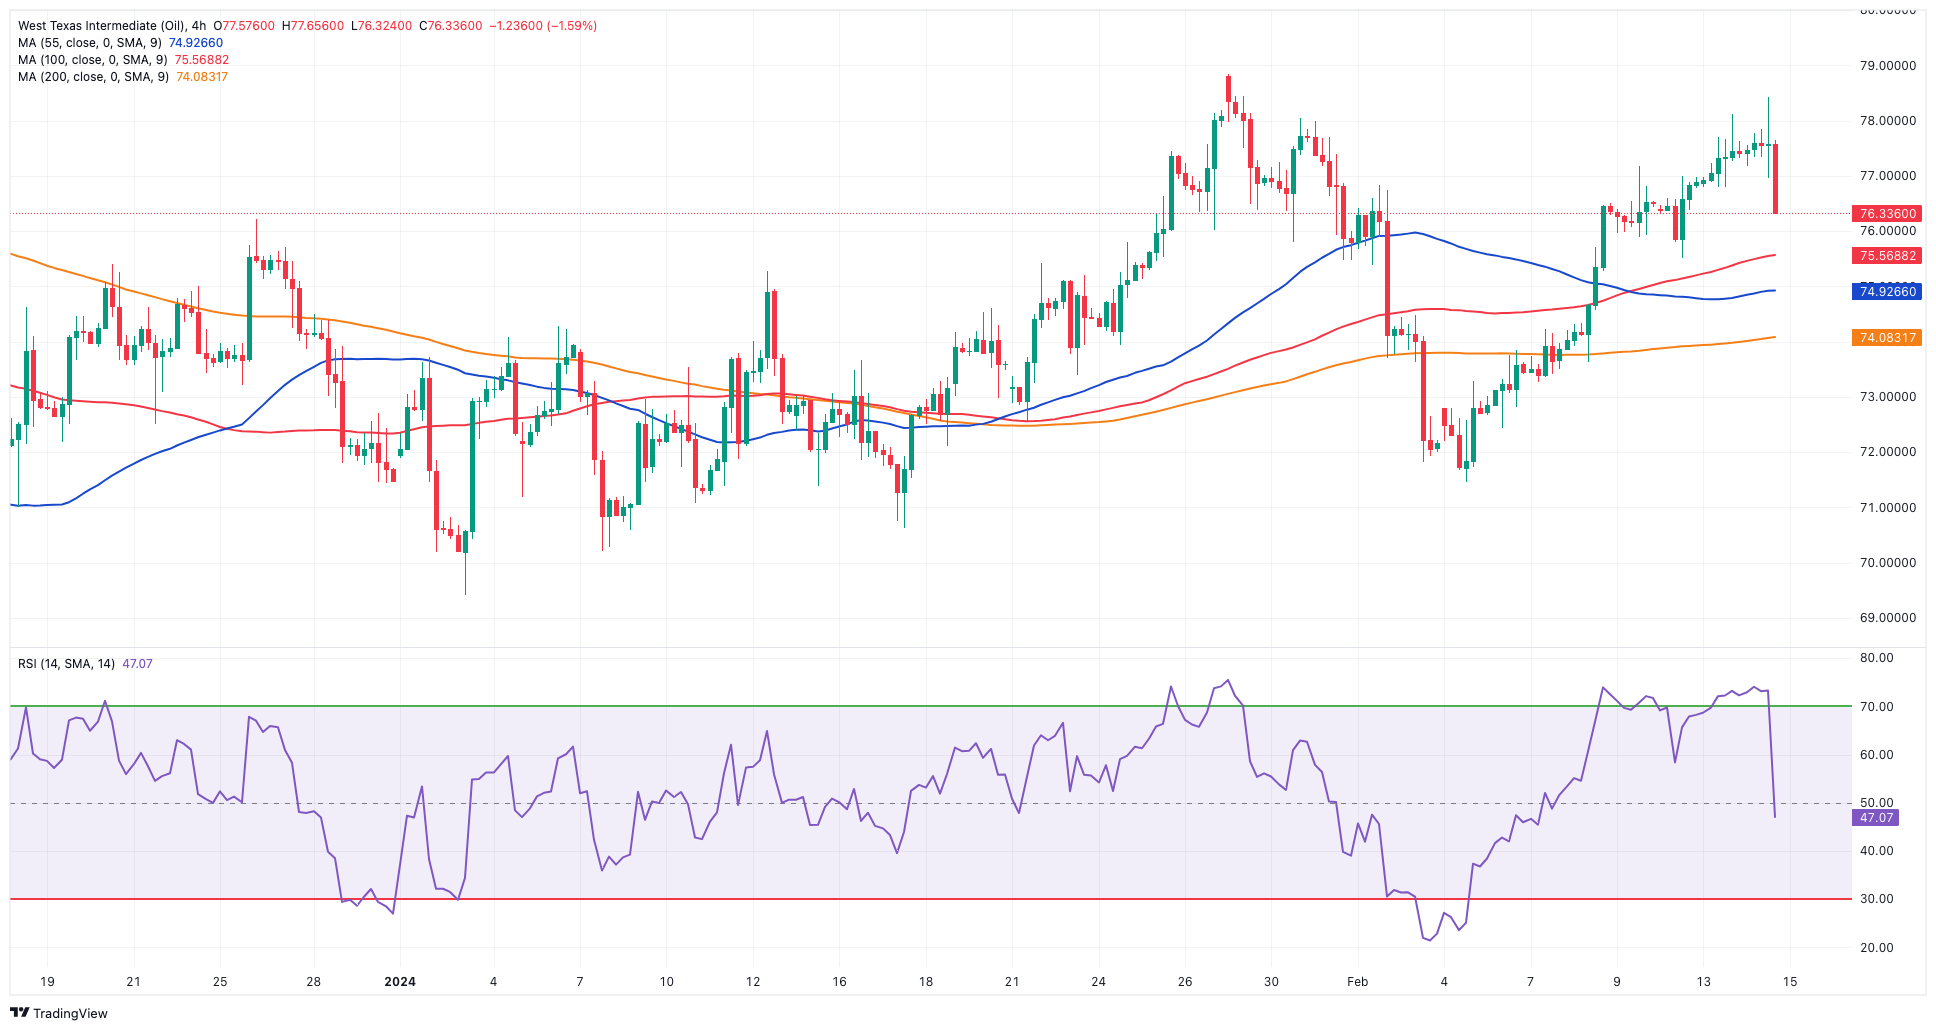
CRUDE WTI
WTI prices halted seven straight sessions of gains on Wednesday as investors gauged the larger-than-expected weekly build in US crude oil inventories, as reported by the EIA.
On the latter, the agency reported that US crude oil inventories unexpectedly increased by 12.018M barrels in the week to February 9, while supplies at Cushing went up by 0.710M barrels, Weekly Distillate Stocks dropped by 1.915M barrels, and gasoline stockpiles shrank more than expected by 3.658M barrels.
In the interim, persistent geopolitical concerns surrounding the Russia-Ukraine conflict, the Middle East, and the Red Sea crisis are anticipated to continue bolstering crude oil prices. Furthermore, the positive sentiment conveyed in OPEC's monthly report is also contributing to the support of prices.
It is worth noting that on Tuesday, the cartel reaffirmed its projection of strong growth in global oil demand for this year and 2025 while revising its economic growth forecasts upward for both years, citing additional potential for upside. Additionally, global oil demand is expected to rise by 2.25 mbpd in 2024 and by 1.85 mbpd in 2025.
The next upward block for WTI is at the February top of $78.44, prior to the 2024 peak of $79.25 (January 29), which is immediately followed by the key $80.00 barrier and the November 2023 high of $80.15 (November 3). Extra gains from here may take the commodity back to its weekly high of $89.83 (October 18, 2023), ahead of the 2023 peak of $94.99 (September 28, 2023) and the August 2022 high of $97.65 (August 30), all before reaching the psychological $100.00 barrier. However, the loss of the February low of $71.43 (February 5) might bring the critical $70.00 barrier back into view, followed by the 2024 bottom of $69.31 (January 3). The breakdown of the latter might pave the way for a drop to the December 2023 low of $67.74 (December 13), ahead of the June 2023 low of $66.85 (June 12).
Resistance levels: $78.74 $79.25 $79.56 (4H chart)
Support levels: $76.75 $75.50 $74.06 (4H chart)
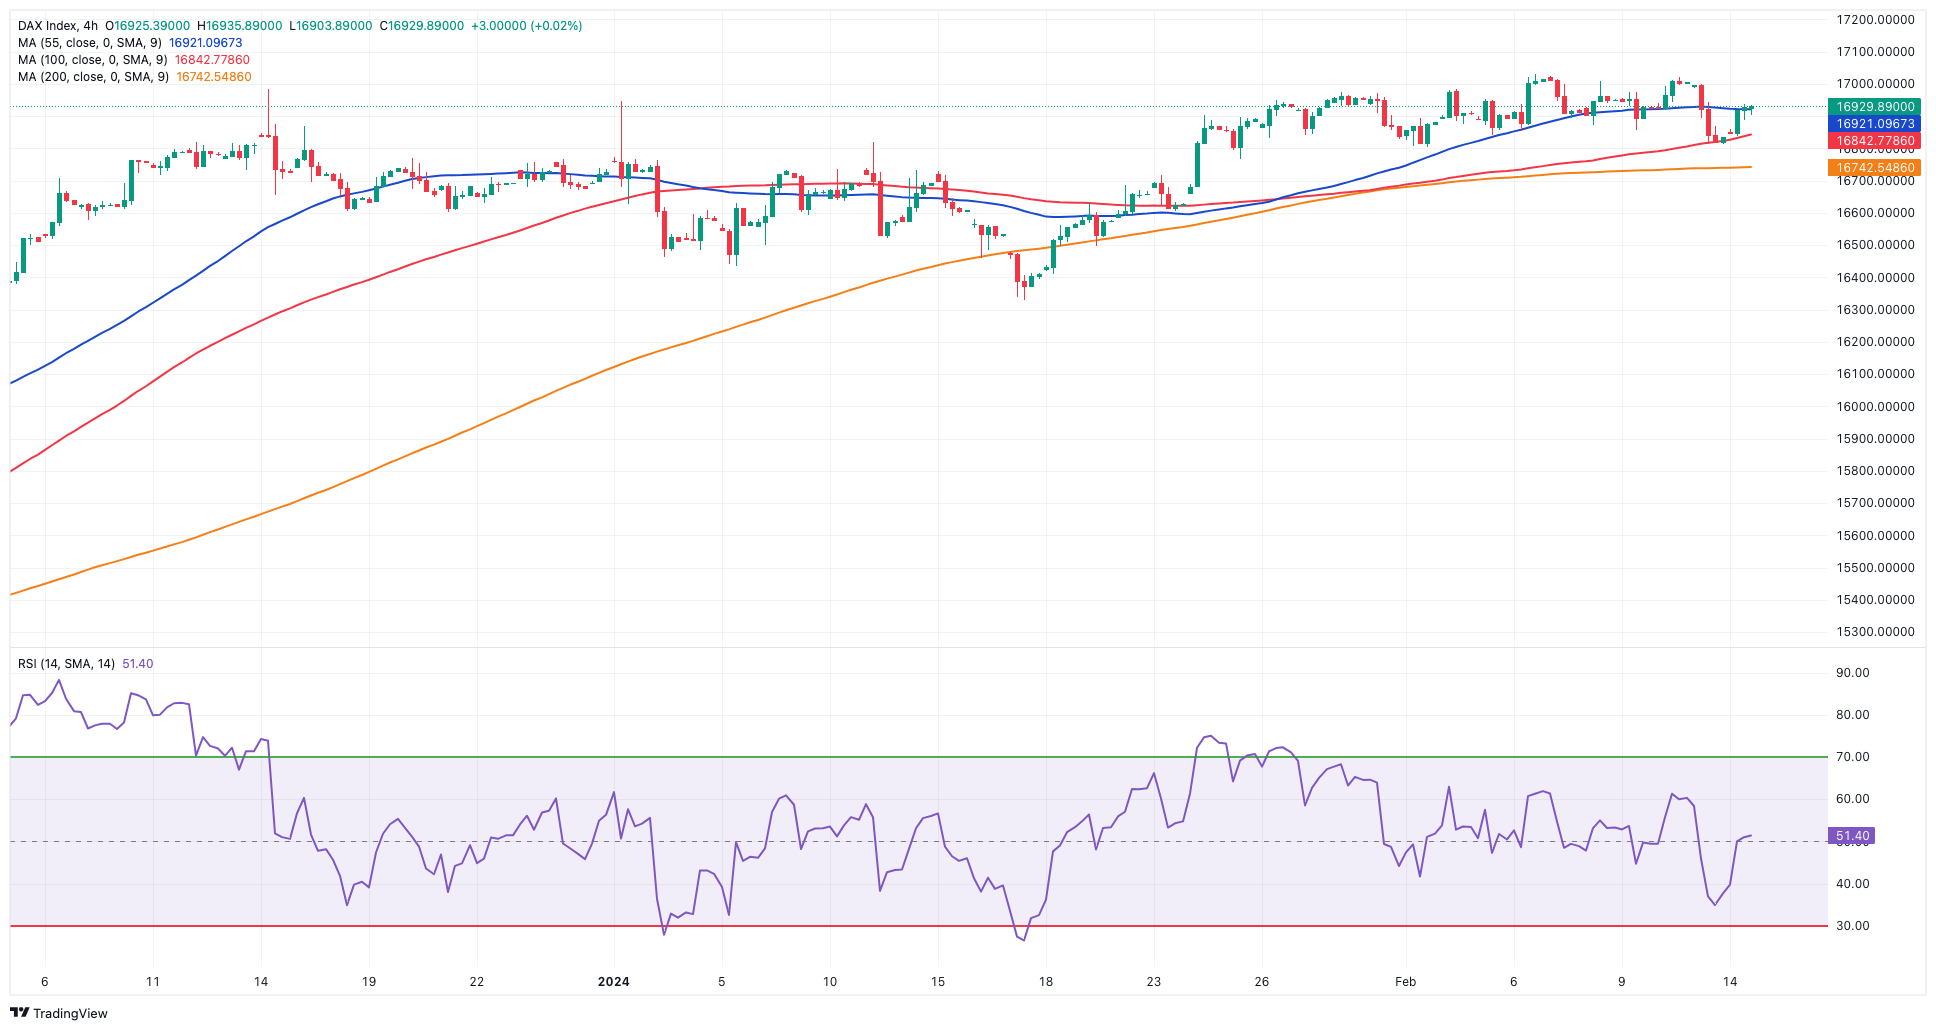
GER40
Germany’s stock benchmark DAX40 rapidly left behind Tuesday’s drop and regained upside traction on Wednesday, trading at shouting distance from the key 17,000 threshold.
The daily uptick in the DAX40 maintained the consolidative range in place since mid-January and came amidst the broad-based optimism around corporate earnings reports, while further disinflationary pressures in the UK economy bolstered prospects of an imminent shift to lower rates by the BoE.
Still around the central banks’ galaxy, the ECB’s de Guindos said further time is needed before starting to cut rates.
On the macro front, a revision of Q4 GDP in the broader euro area matched the preliminary readings despite the gloomy prospects for the German economy.
A glimpse at the money market saw 10-year bund yields easing to the vicinity of the 2.30% zone.
The next upward barrier for the DAX40 is its all-time top of 17,049 (February 6). In the reverse direction, the February low of 16,821 (February 1) provides immediate support, followed by the transitory 55-day SMA at 16,694 and the 2024 bottom at 16,345 (January 17). After clearing the latter, the index is likely to reach the 200-day SMA at 15,995 before sliding to its weekly low of 15,915 (November 28). The October 2023 low of 14,630 (October 23) comes next, before the March 2023 low of 14,458 (March 20). The daily RSI increased to around 56.
Best Performers: Adidas, Fresenius SE, Merck
Worst Performers: Dr Ing hc F Porsche Prf, RWE AG ST, Heidelbergcement
Resistance levels: 17,049 (4H chart)
Support levels: 16,831 16,514 16,345 (4H chart)
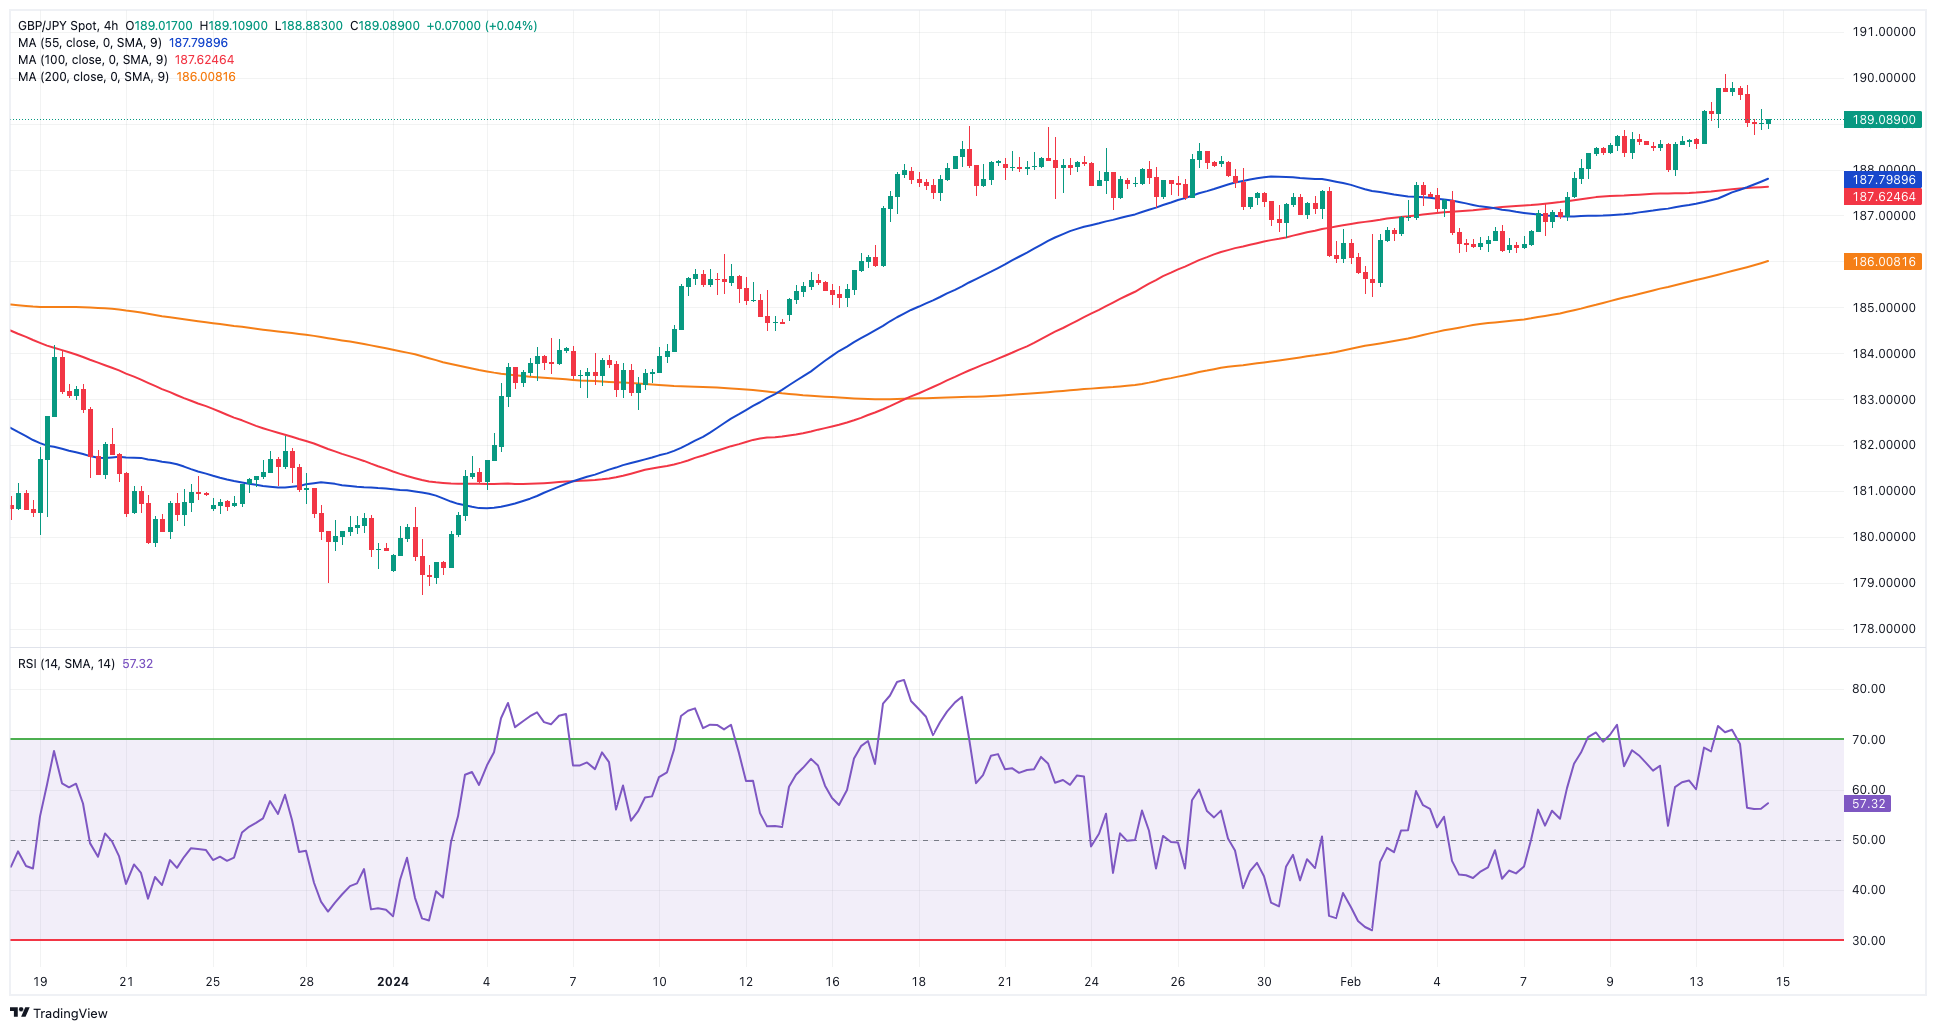
GBPJPY
The bearish tone in sterling and some upside momentum in the Japanese yen prompted GBP/JPY to abandon Tuesday’s area of yearly highs just above the 190.00 hurdle on Wednesday.
That said, the cross came under selling pressure after a five-day positive streak, which was almost exclusively on the back of the sharp depreciation of the Japanese currency, particularly on the back of investors’ repricing of an interest rate cut by the Fed later than initially anticipated.
Next on the upswing for GBP/JPY is the 2024 high of 190.08 (February 13), which emerges before the August 2015 record of 195.28. If bears take control, spot might drop to its February low of 185.22 (February 1) before attempting to break through intermediate support at the 55-day and 100-day SMAs of 184.93 and 184.41, respectively. If the cross break below this region, it may target the more crucial 200-day SMA at 182.30, before the December 2023 bottom of 178.33 (December 14) and the October 2023 low of 178.03 (October 3). A further drop might reintroduce a challenge of the July 2023 bottom at 176.30, ahead of the May 2023 low of 167.84 (May 11). The everyday RSI dropped below the 62 mark.
Resistance levels: 190.08 195.28 195.88 (4H chart)
Support levels: 187.85 186.04 185.22 (4H chart)
NASDAQ
The US tech sector regained its smile following news that chip maker NVIDIA surpassed Alphabet in market cap on Wednesday.
Also supporting the resurgence of the upside momentum in the Nasdaq 100 emerges the corrective retracement in the greenback along with declining US yields across the curve.
Somewhat contributing to the upbeat sentiment among investors, Chicago Fed President A. Goolsbee suggested that the Fed might not have to wait until inflation hits the 2% target to start trimming its interest rates.
The Nasdaq 100 reached a new high of 18,041 on February 12. The other way around, bearish efforts should first target the weekly low of 17,128 (January 31), which comes before the intermediate 55-day SMA of 16,841 and the 2024 low of 16,249 (January 5). If the index moves through this zone, it might target the December 2023 low of 15,695 (December 4) and the crucial 200-day SMA of 15,416. The breach of this area may cause a decline to the October 2023 bottom of 14,058 (October 26), before reaching the April 2023 low of 12,724 (April 25), the March 2023 low of 11,695 (March 13), and the 2023 low of 10,696 (January 3). The daily chart shows the RSI bouncing to about 60.
Top Gainers: Illumina, Datadog, Zscaler
Top Losers: Kraft Heinz, Biogen, Charter Communications
Resistance levels: 18,041 (4H chart)
Support levels: 17,478 17,128 16,561 (4H chart)
DOW JONES
The US stock benchmark Dow Jones remained on the defensive and added to Tuesday’s pullback, briefly revisiting the 38,200 zone midweek.
Extra losses in US stocks followed investors’ repricing of a rate cut by the Fed later than previously anticipated. According to CME Group’s FedWatch Tool, the probability of that move at the June 12 gathering kept rising and surpassed 50% on Wednesday.
The irresolute performance of the index followed a significant decline on Tuesday, triggered by January's higher-than-anticipated US CPI figures. This development has bolstered the perception that the Federal Reserve could potentially postpone the initiation of its easing cycle even further.
All in all, the Dow Jones eased 0.04% to 38,256, the S&P 500 gained 0.33% to 4,970, and the tech-centric Nasdaq Composite advanced 0.57% to 15,745.
Immediately on the upside comes the Dow Jones' all-time high of 38,927 (February 12). The other way around, there is intermediate support at the 55-day SMA at 37,447, followed by the 2024 low of 37,122 (January 18), which comes before the weekly low of 37,073 (December 20, 2023). The drop below this level may pose a challenge to the intermediate 100-day SMA at 35,816 before the 200-day SMA at 35,042. The weekly low of 33,859 (November 7, 2023) comes before the October 2023 low of 32,327 (October 27) and the 2023 low of 31,429 (March 15). The daily RSI looked stable around 53.
Top Performers: Salesforce Inc, Intel, Caterpillar
Worst Performers: Apple, J&J, Procter&Gamble
Resistance levels: 38,927 (4H chart)
Support levels: 38,039 37,122 36,021 (4H chart)
MACROECONOMIC EVENTS
All Information & Updates provided by:

All information relating to the financial markets available on this page has been prepared and issued by FXStreet (Forexstreet SL, Spain, Reg: B62498233) on the basis of publicly available information and all information believed to be reliable and does not conflict with Kuwaiti local laws, and all necessary care has been taken to before the company to ensure that the facts mentioned are correct from the source.
NCM Investment nor any of its directors or employees shall in any way be held responsible for the contents of this news, and the information contained on this page is intended only to provide clients with publicly available information and should not be construed as investment advice, report or analysis and/or constitute an offer or invitation to buy or sell financial instruments of any kind.
RISK WARNING: Forex and CFDs are highly risky leveraged products, as losses can exceed deposits. Please ensure you understand all the risks and take independent advice if necessary. NCM will segregate the clients based on the criteria of the regulator and its bylaws. NCM does not provide any advisory service; the material published does not constitute advice or a recommendation for a transaction in any financial instrument. NCM accepts no responsibility for any use of the content presented and any consequences of that use. Anyone acting on the information provided does so at their own risk.