
- Contact Us:
-

-

-

-


Daily Market Updates
16 Feb 2024
EURUSD
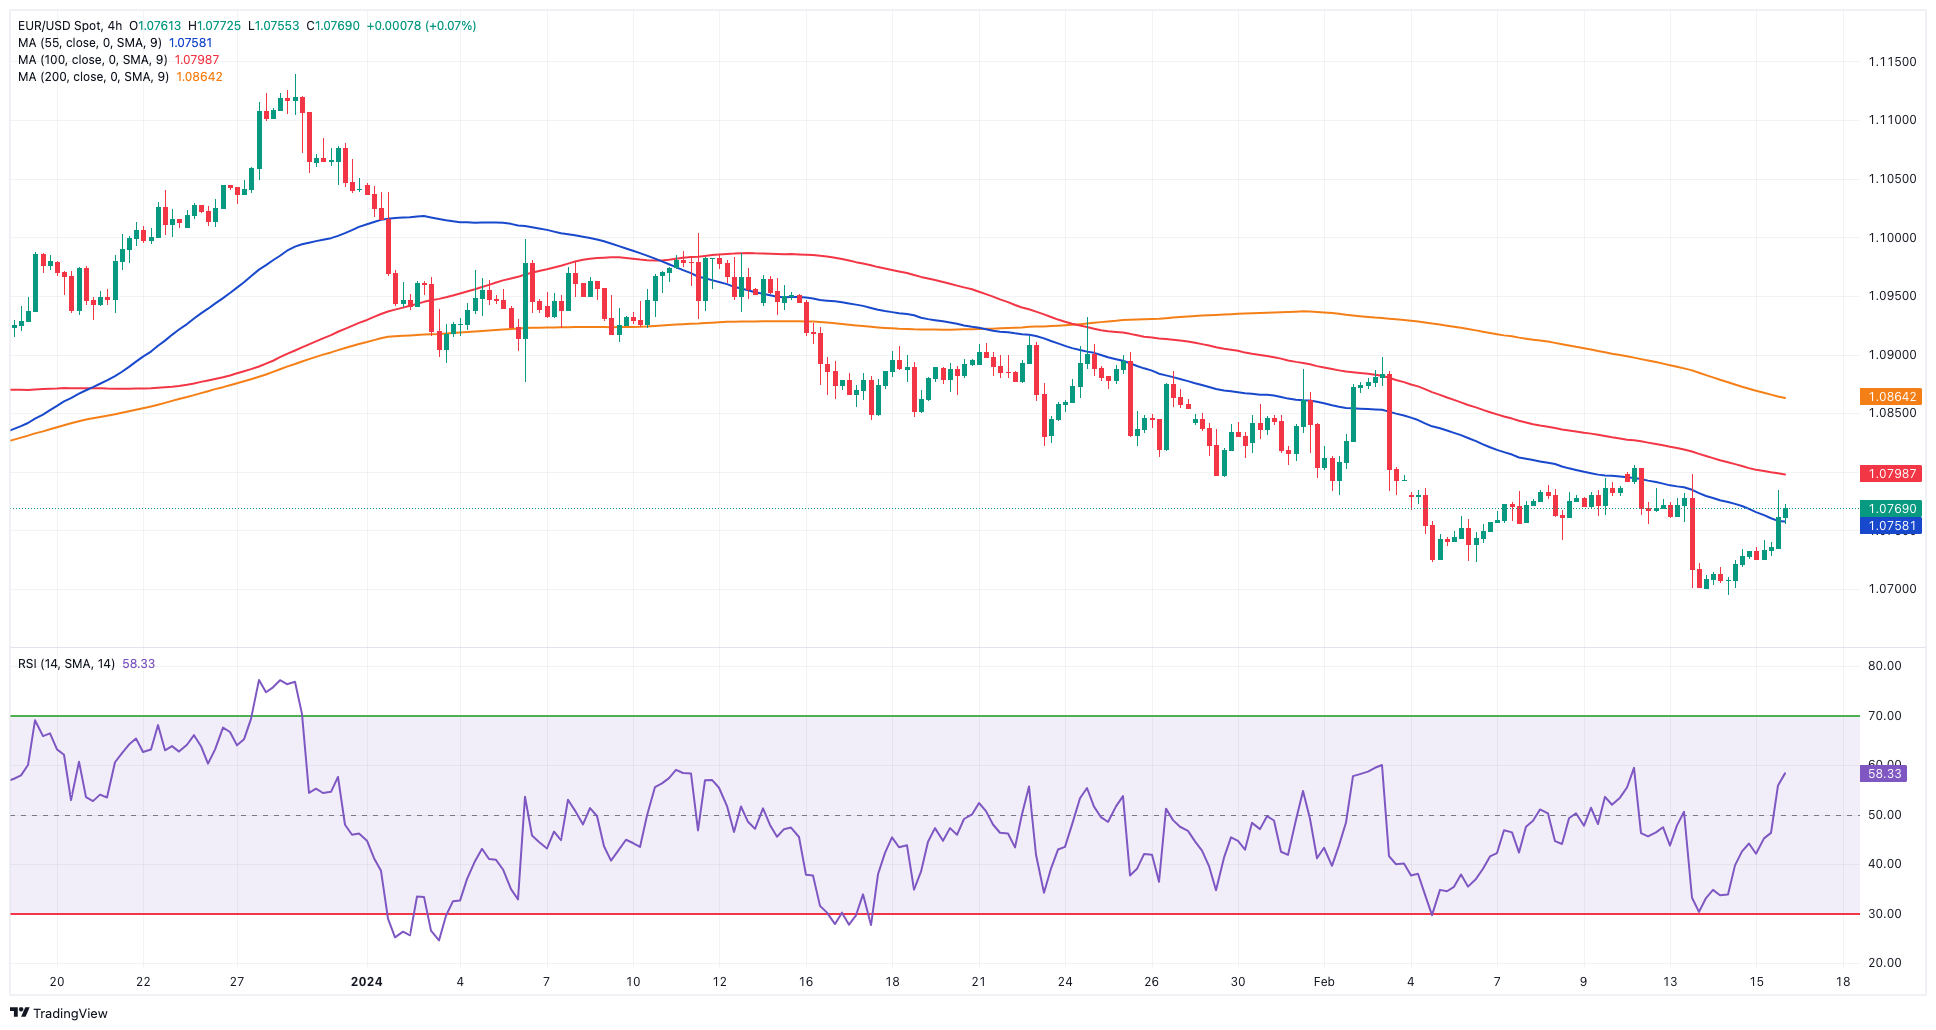
Further selling pressure in the greenback sponsored the second consecutive daily advance in EUR/USD, this time revisiting the 1.0770 zone on Thursday.
In fact, the USD Index (DXY) saw its weekly retracement gather extra steam in a context dominated by the appetite for the risk complex, while disappointing prints from US Retail Sales also contributed to the dollar’s bearish performance. On the latter, sales contracted more than expected by 0.8% from the previous month.
Looking at the macro scenario, expectations for an interest rate cut by the Federal Reserve probably in June remain firm, while the ECB seems to have pushed back that same speculation for some time in the summer.
Still around the ECB, President Lagarde stated that the ECB's wage tracker shows persistent wage pressures, despite the anticipated continuation of the disinflationary trend. He emphasized the need for a sustainable 2% target and a data-driven strategy.
In the euro docket, the trade surplus of the broader bloc shrank to €16.8B in December. In addition, the European Commission released its Winter Forecasts, and it has revised its projection for eurozone GDP growth in 2024 to 0.8% and 1.5% for 2025. It also expects slower growth for German GDP in 2024, with a projected growth of 1.2% for 2025. Additionally, the Commission expects a decrease in Eurozone inflation to 2.7% in 2024.
In the US, other than Retail Sales, Initial Claims increased by 212K in the week to February 10, and the Philly Fed Manufacturing Index improved to 5.2 for the month of February. Further data saw Industrial Production expand by 0.3% MoM in January and 3.4% over the last twelve months, while Business Inventories rose by 0.4% MoM in December, and the NAHB index ticked higher to 47 for the current month.
Further recovery in EUR/USD immediately targets the weekly peak of 1.0805 (February 12), just ahead of the critical 200-day SMA at 1.0827 and the intermediate 55-day SMA at 1.0883. Further north emerges the weekly high at 1.0932 (January 24) seconded by another weekly top of 1.0998 (January 5, 11) and the December 2023 peak of 1.1139 (December 27). This level is also supported by the 200-week SMA of 1.1148 and precedes the 2023 high of 1.1275 (July 18). In the opposite direction, the 2024 low of 1.0694 (February 14) comes next seconded by the weekly low of 1.0495 (October 13, 2023), the 2023 low of 1.0448 (October 3), and the round level of 1.0400. The daily RSI leapt to the proximity of 45.
Resistance levels: 1.0805 1.0863 1.0932 (4H chart)
Support levels: 1.0694 1.0656 1.0516 (4H chart)
USDJPY
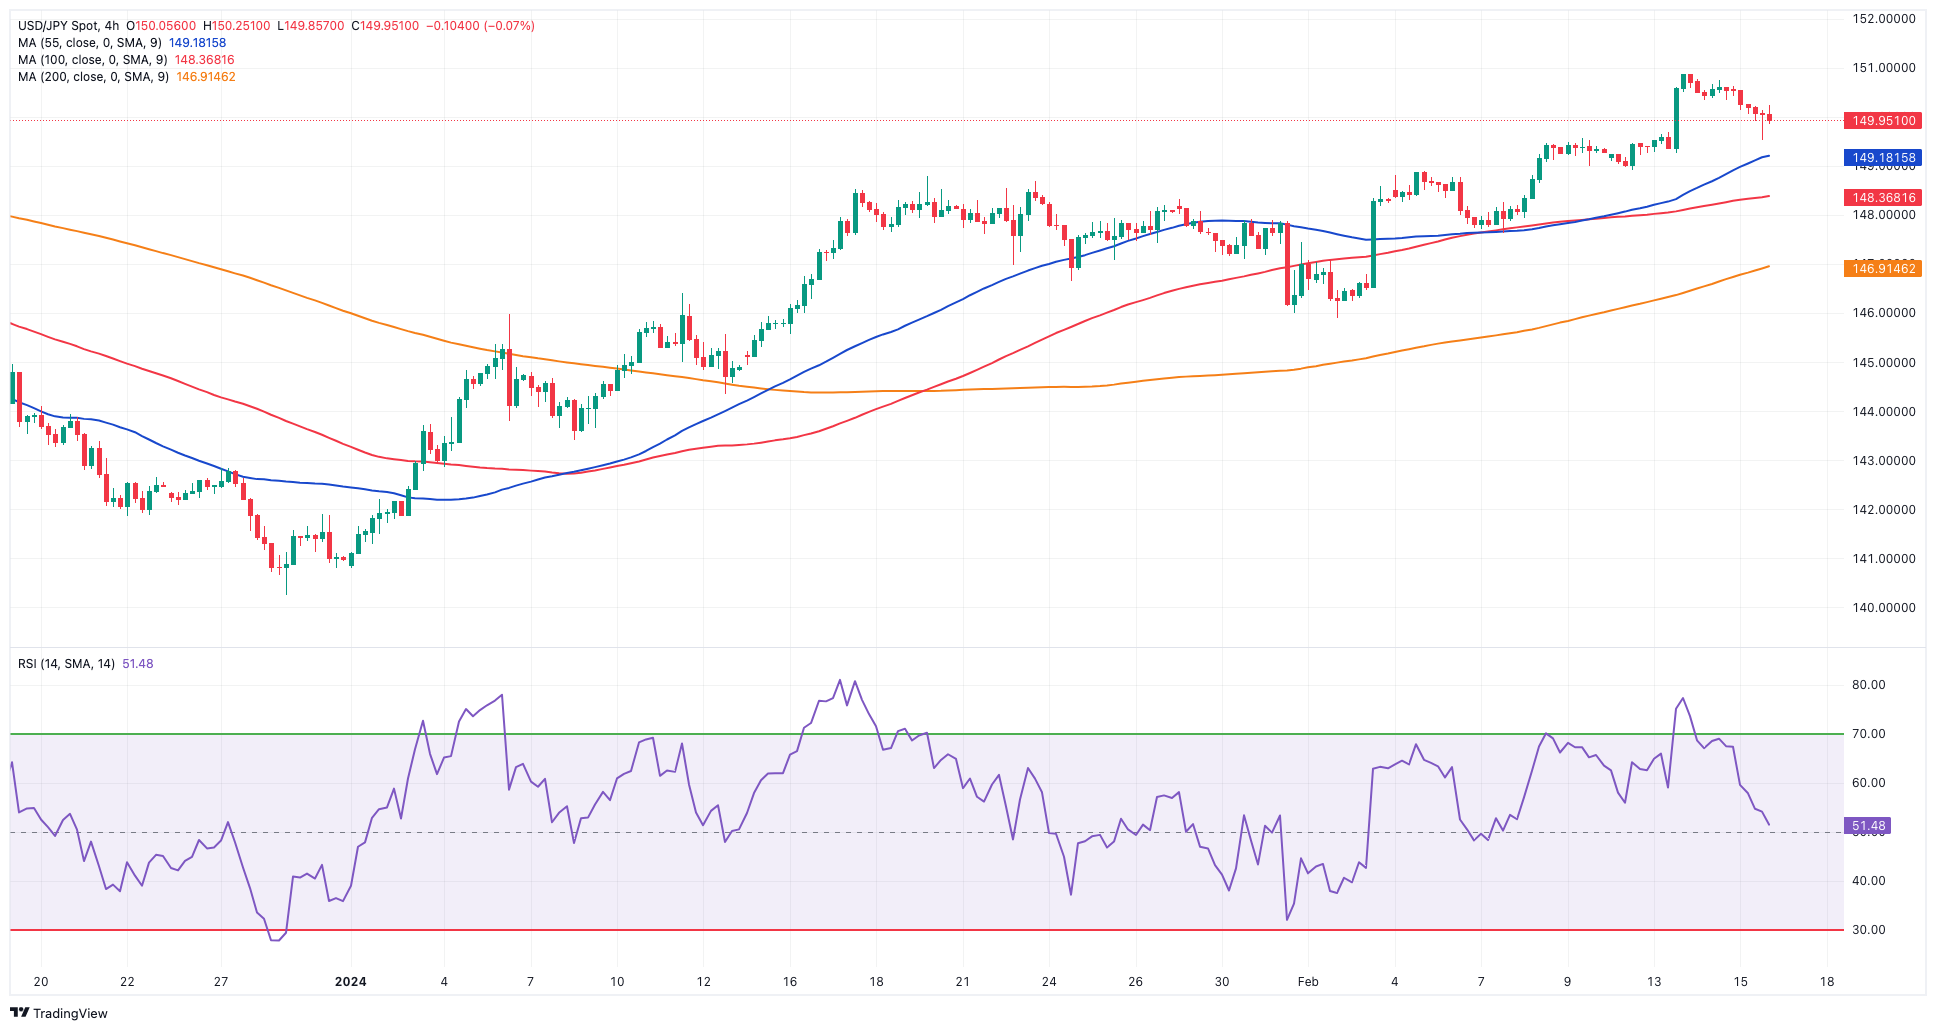
USD/JPY managed to rebound from fresh two-day lows near 149.50 on Thursday, although that did not prevent the pair from closing its second straight session of losses, correcting further down from new yearly peaks near 151.00 recorded early in the week.
Once again, the bearish sentiment surrounding the greenback in combination with further losses in US yields across the curve weighed on the buck on Thursday, sparking a retracement to the 104.20 region in the USD Index (DXY) from 2024 tops near the 105.00 barrier on Wednesday.
The move lower in US yields was in tandem with the knee-jerk in JGB 10-year yields after two consecutive daily upticks.
In Japan, final Industrial Production contracted by 1.0% in the year to December. Additionally, the advanced GDP Growth Rate contracted by 0.1% QoQ in Q4 and 0.4% over the last twelve months.
If bulls get the upper hand, USD/JPY may test the 2024 top of 150.88 (February 13), ahead of the 2023 peak of 151.90 (November 13). Further north, the 2022 maximum of 151.94 (October 21) is closely followed by the round figure of 152.00. On the contrary, the 100-day SMA should offer transitory support at 147.60 prior to the February low of 145.89 (February 1), which coincides with the preliminary 55-day SMA. The key 200-day SMA of 145.23 precedes the December 2023 low of 140.24 (December 28) and the round number of 140.00, all before the July low of 137.23 (July 14). The daily RSI dropped to the sub-64 zone.
Resistance levels: 150.88 151.43 151.90 (4H chart)
Support levels: 149.51 149.21 147.61 (4H chart)
GBPUSD
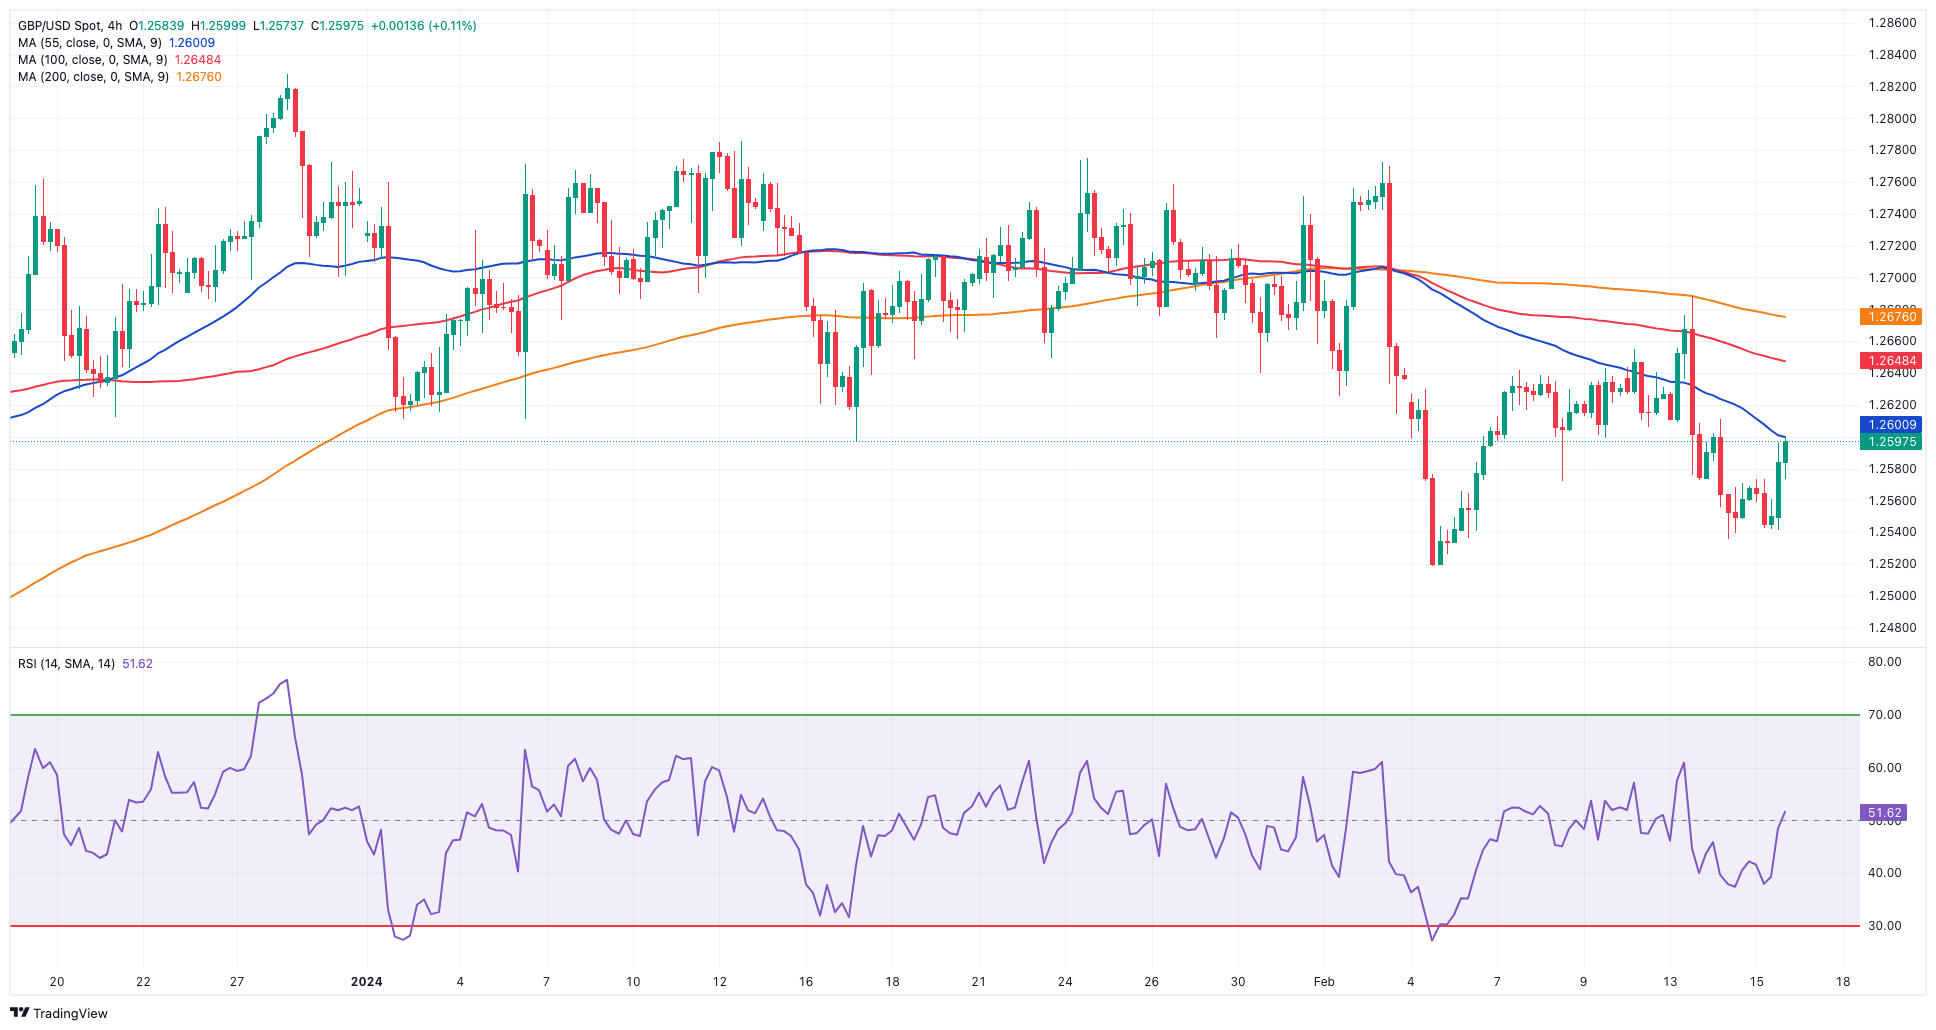
The marked pullback in the US dollar prompted GBP/USD to set aside two consecutive sessions of losses and rise to the vicinity of 1.2600 the figure on Thursday.
Cable, in the meantime, quickly faded the earlier pessimism after GDP figures showed the economy slipped back into a “technical recession” in the October–December period.
On the latter, the GDP 3-Month Average contracted by 0.3% in December, while the GDP came in flat on an annualized basis in the same period. In addition, the GDP Growth Rate contracted by 0.3% QoQ in Q3 and by 0.2% from a year earlier.
Still on the UK docket, Industrial Production and Manufacturing Production expanded by 0.6% and 2.3%, respectively, in the year to December, while the trade deficit shrank to £13.989B also in the last month of 2023. Finally, the NIESR Monthly GDP Tracker dropped by 0.1% in January.
In the wake of UK data releases, the BoE’s M. Greene stressed the importance of maintaining restrictive policy for a prolonged period. She argued that additional evidence is needed to ensure that inflation persistence is not deeply entrenched in a context where inflation expectations in the UK remain stable. Greene noted that wage growth is progressing positively at a time when she requires more evidence to confirm the strength of inflation persistence despite market expectations of rate cuts. According to Greene, the UK's technical recession should not be exaggerated.
It's worth mentioning that the markets currently anticipate the first rate cut by the BoE to occur in August, with expectations for a total easing of only 75 bps in 2024. This stands in contrast to the beginning of the year when the markets were anticipating the first cut in June and nearly 125 bps of total easing in 2024.
In the UK money market, 10-year gilt yields traded in an inconclusive fashion around the key 4.0% region.
Breaking below the 2024 bottom of 1.2518 (February 5), reveals the December 2023 low of 1.2500 (December 13). Extra weakness may lead GBP/USD to seek the weekly low of 1.2187 (November 10, 2023), before reaching the October 2023 low of 1.2037 (October 3), the critical 1.2000 mark, and the 2023 low of 1.1802 (November 10, 2023). On the upside, the weekly top at 1.2683 presents early resistance, ahead of the 2024 peak of 1.2785 (January 12). Further up, the December high of 1.2827 (December 28) comes prior to the weekly top of 1.2995 (July 27, 2023), which is just shy of the important 1.3000 level. The RSI on the daily chart rose to about 45.
Resistance levels: 1.2611 1.2683 1.2772 (4H chart)
Support levels: 1.2518 1.2500 1.2448 (4H chart)
GOLD
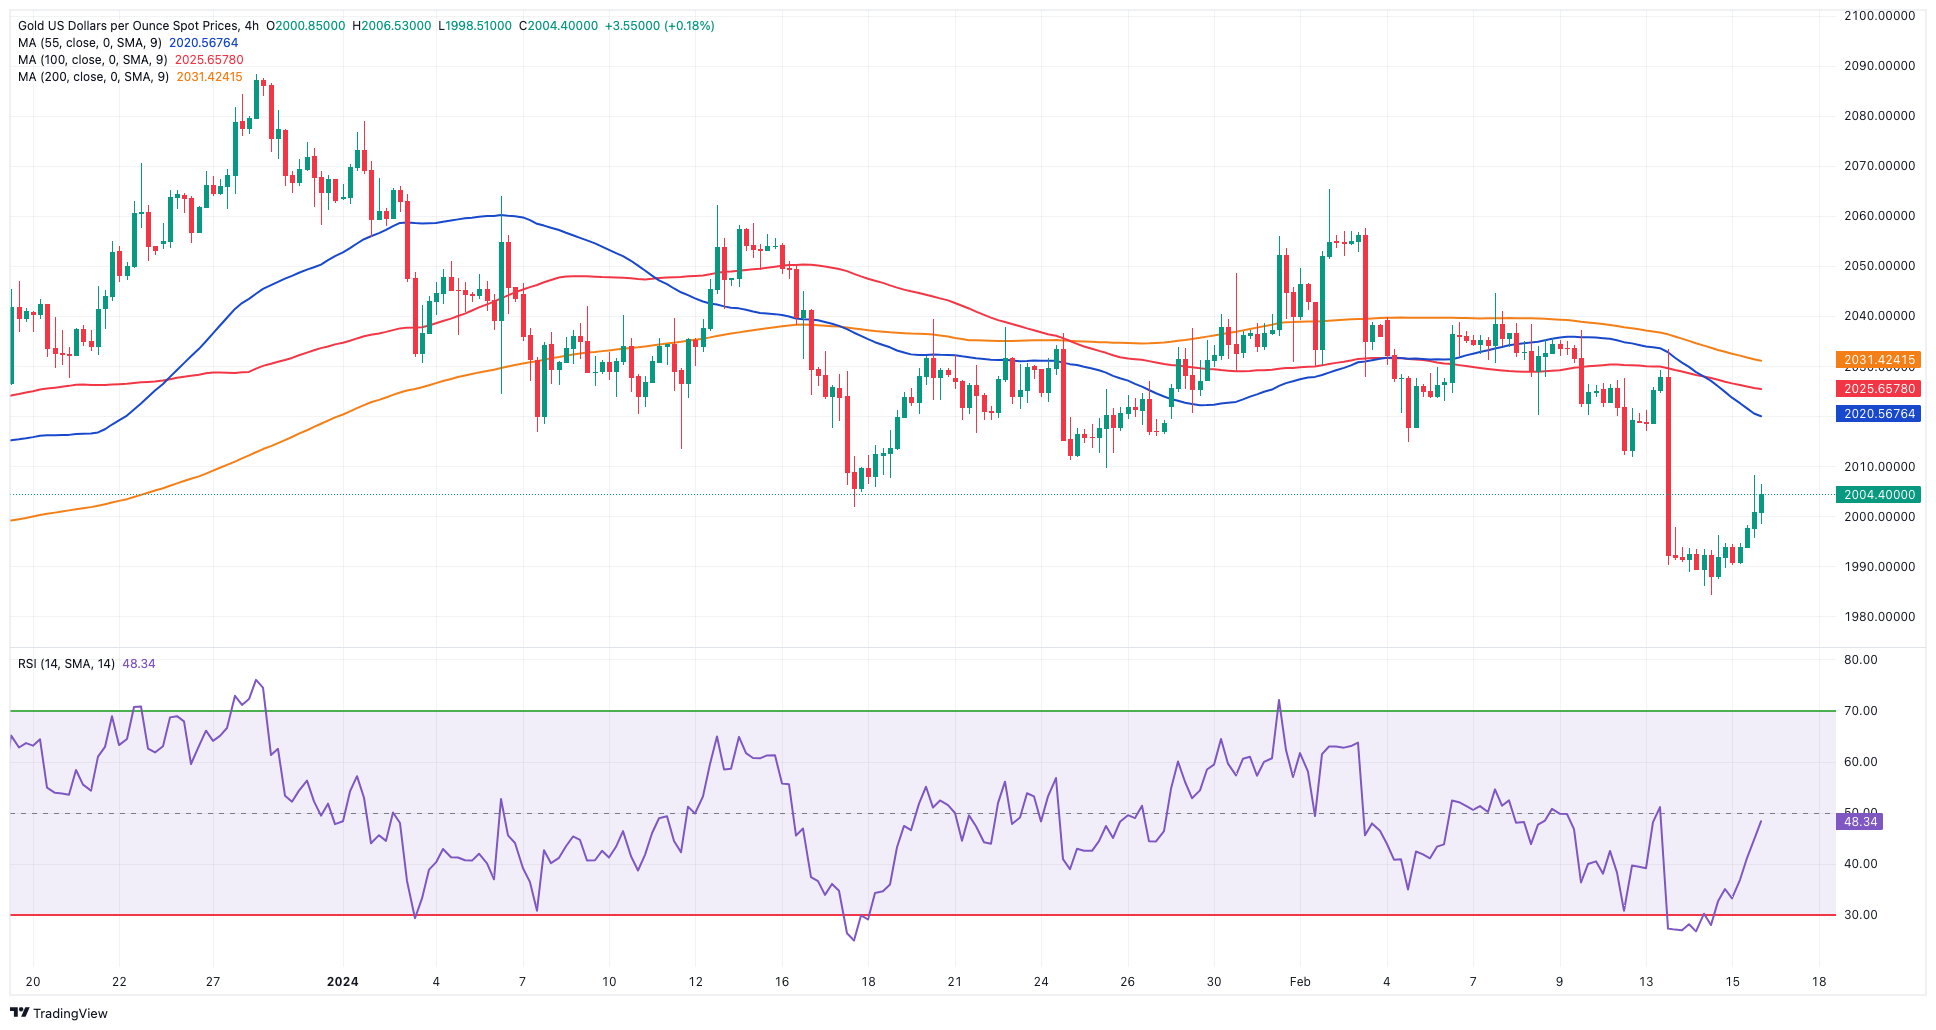
Finally, some respite for the precious metal came in on Thursday.
That said, further correction in the greenback coupled with an equally moderate pullback in US yields across the board seem to have sparked a bout of buying interest in the yellow metal, which reclaimed the key $2,000 hurdle and beyond on Thursday.
However, bullion is expected to remain under the microscope in the next few months against the backdrop of further speculation that the Fed might delay the beginning of the easing cycle. So far, market participants continue to see the first rate cut at the June 12 event, a view that gathered extra steam soon after US inflation figures came in above estimates in January.
Next on the downside for Gold prices emerges the 2024 low of $1,984 (February 14) ahead of the December 2023 low of $1,973, which is supported by the proximity of the key 200-day SMA at $1,965. A deeper decline might bring the November 2023 bottom of $1,931 back into view, prior to the October 2023 low of $1,810, the 2023 low of $1,804, and the $1,800 contention zone. Instead, bullish attempts might push the metal back to its February peak of $2,065 (February 1), ahead of the weekly high of $2,088 (December 28) and all-time top of $2,150. (December 4, 2023).
Resistance levels: $2,008 $2,031 $2,044 (4H chart)
Support levels: $1,984 $1,973 $1,965 (4H chart)
CRUDE WTI
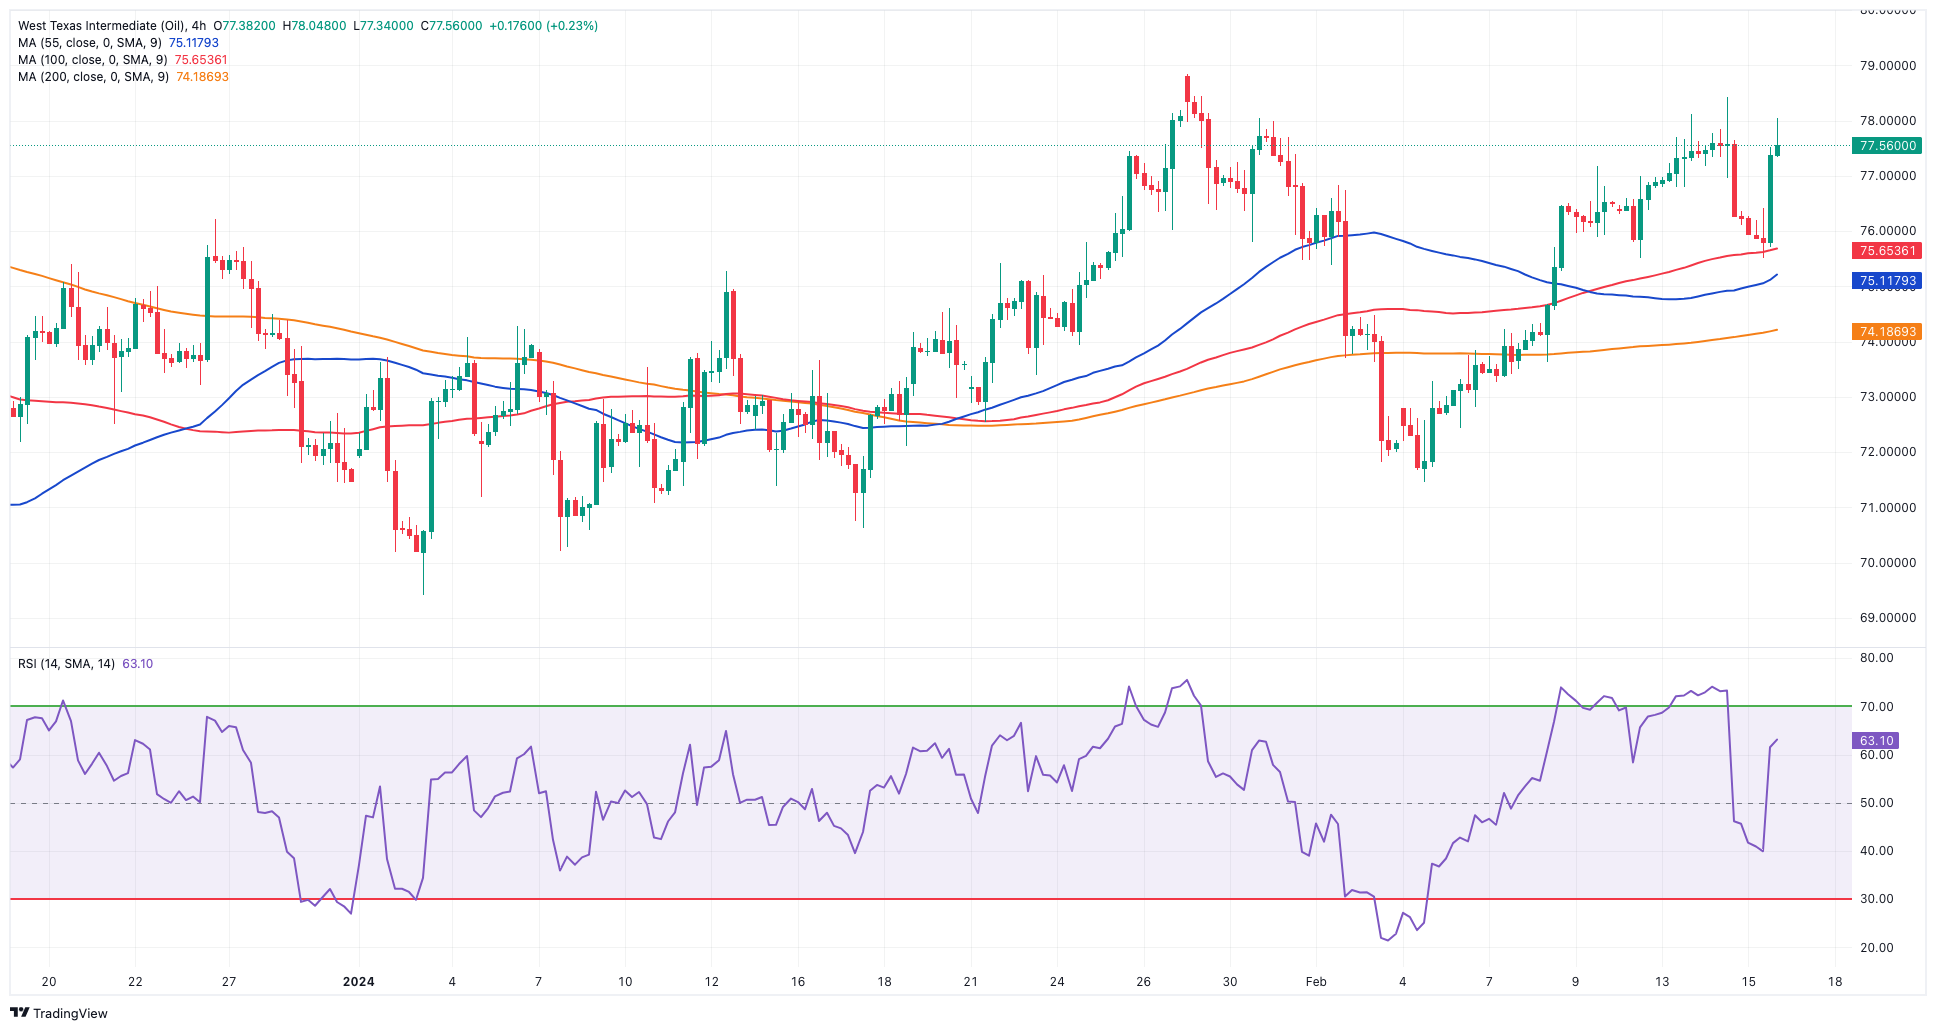
Prices of the American benchmark for sweet light crude oil resumed their uptrend on Thursday, leaving behind Wednesday’s pullback and briefly flirting with the key $78.00 mark per barrel.
In fact, traders rapidly set aside the unexpected build of weekly US crude oil supplies reported by the EIA on Wednesday (+12.018M barrels), refocusing instead on the weaker dollar and softer-than-expected US Retail Sales.
However, the upside potential of the commodity appeared undermined after the IEA suggested a slowdown in global oil demand, leading the agency to lower its growth forecast for 2024 to 1.22 mbpd (from 1.24 mbpd). In addition, the report expected crude oil supply to grow by 1.7 mbpd this year (from 1.5 mbpd).
In the meantime, ongoing geopolitical concerns related to the Russia-Ukraine conflict, the Middle East, and the Red Sea conflict are expected to continue supporting the prices of crude oil.
Adding to the positive sentiment, the OPEC has reaffirmed its outlook for robust growth in global oil demand for this year and 2025. Furthermore, the cartel has revised its economic growth forecasts upward for both years, highlighting the potential for additional upside. It is anticipated that global oil demand will increase by 2.25 mbpd in 2024 and by 1.85 mbpd in 2025.
The next upward block for WTI comes at the February top of $78.44, before the 2024 peak of $79.25 (January 29), which is immediately followed by the critical $80.00 barrier and the November 2023 high of $80.15 (November 3). Extra gains from here may propel the commodity back to its weekly top of $89.83 (October 18, 2023), ahead of the 2023 peak of $94.99 (September 28, 2023) and the August 2022 high of $97.65 (August 30), all before hitting the psychological $100.00 hurdle. Just the opposite, the loss of the February low of $71.43 (February 5) might bring the important $70.00 barrier back into play, followed by the 2024 bottom of $69.31 (January 3).
Resistance levels: $78.74 $79.25 $79.56 (4H chart)
Support levels: $75.49 $74.16 $71.37 (4H chart)
GER40
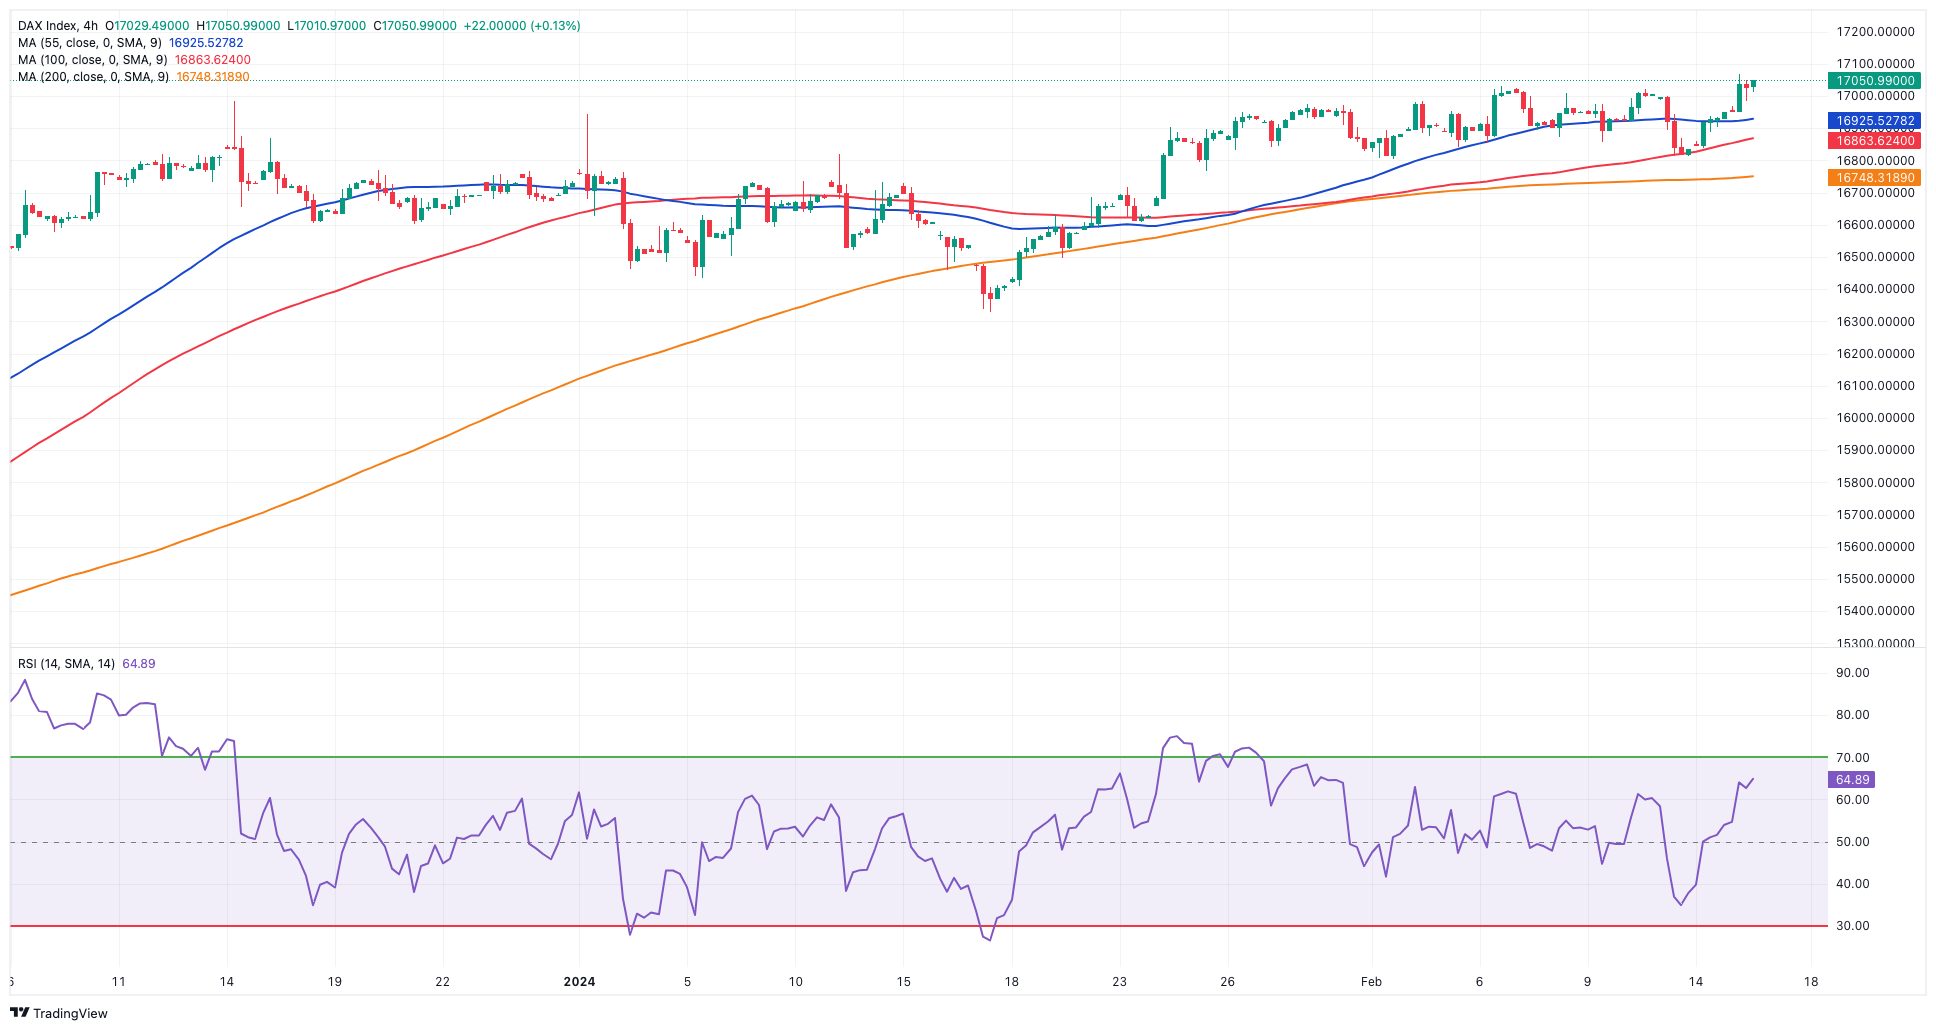
A positive mood prevailed in European stock markets on Thursday, sending both France’s CAC40 and Germany’s DAX40 to fresh record highs.
Indeed, the DAX40 flirted with the 17,100 zone as investors continued to assess positive results from corporate earnings reports, while poor prints from US Retail Sales also propped up the broad-based optimism.
In addition, the ECB’s C. Lagarde argued that inflation in the region seems to head towards the central bank’s 2.0% target, which further reignited speculation that a potential interest rate cut should emerge on the near-term horizon.
In the German bond market, 10-year bund yields rose marginally past 2.35%, in contrast to the generalized pullback in their US peers.
The DAX40's next upward hurdle is its all-time high of 17,089 (February 15). In the other direction, the February low of 16,821 (February 1) provides immediate support, followed by the transitory 55-day SMA at 16,713 and the 2024 bottom at 16,345 (January 17). After clearing the latter, the index is anticipated to hit the 200-day SMA at 16,001, before falling to its weekly low of 15,915 (November 28). The next support comes at the October 2023 of low 14,630 (October 23), seconded by the March 2023 low of 14,458 (March 20). The daily RSI climbed to around 60.
Best Performers: Commerzbank, Rheinmetall, Vonovia
Worst Performers: Siemens Energy AG, Airbus Group, Deutsche Boerse
Resistance levels: 17,089 (4H chart)
Support levels: 16,831 16,540 16,345 (4H chart)
GBPJPY
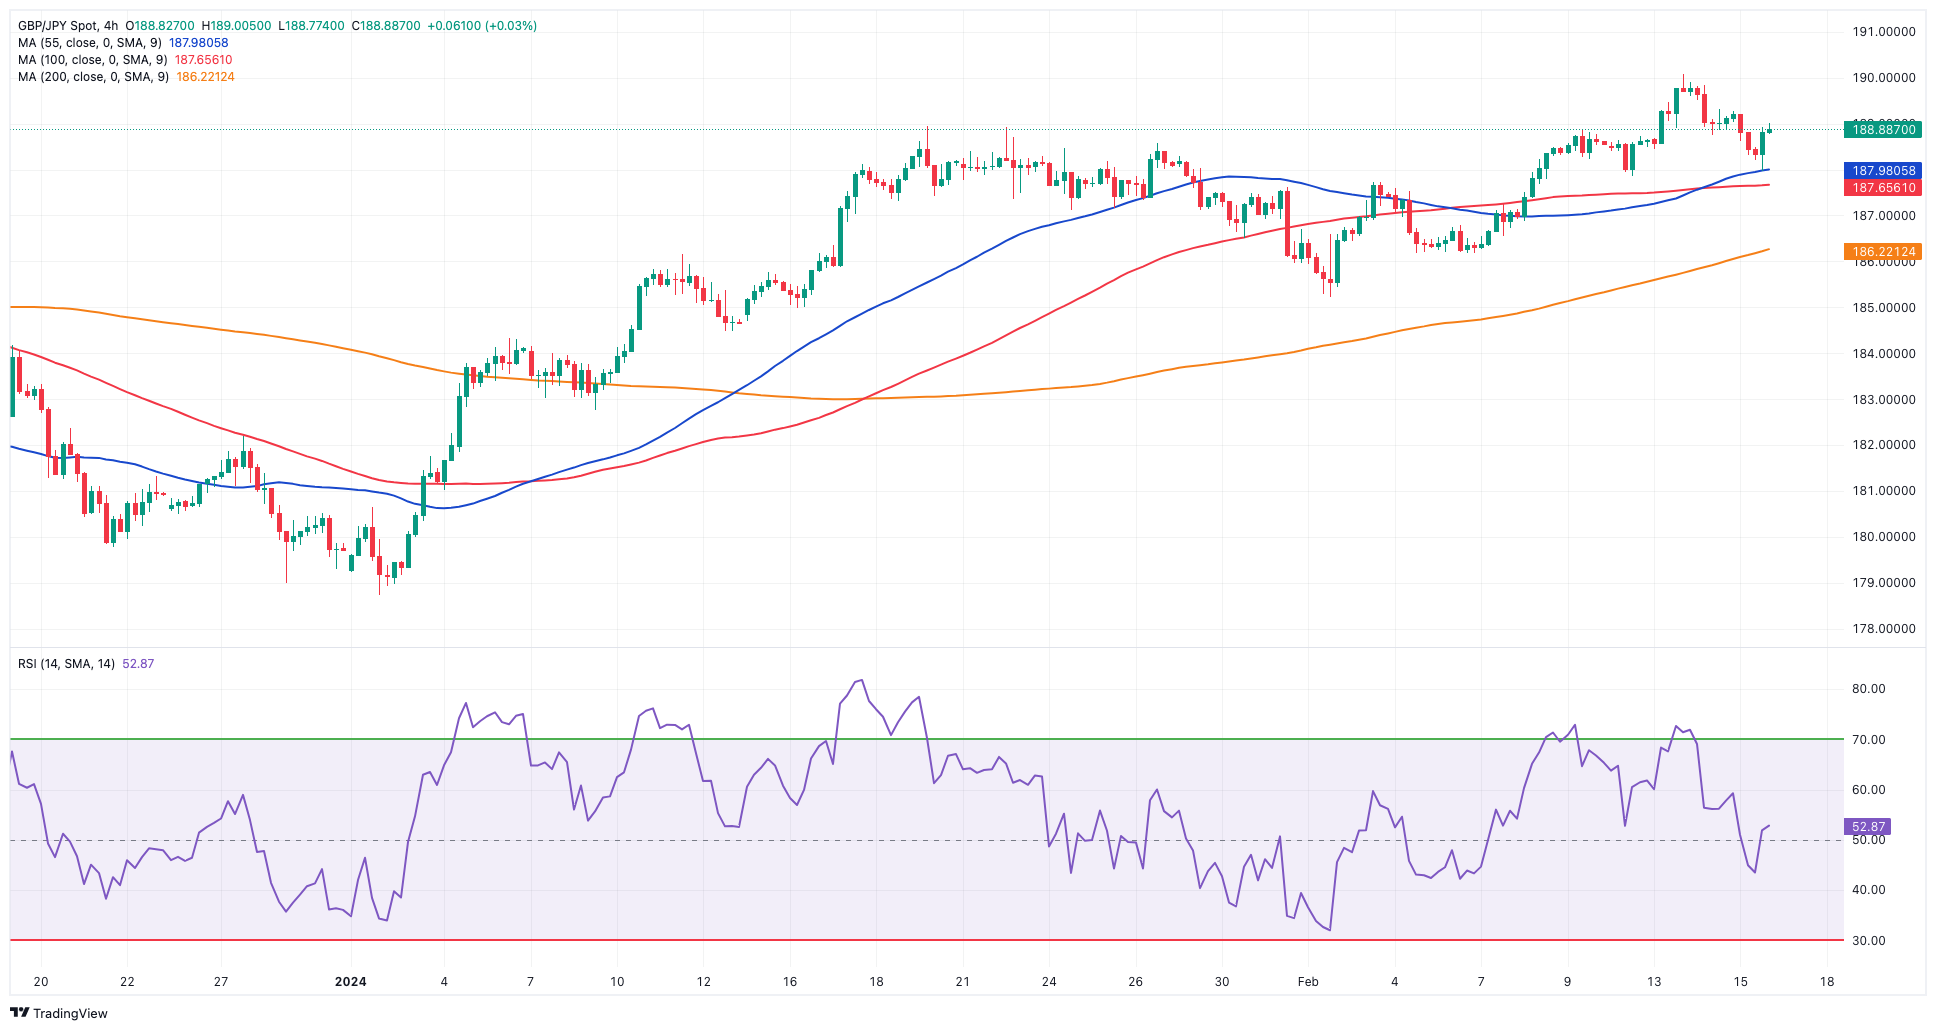
The bearish tone in sterling and some upside momentum in the Japanese yen prompted GBP/JPY to abandon Tuesday’s area of yearly highs just above the 190.00 hurdle on Wednesday.
That said, the cross came under selling pressure after a five-day positive streak, which was almost exclusively on the back of the sharp depreciation of the Japanese currency, particularly on the back of investors’ repricing of an interest rate cut by the Fed later than initially anticipated.
The next target for GBP/JPY is the 2024 high of 190.08 (February 13), which comes before the August 2015 record of 195.28. If bears gain control, spot may fall to its February low of 185.22 (February 1) before attempting to break through intermediate support at the 55-day and 100-day SMAs of 184.93 and 184.41, respectively. If the cross breaks below this zone, it might target the more significant 200-day SMA at 182.30, before the December 2023 bottom of 178.33 (December 14) and the October 2023 low of 178.03. (October 3). A further loss may return a challenge to the July 2023 bottom of 176.30, ahead of the May 2023 low of 167.84. (May 11). The daily RSI fell below the 62 threshold.
Resistance levels: 190.08 195.28 195.88 (4H chart)
Support levels: 187.99 186.25 185.22 (4H chart)
NASDAQ
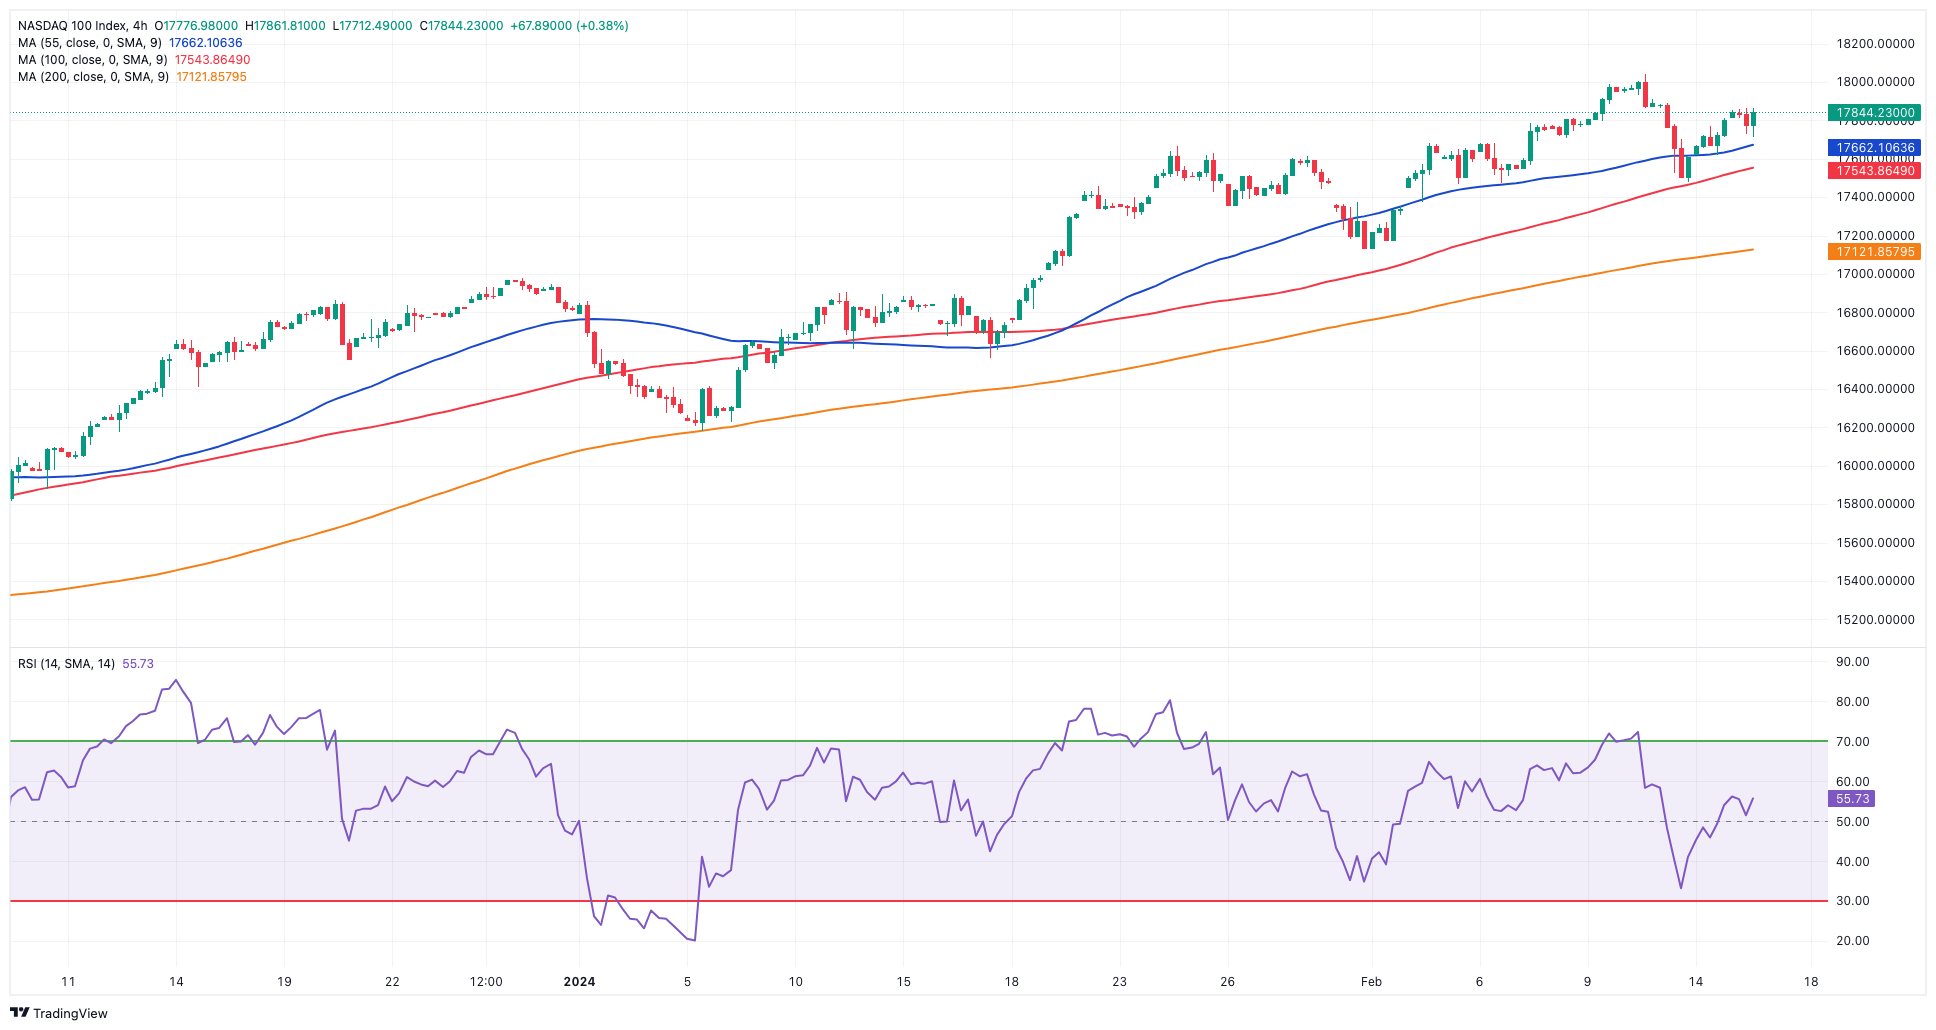
Mirroring the optimism in the rest of the US markets, the tech reference Nasdaq 100 added to Wednesday’s uptick and approached the 17,900 zone on Thursday, or three-day highs.
The resurgence of the uptrend in the US tech sector came pari passu with further declines in the dollar along with shrinking US yields, all in response to weaker results from the US docket.
Contributing to the upside, AI-related stocks continued to underpin the sentiment, with chip maker NVIDIA again at the centre of the debate.
The Nasdaq 100 hit a new high of 18,041 on February 12. Alternatively, bearish attempts should initially target the weekly low of 17,128 (January 31), which comes before the intermediate 55-day SMA of 16,878 and the 2024 low of 16,249 (January 5). If the index breaks below this zone, it might reach the December 2023 low of 15,695 (December 4) and the critical 200-day SMA of 15,439. The breach of this level may lead a slide to the October 2023 bottom of 14,058 (October 26), before hitting the April 2023 low of 12,724 (April 25), the March 2023 low of 11,695 (March 13), and the 2023 low of 10,696 (January 3). The daily chart shows the RSI nearing the 63 zone.
Top Gainers: Airbnb, Moderna, Diamondback
Top Losers: Datadog, Alphabet A, Alphabet C
Resistance levels: 18,041 (4H chart)
Support levels: 17,478 17,128 16,561 (4H chart)
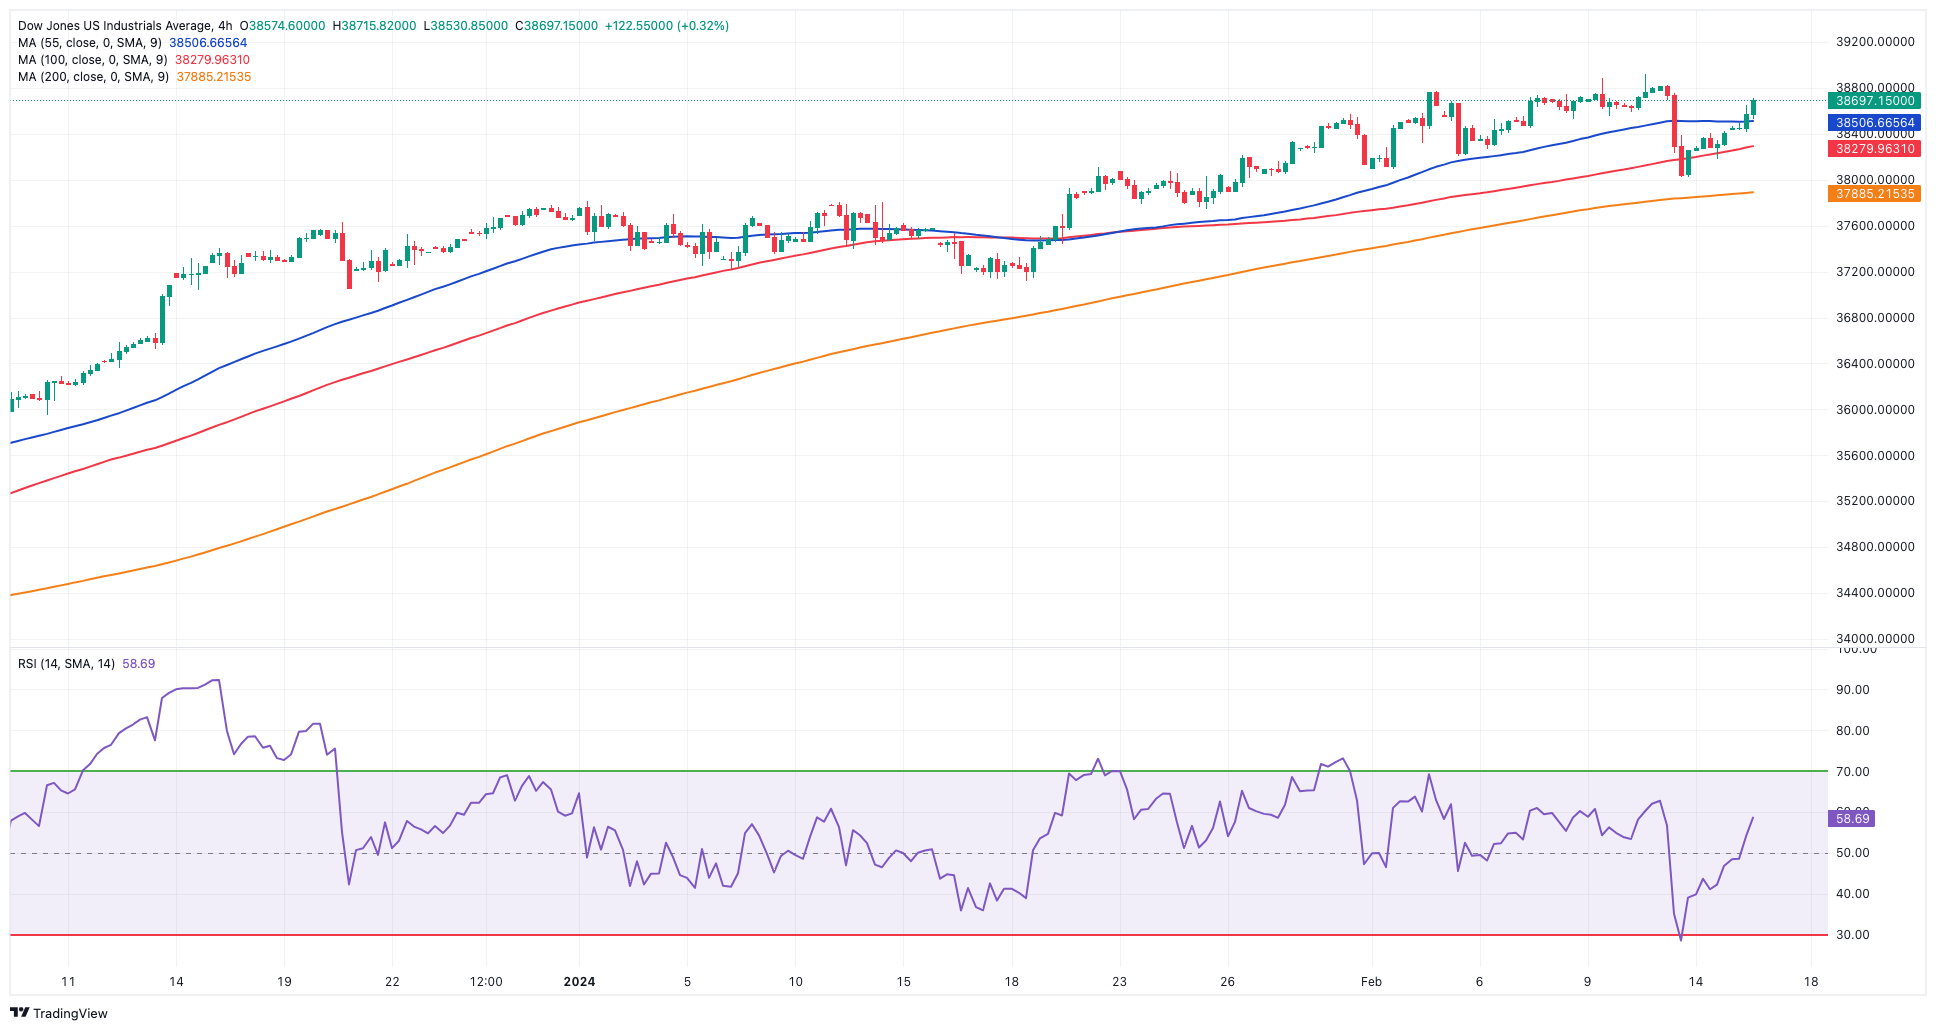
DOW JONES
US equities measured by the Dow Jones added to Wednesday’s rebound and flirted with the 38,700 region on Thursday.
The move higher in the benchmark index came in a context where the dollar retreated further in tandem with US yields, while speculation of a rate cut in May seems to have grabbed some attention following disappointing prints from US Retail Sales in January.
On the latter, according to CME Group's FedWatch Tool, the chance of a rate cut in May grew marginally to nearly 36% and surpasses 52% when it comes to the June interest rate decision.
On the whole, the Dow Jones gained 0.71% to 38,697, the S&P 500 advanced 0.51% to 5,026, and the tech-heavy Nasdaq Composite rose 0.20% to 15,889.
Immediately on the upside comes the Dow Jones' all-time high of 38.927. (February 12). Alternatively, there is intermediate support at the 55-day SMA at 37,447, followed by the 2024 low of 37,122 (January 18), which comes before the weekly low of 37,073. (December 20, 2023). The slide below this level may present a challenge to the intermediate 100-day SMA at 35,816 before the 200-day SMA at 35,042. The weekly low of 33,859 (November 7, 2023) precedes the October 2023 low of 32,327 (October 27) and the 2023 low of 31,429 (March 15). The daily RSI seems to be constant at approximately 53.
Top Performers: Walgreen Boots, Chevron, Dow
Worst Performers: Cisco, Apple, Microsoft
Resistance levels: 38,927 (4H chart)
Support levels: 38,039 37,122 36,021 (4H chart)
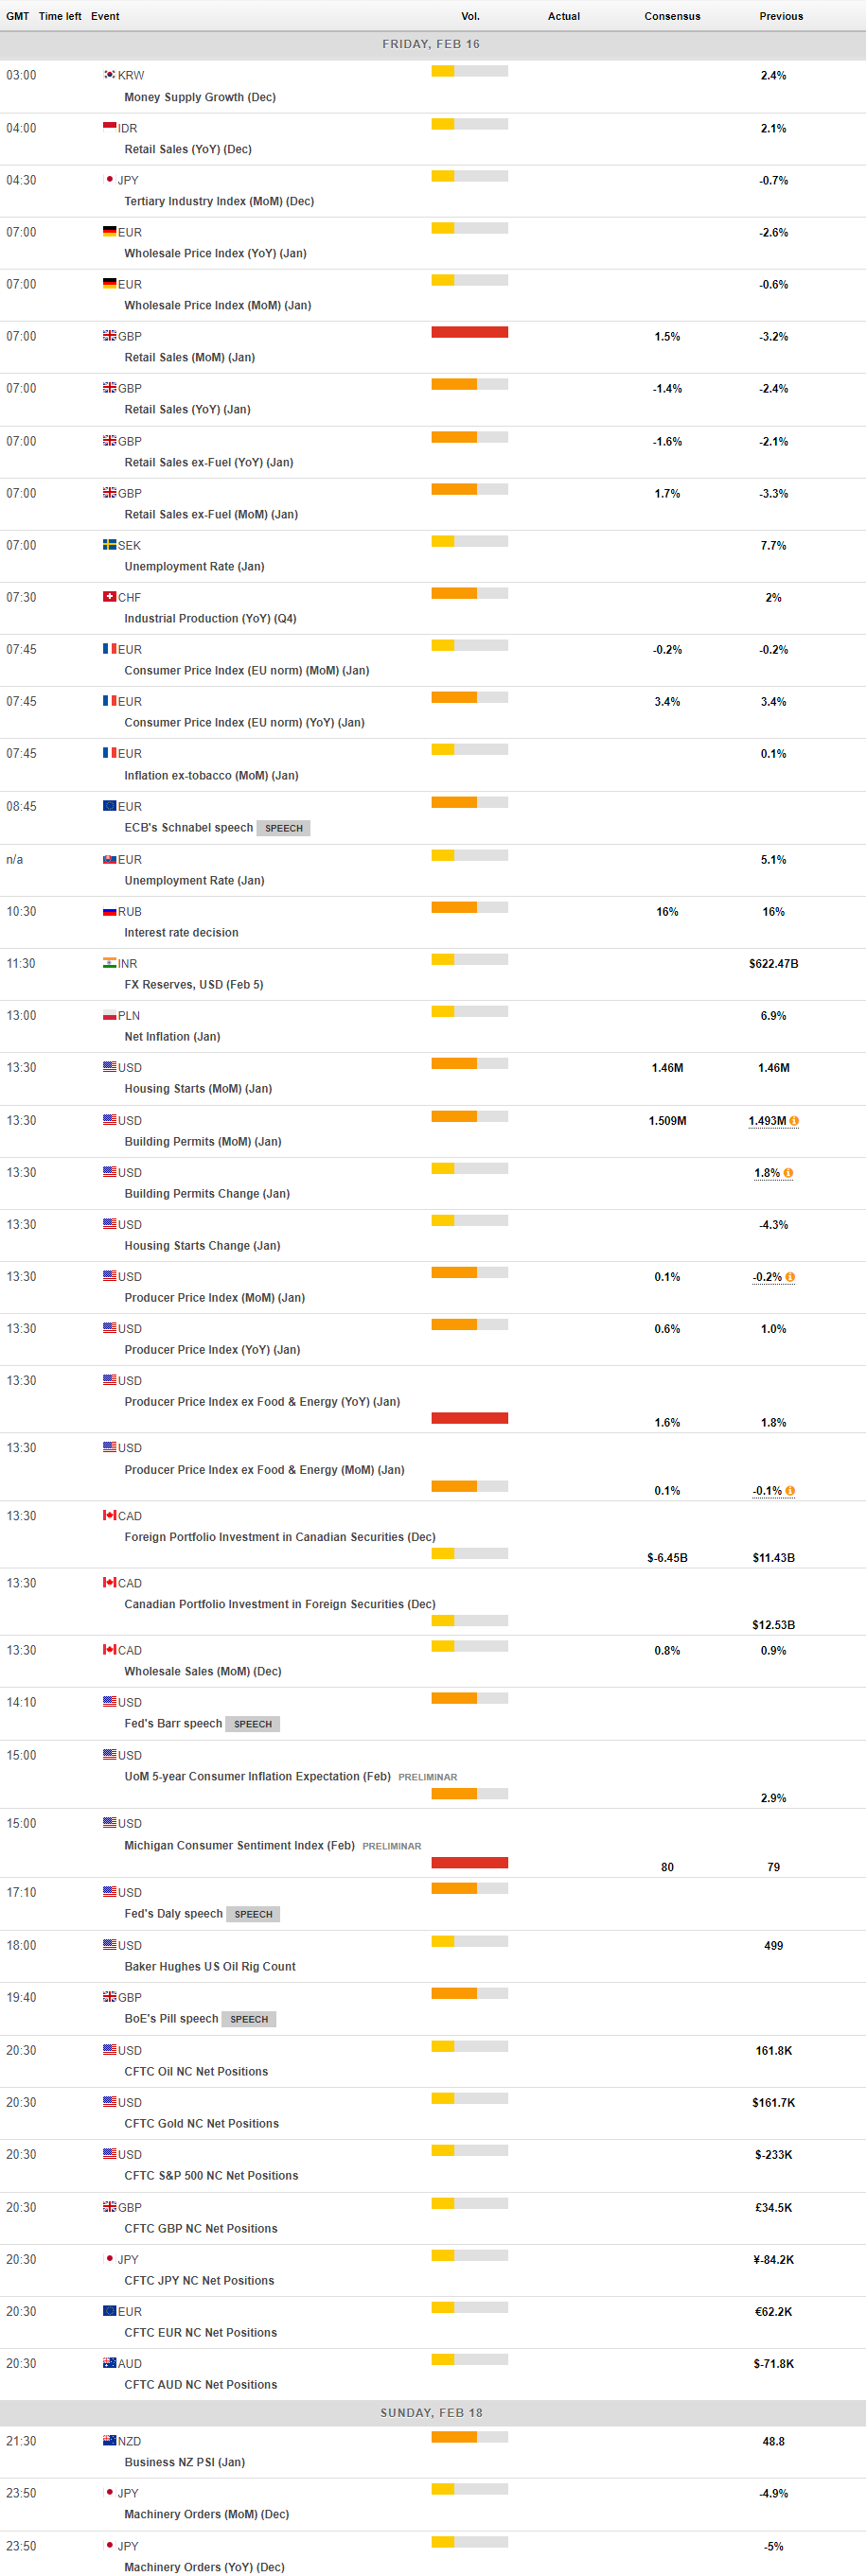
MACROECONOMIC EVENTS
All Information & Updates provided by:

All information relating to the financial markets available on this page has been prepared and issued by FXStreet (Forexstreet SL, Spain, Reg: B62498233) on the basis of publicly available information and all information believed to be reliable and does not conflict with Kuwaiti local laws, and all necessary care has been taken to before the company to ensure that the facts mentioned are correct from the source.
NCM Investment nor any of its directors or employees shall in any way be held responsible for the contents of this news, and the information contained on this page is intended only to provide clients with publicly available information and should not be construed as investment advice, report or analysis and/or constitute an offer or invitation to buy or sell financial instruments of any kind.
RISK WARNING: Forex and CFDs are highly risky leveraged products, as losses can exceed deposits. Please ensure you understand all the risks and take independent advice if necessary. NCM will segregate the clients based on the criteria of the regulator and its bylaws. NCM does not provide any advisory service; the material published does not constitute advice or a recommendation for a transaction in any financial instrument. NCM accepts no responsibility for any use of the content presented and any consequences of that use. Anyone acting on the information provided does so at their own risk.