Daily Market Updates
19 Feb 2024
EURUSD
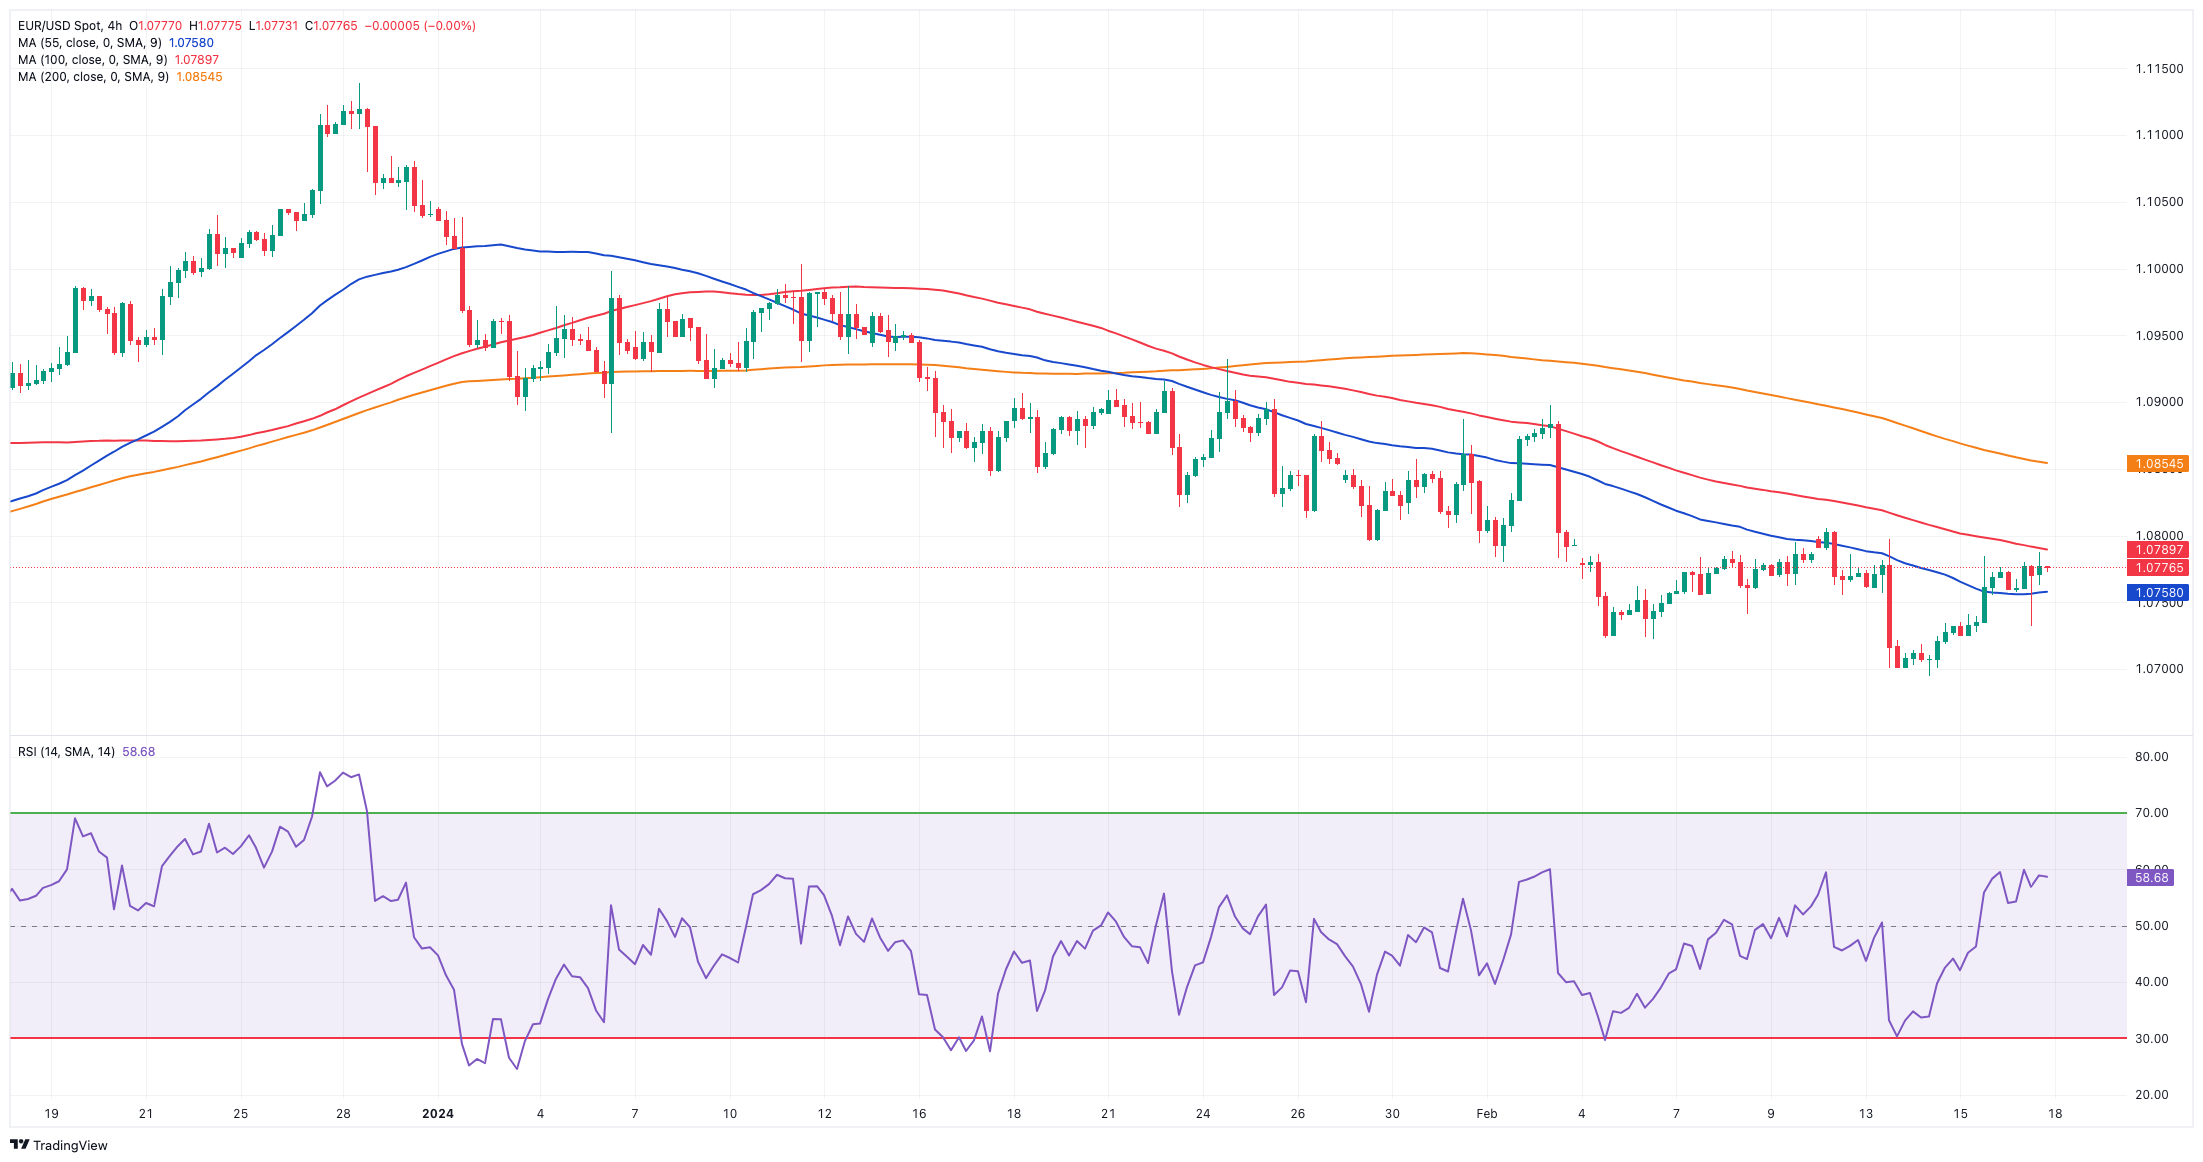
EUR/USD extended its recovery further following yearly lows in the sub-1.0700 region recorded on Tuesday, managing to close the week with modest gains around 1.0780.
The daily uptick in the pair came pari passu with further correction in the greenback after hitting fresh yearly tops in the boundaries of 105.00 the figure earlier in the week when tracked by the USD Index (DXY). Despite this bearish development, the index clinched its fifth consecutive week of gains in tandem with fresh multi-week peaks in US yields across different timeframes.
Meanwhile, Fed speakers maintained their view of 2-3 interest rate cuts this year, with the start of the easing cycle expected around June, according to CME Group’s FedWatch Tool.
Around the ECB, Board member I. Schnabel reiterated that the bank is in no rush to reduce its policy rates. She stressed the significance of upholding a restrictive monetary policy level to facilitate a decrease in inflation and consequently foster "productivity growth" within the bloc.
Data-wise, in the US, Building Permits contracted by 1.5% MoM in January (1.47M units) and Housing Starts contracted by 14.8% MoM (1.331M units). In addition, Producer Prices rose more than expected by 0.3% on a monthly basis in January and 0.9% over the last twelve months. Finally, the preliminary Consumer Sentiment improved marginally to 79.6 for the current month.
EUR/USD's uptrend immediately targets the weekly high of 1.0805 (February 12), just ahead of the crucial 200-day SMA at 1.0827 and the intermediate 55-day SMA at 1.0881. Further north, the weekly top of 1.0932 (January 24) is followed by another weekly peak of 1.0998 (January 5, 11). The breakout of this region exposes the December 2023 high of 1.1139 (December 27), which remains propped-up by the 200-week SMA of 1.1148 and comes before the 2023 top of 1.1275 (July 18). In the other direction, the 2024 low of 1.0694 (February 14) is next, followed by the weekly low of 1.0495 (October 13, 2023), the 2023 low of 1.0448 (October 3), and the round level of 1.0400. The daily RSI rose to around 44.
Resistance levels: 1.0805 1.0854 1.0932 (4H chart)
Support levels: 1.0694 1.0656 1.0516 (4H chart)
USDJPY
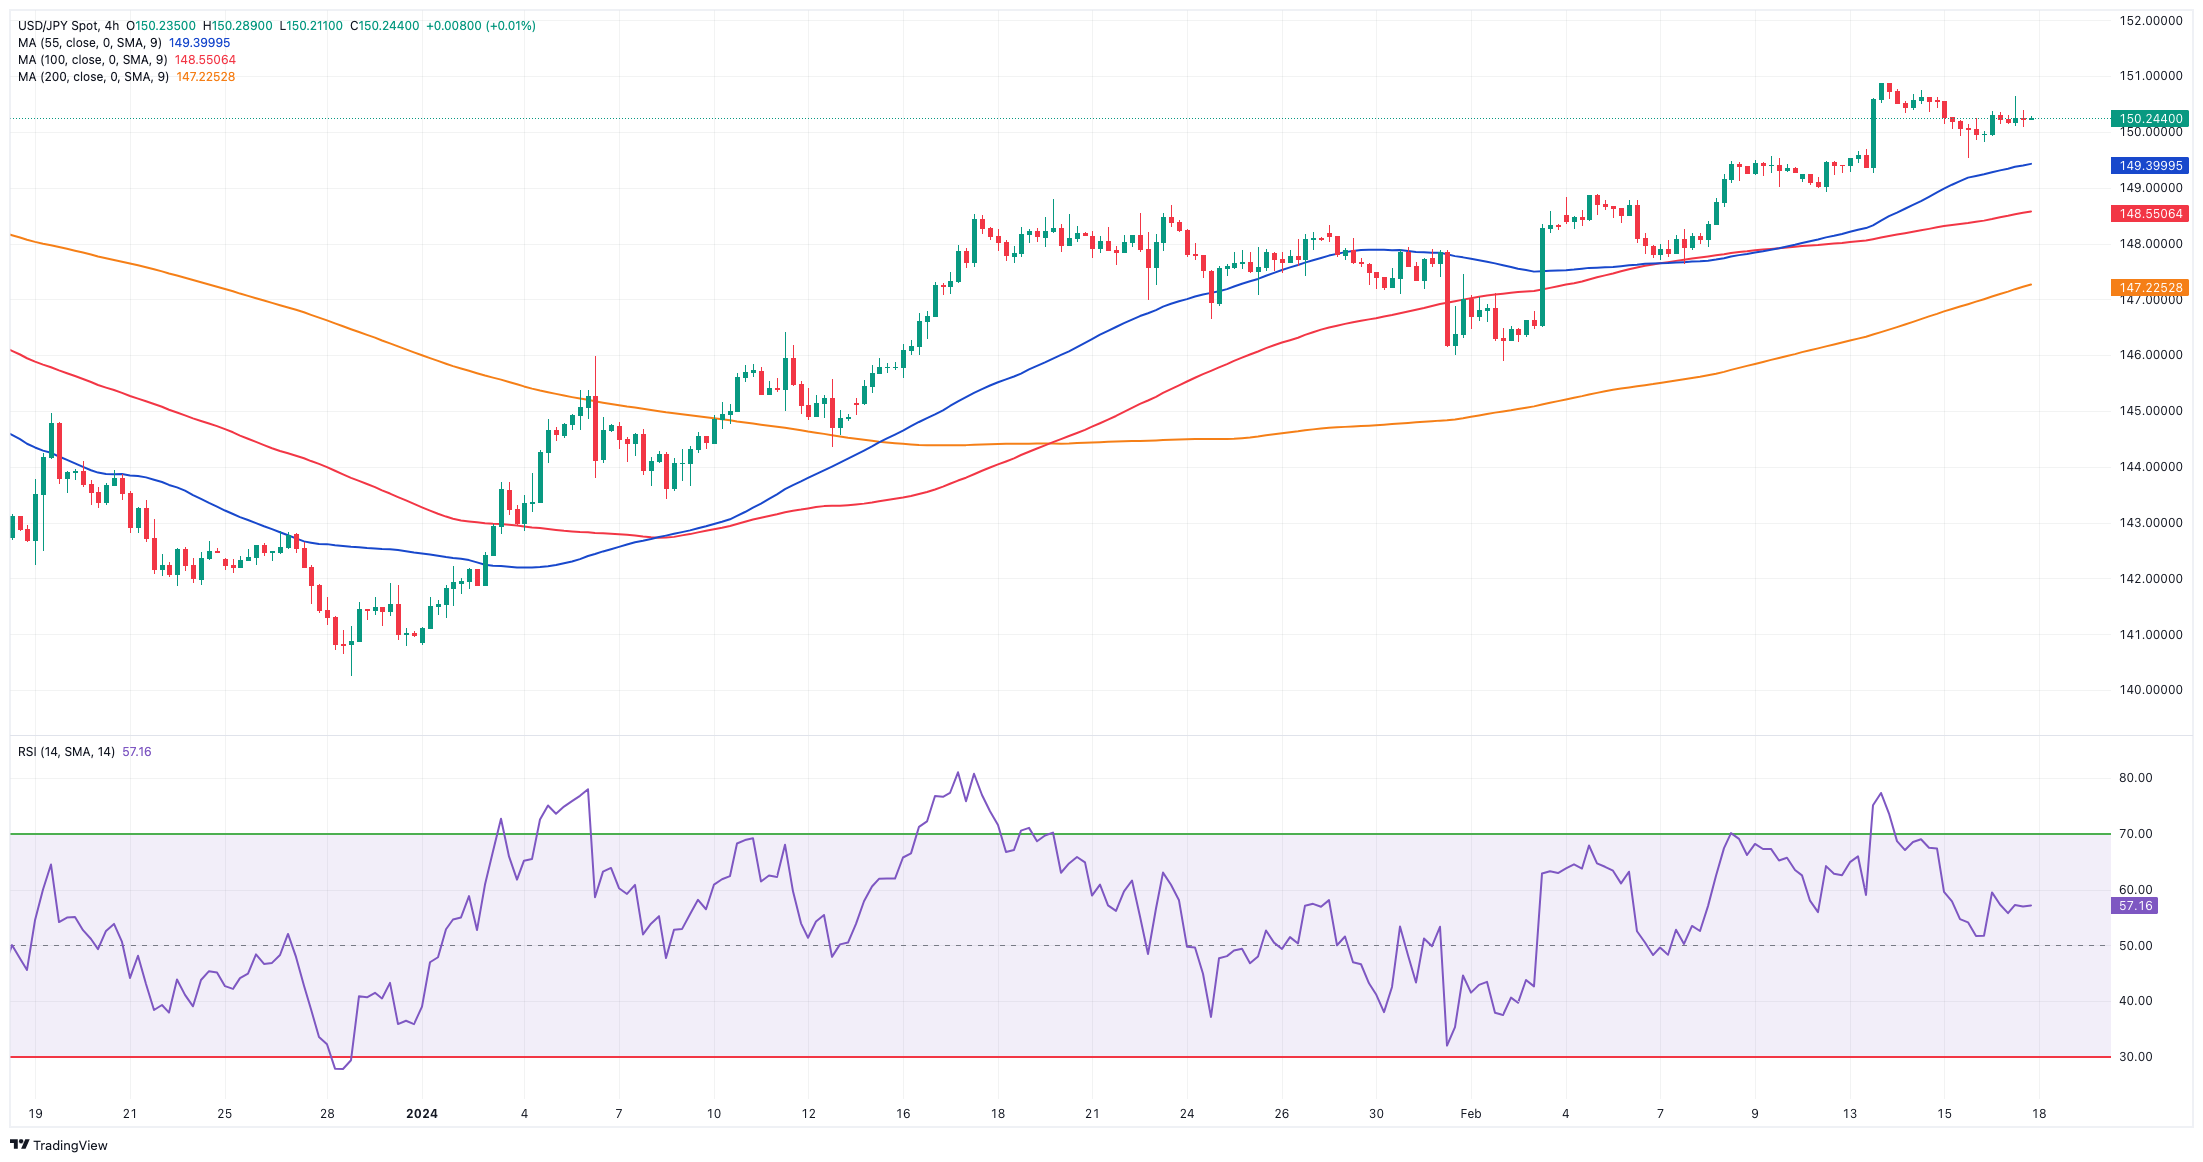
The Japanese yen relinquished some of its recent advance and lifted USD/JPY back above the 150.00 mark amidst decent gains on Friday.
The inconclusive price action in the greenback in combination with further rebound in US yields across the board and dovish comments from BoJ’s K. Ueda were all too much for the Japanese currency, sparking a moderated bounce for the pair.
Back to the BoJ, Governor Ueda emphasized that the bank will meticulously analyze forthcoming economic data, particularly focusing on the results of the impending spring wage negotiations. Highlighting the BoJ's objective to achieve its sustainable 2% inflation target coupled with wage increases, Ueda underlined the bank's aspiration for a positive cycle of elevated wages and increased consumption to gather pace.
In the Japanese bond market, JGB 10-year yields traded without a clear direction around 0.73%.
In the domestic calendar, Foreign Bond Investment rose to ¥1499.3B in the week to February 10, and the Tertiary Industry Index increased by 0.7% MoM in December.
If bulls have the upper hand, USD/JPY may test the 2024 high of 150.88 (February 13), ahead of the 2023 top of 151.90 (November 13). Further north, the 2022 peak of 151.94 (October 21) is closely followed by the round figure of 152.00. On the contrary, the 100-day SMA should provide temporary support around 147.61 before the February low of 145.89 (February 1), which appears reinforced by the preliminary 55-day SMA. The significant 200-day SMA of 145.30 precedes the December 2023 low of 140.24 (December 28), the round number of 140.00, and the July low of 137.23 (July 14). The daily RSI bounced to the 64 range.
Resistance levels: 150.88 151.43 151.90 (4H chart)
Support levels: 149.50 148.92 147.61 (4H chart)
GBPUSD
Further weakness in the greenback allowed extra recovery in the British pound at the end of the week.
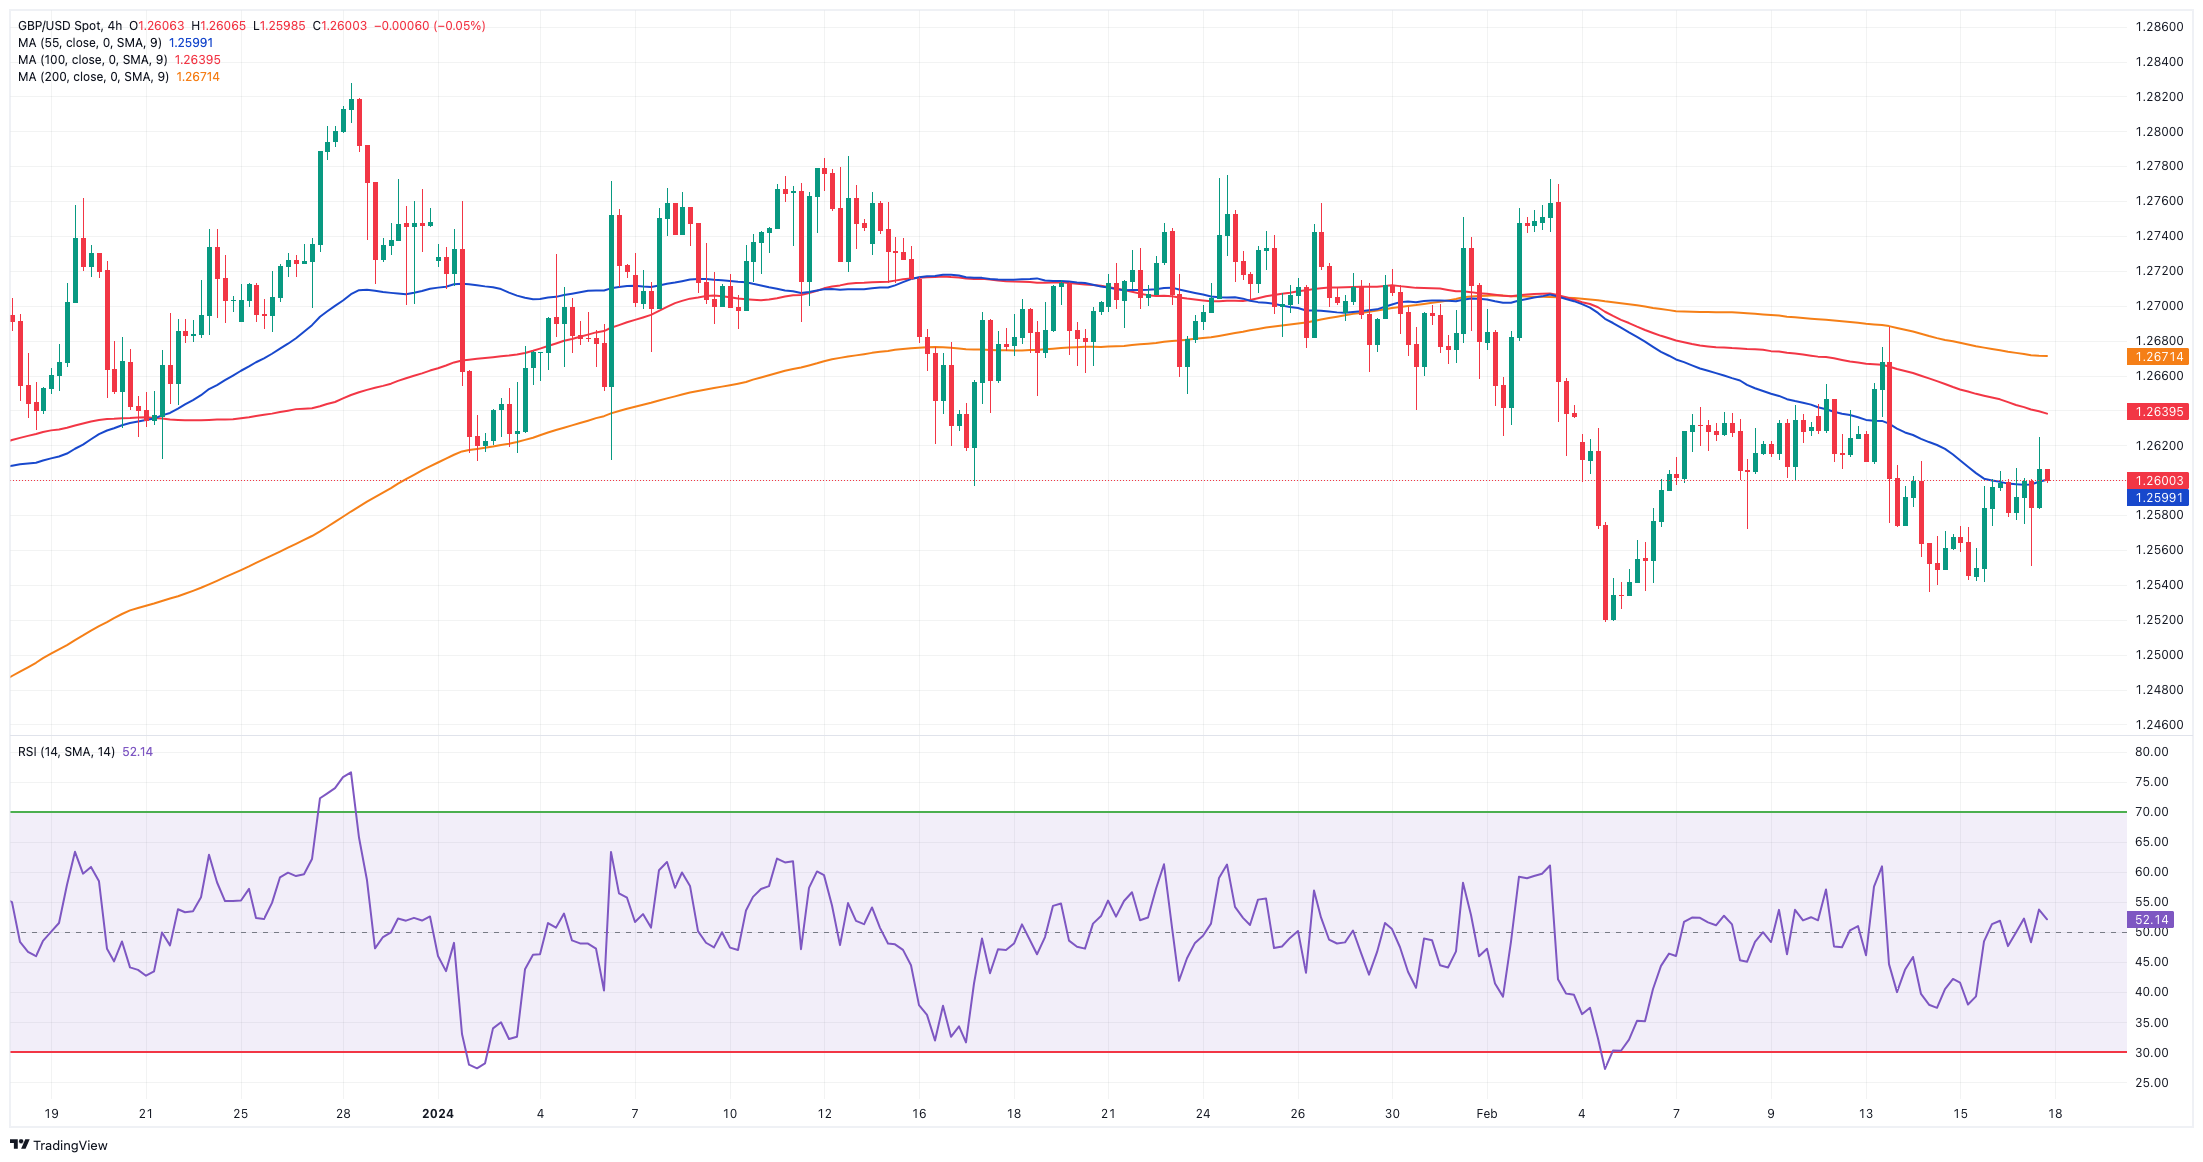
In fact, GBP/USD added to Thursday’s advance and kept the optimism well and sound in the latter part of the week, climbing past the 1.2600 barrier to clock three-day highs on Friday.
The upbeat mood around Cable was bolstered by encouraging prints in the UK docket after headline Retail Sales expanded by 0.7% in the year to January and 0.7% YoY when excluding Fuel.
From the BoE, H. Pill said that according to the available data, reaching the stage where the bank rate can be reduced is not yet imminent. It seems that the bank will need to wait a few more months before we can be confident that persistent inflation has subsided.
In line with the move higher in spot, 10-year gilt yields rose for the second consecutive day, approaching the 4.15% region.
It is important to note that the financial markets are currently anticipating the first interest rate cut by the BoE to take place in August. The expectations for the total amount of easing have also changed compared to the beginning of the year. Currently, the markets are expecting a total easing of only 75 bps in 2024 vs. earlier predictions, which anticipated the first rate cut to occur in June and a total easing of nearly 125 bps this year.
Further gains in GBP/USD now target the weekly top at 1.2683, ahead of the 2024 peak at 1.2785 (January 12). The breakout of the latter could prompt a test of the December high of 1.2827 (December 28) to emerge on the horizon prior to the weekly top of 1.2995 (July 27, 2023), which is just short of the critical 1.3000 yardstick. On the downside, initial contention lies at the 2024 low of 1.2518 (February 5) ahead of the December 2023 low of 1.2500 (December 13). Extra weakening may cause spot to shift its focus to the weekly bottom of 1.2187 (November 10, 2023), before hitting the October 2023 low of 1.2037 (October 3), the key 1.2000 level, and the 2023 low of 1.1802 (November 10, 2023). The RSI on the daily chart settled above 45.
Resistance levels: 1.2624 1.2683 1.2772 (4H chart)
Support levels: 1.2518 1.2500 1.2448 (4H chart)
GOLD
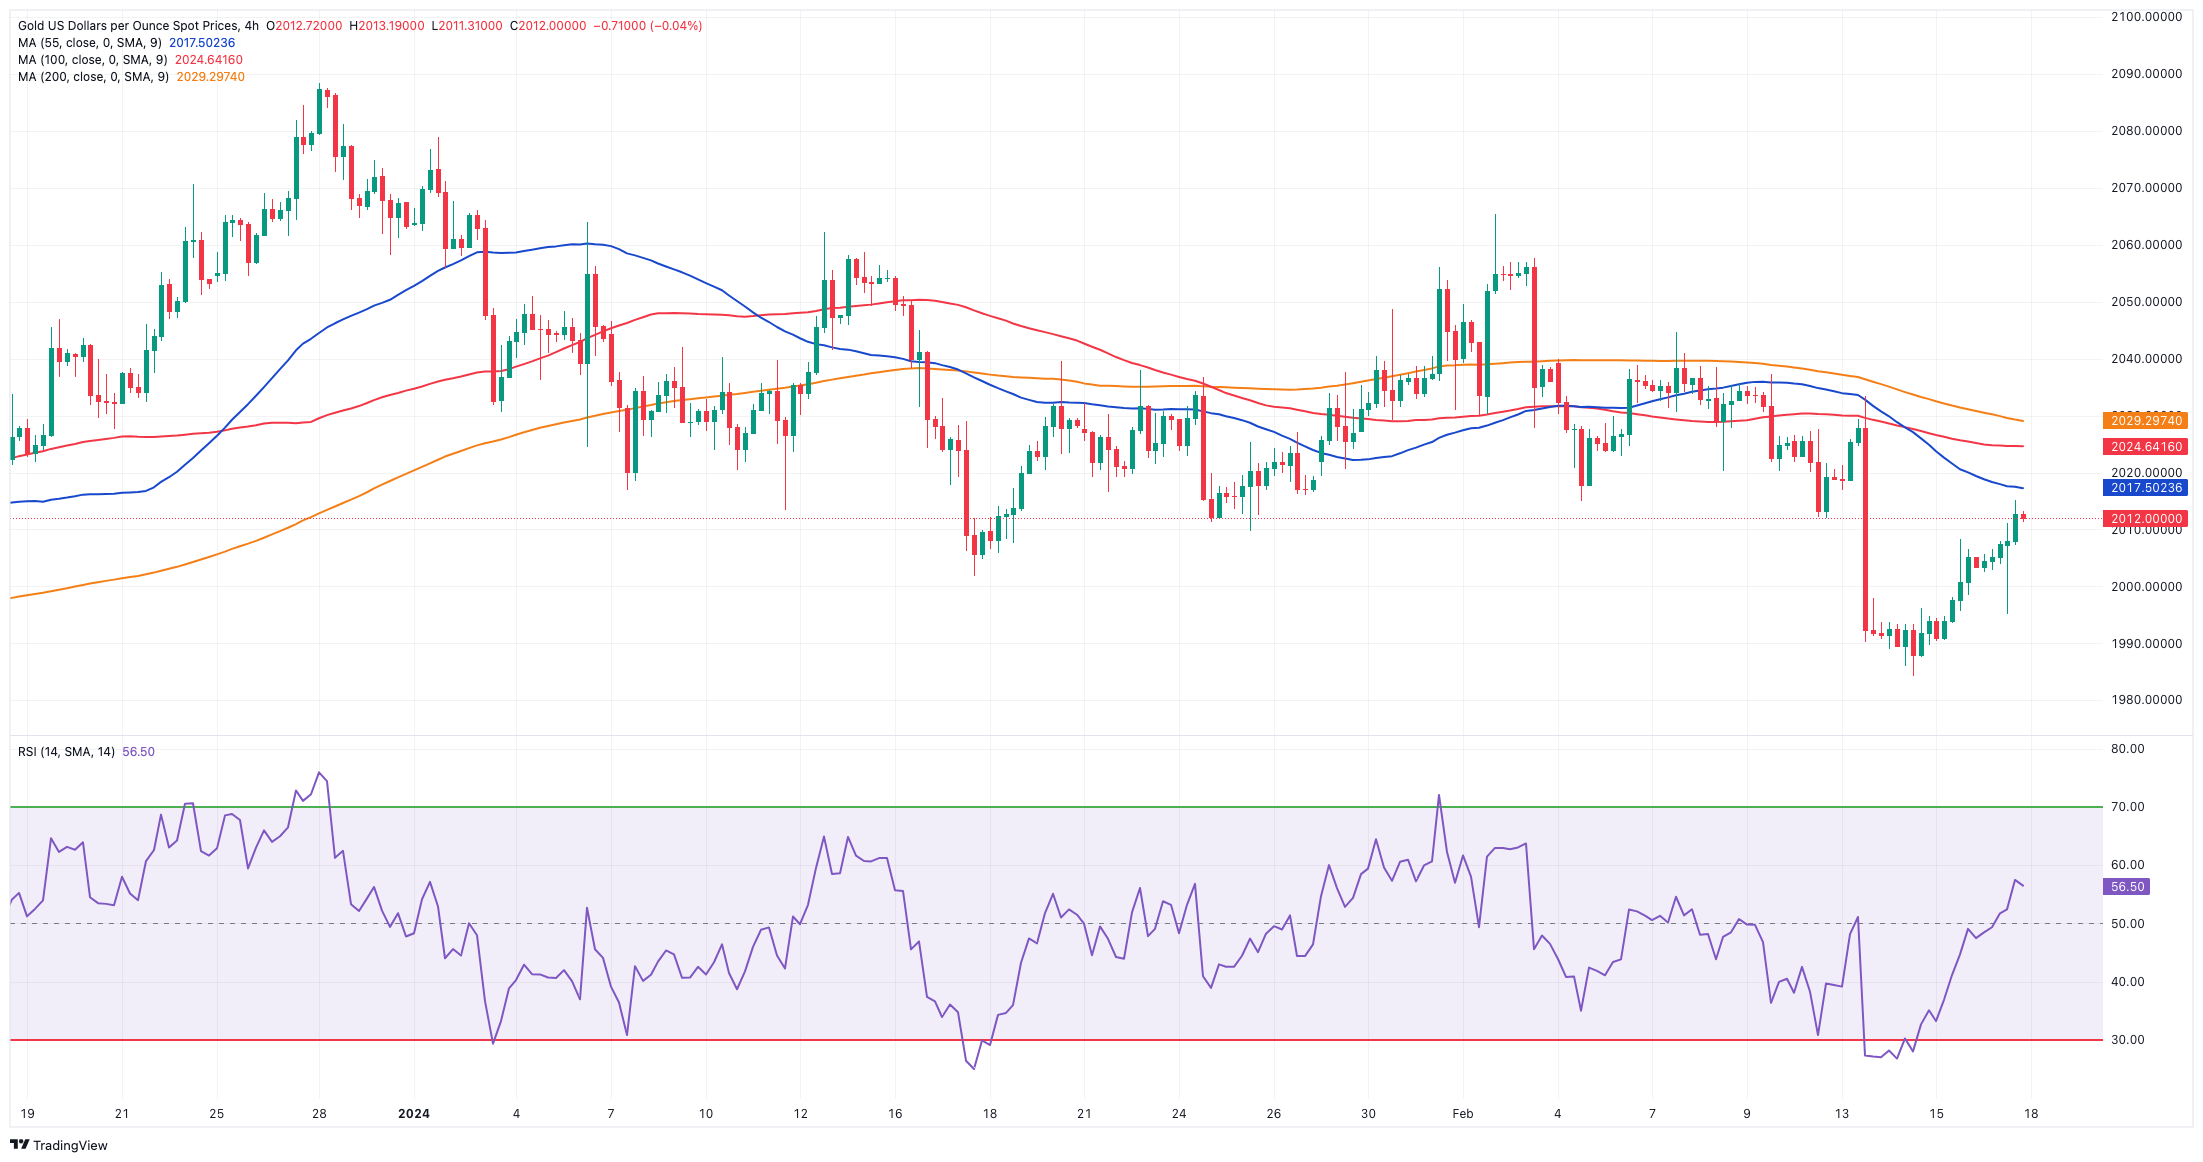
Further recovery saw prices of the yellow metal add to Thursday’s gains and flirt once again with the $2,015 zone on Friday.
The slight bounce in the dollar and extra gains in US yields across various maturities did not prevent bullion from clinching its second daily advance in a row, extending the rebound from Wednesday’s YTD lows around $1,985 per troy ounce.
Nevertheless, the precious metal is anticipated to be closely monitored in the upcoming months due to increasing speculation that the Fed may postpone the initiation of its easing measures. Currently, market participants maintain the belief that the first interest rate reduction will occur during the June 12 gathering, a perspective that gained additional momentum following the release of higher-than-expected US CPI and PPI in January.
Immediately to the downside for Gold is the 2024 low of $1,984 (February 14), seconded by the December 2023 low of $1,973, which is supported by the vicinity of the crucial 200-day SMA at $1,965. A deeper slide might bring the November 2023 low of $1,931 back into view, before the October 2023 low of $1,810, the 2023 low of $1,804, and the $1,800 contention zone. Instead, bullish attempts might send the metal back to its February peak of $2,065 (February 1), ahead of the weekly high of $2,088 (December 28) and all-time top of $2,150 (December 4, 2023).
Resistance levels: $2,015 $2,031 $2,044 (4H chart)
Support levels: $1,984 $1,973 $1,965 (4H chart)
CRUDE WTI
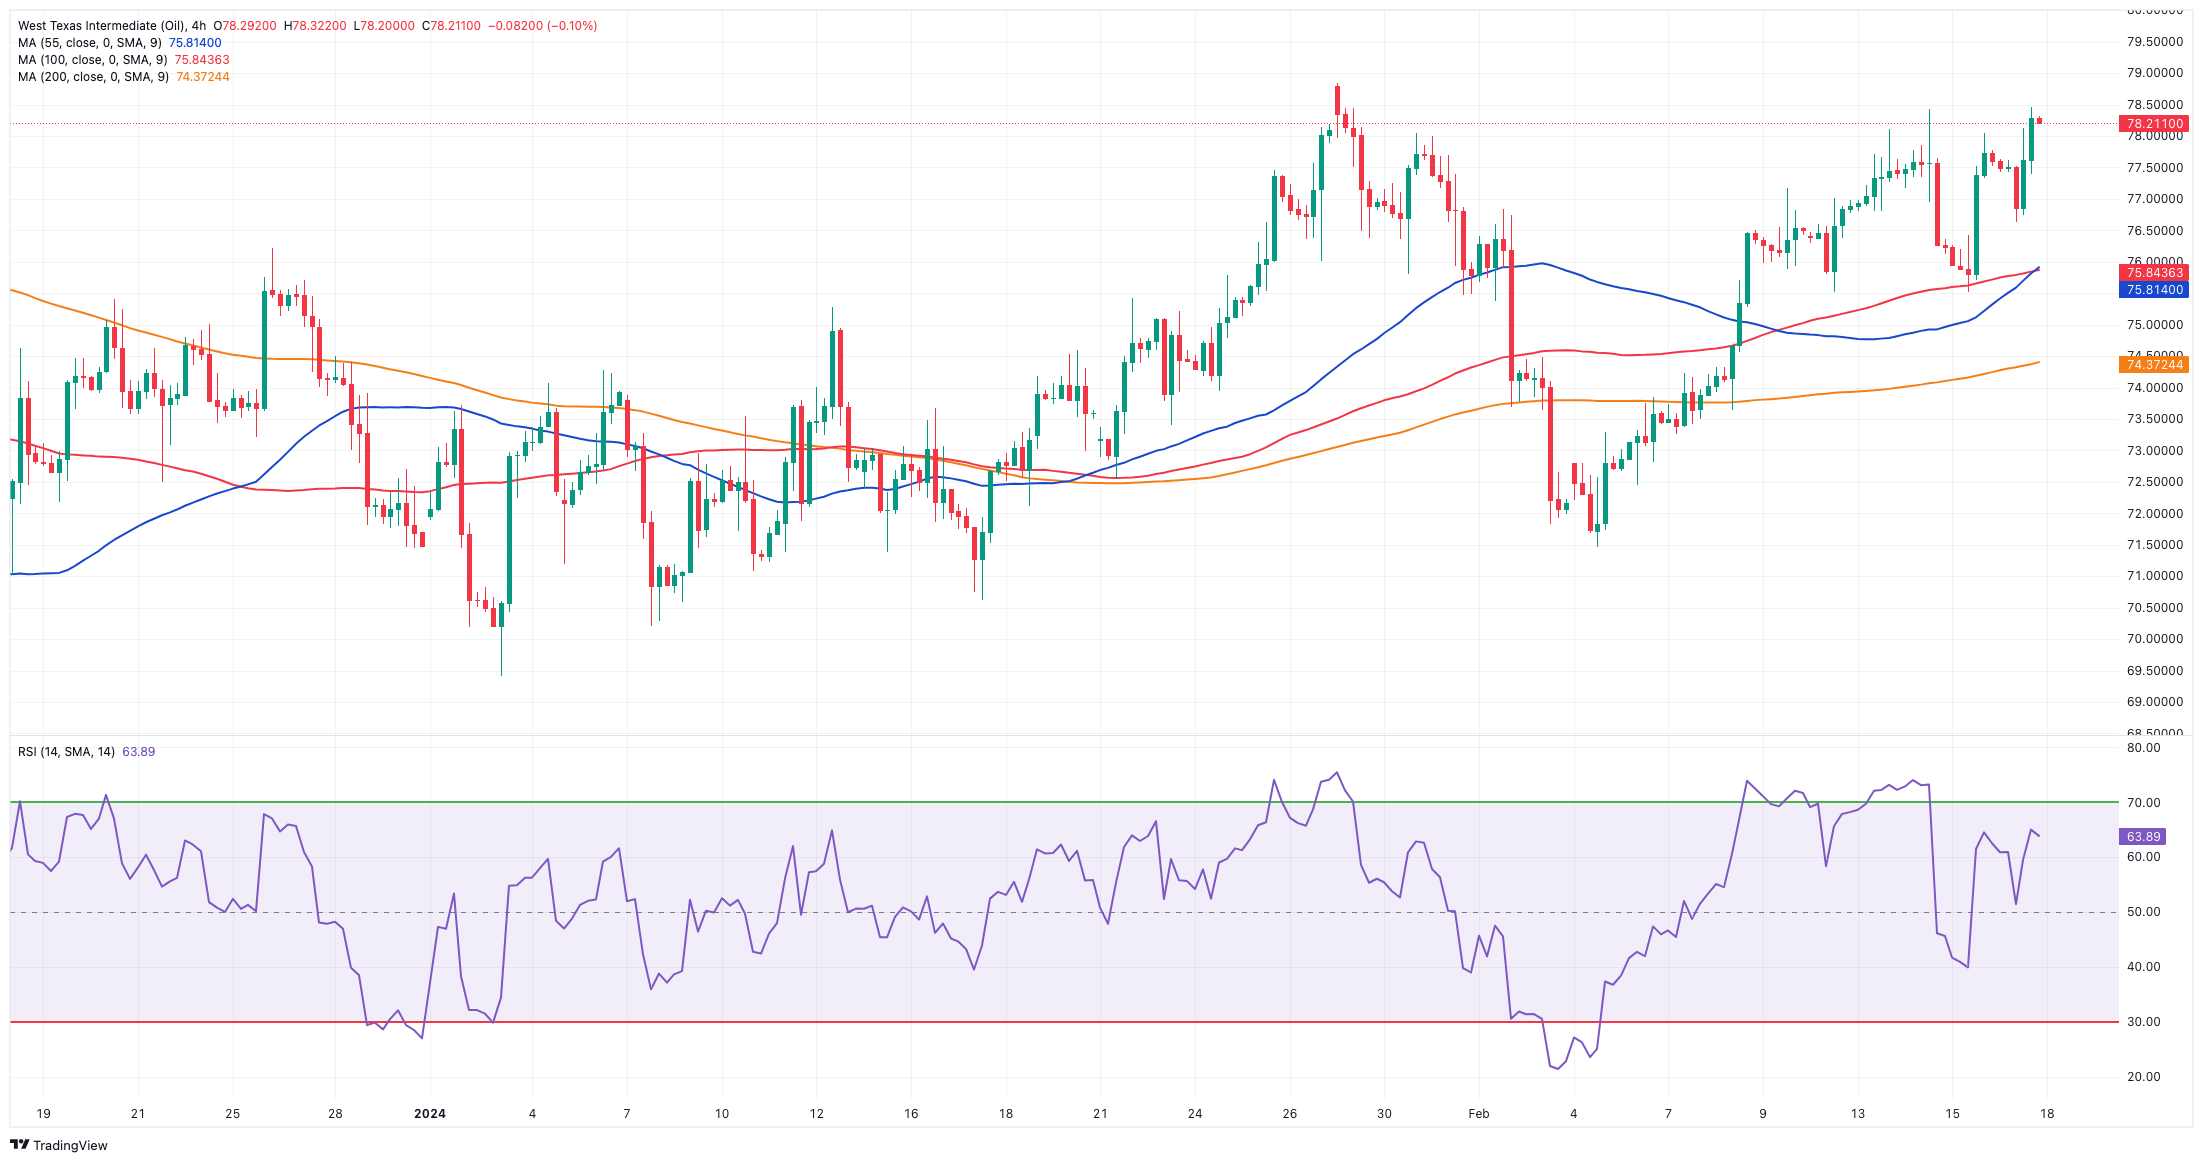
WTI prices rose beyond the $78.00 mark per barrel and approached the area of monthly peaks at the end of the week, all amidst the continuation of the current rally in place since the beginning of February.
The commodity ended the week on a constructive note, as unabated geopolitical tensions in the Middle East appear to have eclipsed concerns around the demand for crude oil, as highlighted on Thursday by the IEA’s report.
On the latter, the Paris-based agency suggested a slowdown in global oil demand for 2024 to 1.22 mbpd (from 1.24 mbpd), while projecting crude oil supply to grow by 1.7 mbpd this year (from 1.5 mbpd).
Also supportive of higher prices, OPEC predicted strong global oil demand growth in 2024 and 2025. The cartel predicts a 2.25 mbpd increase in 2024 and a 1.85 mbpd increase in the next year, indicating potential for further positive outcomes.
On the calendar, total US active oil rigs shrank by 2 to 497 in the week to February 16, according to the weekly report by driller Baker Hughes.
WTI's next upward hurdle occurs at the February high of $78.44, before the 2024 top of $79.25 (January 29), which is immediately followed by the important $80.00 barrier and the November 2023 high of $80.15 (November 3). Extra gains from here may take the commodity back to its weekly top of $89.83 (October 18, 2023), before the 2023 peak of $94.99 (September 28, 2023) and the August 2022 high of $97.65 (August 30), all before reaching the psychological $100.00 mark. On the contrary, the loss of the February low of $71.43 (February 5) may put the critical $70.00 barrier back into play, followed by the 2024 bottom of $69.31 (January 3).
Resistance levels: $78.74 $79.25 $79.56 (4H chart)
Support levels: $75.49 $74.34 $71.37 (4H chart)
GER40
European stock markets maintained their optimism unchanged for yet another session on Friday.
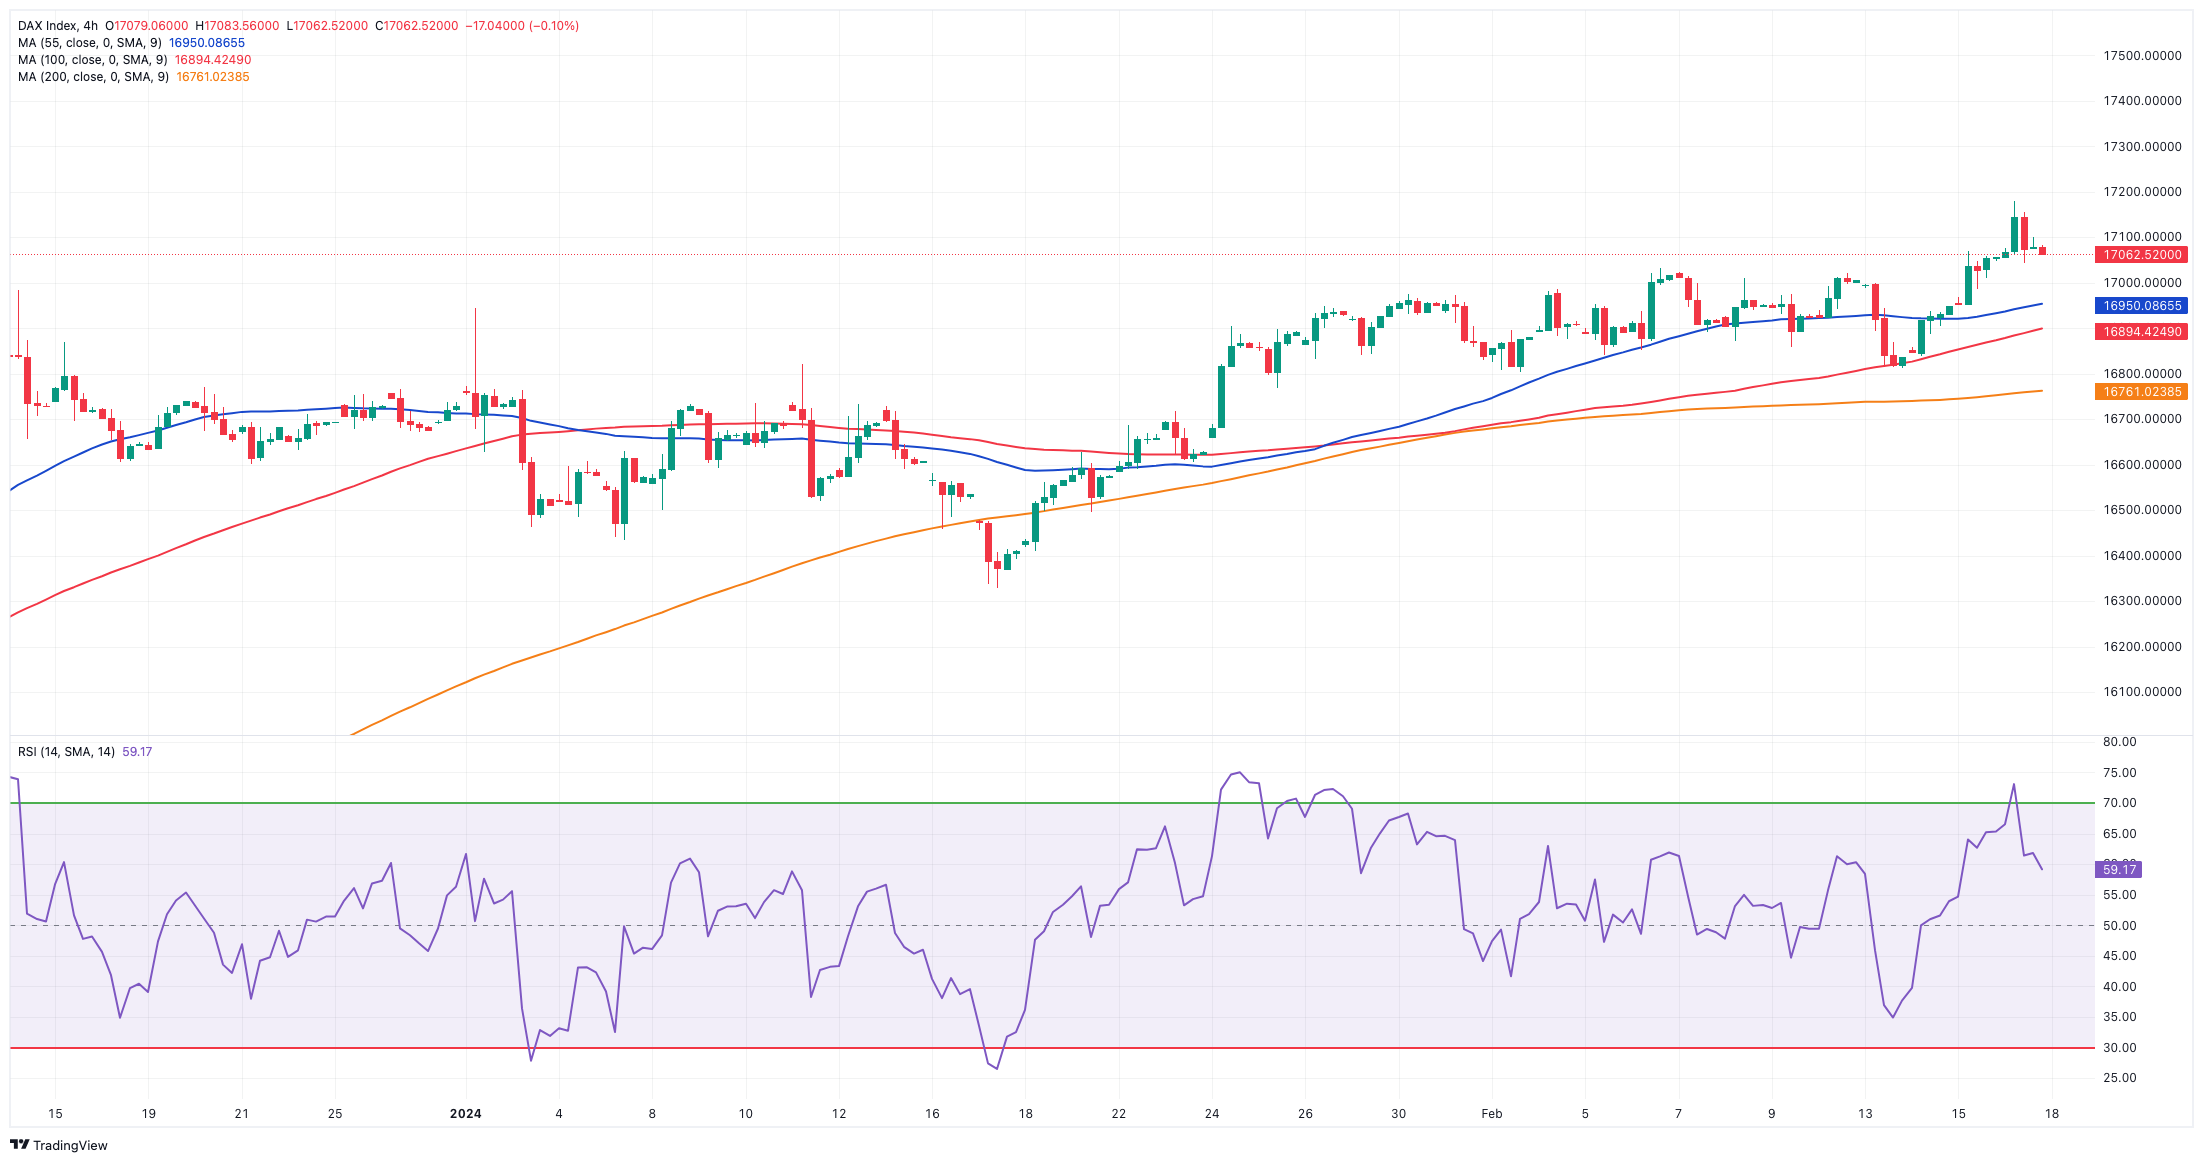
That said, Germany’s benchmark DAX40 rose to an all-time high just ahead of the 17,200 yardstick at the end of the week.
Investors continued to uphold a broadly optimistic outlook, buoyed by favourable corporate earnings updates and encouraging developments in the UK agenda from retail sales, which helped mitigate concerns stemming from Thursday's data revealing the economy's entry into a technical recession in Q4 2023.
In addition, the ECB’s I. Schnabel emphasized the need for cautious monetary policy, focusing on curbing inflation and promoting productivity growth in the region.
Meanwhile, in the German money market, 10-year bund yields briefly advanced past 2.42% for the first time since early December.
The DAX40's next upward barrier is its all-time high of 17,198 (February 16). Having said that, the February low of 16,821 (February 1) provides immediate support, followed by the transitory 55-day SMA at 16,734 and the 2024 bottom at 16,345 (January 17). After clearing the latter, the index is expected to reach the 200-day SMA at 16,007, before sliding to its weekly low of 15,915 (November 28). The next support comes at the October 2023 low of 14,630 (October 23), followed by the March 2023 low of 14,458 (March 20). The daily RSI rose above the 62 level.
Best Performers: Heidelbergcement, Rheinmetall AG, MTU Aero
Worst Performers: Commerzbank, Airbus Group, Covestro
Resistance levels: 17,089 (4H chart)
Support levels: 16,831 16,569 16,345 (4H chart)
GBPJPY
The pessimistic tone in the Japanese currency, along with some positive momentum in the British pound, motivated GBP/JPY to leave behind two consecutive daily pullbacks at the end of the week.
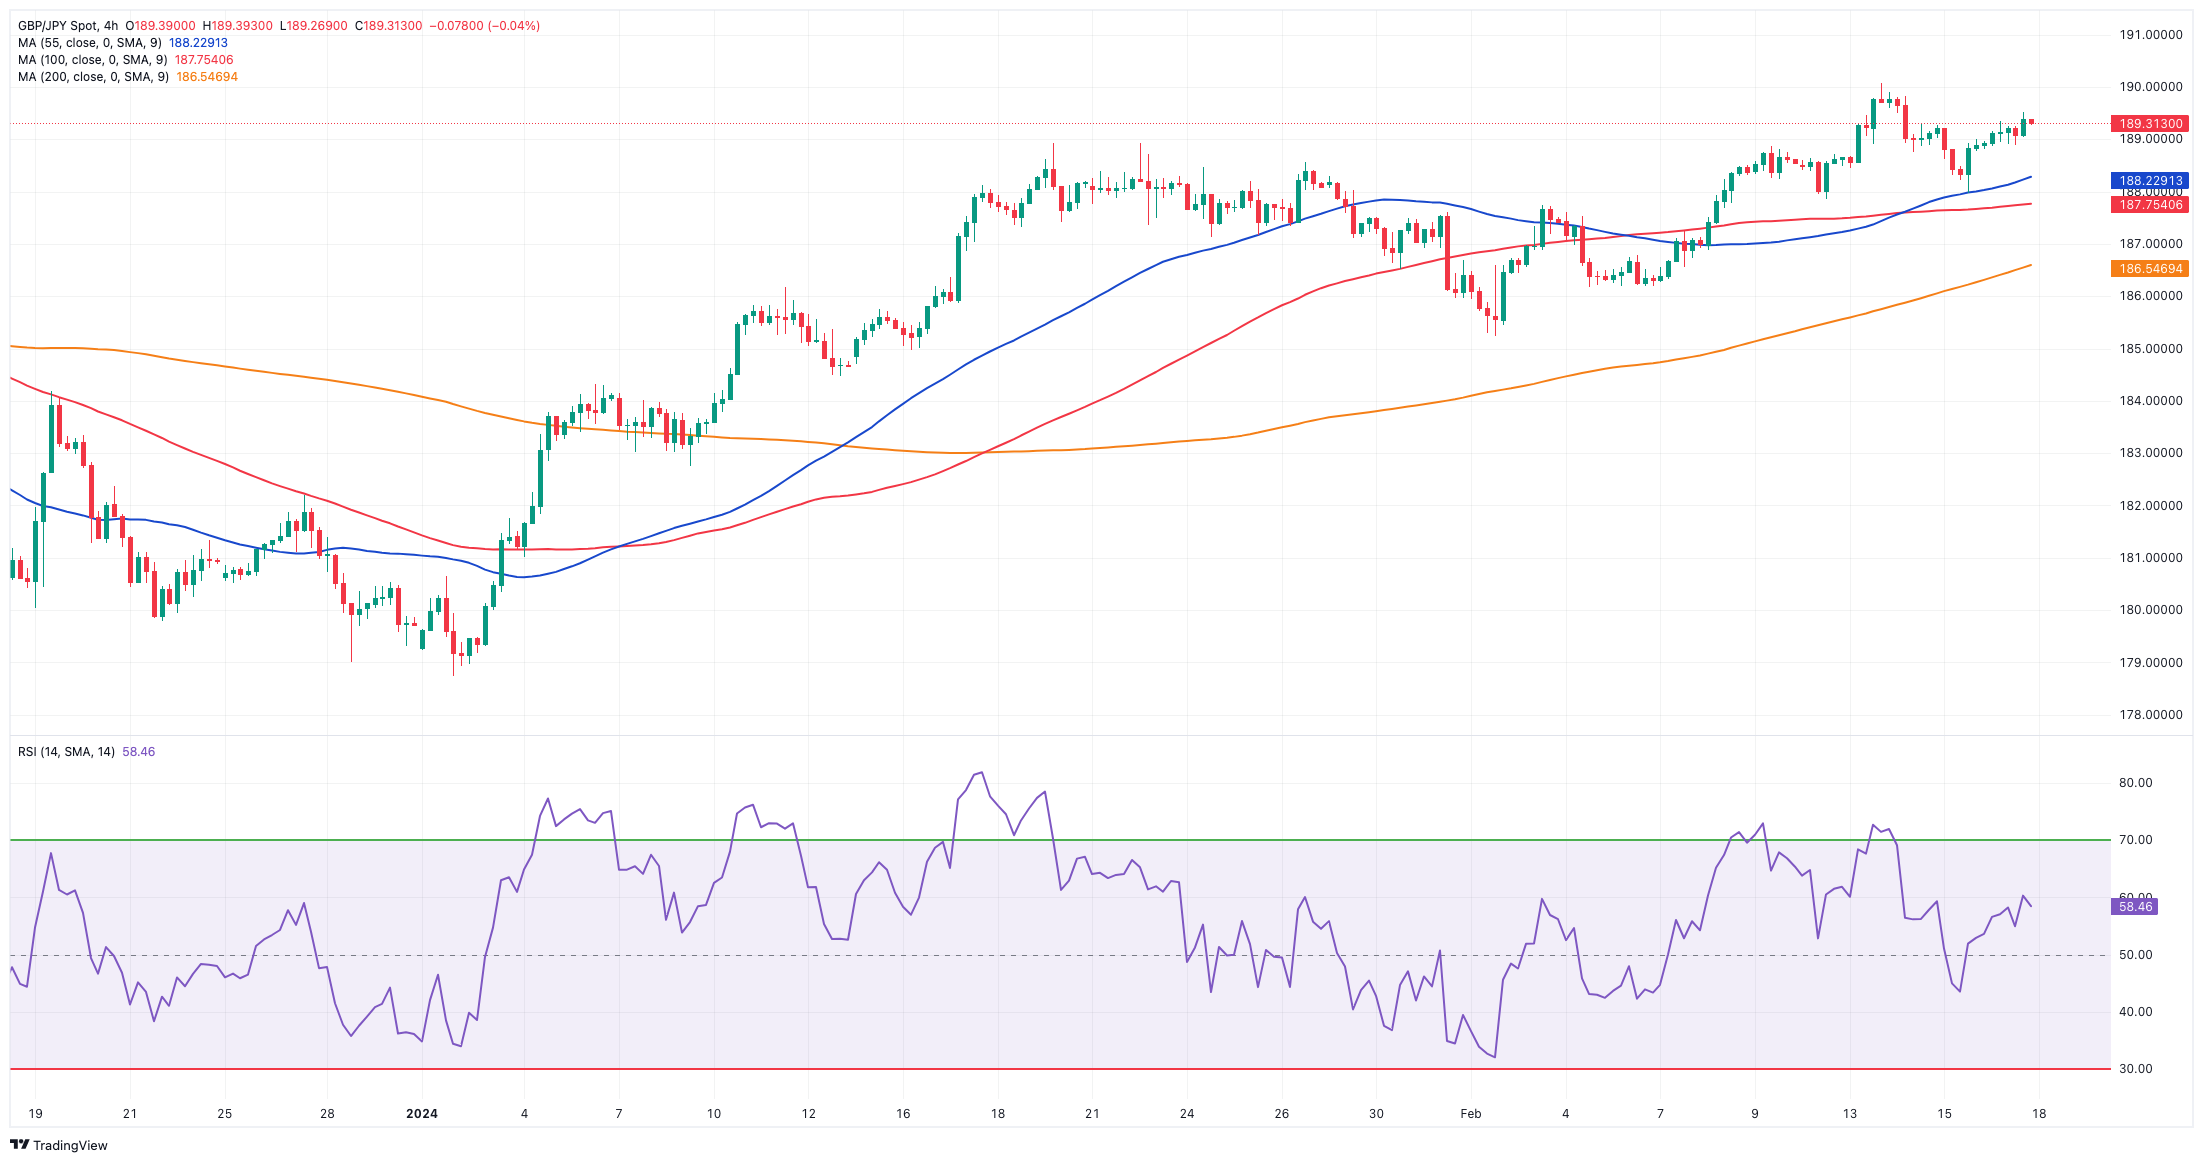
In fact, the cross regained buying interest on Friday, although it failed to retest the key 190.00 milestone in a context where the FX universe remained flat against the backdrop of further repricing of the probable timing of the first interest rate cut by the Fed.
The next objective for GBP/JPY is the 2024 high of 190.08 (February 13), which is ahead of the August 2015 record of 195.28. If bears take control, spot might fall to its February low of 185.22 (February 1) before attempting to break through provisional support at the 55-day and 100-day SMAs of 185.01 and 184.57, respectively. If the cross falls below this level, it may aim for the more critical 200-day SMA at 182.49, before the December 2023 bottom of 178.33 (December 14) and the October 2023 low of 178.03 (October 3). A further decline might provide a challenge to the July 2023 low of 176.30, which is ahead of the May 2023 low of 167.84 (May 11). The daily RSI rose to the proximity of 63.
Resistance levels: 190.08 195.28 195.88 (4H chart)
Support levels: 187.99 186.57 185.22 (4H chart)
NASDAQ
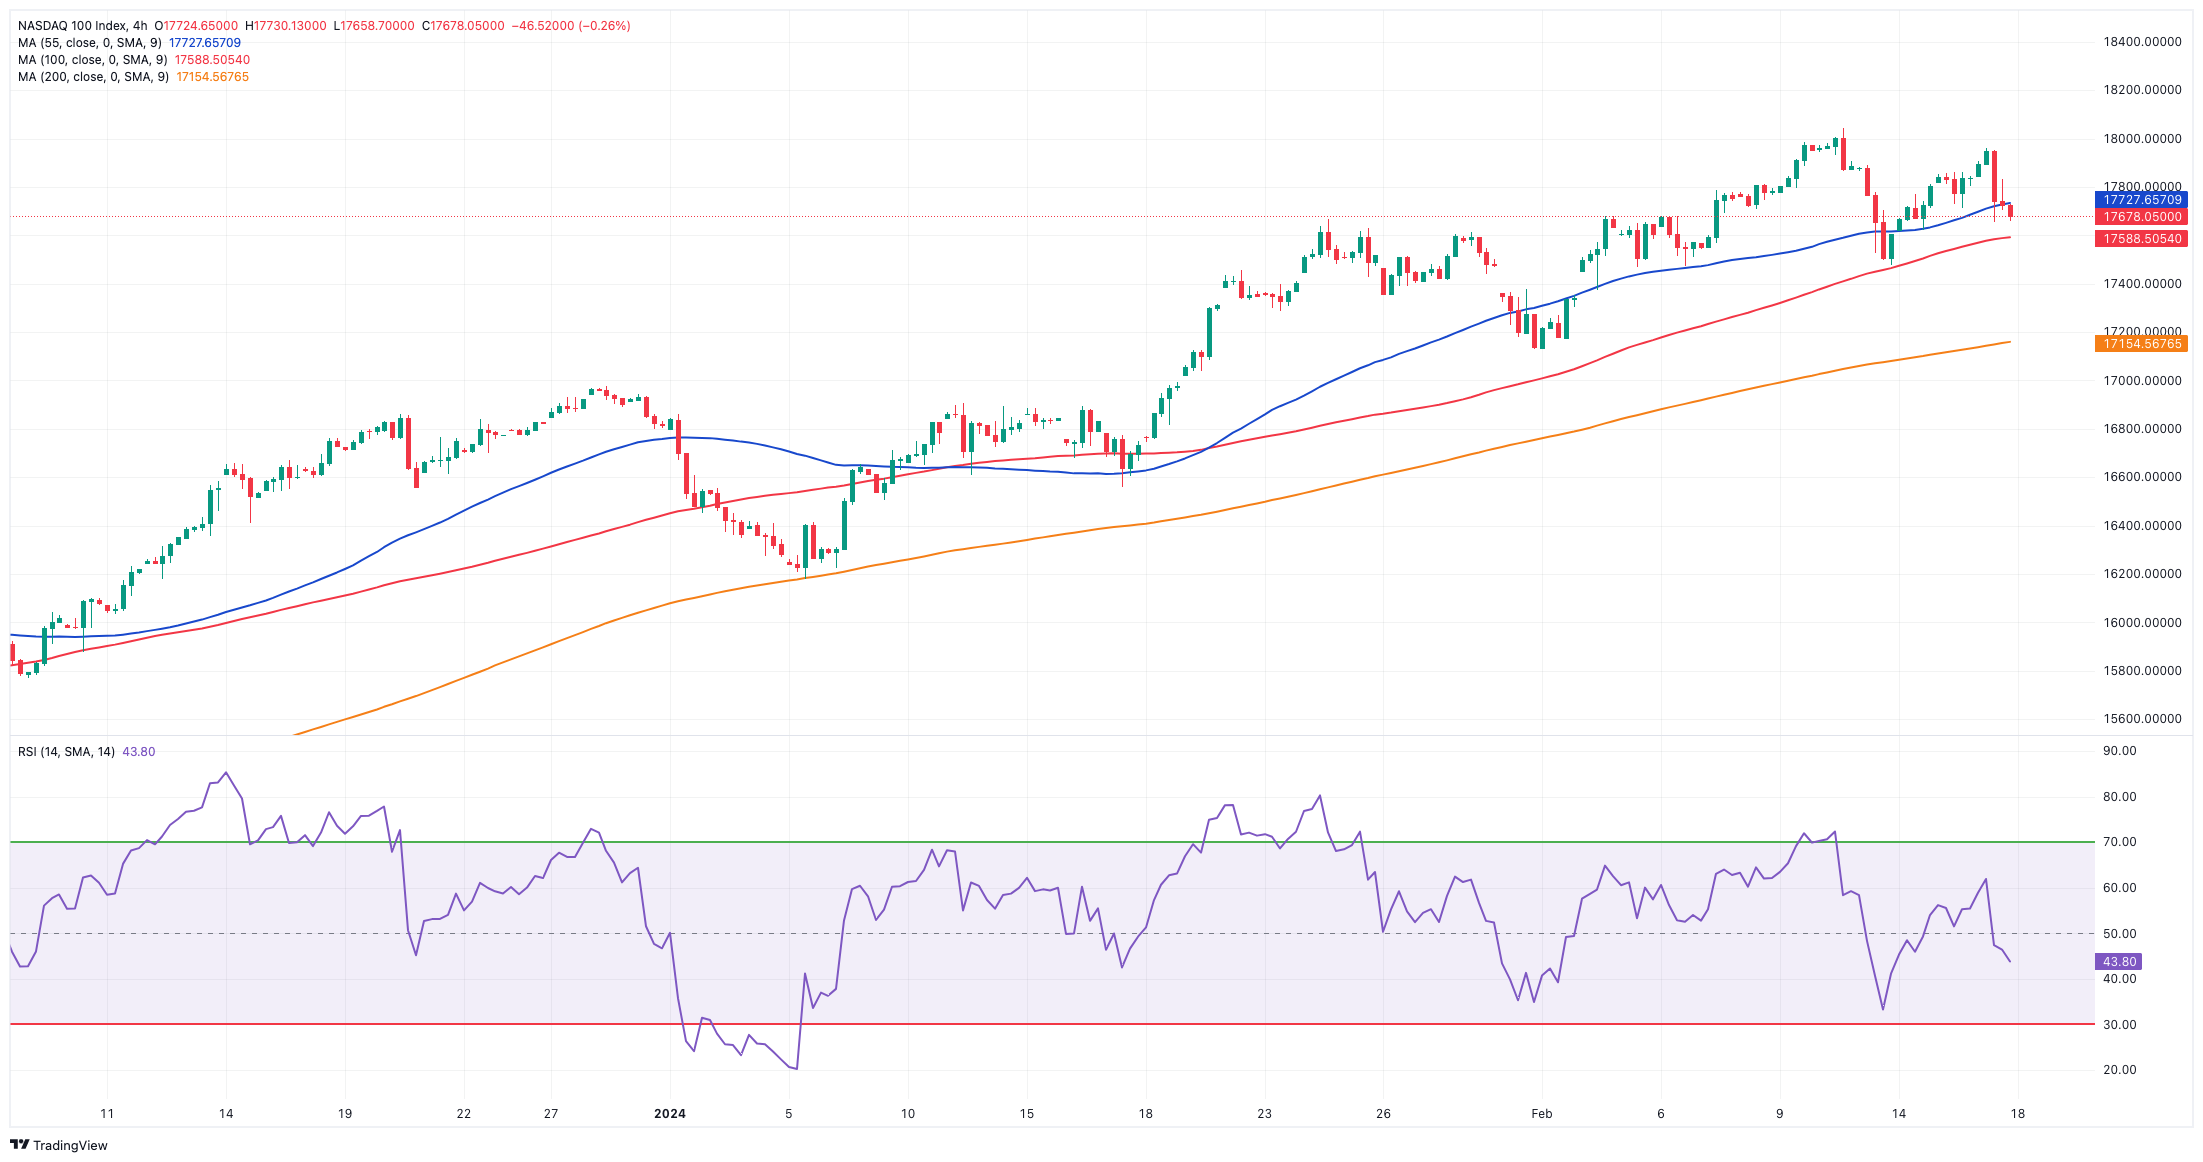
The tech reference Nasdaq 100 followed their US peers and reversed two consecutive positive sessions on Friday.
The irresolute price action in the greenback, higher yields, and another firm print from US inflation—this time from Producer prices—contributed to the prevailing sour sentiment at the end of the week.
Also collaborating with the downward bias, investors continued to increase their bets on a later-than-expected interest rate cut by the Fed, most likely to be announced at the June 12 gathering.
On the latter, according to CME Group's FedWatch Tool, the chance of a rate cut in June hovers around 52%.
Bulls continue to target the new high of 18,041 (February 12). The other way around, the Nasdaq 100 should first target the weekly low of 17,128 (January 31), which comes before the transitory 55-day SMA of 16,909 and the 2024 low of 16,249 (January 5). If the index falls below this level, it might hit the December 2023 low of 15,695 (December 4) and the key 200-day SMA of 15,462. A breach of this level may cause a drop to the October 2023 bottom of 14,058 (October 26), before the April 2023 low of 12,724 (April 25), the March 2023 low of 11,695 (March 13), and the 2023 low of 10,696 (January 3). The daily chart shows the RSI slipping back below 58.
Top Gainers: The Trade Desk, Applied Materials, AstraZeneca ADR
Top Losers: DoorDash, Adobe, Airbnb
Resistance levels: 18,041 (4H chart)
Support levels: 17,478 17,128 16,561 (4H chart)
DOW JONES
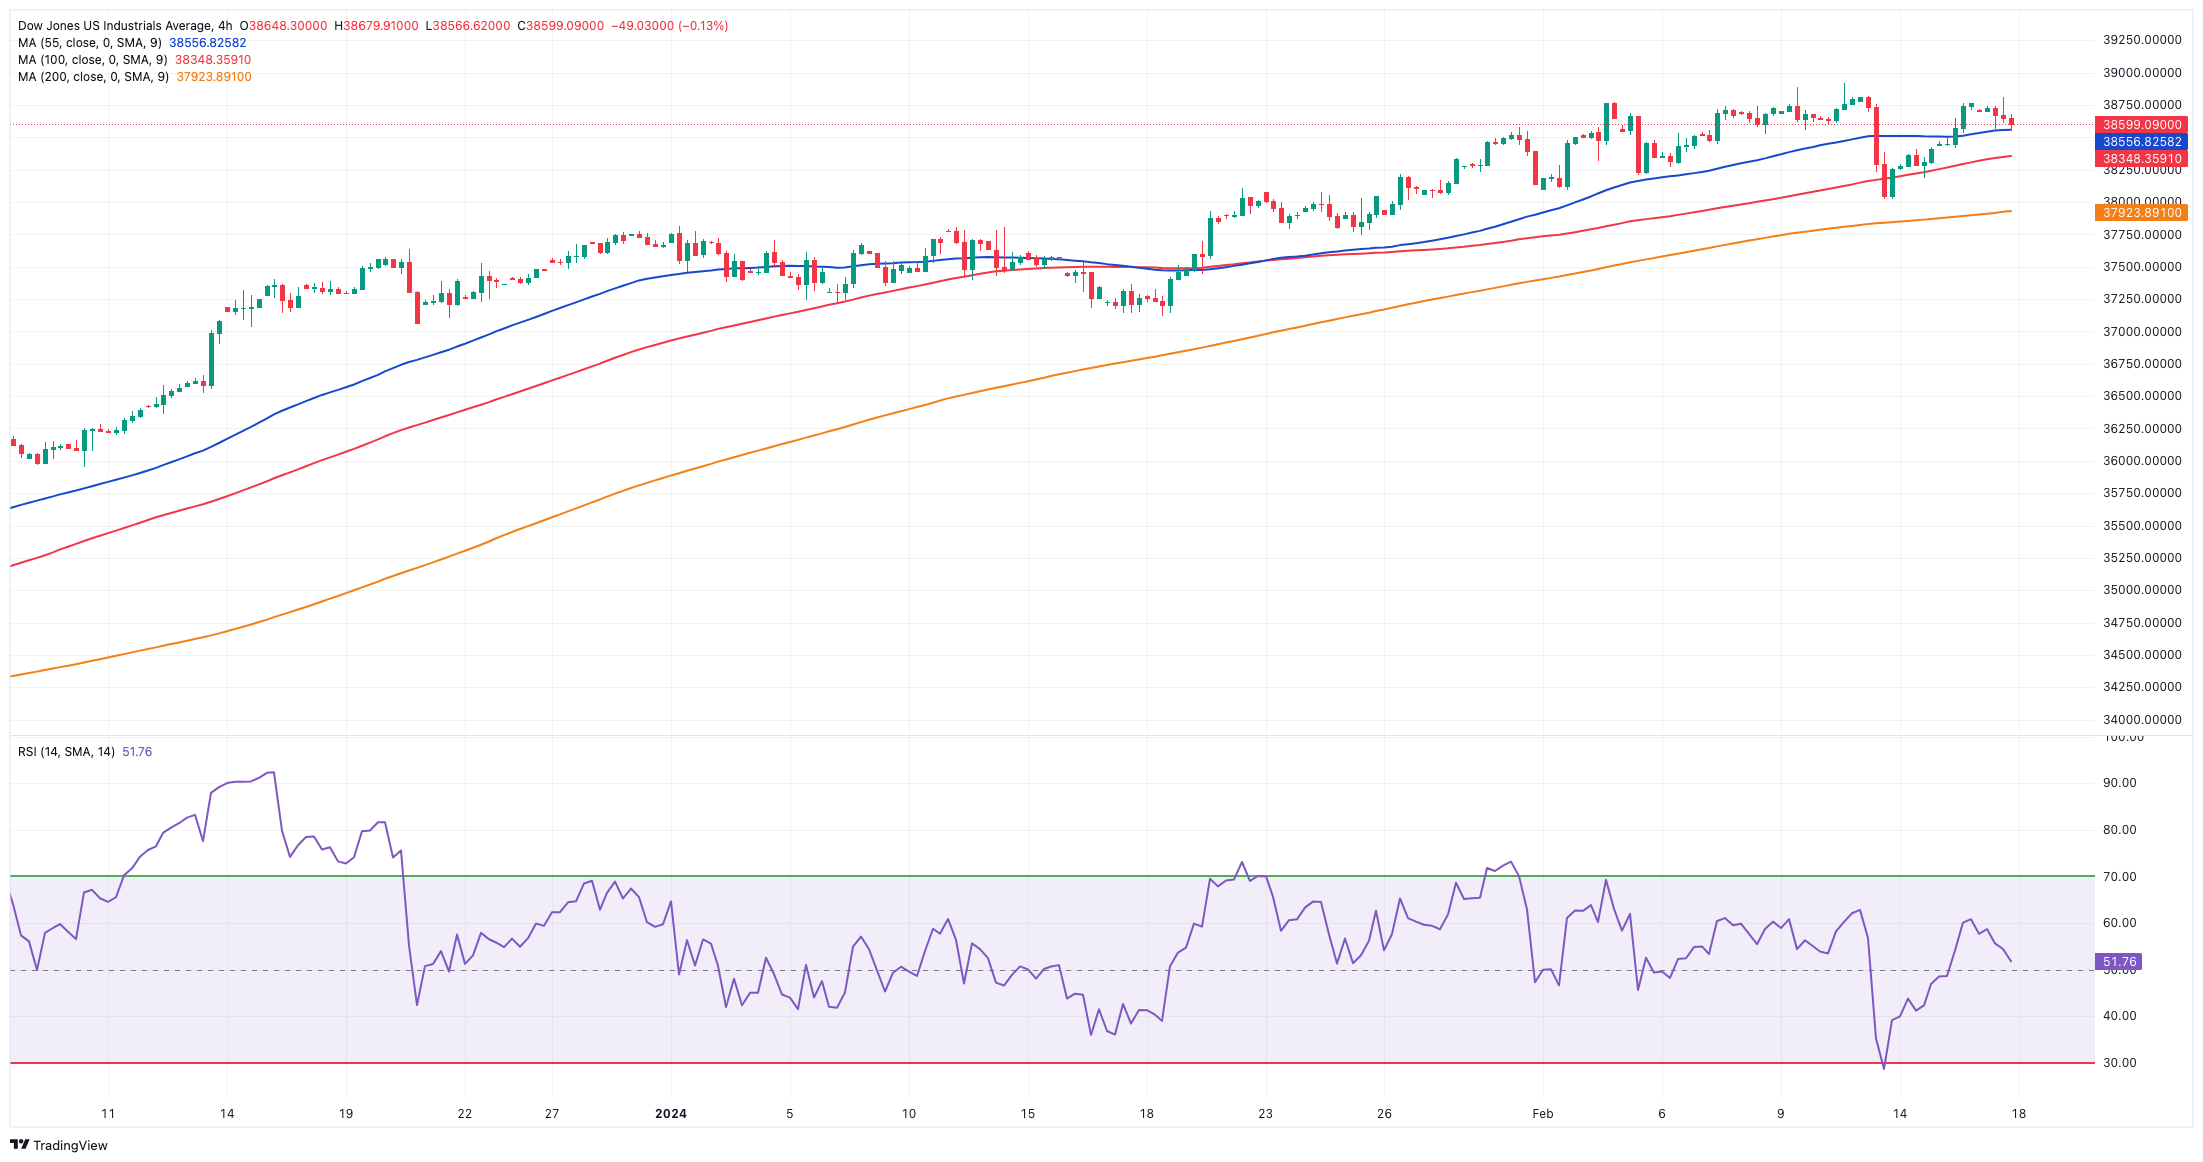
US stocks gauged by the Dow Jones partially faded two consecutive sessions of gains and retreated to the 38,600 region at the end of the week. The erratic weekly performance left the index with marginal weekly losses after five consecutive advances.
The corrective decline in the Dow Jones came on the back of another firmer-than-expected inflation gauge, this time showing US producer prices surpassing expectations in January, dampening prospects for immediate interest rate reductions by the Fed.
In addition, the cautious sentiment was echoed by R. Bostic (Atlanta), who expressed the need for additional evidence of declining inflation pressures while remaining open to the possibility of lowering rates in the coming months, and M. Daly (San Francisco), who emphasized that there is still work to be done to ensure price stability, despite notable progress.
At the end of the week, the Dow Jones retreated 0.37% to 38,628, the S&P 500 deflated 0.48% to 5,005, and the tech-centric Nasdaq Composite dropped 0.82% to 15,775.
The Dow Jones faces immediate up-barrier at the all-time high of 38,927 (February 12). Conversely, the 55-day SMA at 37,571 provides temporary support, followed by the 2024 low of 37,122 (January 18) and the weekly low of 37,073 (December 20, 2023). A move below this level may provide a challenge to the interim 100-day SMA at 35,912 before reaching the 200-day SMA at 35,091. The weekly low of 33,859 (November 7, 2023) comes next ahead of the October 2023 low of 32,327 (October 27) and the 2023 low of 31,429 (March 15). The daily RSI receded to the sub-59 region.
Top Performers: Merck&Co, Walmart, Dow
Worst Performers: Nike, Amgen, Cisco
Resistance levels: 38,927 (4H chart)
Support levels: 38,039 37,122 36,021 (4H chart)
MACROECONOMIC EVENTS


