
- Contact Us:
-

-

-

-


Daily Market Updates
20 Feb 2024
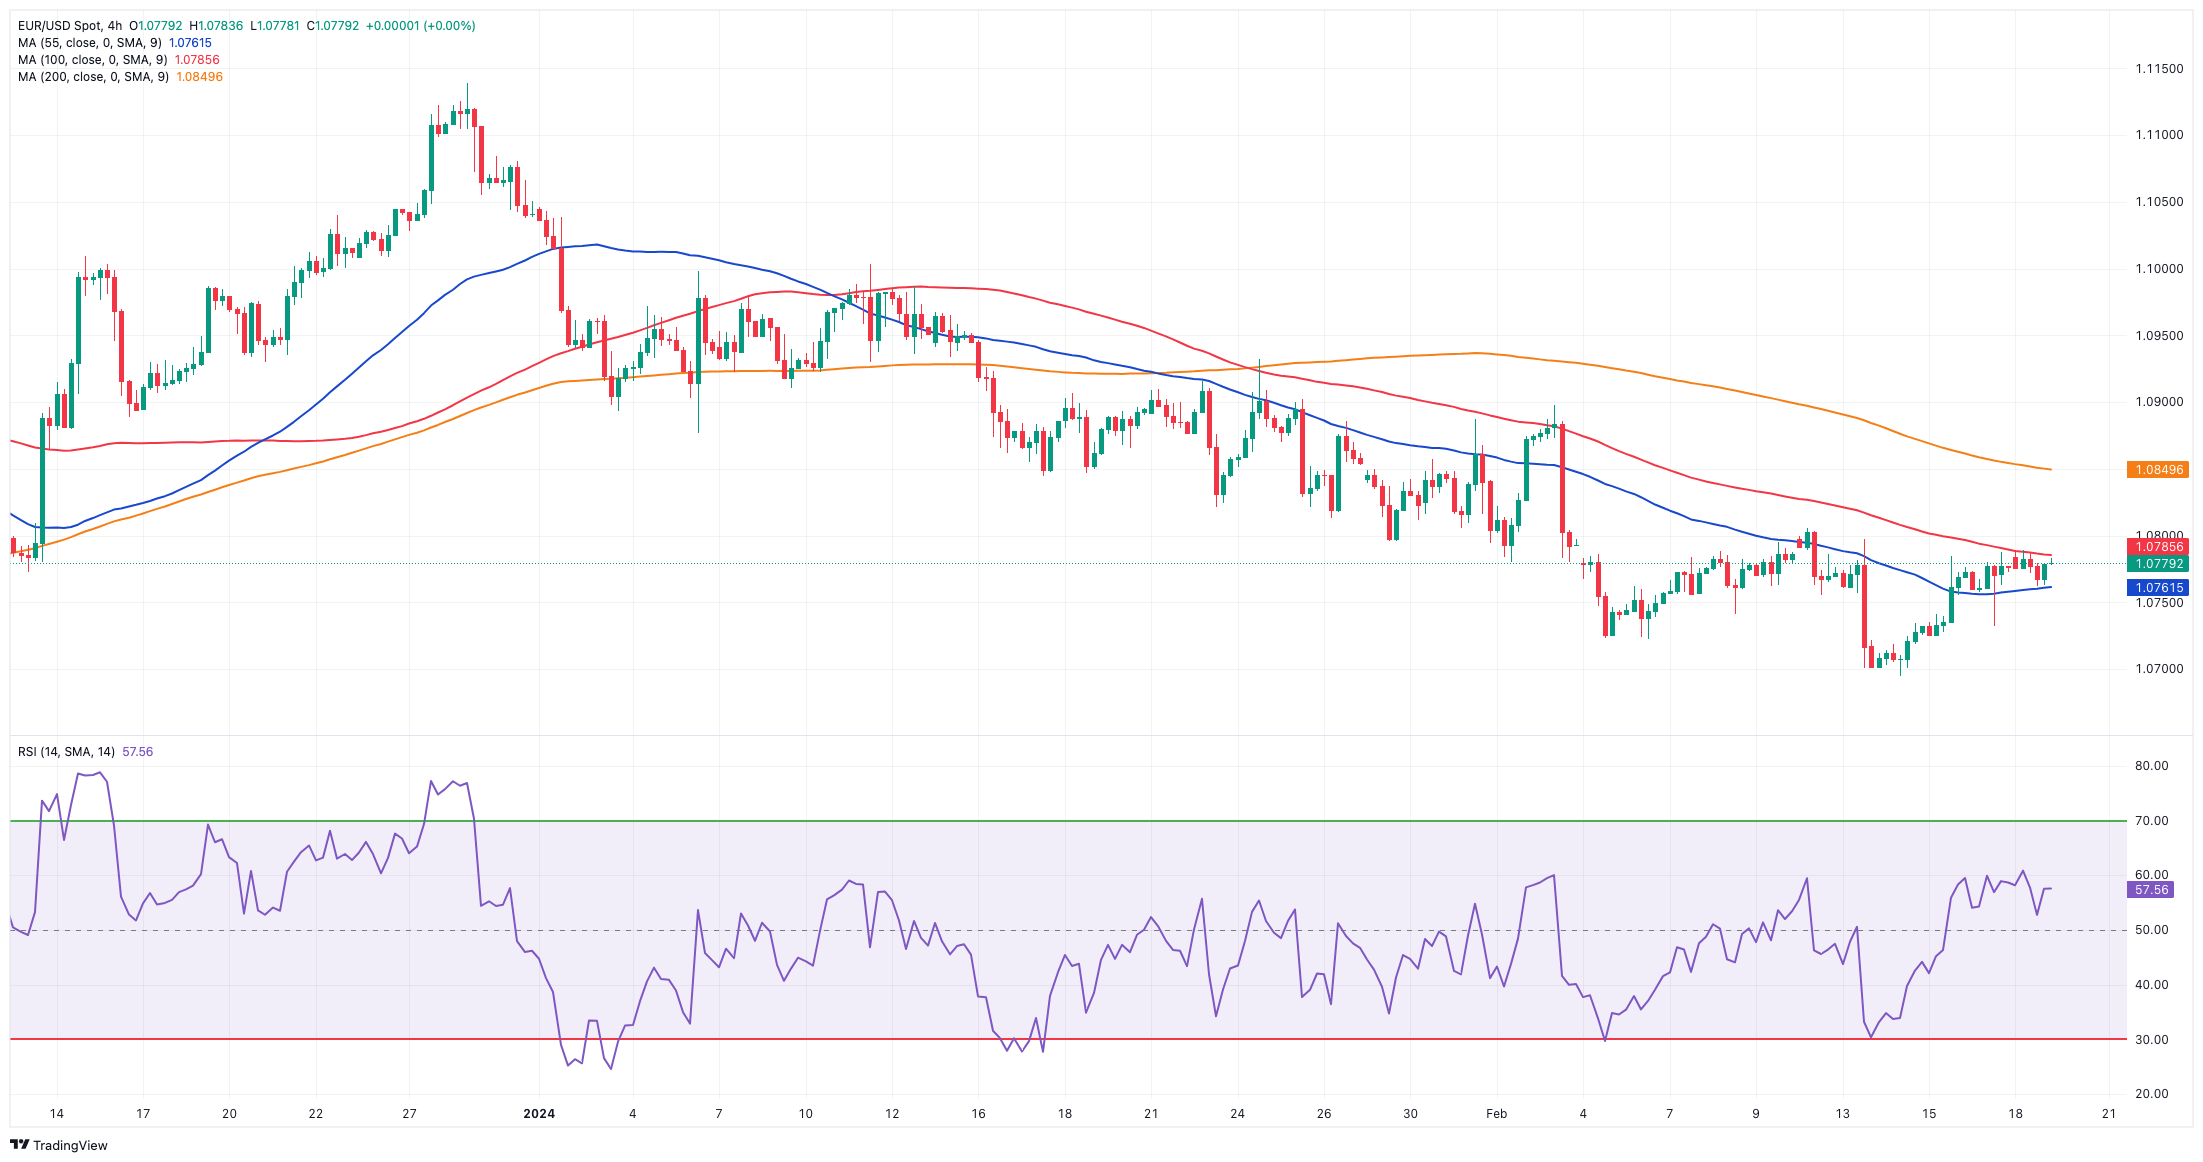
EURUSD
EUR/USD continued its gradual upward momentum after hitting yearly lows below 1.0700 recorded during the past week, kicking off the week barely changed from Friday’s close around 1.0770.
This uptrend in the pair coincided with an irresolute price action in the greenback, which seems to have entered a consolidative phase in the low 104.00s when tracked by the USD Index (DXY), helped by the inactivity in the US markets due to the President’s Day holiday.
Looking at the macro scenario, investors continued to assess the likelihood of the start of the Fed’s easing cycle, most likely in June, all following recent comments from Fed officials, who reiterated their projection of 2-3 interest rate cuts this year.
There were no data releases scheduled on Monday on the old continent or across the Atlantic.
The rise in EUR/USD seeks the weekly top of 1.0805 (February 12), just ahead of the critical 200-day SMA at 1.0826 and the temporary 55-day SMA at 1.0880. Further north, the weekly peak of 1.0932 (January 24) is followed by another weekly high of 1.0998 (January 5, 11). The breakout of this area reveals the December 2023 top of 1.1139 (December 27), which is supported by the 200-week SMA of 1.1148 and occurs before the 2023 peak of 1.1275 (July 18). In the other direction, the 2024 low of 1.0694 (February 14) comes next, then the weekly low of 1.0495 (October 13, 2023), the 2023 low of 1.0448 (October 3), and the round level of 1.0400. The daily RSI climbed marginally past 44.
Resistance levels: 1.0805 1.0849 1.0932 (4H chart)
Support levels: 1.0694 1.0656 1.0516 (4H chart)
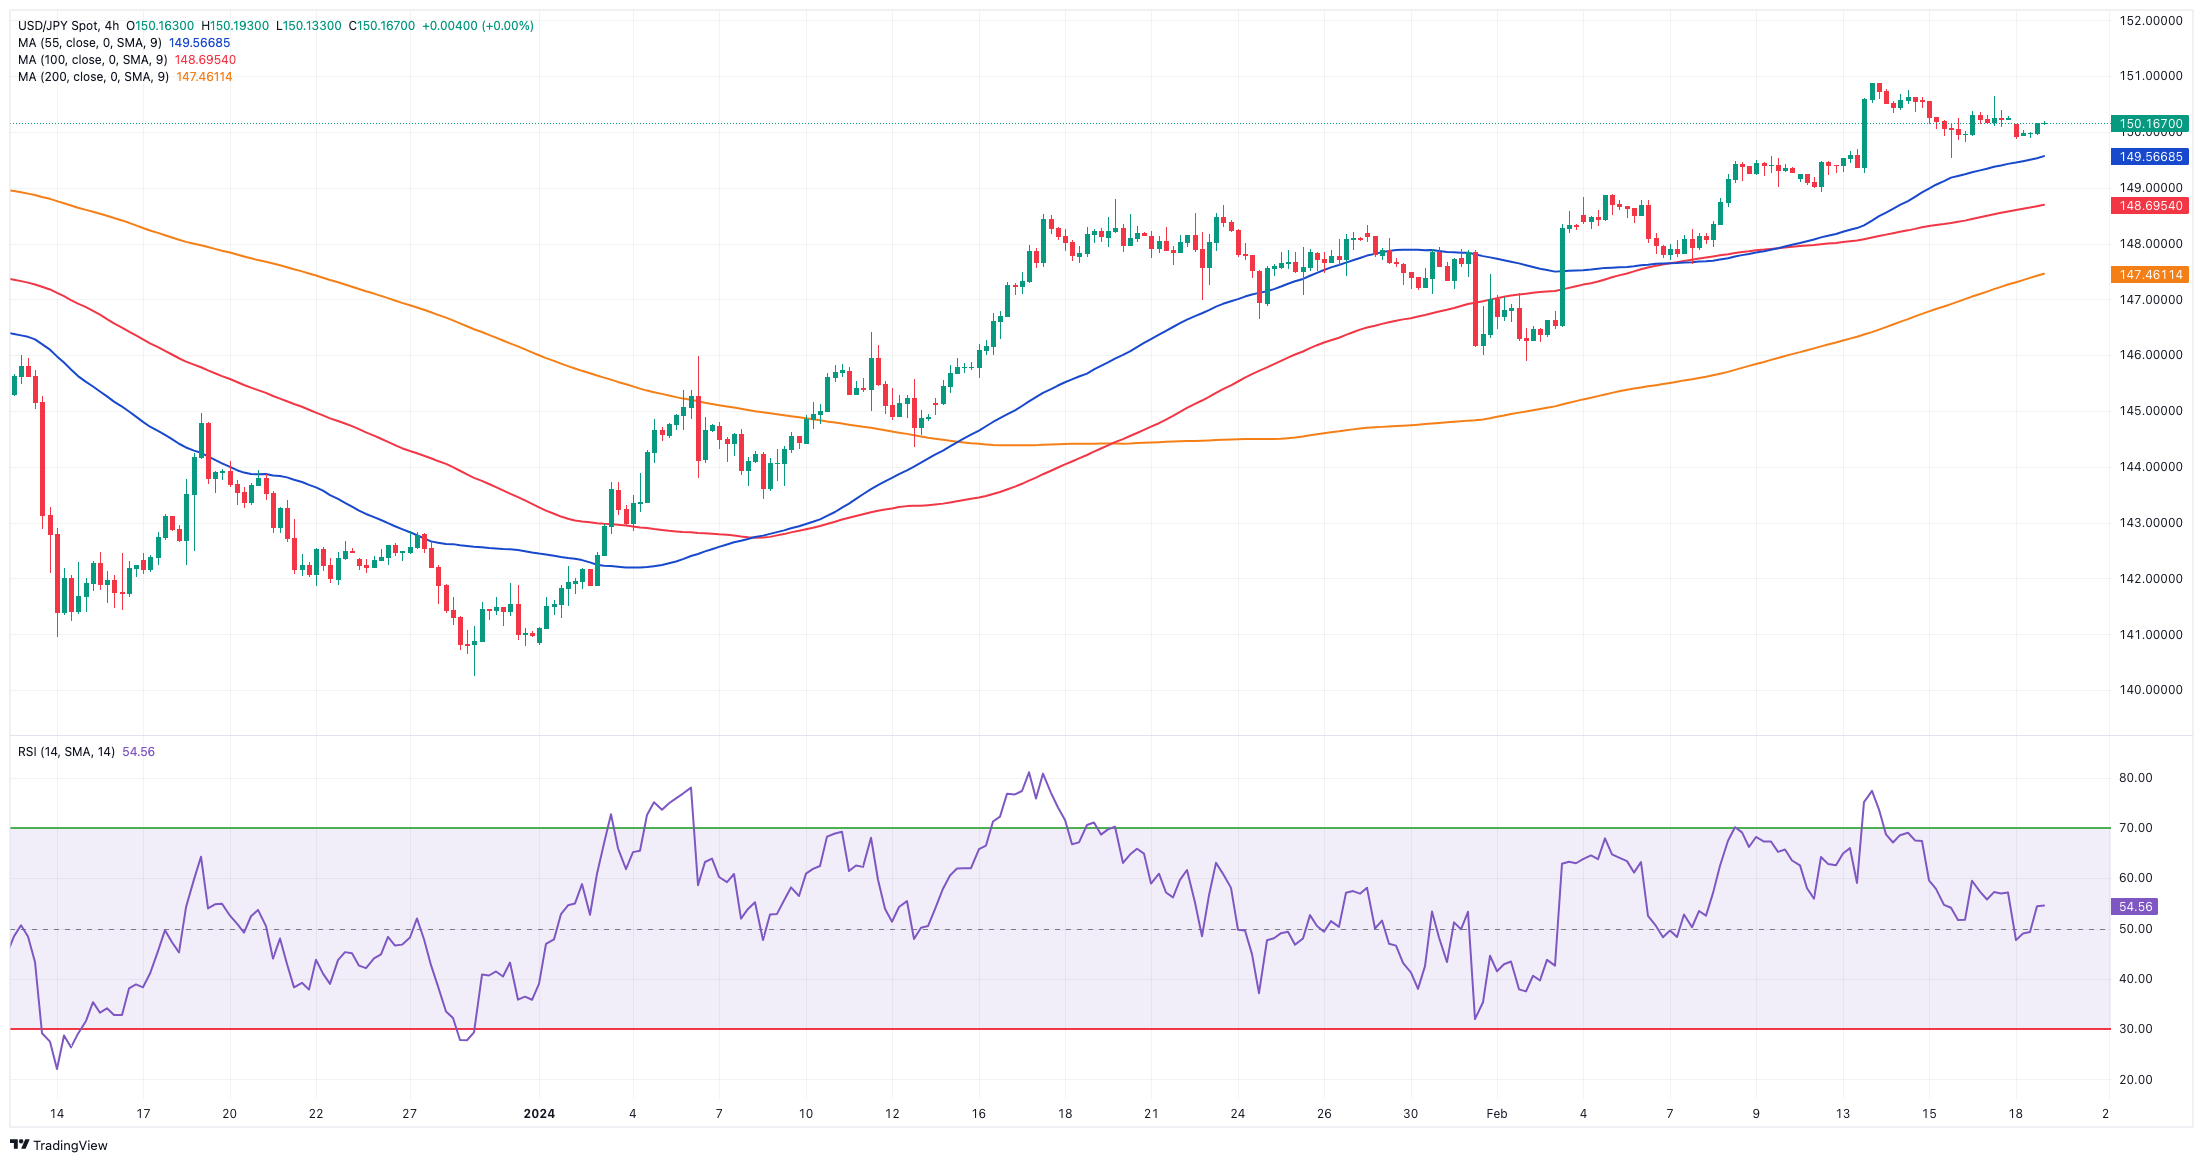
USDJPY
Unsurprisingly, USD/JPY navigated a marginal trading range following the inactivity in the US markets on Monday.
That said, spot gyrated around the 150.00 region, partially fading Friday’s decent uptick in a context dominated by a generalized range-bound trade and expectation ahead of the release of the FOMC Minutes later in the week.
In the Japanese money market, JGB 10-year yields also traded unmotivated, around 0.73%.
A glance at Friday’s developments around the BoJ saw Governor Ueda stressing the importance of carefully analyzing upcoming economic data, with particular attention to the outcomes of the upcoming spring wage negotiations amidst the bank’s commitment to achieving a sustainable 2% inflation target alongside wage growth.
The Japanese docket was empty at the beginning of the week.
If bulls regain the initiative, USD/JPY might test the 2024 top of 150.88 (February 13), before the 2023 peak of 151.90 (November 13). Further north, the 2022 high of 151.94 (October 21) is closely followed by the round figure of 152.00. On the contrary, the 100-day SMA should give temporary support at 147.62 before the February low of 145.89 (February 1), which remains supported by the preliminary 55-day SMA. The key 200-day SMA at 145.37 precedes the December 2023 low of 140.24 (December 28), the round number of 140.00, and the July low of 137.23 (July 14). The daily RSI looked stable around 64.
Resistance levels: 150.88 151.43 151.90 (4H chart)
Support levels: 149.50 148.92 147.61 (4H chart)
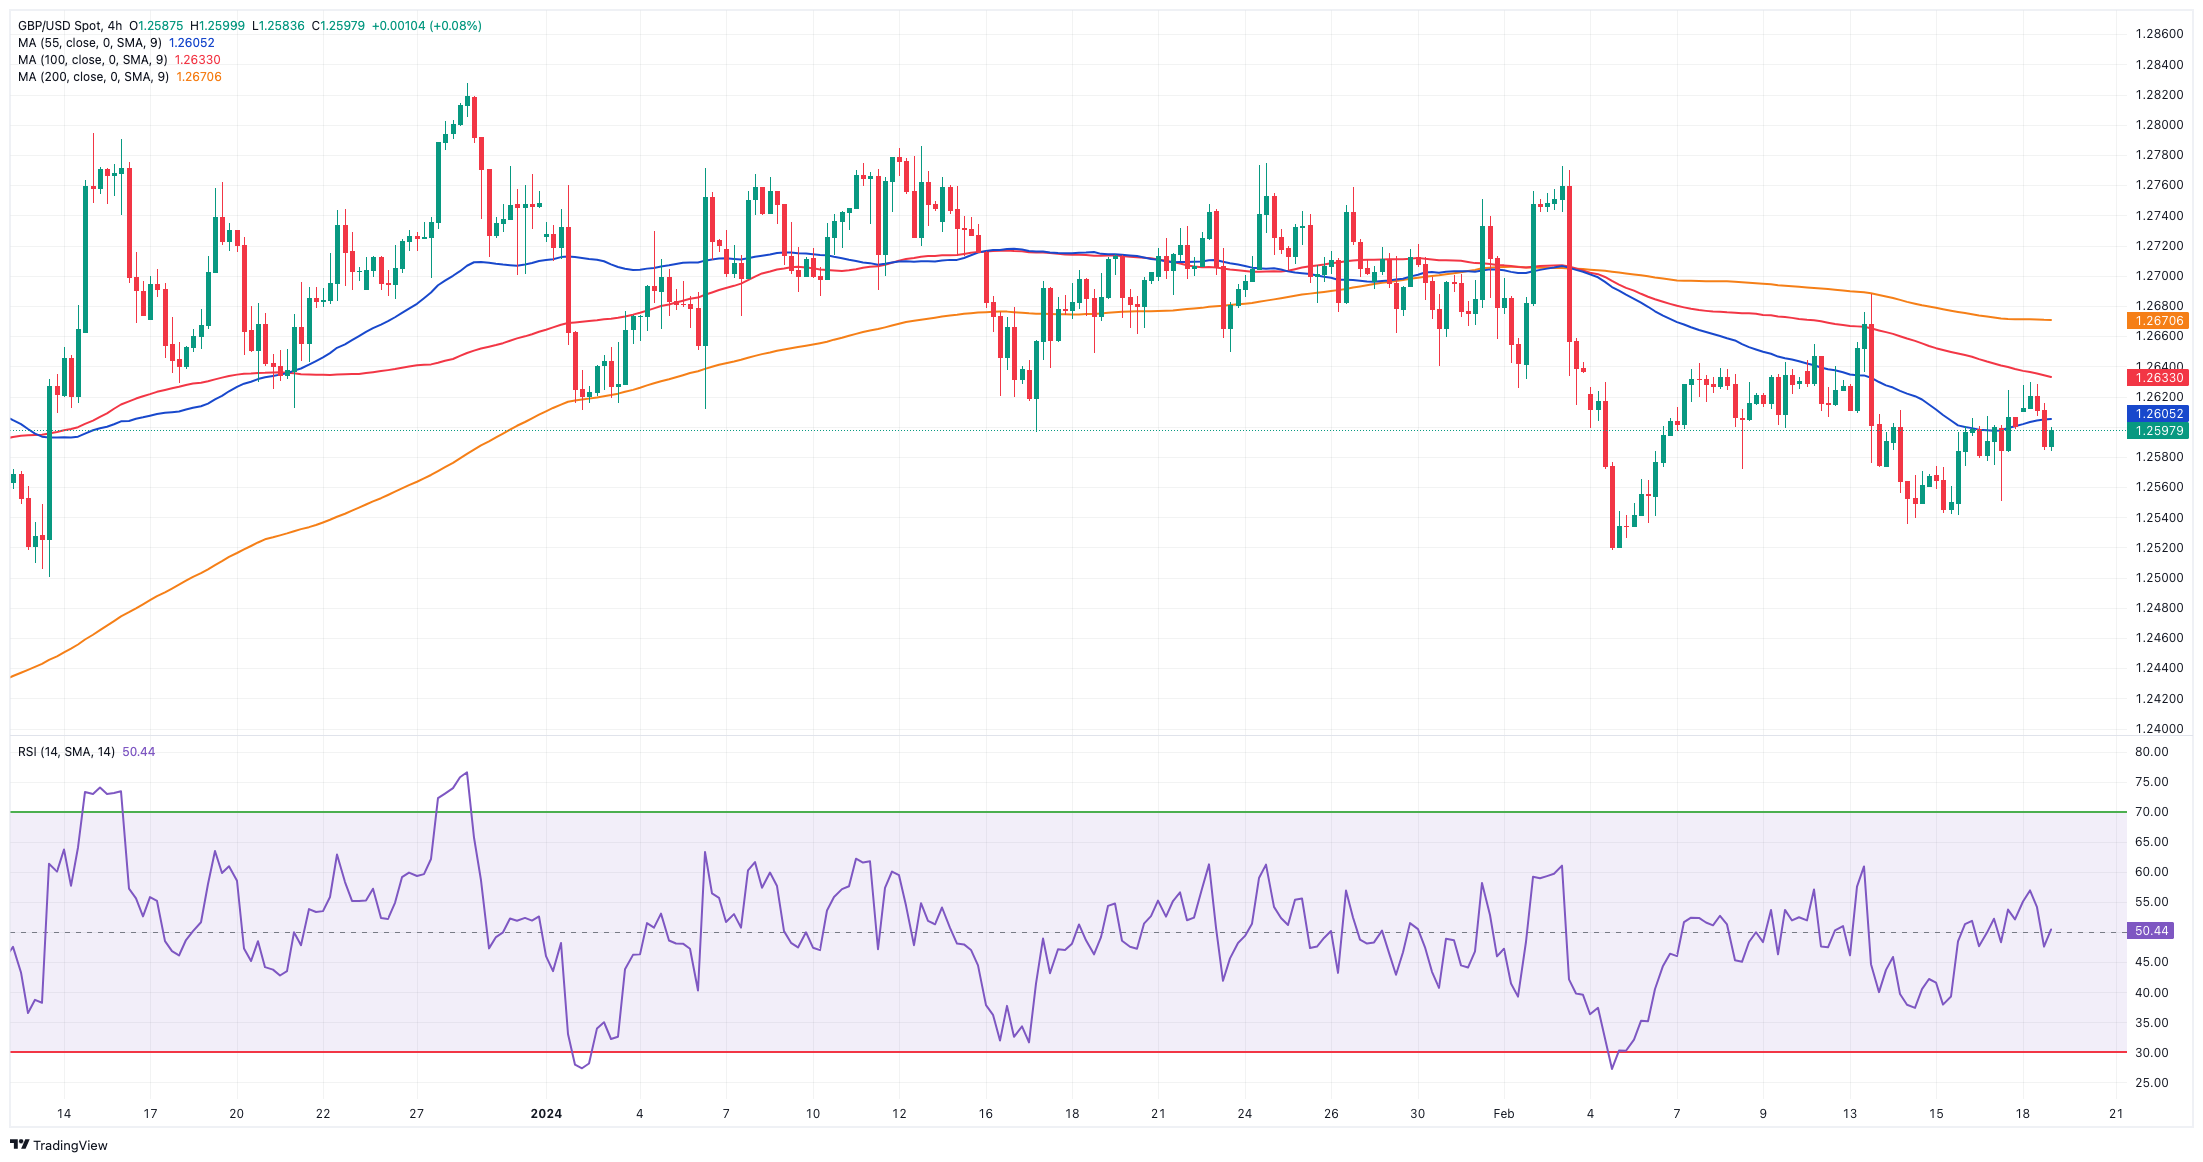
GBPUSD
In line with the rest of the FX universe, the British pound traded in quite a vacillating fashion at the beginning of the week, leaving GBP/USD hovering around the 1.2600 neighbourhood and still above the key 200-day SMA (1.2562).
In fact, Cable followed the equally directionless mood in the greenback amidst the inactivity in the US markets due to the President’s Day holiday, while alternating risk appetite trends also accompanied the European stock markets on Monday.
In the meantime, 10-year gilt yields charted marginal gains above 4.10%, up for the third session in a row.
It is worth noting that market expectations for the BoE’s interest rate policy have changed compared to earlier predictions, as markets currently anticipate the first interest rate cut to occur in August, with expectations for a total easing of only 75 bps this year.
Further rises in GBP/USD now seek the weekly high at 1.2683, ahead of the 2024 top of 1.2785 (January 12). The breakout of the latter may result in a test of the December peak of 1.2827 (December 28) before the weekly high of 1.2995 (July 27, 2023), which is just shy of the important 1.3000 milestone. On the downside, initial contention is at the 2024 low of 1.2518 (February 5), prior to the December 2023 low of 1.2500 (December 13). Additional weakness may prompt spot to turn its emphasis to the weekly bottom of 1.2187 (November 10, 2023), before reaching the October 2023 low of 1.2037 (October 3), the important 1.2000 mark, and the 2023 low of 1.1802 (November 10, 2023). The RSI on the daily chart eased just below 45.
Resistance levels: 1.2629 1.2683 1.2772 (4H chart)
Support levels: 1.2518 1.2500 1.2448 (4H chart)
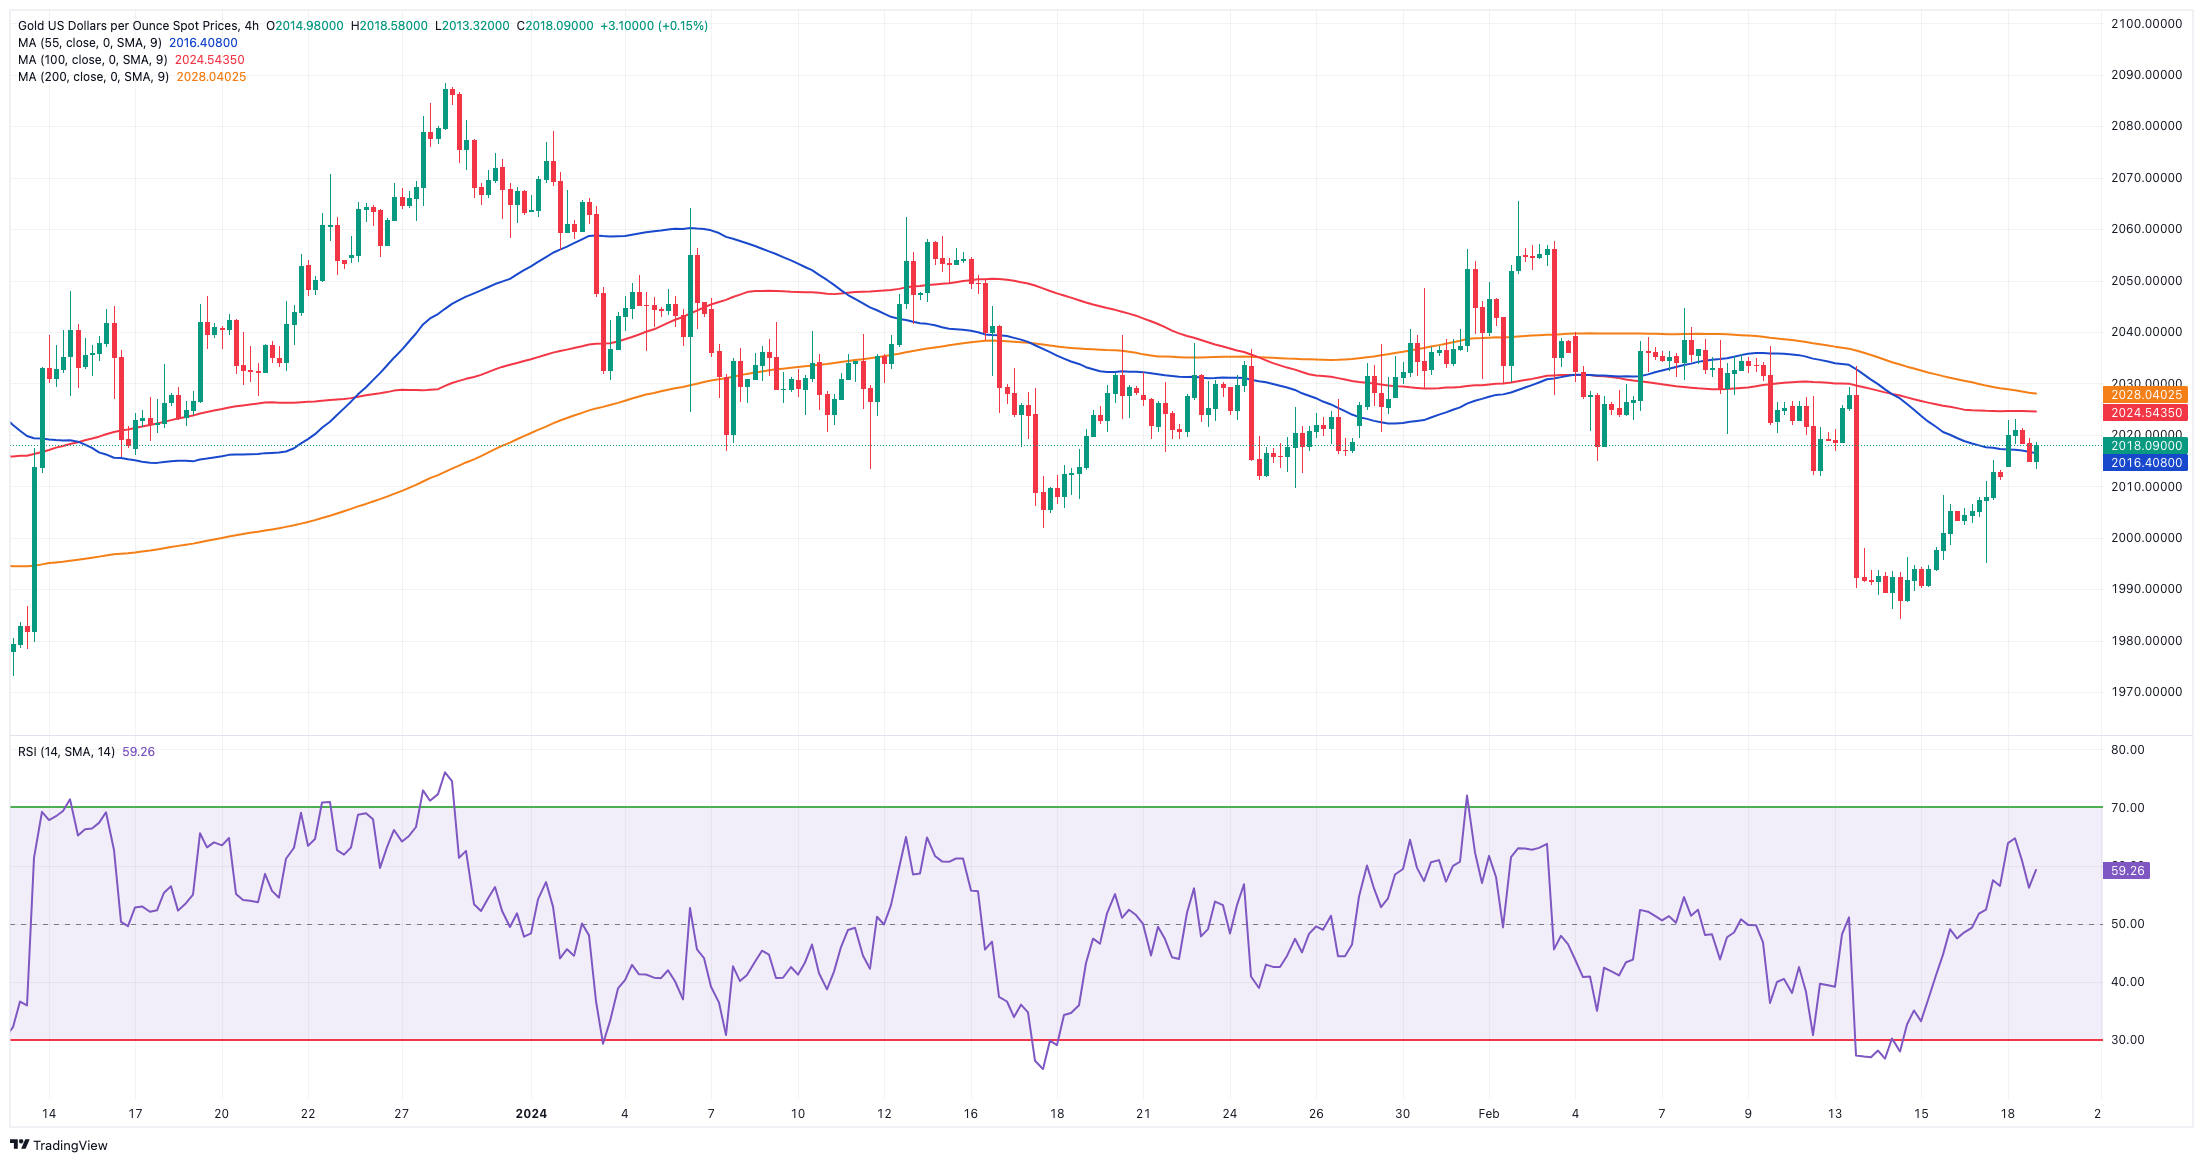
GOLD
Gold prices extended their positive streak and rose to four-day highs past the $2,020 mark per troy ounce on Monday.
The yellow metal seems to have capitalized on the inactivity in the US markets as well as the muted price action around the dollar, all ahead of the publication of the FOMC Minutes on Wednesday.
Having said that, gold has maintained its recovery momentum after reaching its YTD lows around $1,985 on February 14. Nevertheless, there is anticipation that the precious metal will be closely watched in the coming weeks due to growing speculation that the Fed might delay the implementation of its easing measures.
The immediate downside target for Gold is the 2024 low of $1,984 (February 14), followed by the December 2023 low of $1,973, which is supported by the proximity of the critical 200-day SMA at $1,965. A deeper retracement might bring the November 2023 bottom of $1,931 back into view, ahead of the October 2023 low of $1,810, the 2023 low of $1,804, and the $1,800 contention zone. Just the opposite, bullish attempts may bring the metal back to its February peak of $2,065 (February 1), ahead of the weekly high of $2,088 (December 28) and the all-time top of $2,150. (December 4, 2023).
Resistance levels: $2,023 $2,044 $2,065 (4H chart)
Support levels: $1,984 $1,973 $1,965 (4H chart)
CRUDE WTI
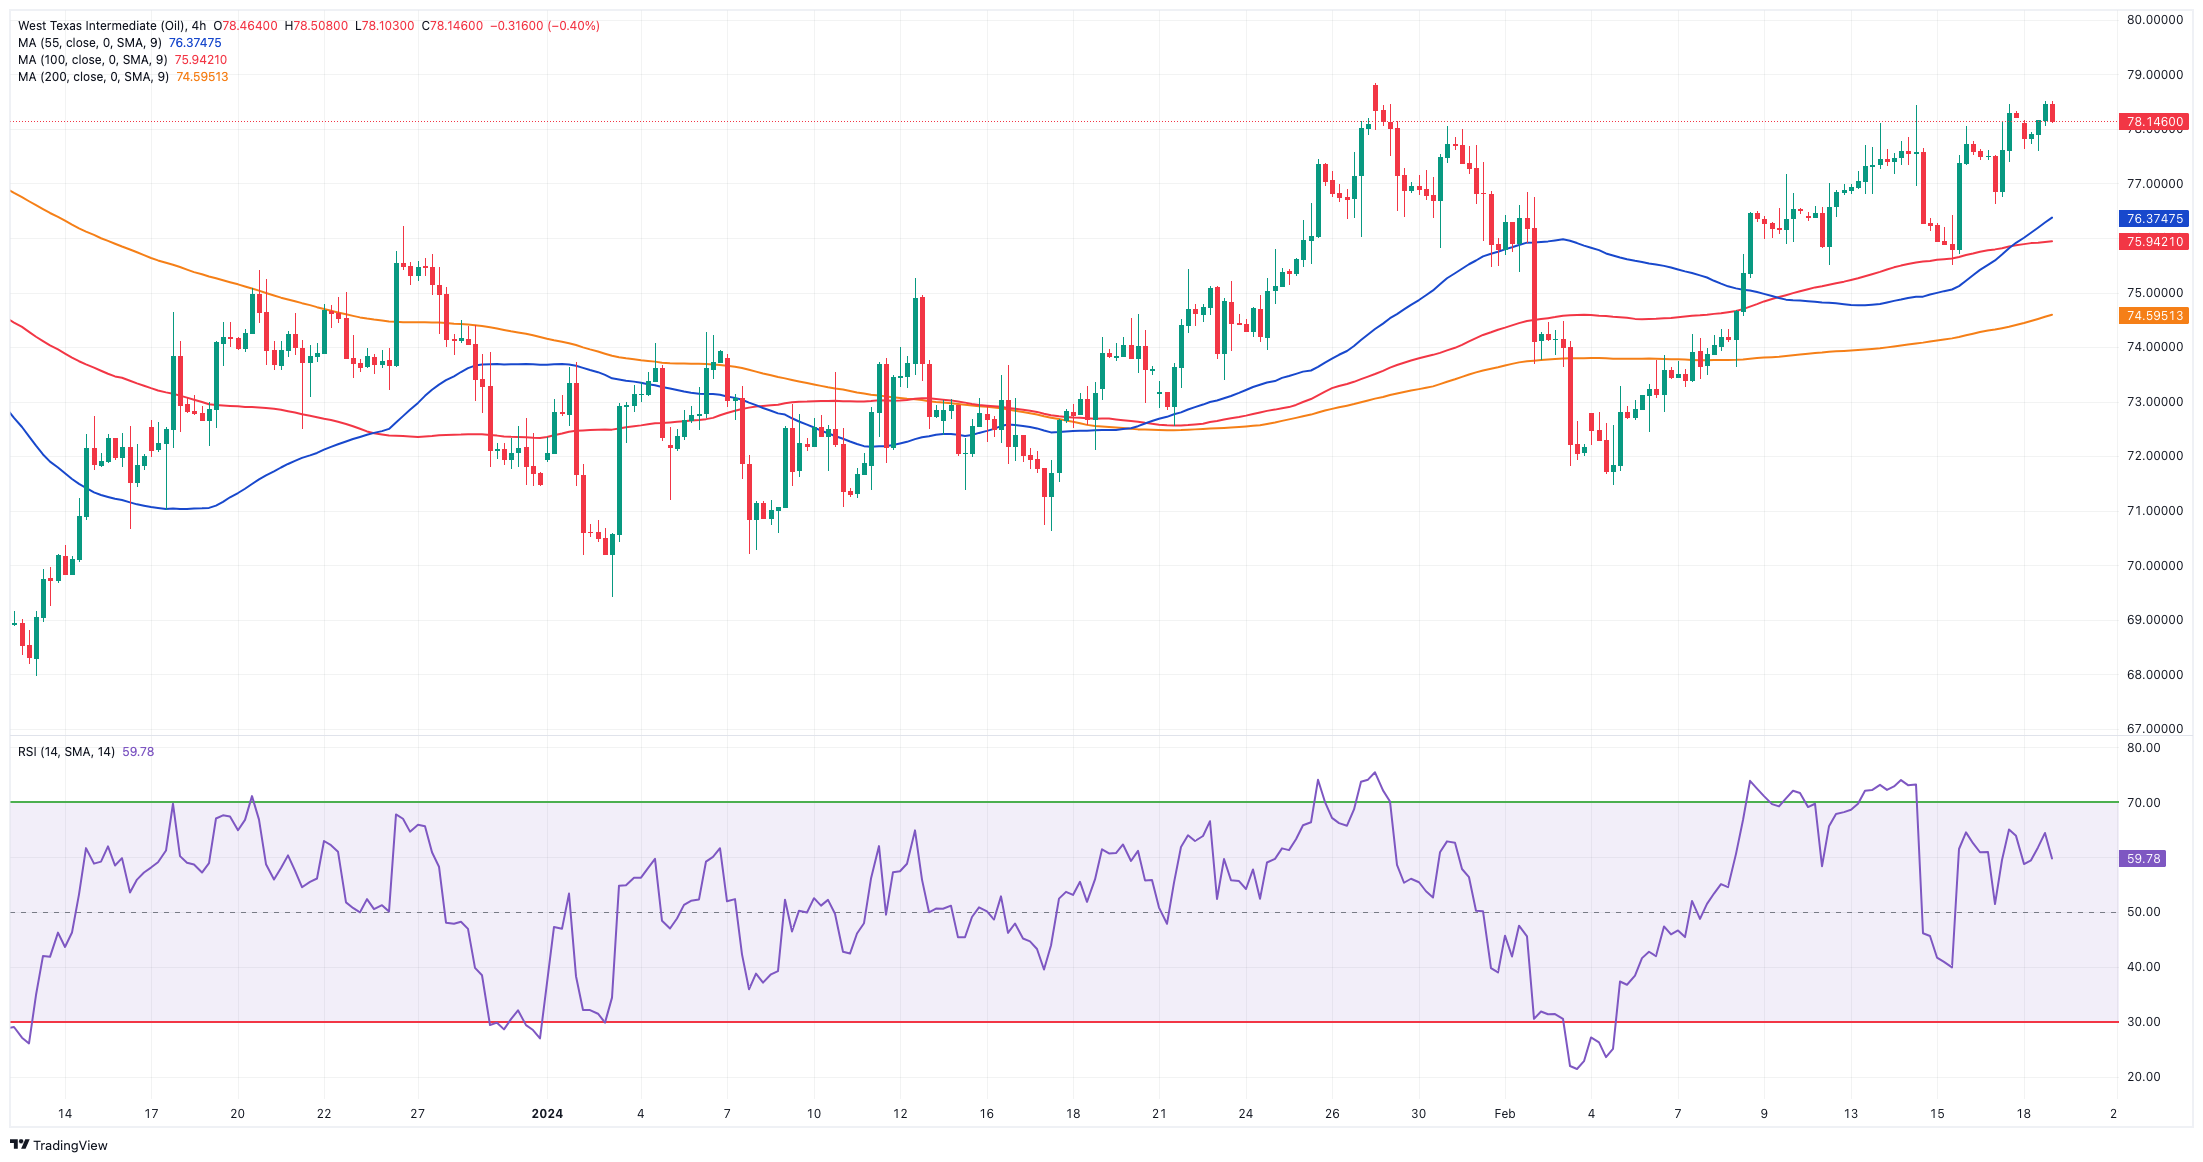
Prices of the American benchmark for sweet light crude oil alternated gains with losses around the $78.00 mark per barrel on Monday, always against the backdrop of a tight trading range and marginal trading conditions in the global markets.
The commodity kicked off the week in an inconclusive tone amidst persistent geopolitical tensions in the Middle East, demand concerns, and the omnipresent uncertainty surrounding the still-absent economic rebound in China.
On the demand side, the IEA indicated a reduced projection for global oil demand in 2024, down to 1.22 mbpd, while forecasting a growth in crude oil supply of 1.7 mbpd this year.
Further contributing to the recent upward price trends, OPEC anticipates robust global oil demand expansion in both 2024 and 2025. The cartel foresees a 2.25 mbpd increase in 2024 and a 1.85 mbpd rise in the following year.
WTI's next upward obstacle is the February high of $78.44, before the 2024 top of $79.25 (January 29), which is immediately followed by the key $80.00 barrier and the November 2023 peak of $80.15 (November 3). Extra gains from here may propel the commodity back to its weekly high of $89.83 (October 18, 2023), followed by the 2023 top of $94.99 (September 28, 2023) and the August 2022 peak of $97.65 (August 30), all before hitting the psychological $100.00 level. In contrast, the loss of the February low of $71.43 (February 5) may bring the important $70.00 barrier back into play, followed by the 2024 bottom of $69.31 (January 3).
Resistance levels: $78.74 $79.25 $79.56 (4H chart)
Support levels: $75.49 $74.57 $71.37 (4H chart)
GER40
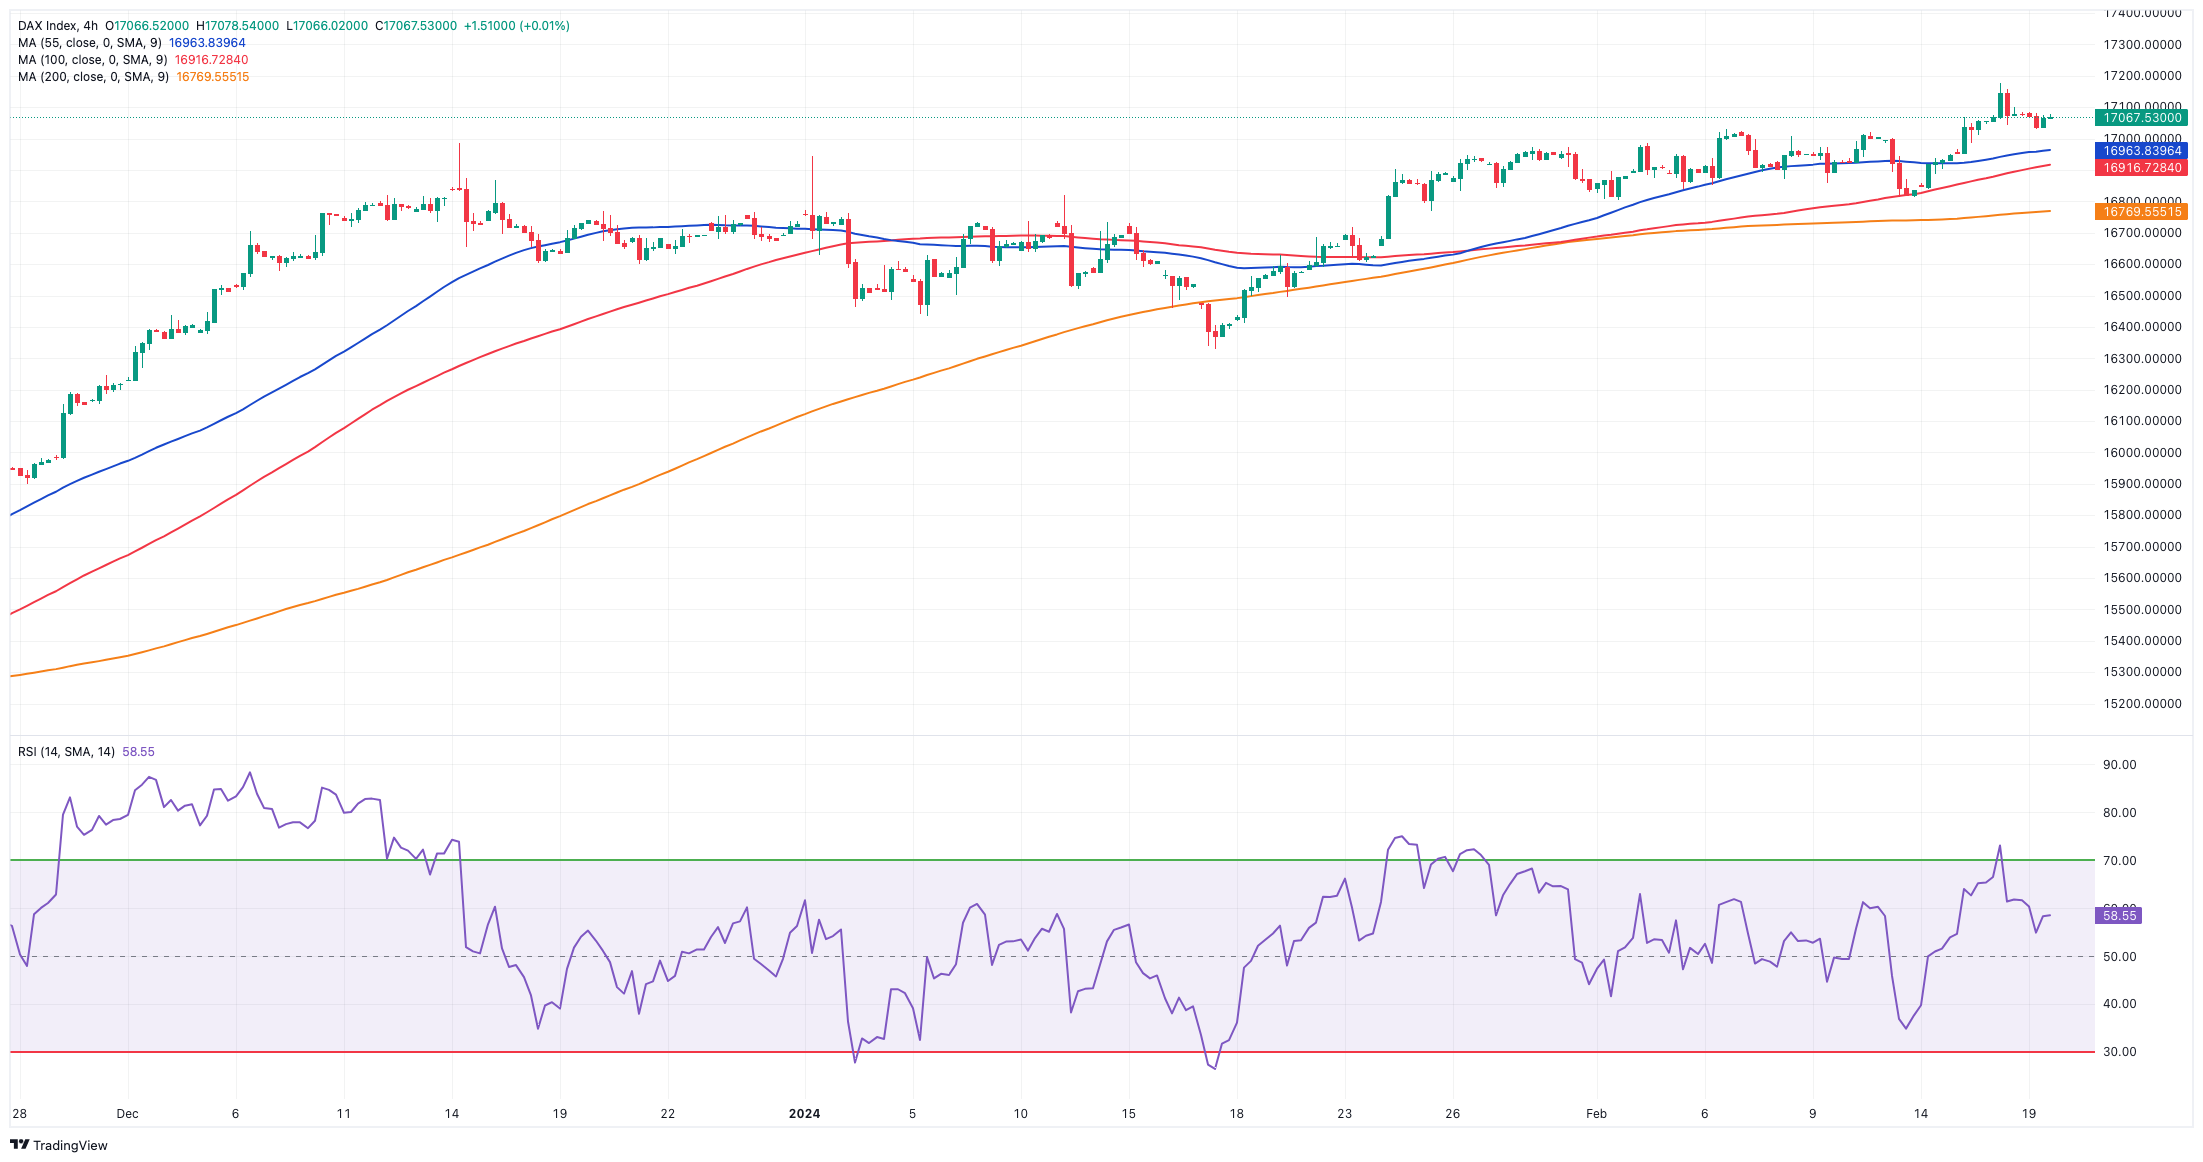
Germany’s benchmark stock index DAX40 reversed three consecutive daily gains, including Friday’s fresh all-time peak, and ended Monday’s session with humble losses around the 17,100 zone.
The daily drop in the DAX40 came in contrast with new highs by the pan-European STOXX600, as concerns surrounding the economic outlook and the generalized gloomy prospects for the German economy also weighed on investors’ sentiment.
On the latter, the Bundesbank argued that Germany's economy is likely experiencing a recession at present due to sluggish external demand, subdued consumer spending, and cautious investment behaviour.
In the domestic bond market, 10-year bund yields maintained their upward bias north of 2.40%.
The DAX40's next upward hurdle is its all-time high at 17,198 (February 16). The other way around, the February low of 16,821 (February 1) offers immediate support, seconded by the transitory 55-day SMA at 16,751 and the 2024 bottom at 16,345 (January 17). After clearing the latter, the index could dispute the 200-day SMA at 16,013, before falling to its weekly low of 15,915 (November 28). The next support is at the October 2023 low of 14,630 (October 23), followed by the March 2023 low of 14,458 (March 20). The daily RSI edged lower to the 61 region.
Best Performers: Rheinmetall AG, Adidas, Bayer
Worst Performers: Continental AG, Porsche, Covestro
Resistance levels: 17,089 (4H chart)
Support levels: 16,831 16,595 16,345 (4H chart)
GBPJPY
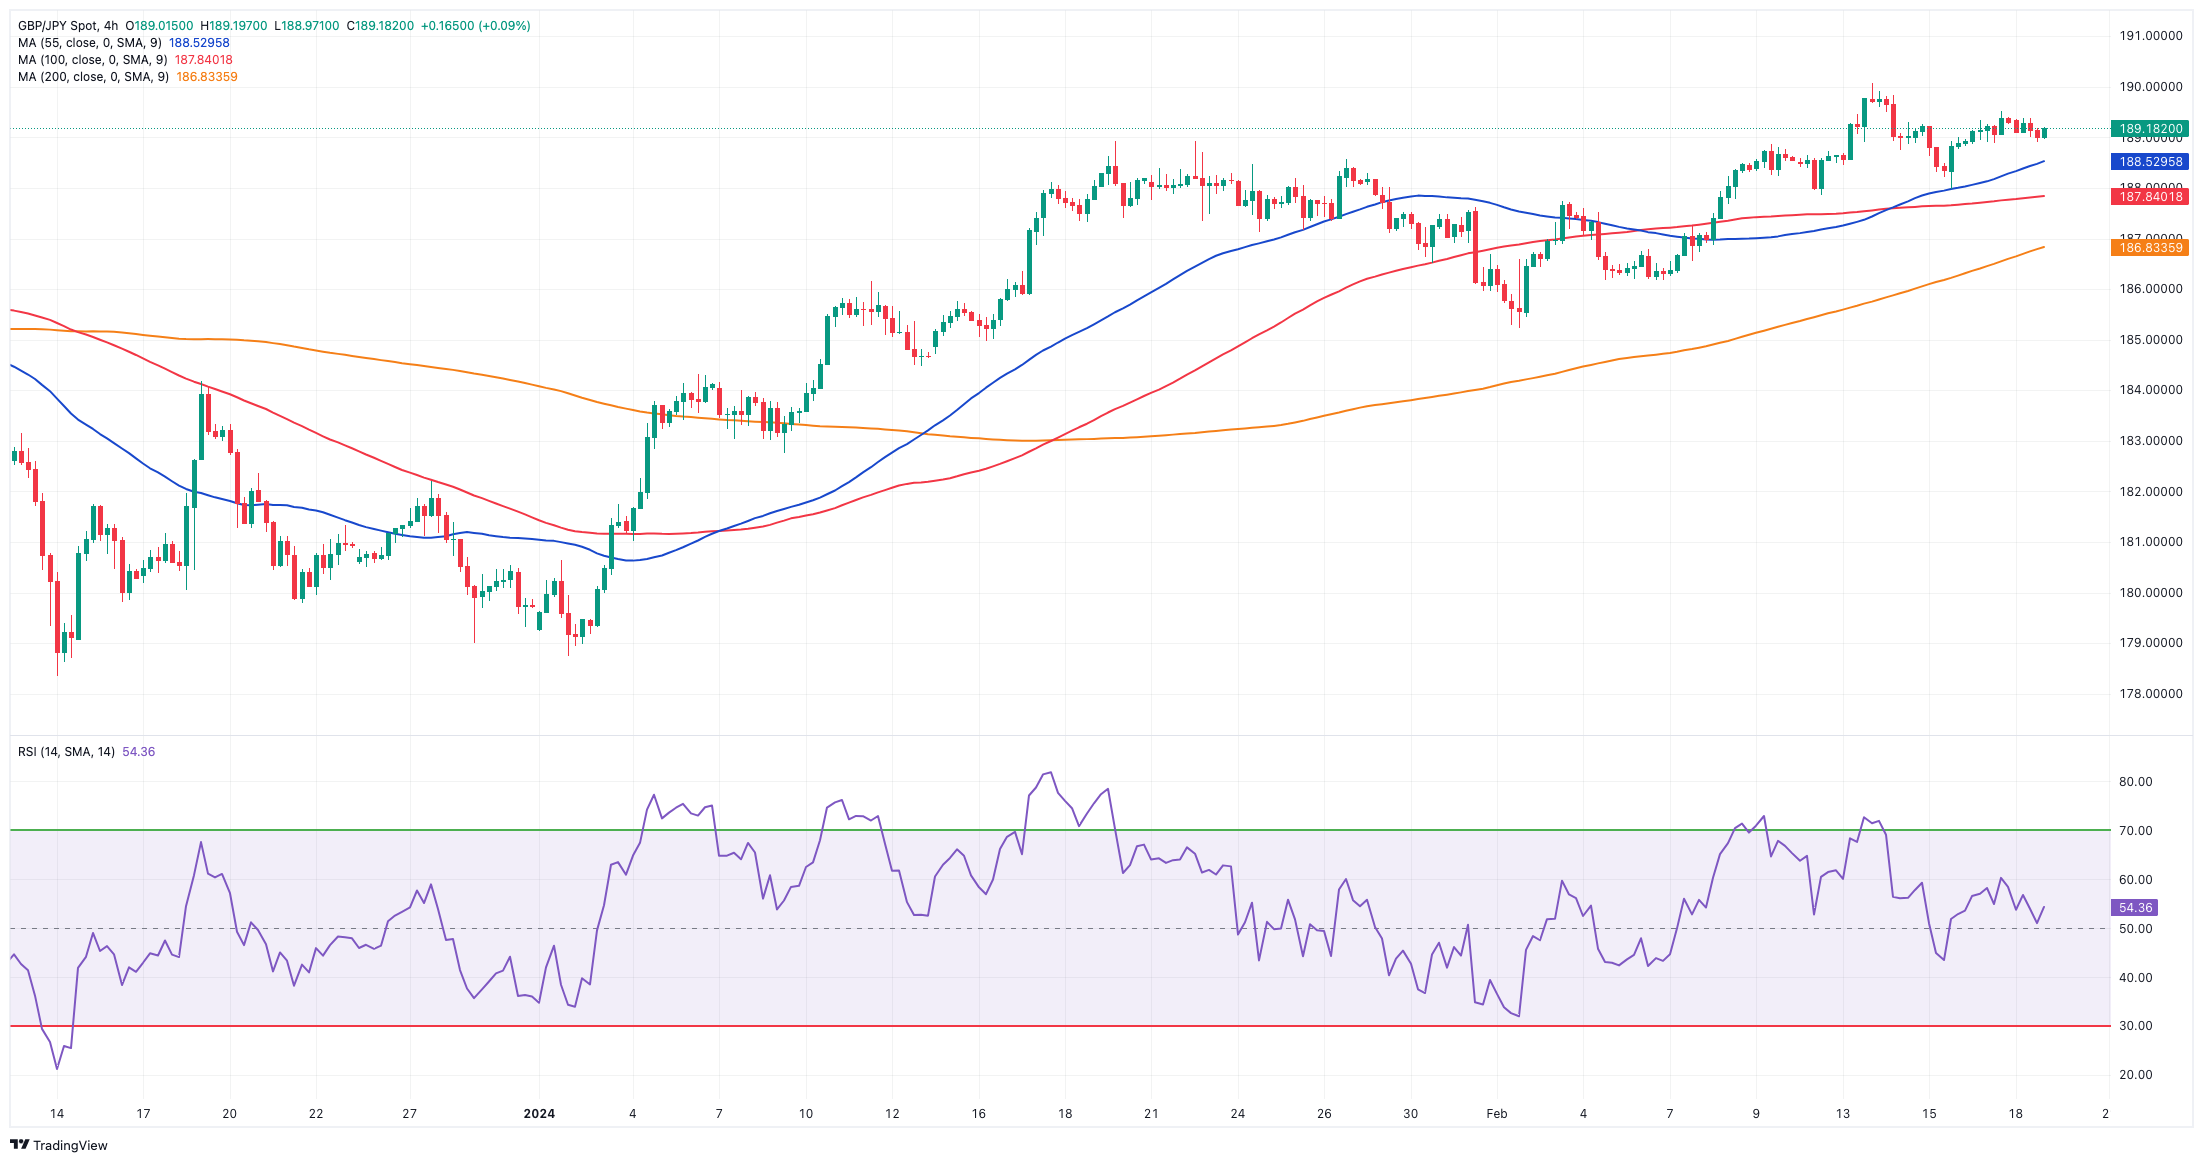
GBP/JPY traded in narrow consolidative range and kicked-off the week slightly on the defensive.
Indeed, the marginal moves in the cross came in tandem with the broad-based indecisive price action the global markets, all following the usual thin trade conditions and scarce volatility due to the inactivity in the US markets.
The next target for GBP/JPY is the 2024 high of 190.08 (February 13), prior to the August 2015 record of 195.28. If bears seize control, spot may drop to its February low of 185.22 (February 1) before attempting to breach interim support at the 55-day and 100-day SMAs of 185.05 and 184.64, respectively. If the cross goes below this zone, it might aim for the more significant 200-day SMA at 182.59, ahead of the December 2023 bottom of 178.33 (December 14) and the October 2023 low of 178.03 (October 3). A further decline might provide a challenge to the July 2023 low of 176.30, which is ahead of the May 2023 low of 167.84 (May 11). The daily RSI grinded lower to the sub-62 area.
Resistance levels: 190.08 195.28 195.88 (4H chart)
Support levels: 187.99 186.18 185.22 (4H chart)
NASDAQ
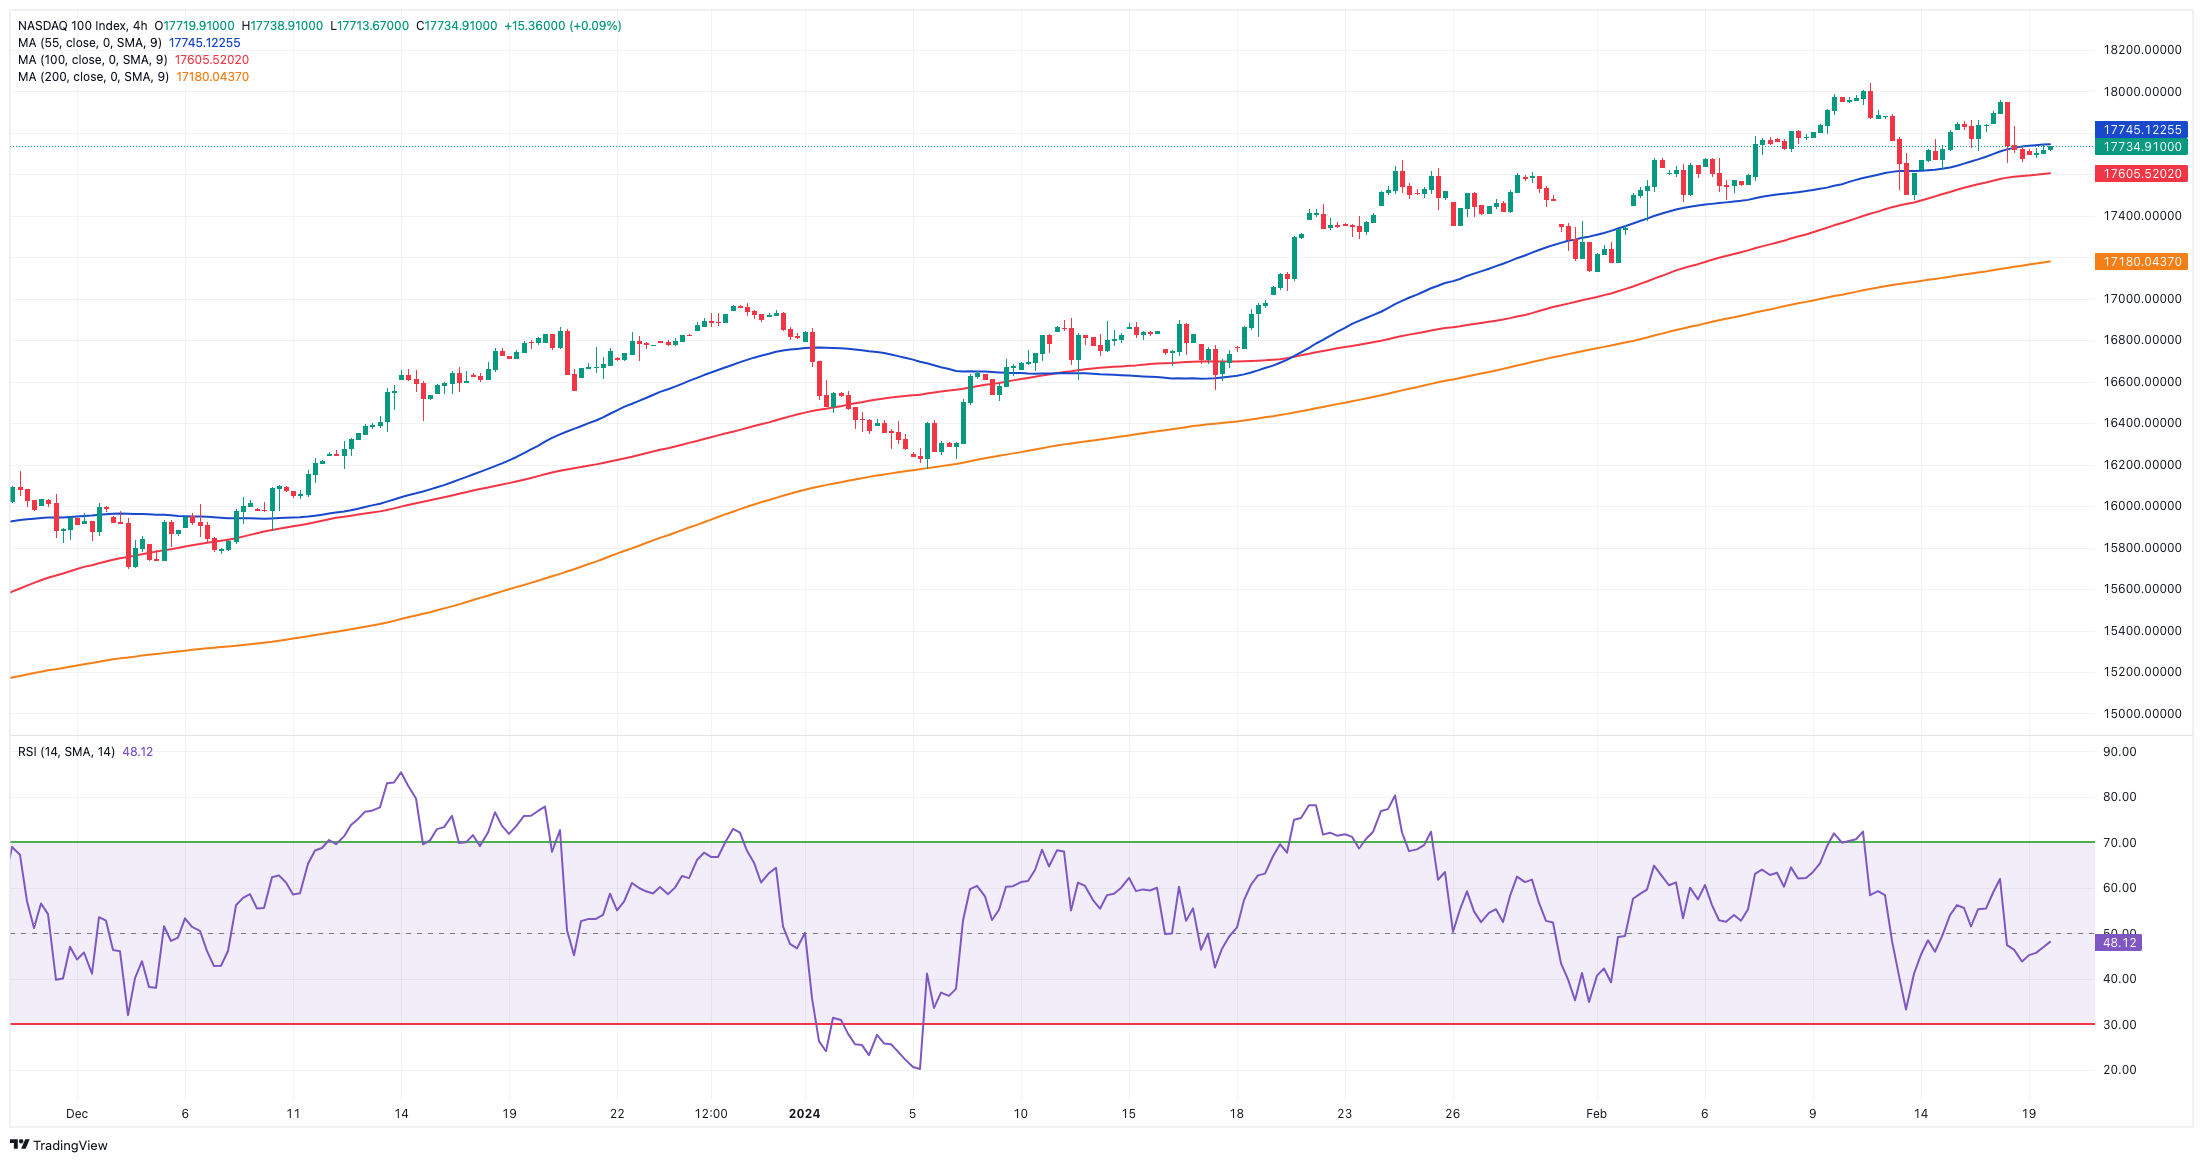
There was no activity in the key tech reference Nasdaq 100 at the beginning of the week, in line with the rest of the US markets.
A glimpse at last Friday’s session saw the Nasdaq 100 experiencing a reversal after two consecutive positive sessions, revisiting the area of two-day lows.
In fact, Friday’s uncertain price movement in the greenback, along with higher yields and another strong reading of US inflation, particularly in Producer Prices (PPI), contributed to the prevailing negative sentiment at the end of the week.
Furthermore, investors continued to increase their expectations of a later-than-anticipated interest rate cut by the Federal Reserve, with the likelihood of an announcement at the June 12 meeting.
According to CME Group's FedWatch Tool, there is approximately a 52% chance of a rate cut in June.
Bulls continue to go for the new record high of 18,041 (February 12). Conversely, the Nasdaq 100 could initially target the weekly low of 17,128 (January 31), which comes before the interim 55-day SMA of 16,909 and the 2024 low of 16,249 (January 5). If the index goes below this level, it might reach the December 2023 low of 15,695 (December 4) and the critical 200-day SMA of 15,462. A breakdown of this level may prompt a decline to the October 2023 low of 14,058 (October 26), before the April 2023 low of 12,724 (April 25), the March 2023 low of 11,695 (March 13), and the 2023 low of 10,696 (January 3). The daily chart shows the RSI dropping down below 58.
Top Gainers: The Trade Desk, Applied Materials, AstraZeneca ADR
Top Losers: DoorDash, Adobe, Airbnb
Resistance levels: 18,041 (4H chart)
Support levels: 17,478 17,128 16,561 (4H chart)
All Information & Updates provided by:

All information relating to the financial markets available on this page has been prepared and issued by FXStreet (Forexstreet SL, Spain, Reg: B62498233) on the basis of publicly available information and all information believed to be reliable and does not conflict with Kuwaiti local laws, and all necessary care has been taken to before the company to ensure that the facts mentioned are correct from the source.
NCM Investment nor any of its directors or employees shall in any way be held responsible for the contents of this news, and the information contained on this page is intended only to provide clients with publicly available information and should not be construed as investment advice, report or analysis and/or constitute an offer or invitation to buy or sell financial instruments of any kind.
RISK WARNING: Forex and CFDs are highly risky leveraged products, as losses can exceed deposits. Please ensure you understand all the risks and take independent advice if necessary. NCM will segregate the clients based on the criteria of the regulator and its bylaws. NCM does not provide any advisory service; the material published does not constitute advice or a recommendation for a transaction in any financial instrument. NCM accepts no responsibility for any use of the content presented and any consequences of that use. Anyone acting on the information provided does so at their own risk.