
- Contact Us:
-

-

-

-


Daily Market Updates
21 Feb 2024
EURUSD
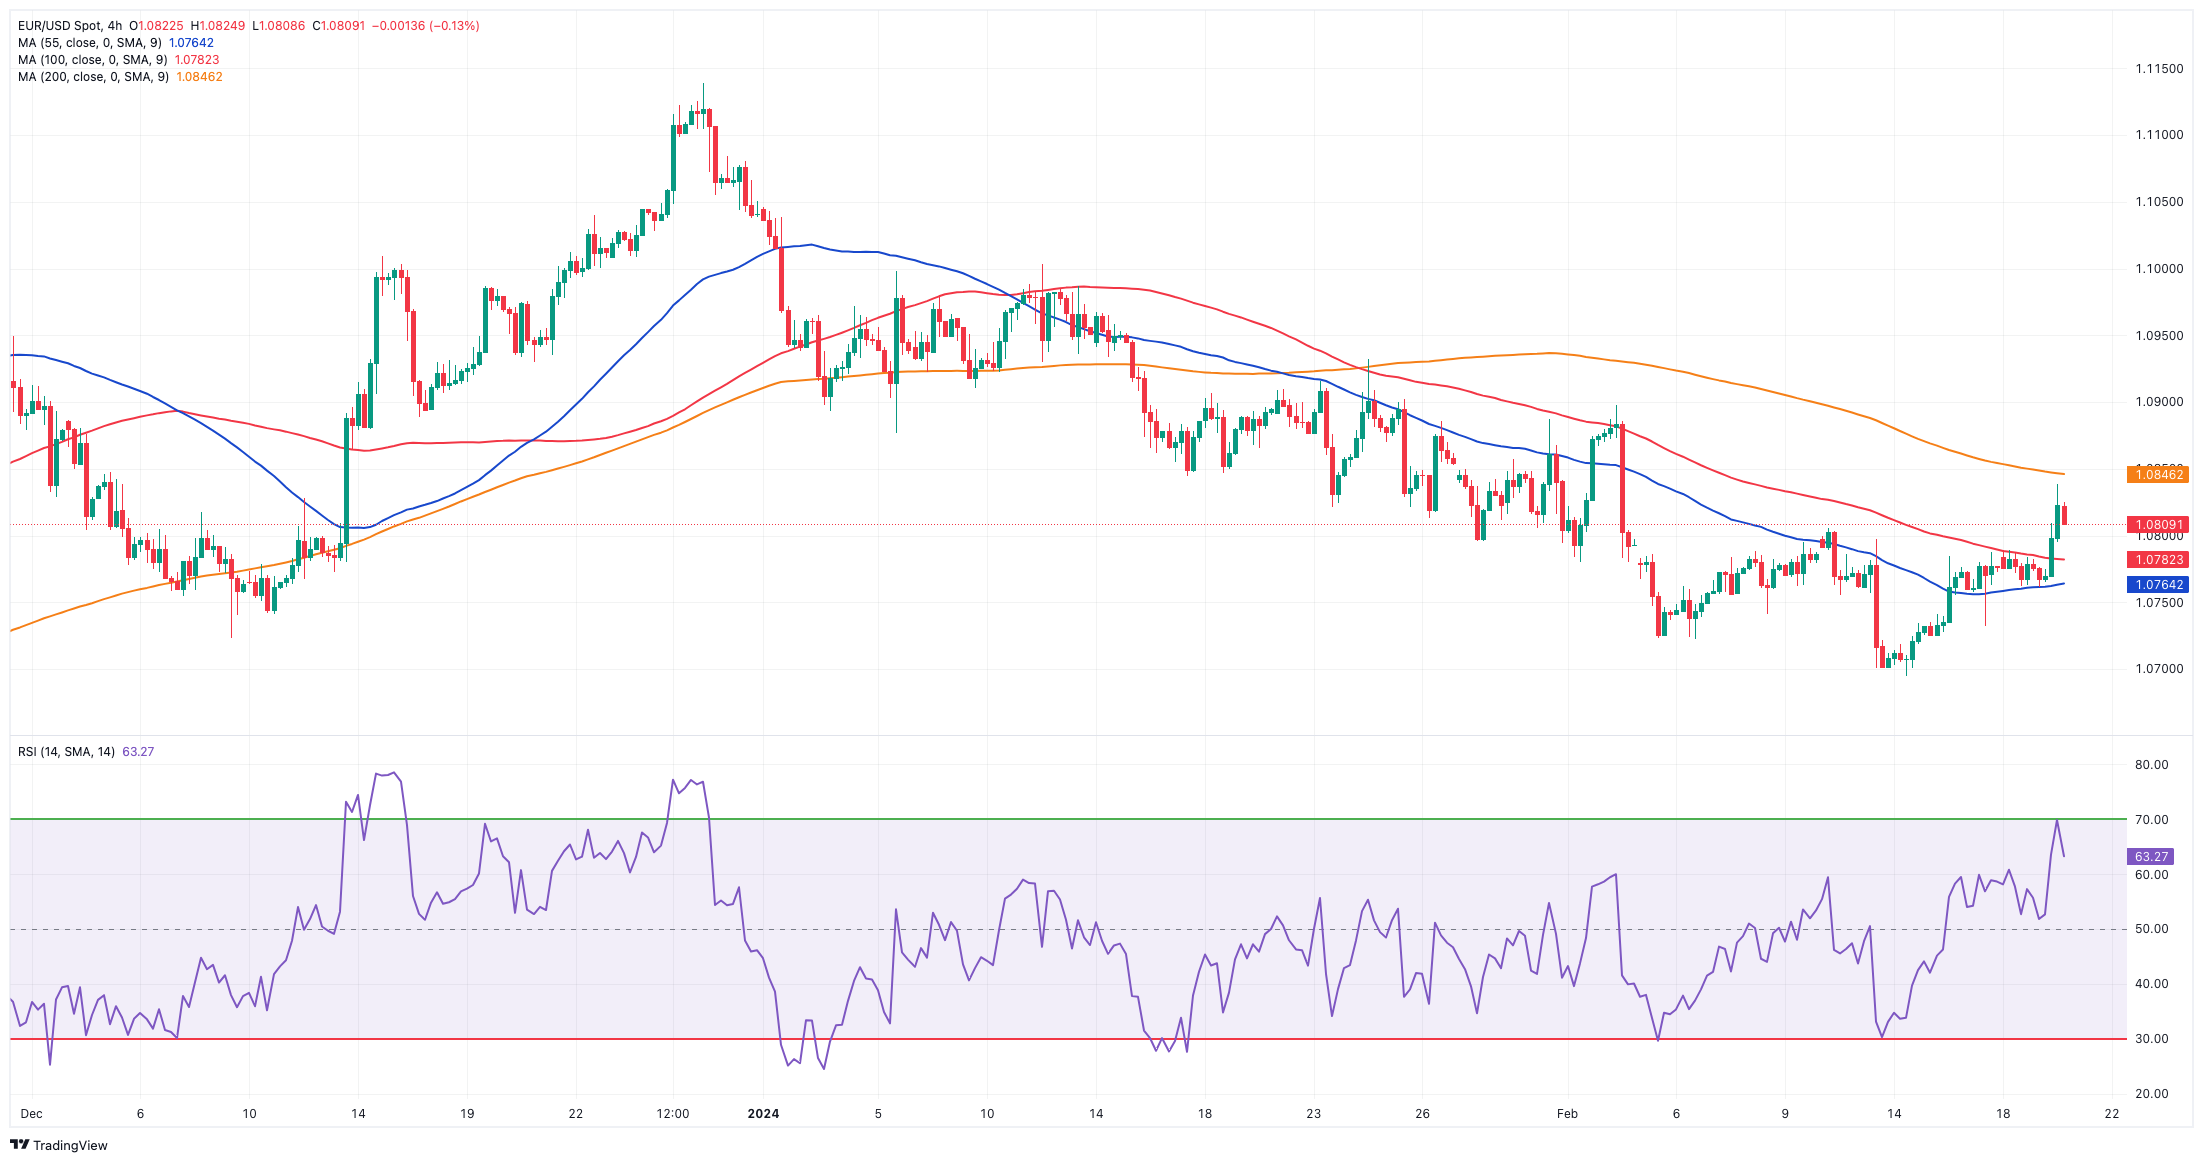
Further weakness around the greenback allowed EUR/USD to maintain its upward momentum well in place for yet another session, this time reclaiming the area beyond the key 1.0800 barrier on turnaround Tuesday.
The positive session in the pair coincided with another poor performance in the greenback, which forced the USD Index (DXY) to break below the 104.00 yardstick and clinch a new three-week lows, as US traders returned to their desks following Monday’s holiday.
Extra gains in spot were also accompanied by renewed downside pressure in US yields across different timeframes, in an atmosphere where market participants continue to see the Fed trimming its interest rates in June.
Data-wise, in the US, the CB Leading Index contracted by 0.4% MoM in January.
EUR/USD surpassed the key 200-day SMA and in doing so it has opened the door to extra gains in the short-term horizon. That said, there is an immediate hurdle at the temporary 55-day SMA at 1.0880 prior to the weekly peaks of 1.0932 (January 24) and 1.0998 (January 5, 11). The breakout of this region exposes the December 2023 high of 1.1139 (December 27), which is supported by the 200-week SMA of 1.1148 and comes before the 2023 top of 1.1275 (July 18). In the other direction, the 2024 low of 1.0694 (February 14) is next, followed by the weekly low of 1.0495 (October 13, 2023), the 2023 low of 1.0448 (October 3), and the round level of 1.0400. The daily RSI increased over the 50 threshold.
Resistance levels: 1.0838 1.0845 1.0932 (4H chart)
Support levels: 1.0732 1.0694 1.0656 (4H chart)
USDJPY
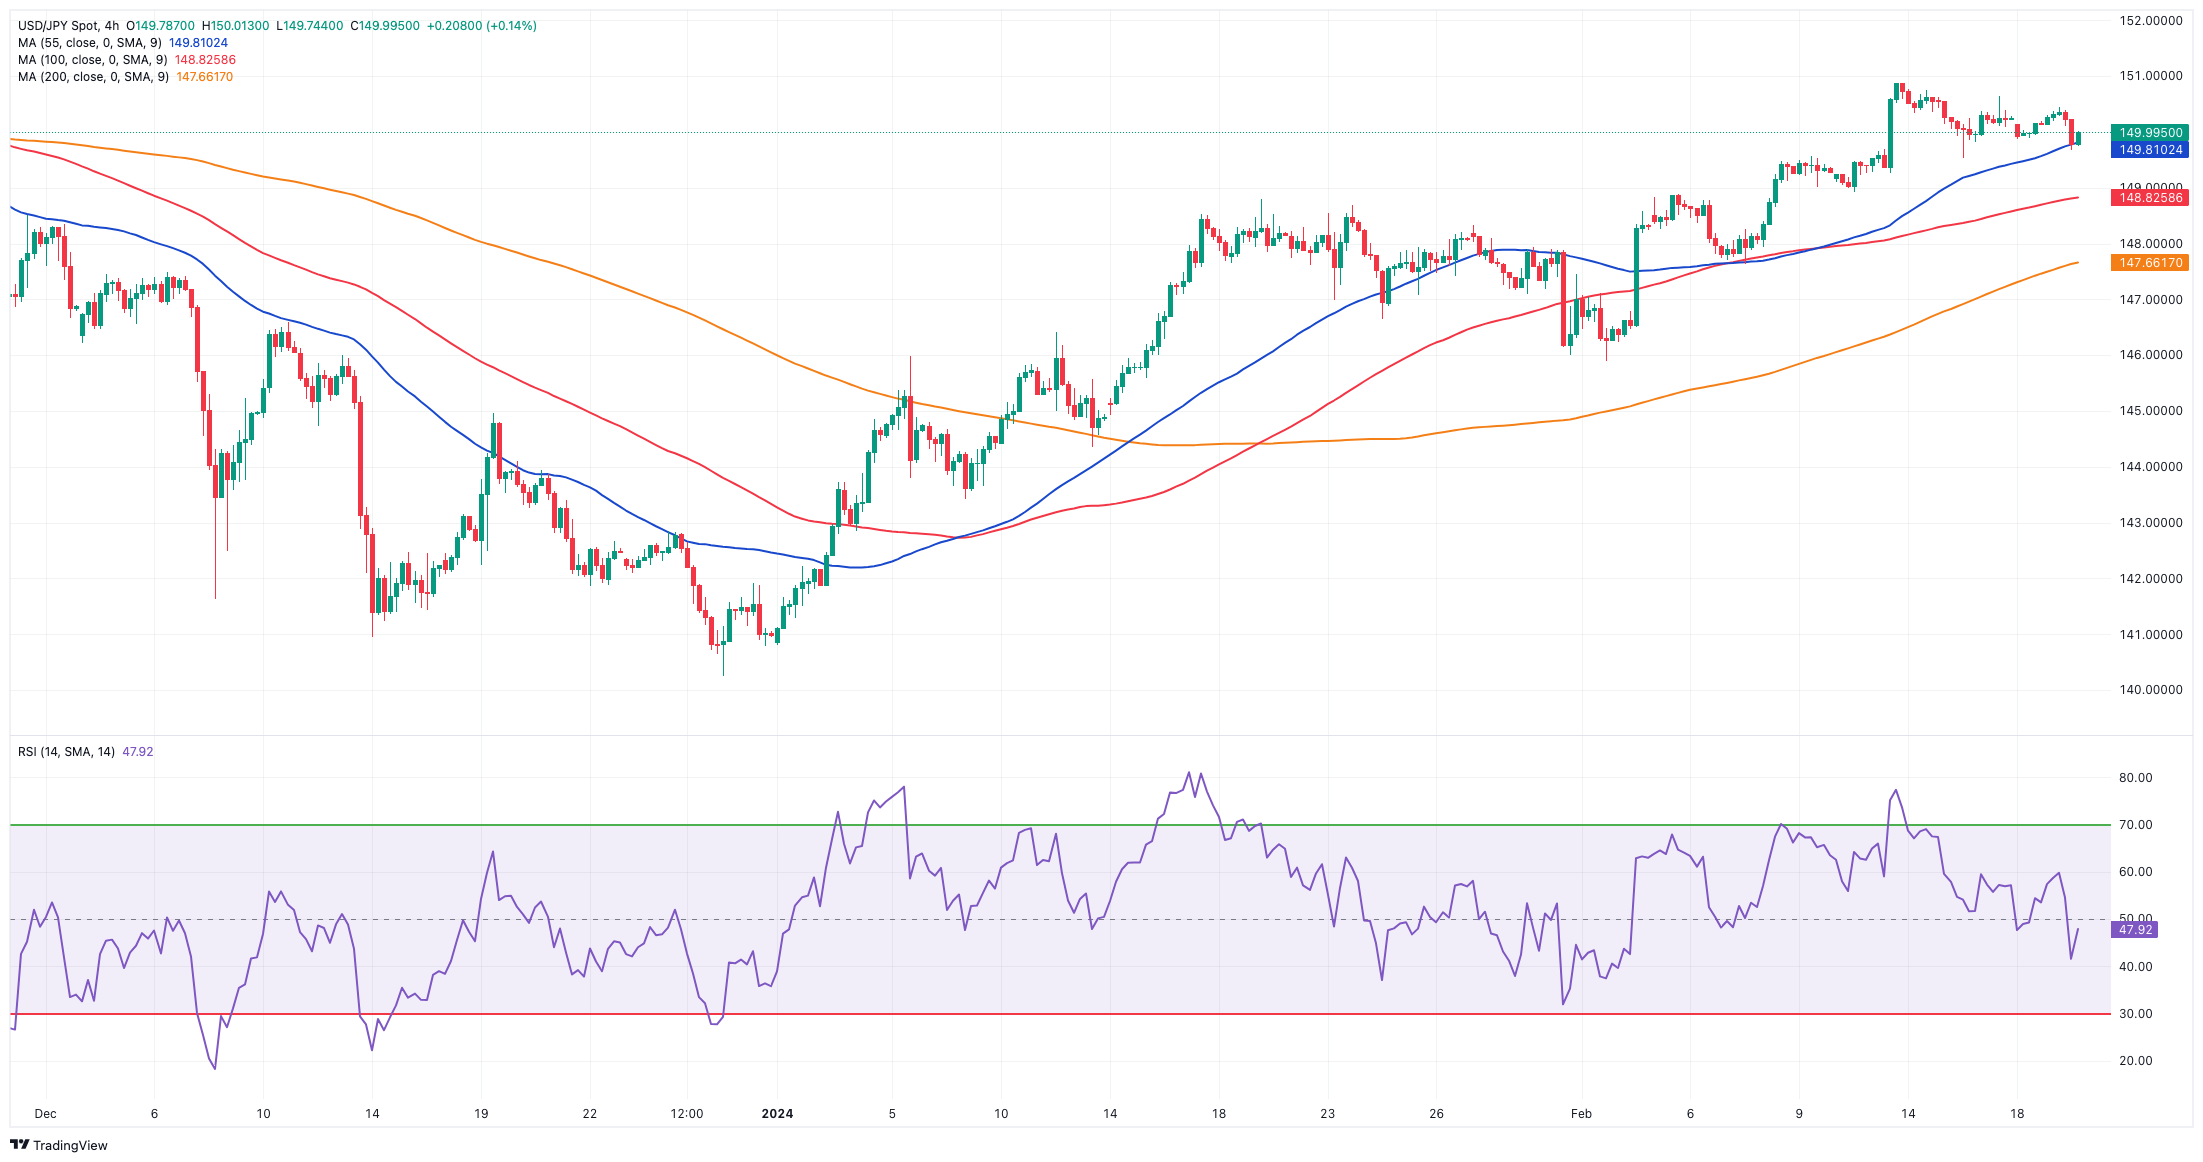
USD/JPY extended the pessimism seen at the beginning of the week and slipped back to three-day lows in the 149.70/65 band on Tuesday.
Further weakness in the pair came in tandem with the continuation of the sell-off in the greenback, while the knee-jerk in US yields across the curve also underpinned the pair’s downward bias.
That said, spot gyrated around the 150.00 region, partially fading Friday’s decent uptick in a context dominated by a generalized range-bound trade and expectation ahead of the release of the FOMC Minutes later in the week.
In the Japanese bond market, JGB 10-year yields remained flat, around 0.73%.
If bulls recover the initiative, USD/JPY might reach the 2024 high of 150.88 (February 13), before the 2023 peak of 151.90. (November 13). Further north, the 2022 high of 151.94 (October 21) is closely followed by the round number of 152.00. On the contrary, the 100-day SMA should provide temporary support around 147.62 ahead of the February low of 145.89 (February 1), which is still supported by the preliminary 55-day SMA. The critical 200-day SMA at 145.37 comes before the December 2023 low of 140.24 (December 28), the round number of 140.00, and the July low of 137.23. (July 14). The daily RSI seems to be constant at approximately 64.
Resistance levels: 150.88 151.43 151.90 (4H chart)
Support levels: 149.50 148.92 147.61 (4H chart)
GBPUSD
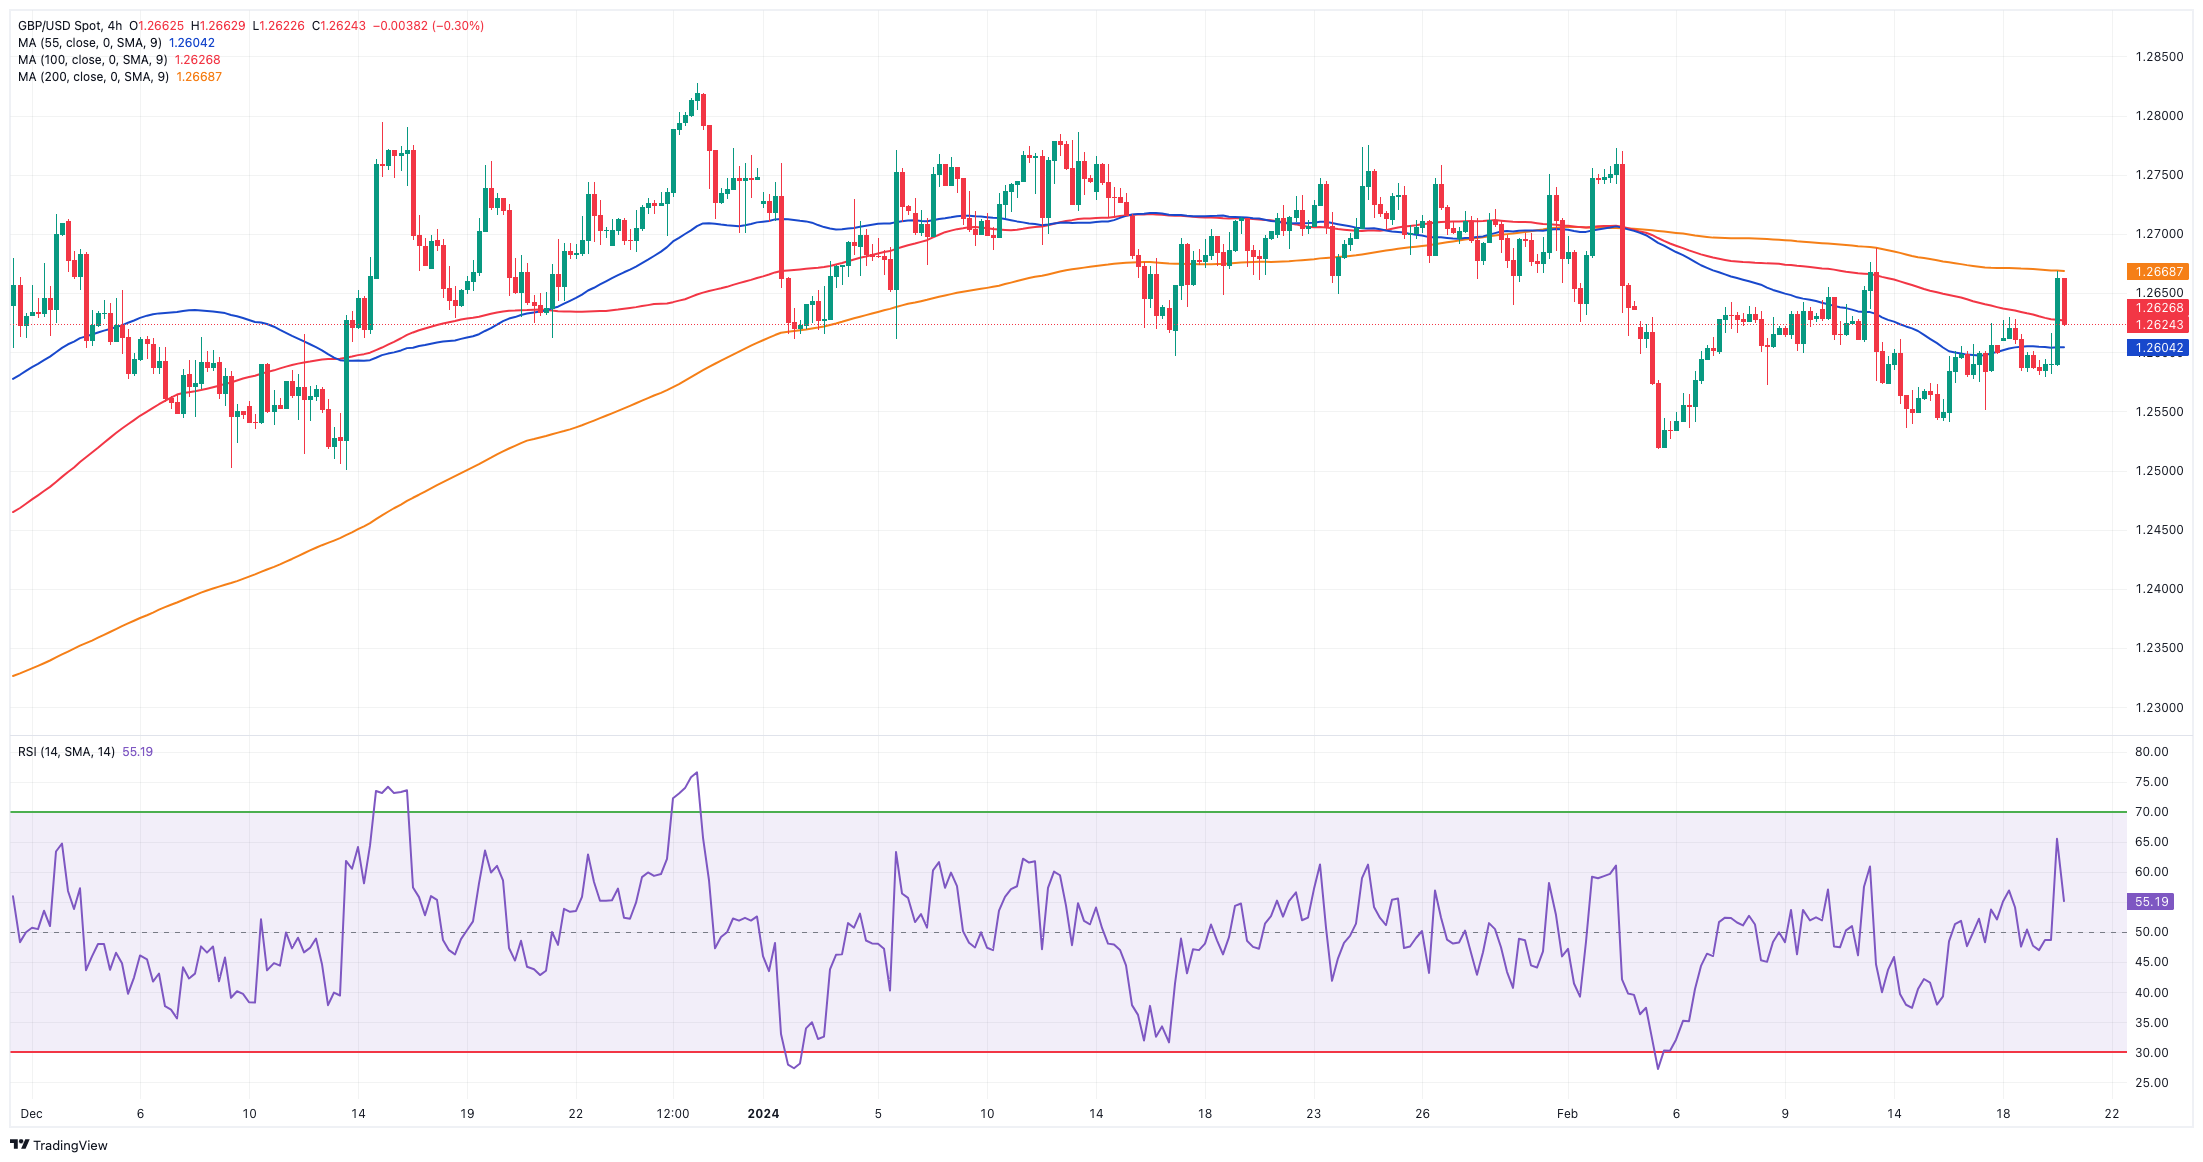
The persistent selling bias in the greenback sponsored a move to multi-day highs in GBP/USD, which this time flirted with the 1.2670 zone, an area also coincident with the provisional 55-day SMA.
Cable, in the meantime, reversed two straight sessions of losses against the backdrop of extra improvement in the appetite for risk-linked assets.
In the UK, BoE Governor A. Bailey, along with other members of the MPC, provided testimony during the Treasury Committee hearing on the February Monetary Policy Committee Report. During the hearing, Bailey acknowledged that the economy is displaying clear indications of improvement. He also cautioned that interest rates do not necessarily have to wait for inflation to reach its target before considering a cut.
However, the market currently does not foresee the possibility of an interest rate cut on March 21, with the probability increasing to nearly 25% by May 9 and over 60% by June 20. It is not until August 1 that a rate cut is fully priced in by the market.
Further increases in GBP/USD now target the weekly high at 1.2683, ahead of the February top of 1.2772 (February 2) and the 2024 peak at 1.2785 (January 12). The latter's breakout may result in a test of the December high of 1.2827 (December 28) before the weekly top of 1.2995 (July 27, 2023), which aligns just before the critical 1.3000 level. On the downside, initial contention is at the 2024 bottom of 1.2518 (February 5) seconded by the December 2023 low of 1.2500 (December 13), all reinforced by the interim 100-day SMA at 1.2504. Additional weakening may cause spot to shift its focus to the weekly bottom of 1.2187 (November 10, 2023), before hitting the October 2023 low of 1.2037 (October 3), the crucial 1.2000 level, and the 2023 low of 1.1802 (November 10, 2023). The RSI on the daily chart rose to the vicinity of 51.
Resistance levels: 1.2668 1.2683 1.2772 (4H chart)
Support levels: 1.2518 1.2500 1.2448 (4H chart)
GOLD
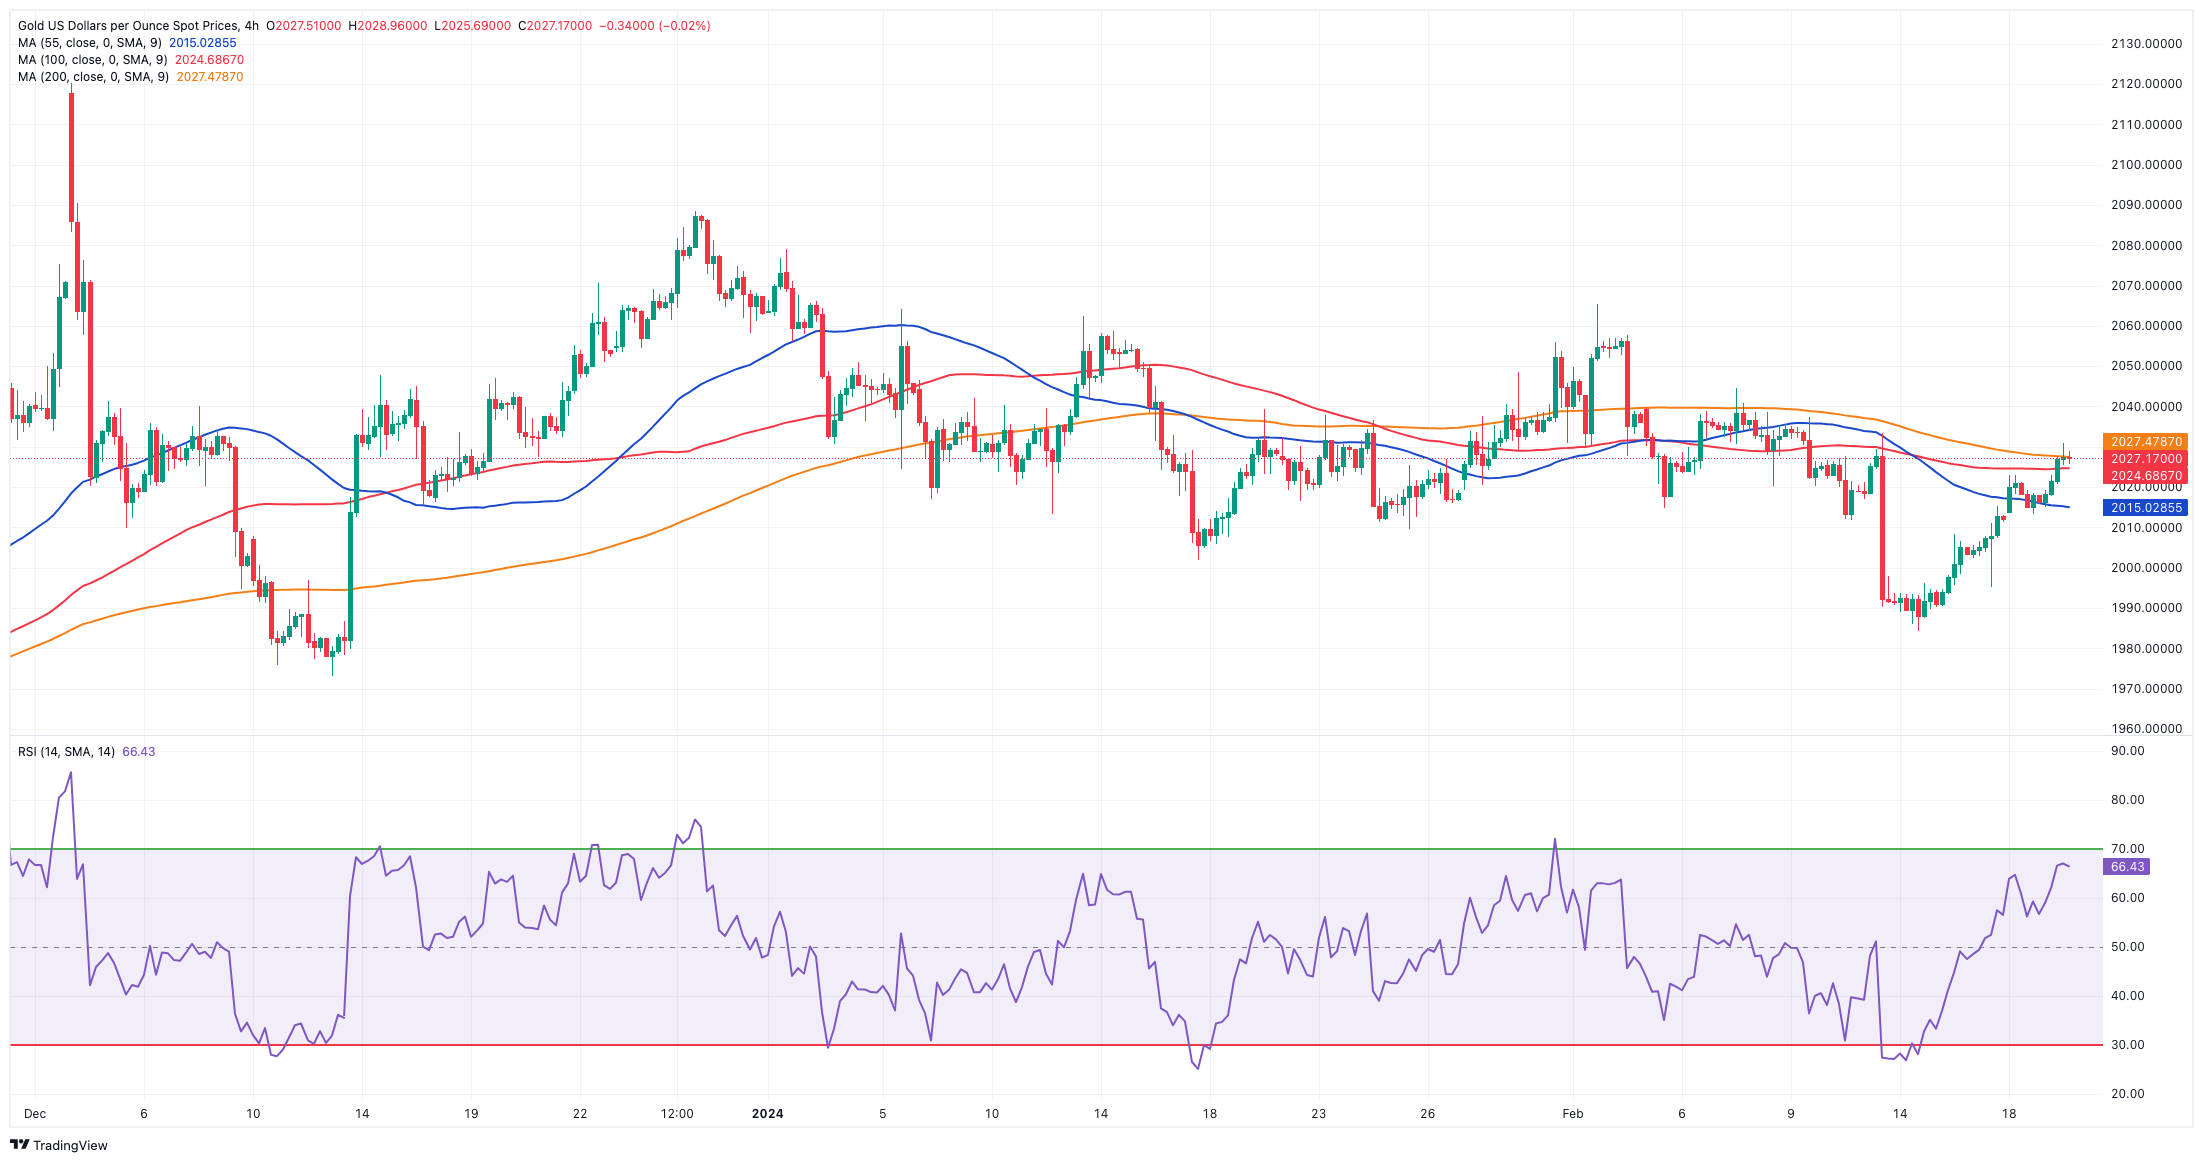
Another positive session saw gold prices extend their multi-day recovery and revisit the $2,030 region per troy ounce on Tuesday.
The persevering buying pressure in the yellow metal was further propped up by the extra decline in the dollar and renewed downward pressure across the US yield curve.
Upcoming in the schedule for gold is the release of the FOMC Minutes on February 21. With that being said, there is an expectation that the precious metal will be closely monitored in the following weeks due to increasing speculation about the Fed potentially postponing the implementation of its easing measures to its June gathering.
Extra rebound could prompt Gold to dispute to its February peak of $2,065 (February 1), ahead of the weekly high of $2,088 (December 28) and all-time top of $2,150. (December 4, 2023). On the contrary, the initial downside objective is the 2024 low of $1,984 (February 14), seconded by the December 2023 bottom of $1,973, which is supported by the proximity of the crucial 200-day SMA at $1,965. A deeper decline might bring the November 2023 low of $1,931 back into focus, ahead of the October 2023 low of $1,810, followed by the 2023 low of $1,804, and the $1,800 contention zone.
Resistance levels: $2,030 $2,044 $2,065 (4H chart)
Support levels: $1,984 $1,973 $1,965 (4H chart)
CRUDE WTI
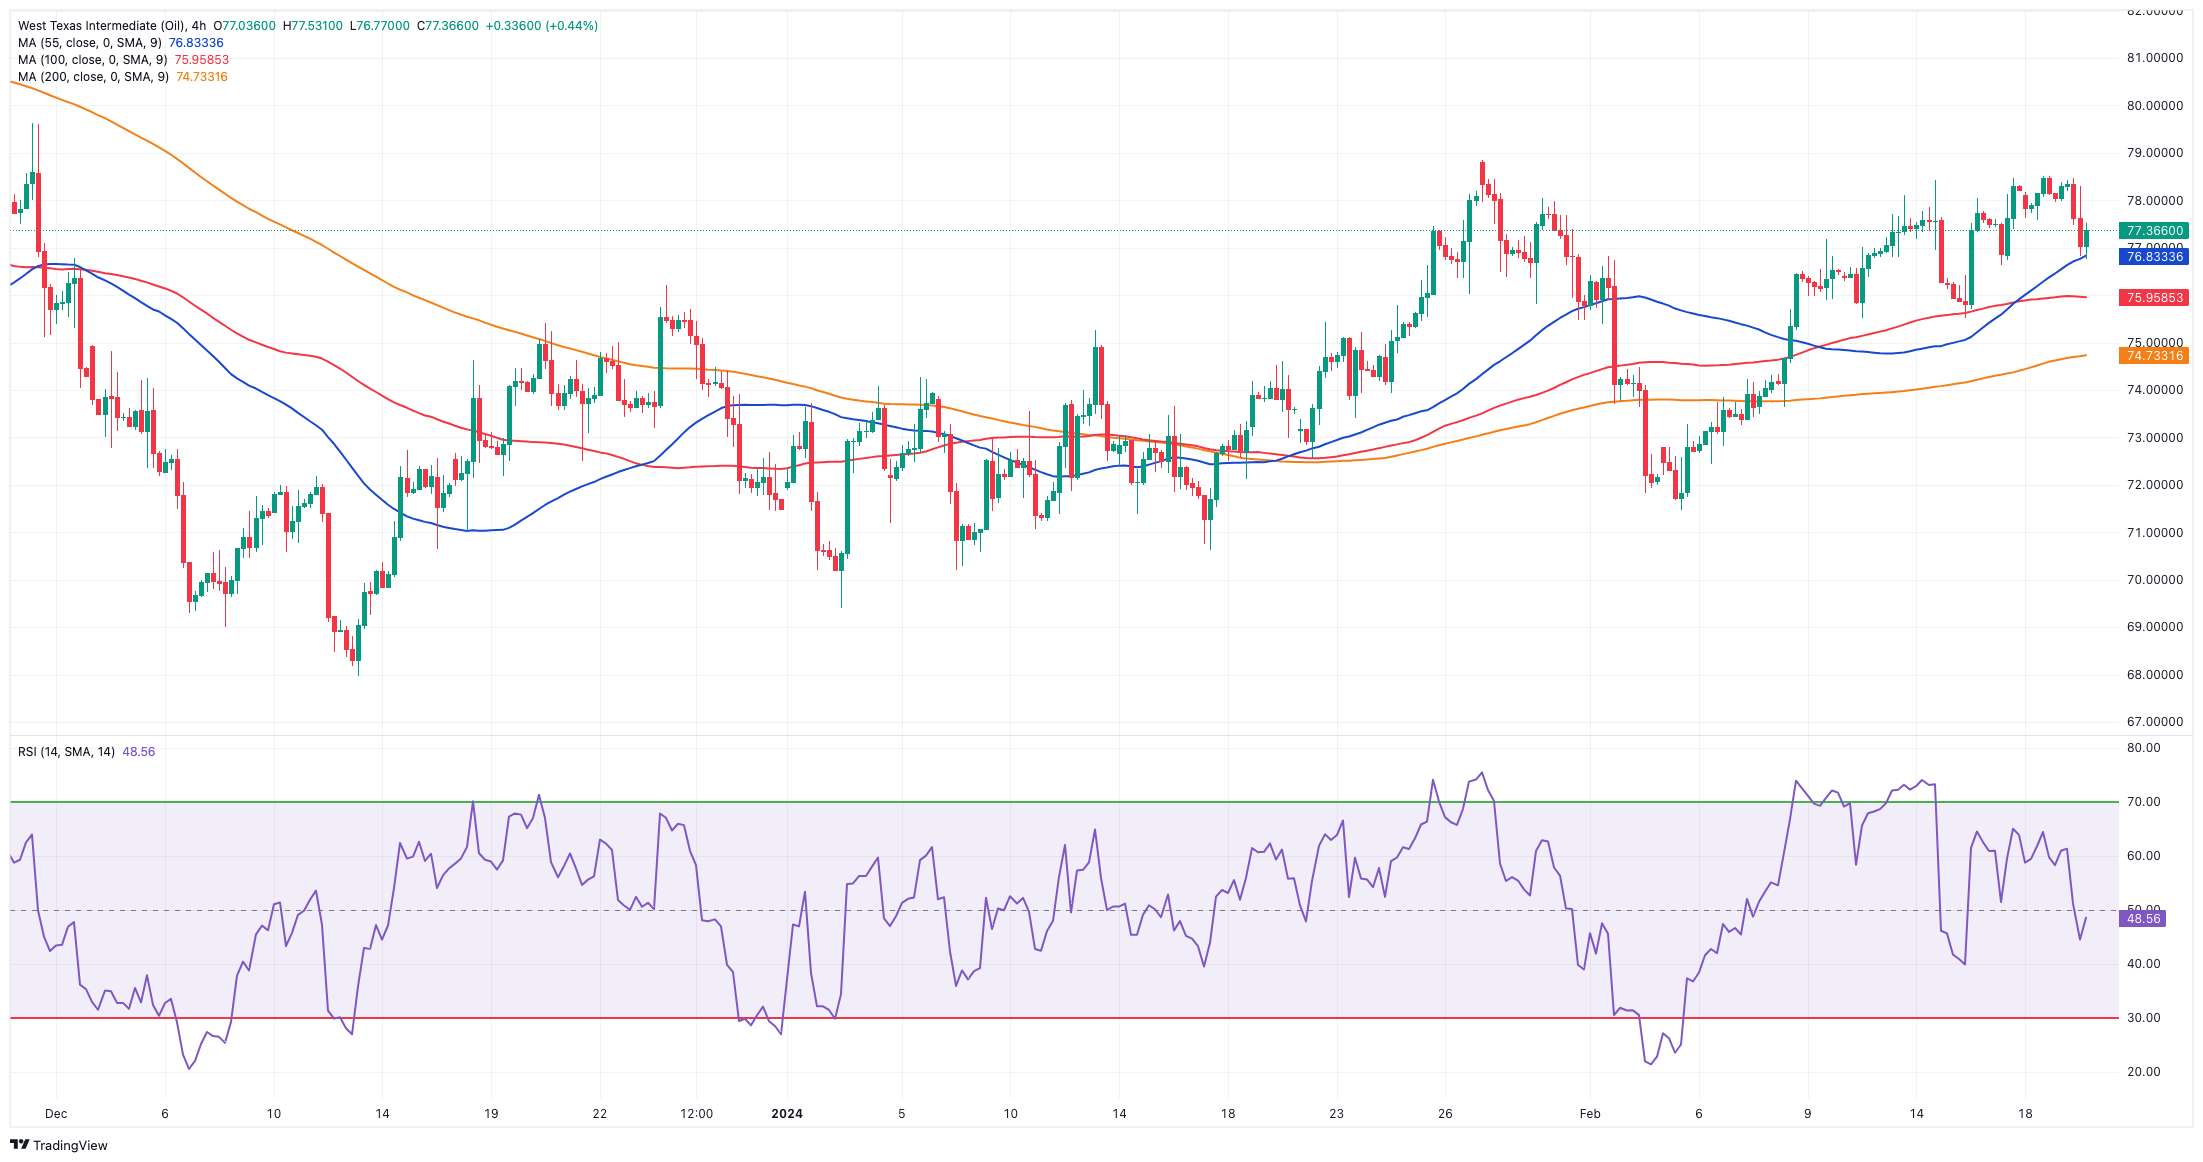
Fresh demand concerns and omnipresent worries surrounding the Chinese economy weighed on traders’ sentiment on Tuesday, dragging prices of WTI to two-day lows in the sub-$77.00 region per barrel.
Meanwhile, investors continued to factor in last week’s bearish report from the IEA after the agency reduced its projection for global oil demand in 2024 to 1.22 mbpd while forecasting a growth in crude oil supply of 1.7 mbpd this year.
Later in the week, the focus of attention will be on the weekly report on US crude oil inventories by both the API and the EIA, on Wednesday and Thursday, respectively.
The next up-barrier for WTI is the February high of $78.44, which comes ahead of the 2024 top of $79.25 (January 29), and the critical $80.00 barrier, all preceding the November 2023 peak of $80.15 (November 3). Extra gains from here may take the commodity back to its weekly high of $89.83 (October 18, 2023), prior to the 2023 top of $94.99 (September 28, 2023), the August 2022 peak of $97.65 (August 30) and the psychological $100.00 mark. In contrast, the loss of the February low of $71.43 (February 5) might put the crucial $70.00 barrier back into play, followed by the 2024 bottom of $69.31 (January 3).
Resistance levels: $78.74 $79.25 $79.56 (4H chart)
Support levels: $76.84 $75.49 $74.69 (4H chart)
GER40
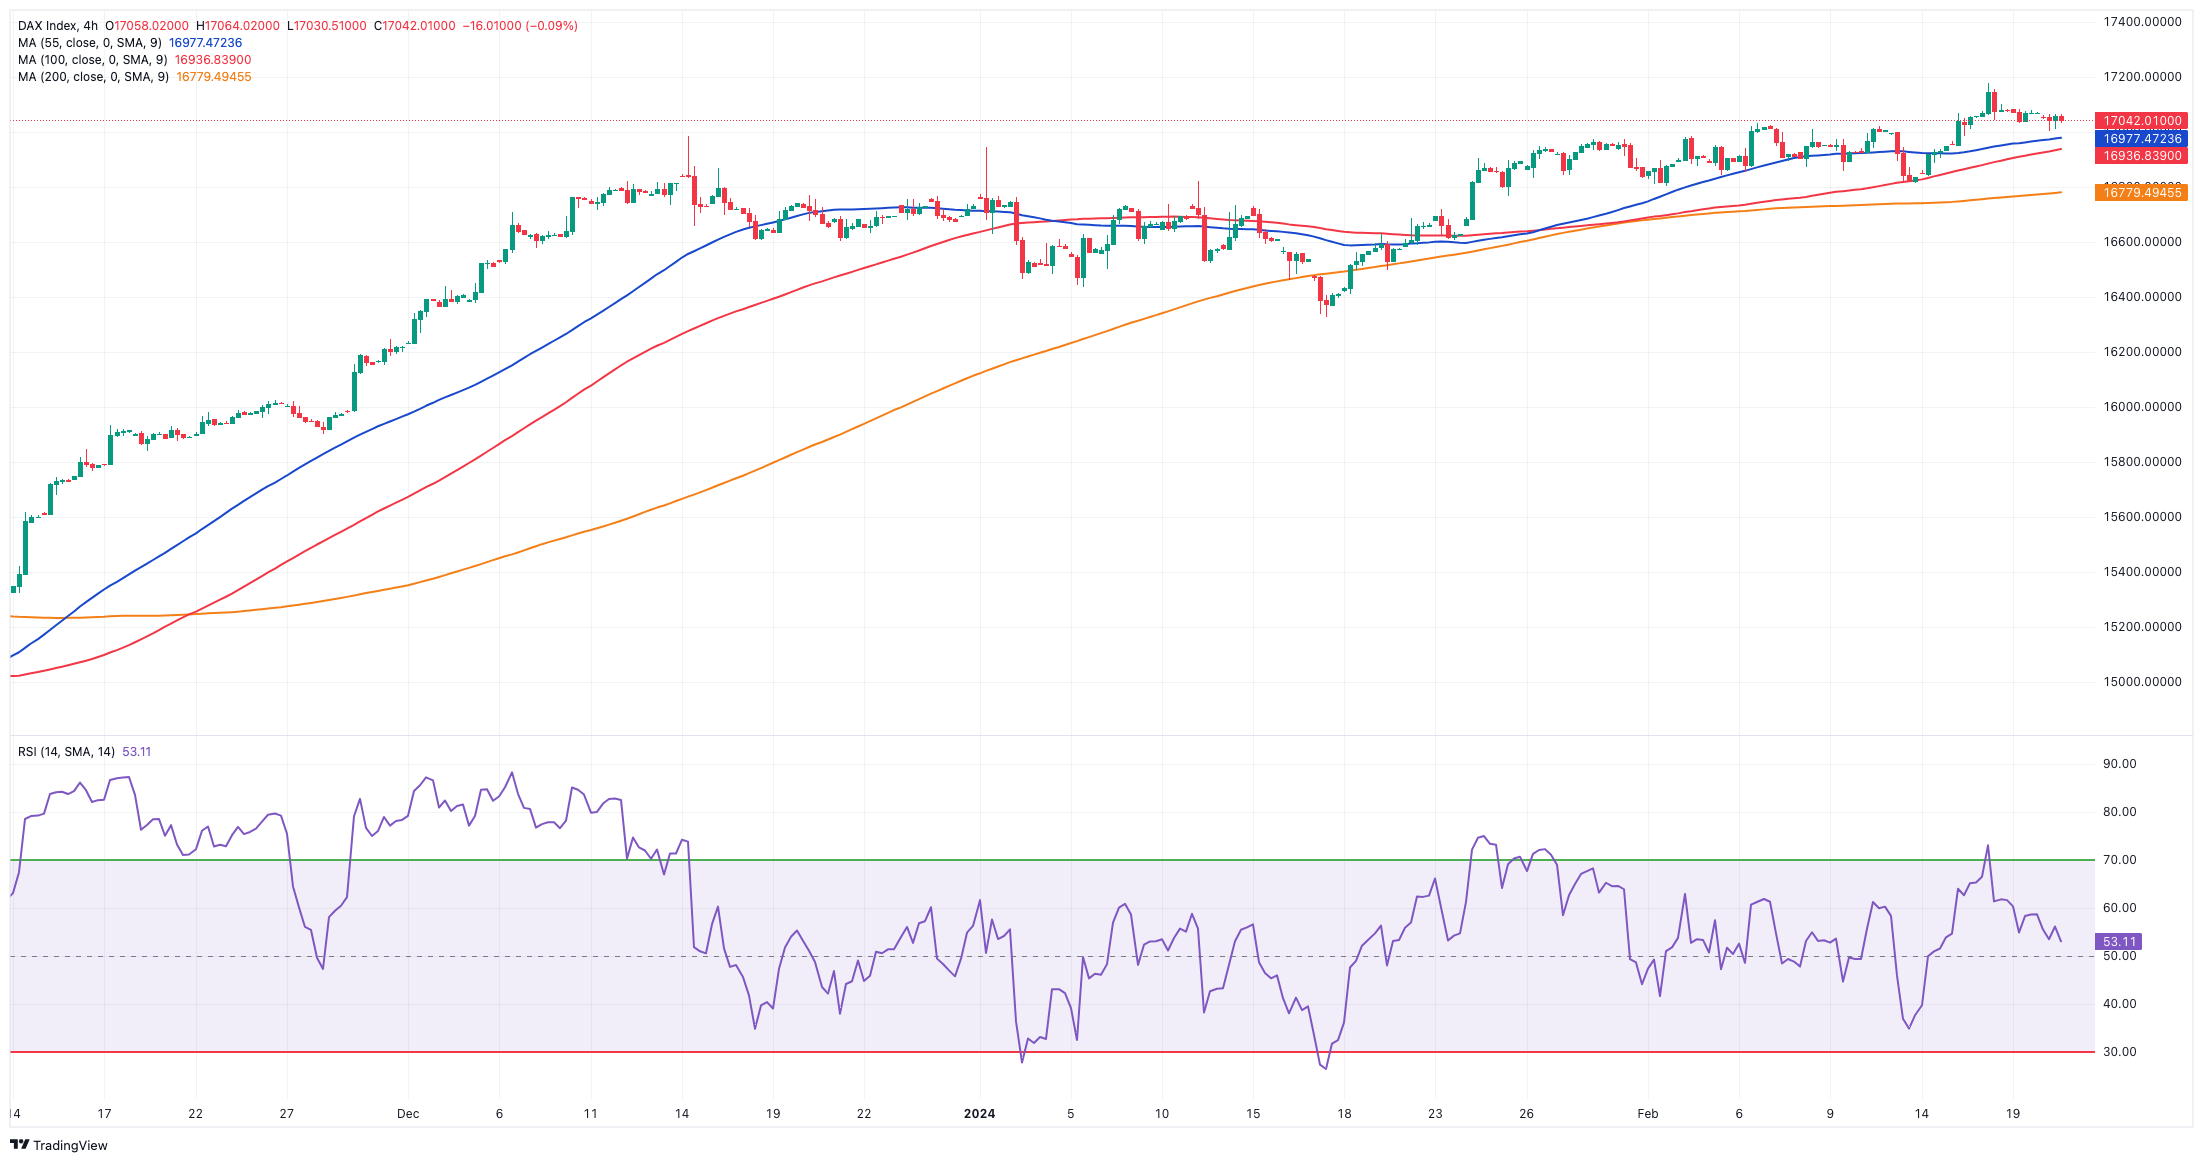
The German stock benchmark DAX40 gave away part of Monday’s gains and receded modestly on Tuesday, closing the session just above the 17,000 mark.
In fact, equities on the old continent traded in a mixed tone despite the prevailing risk-on sentiment, which was further bolstered by the likelihood of extra stimulus in China, all after the PBoC reduced its 5-Year LPR more than initially estimated.
Furthermore, market participants remained focused on evaluating the concerning prospects of the German economy, all after the Bundesbank indicated on Monday that the country is currently facing a recession attributed to sluggish external demand and subdued consumer spending.
Meanwhile, in the German money market, 10-year bund yields retreated below 2.40% after three consecutive sessions of gains.
The DAX40's next upward barrier is its all-time high of 17,198 (February 16). The other way around, the February low of 16,821 (February 1) gives immediate support, and appears propped up by the transitory 55-day SMA at 16,766. The loss of this region could put a test of the 2024 bottom at 16,345 (January 17) back on the radar ahead of After the 200-day SMA at 16,019. A deeper pullback could revisit the weekly low of 15,915 (November 28) followed by the October 2023 low of 14,630 (October 23) and the March 2023 low of 14,458 (March 20). The daily RSI eased below 60.
Best Performers: Heidelbergcement, Beiersdorf AG, Covestro
Worst Performers: Siemens Energy AG, Fresenius SE, Porsche
Resistance levels: 17,198 (4H chart)
Support levels: 16,831 16,618 16,345 (4H chart)
GBPJPY
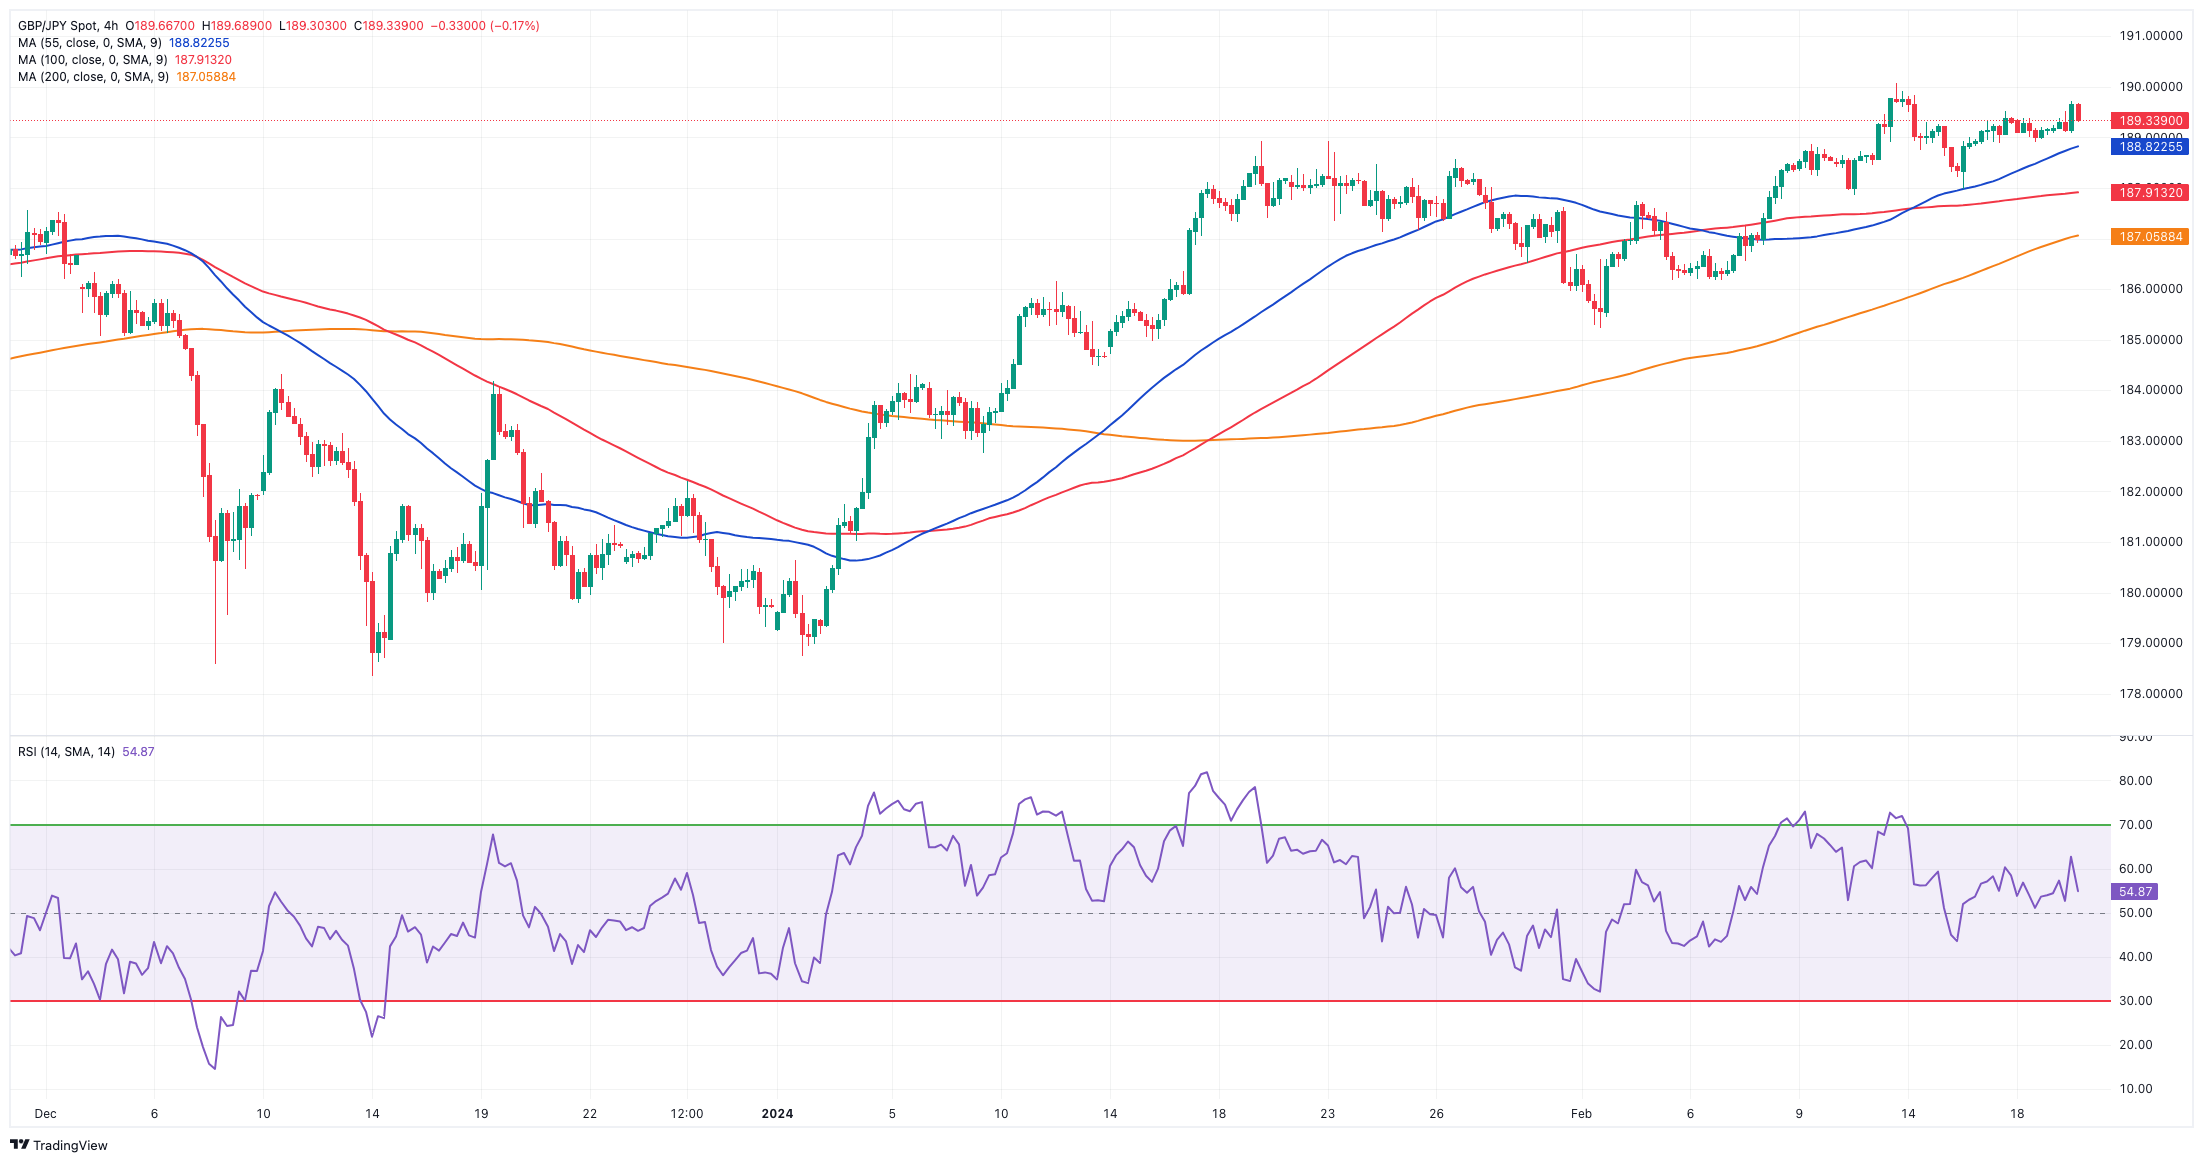
GBP/JPY extended its erratic performance on Tuesday, setting aside the negative start of the week and revisiting the upper 189.00s.
The daily uptick in the cross, however, failed to retest or surpass the key 190.00 milestone despite the increasing buying interest in the British pound and the dominating risk-on mood.
The next objective for GBP/JPY is the 2024 high of 190.08 (February 13), which precedes the August 2015 record of 195.28. If bears retake control, spot might initially drop to its February low of 185.22 (February 1) before the intermediate support at the 55-day and 100-day SMAs of 185.10 and 184.71, respectively. South from here emerges the more critical 200-day SMA at 182.69, ahead of the December 2023 bottom of 178.33 (December 14) and the October 2023 low of 178.03 (October 3). A further decrease might provide a challenge to the July 2023 low of 176.30, which is ahead of the May 2023 low of 167.84 (May 11). The daily RSI rose above 63.
Resistance levels: 189.72 190.08 195.28 (4H chart)
Support levels: 187.99 186.18 185.22 (4H chart)
NASDAQ
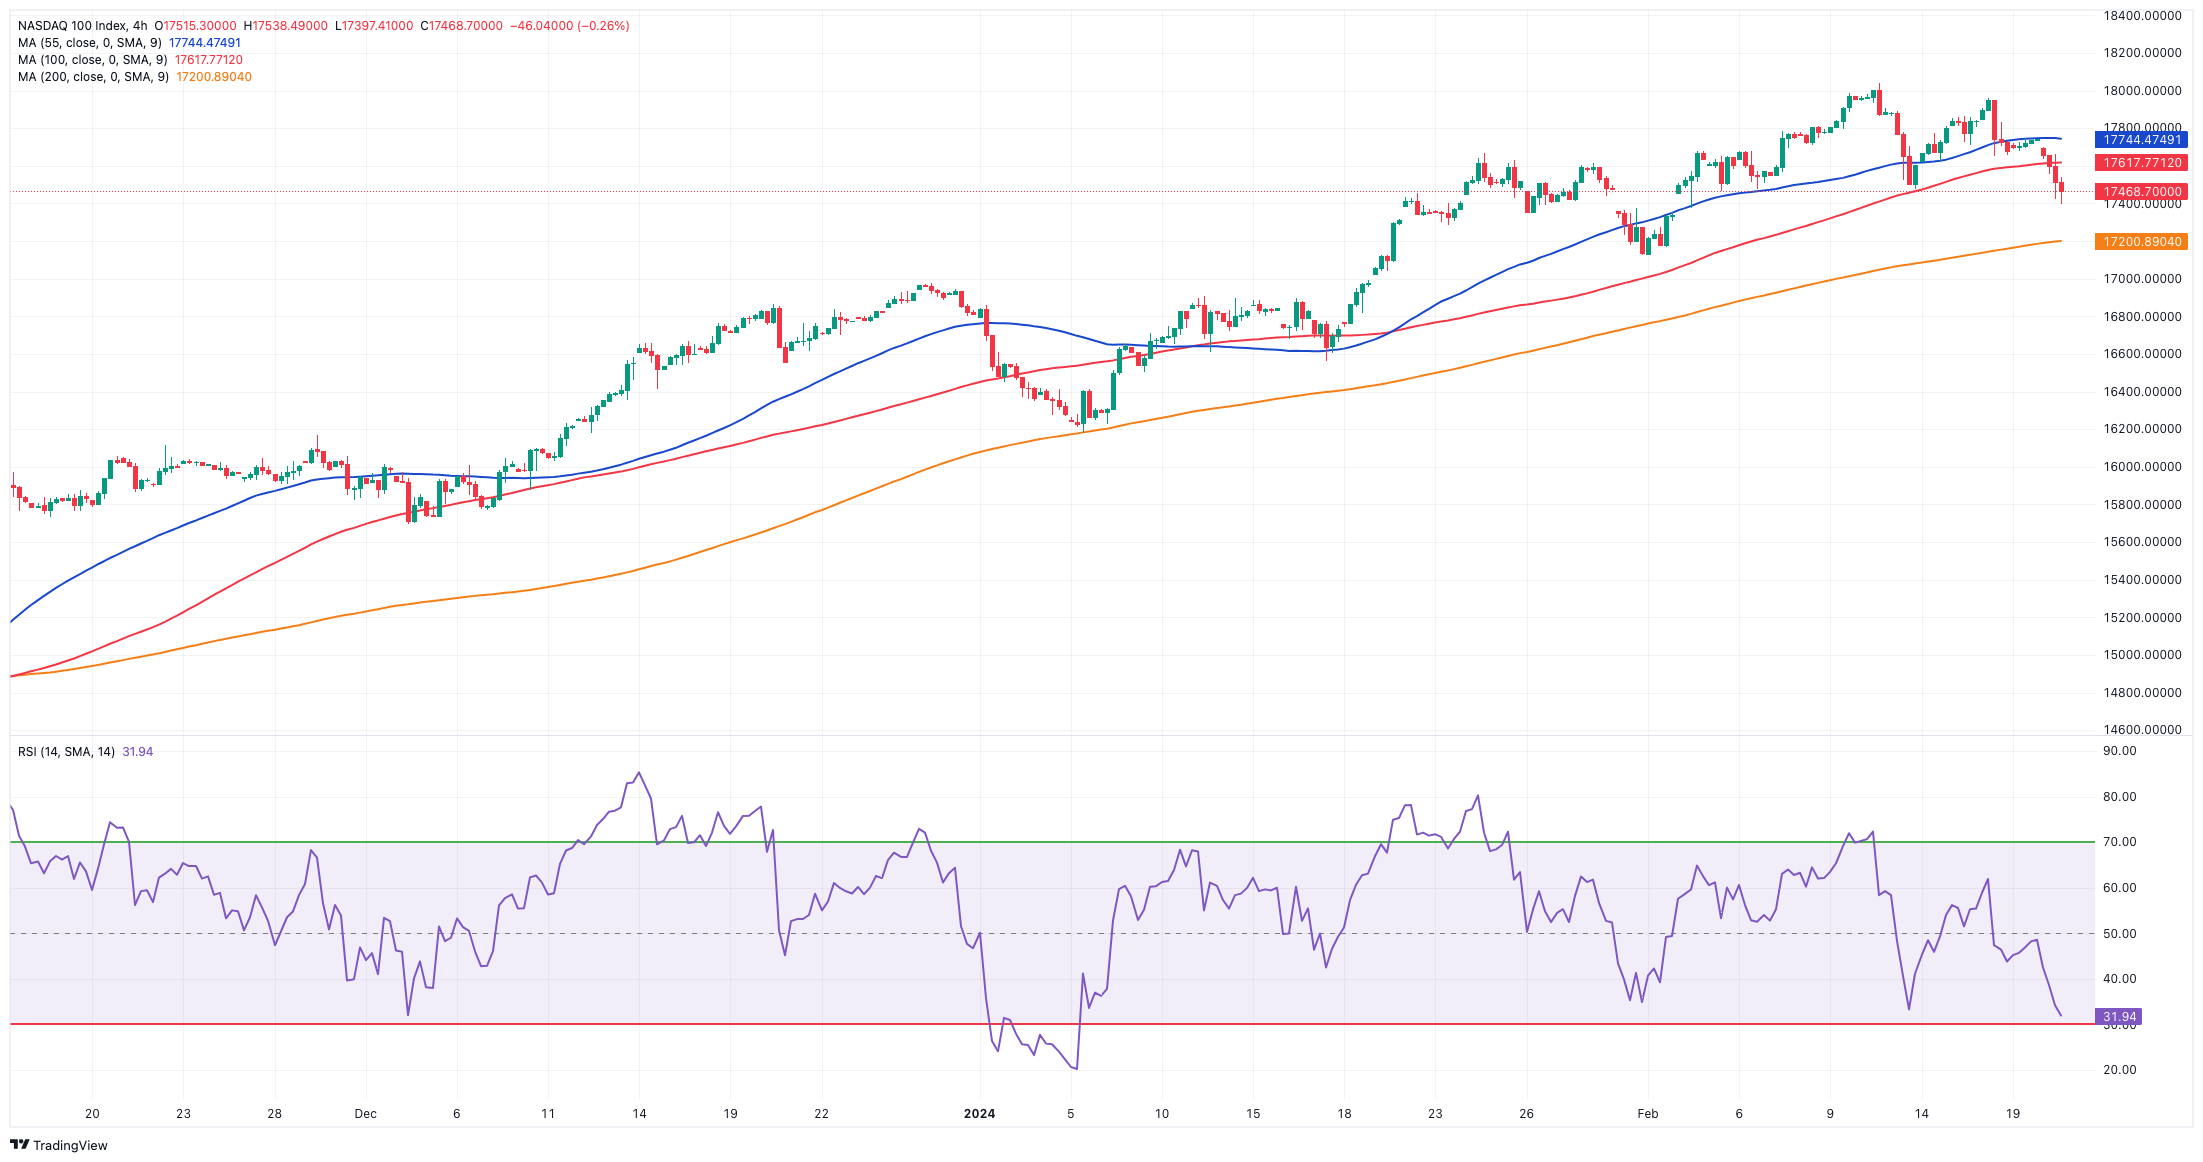
The tech benchmark Nasdaq 100 added to Friday’s downtick and dropped to multi-session lows on Tuesday as US markets returned to their daily activity following Monday’s holiday.
Tuesday’s negative price action in the tech sector came on the back of rising expectations ahead of the release of chip marker NVIDIA’s earnings report (due on February 21), while the likelihood that the Fed might start trimming its interest rates later than currently priced in by markets also weighed on the sentiment.
At the moment, there is around a 52% probability of a rate cut at the June 12 meeting, according to the FedWatch Tool by CME Group.
A deeper correction could see the Nasdaq 100 retesting the weekly low of 17,128 (January 31), which comes before the interim 55-day SMA of 16,935 and the 2024 low of 16,249 (January 5). If the index falls below this level, it might hit the December 2023 low of 15,695 (December 4) prior to the key 200-day SMA of 15,484. A breach of this level may prompt a potential drop to the October 2023 low of 14,058 (October 26) to emerge on the horizon before the April 2023 low of 12,724 (April 25), the March 2023 low of 11,695 (March 13), and the 2023 low of 10,696 (January 3). Conversely, occasional bullish attempts continue to aim for a new record high of 18,041 (February 12). The day-to-day RSI retreated to the proximity of the 50 threshold.
Top Gainers: Kraft Heinz, Dollar Tree, Warner Bros Discovery
Top Losers: The Trade Desk, Applied Materials, MongoDB
Resistance levels: 18,041 (4H chart)
Support levels: 17,404 17,128 16,561 (4H chart)
All Information & Updates provided by:

All information relating to the financial markets available on this page has been prepared and issued by FXStreet (Forexstreet SL, Spain, Reg: B62498233) on the basis of publicly available information and all information believed to be reliable and does not conflict with Kuwaiti local laws, and all necessary care has been taken to before the company to ensure that the facts mentioned are correct from the source.
NCM Investment nor any of its directors or employees shall in any way be held responsible for the contents of this news, and the information contained on this page is intended only to provide clients with publicly available information and should not be construed as investment advice, report or analysis and/or constitute an offer or invitation to buy or sell financial instruments of any kind.
RISK WARNING: Forex and CFDs are highly risky leveraged products, as losses can exceed deposits. Please ensure you understand all the risks and take independent advice if necessary. NCM will segregate the clients based on the criteria of the regulator and its bylaws. NCM does not provide any advisory service; the material published does not constitute advice or a recommendation for a transaction in any financial instrument. NCM accepts no responsibility for any use of the content presented and any consequences of that use. Anyone acting on the information provided does so at their own risk.