
- Contact Us:
-

-

-

-


Daily Market Updates
22 Feb 2024
EURUSD
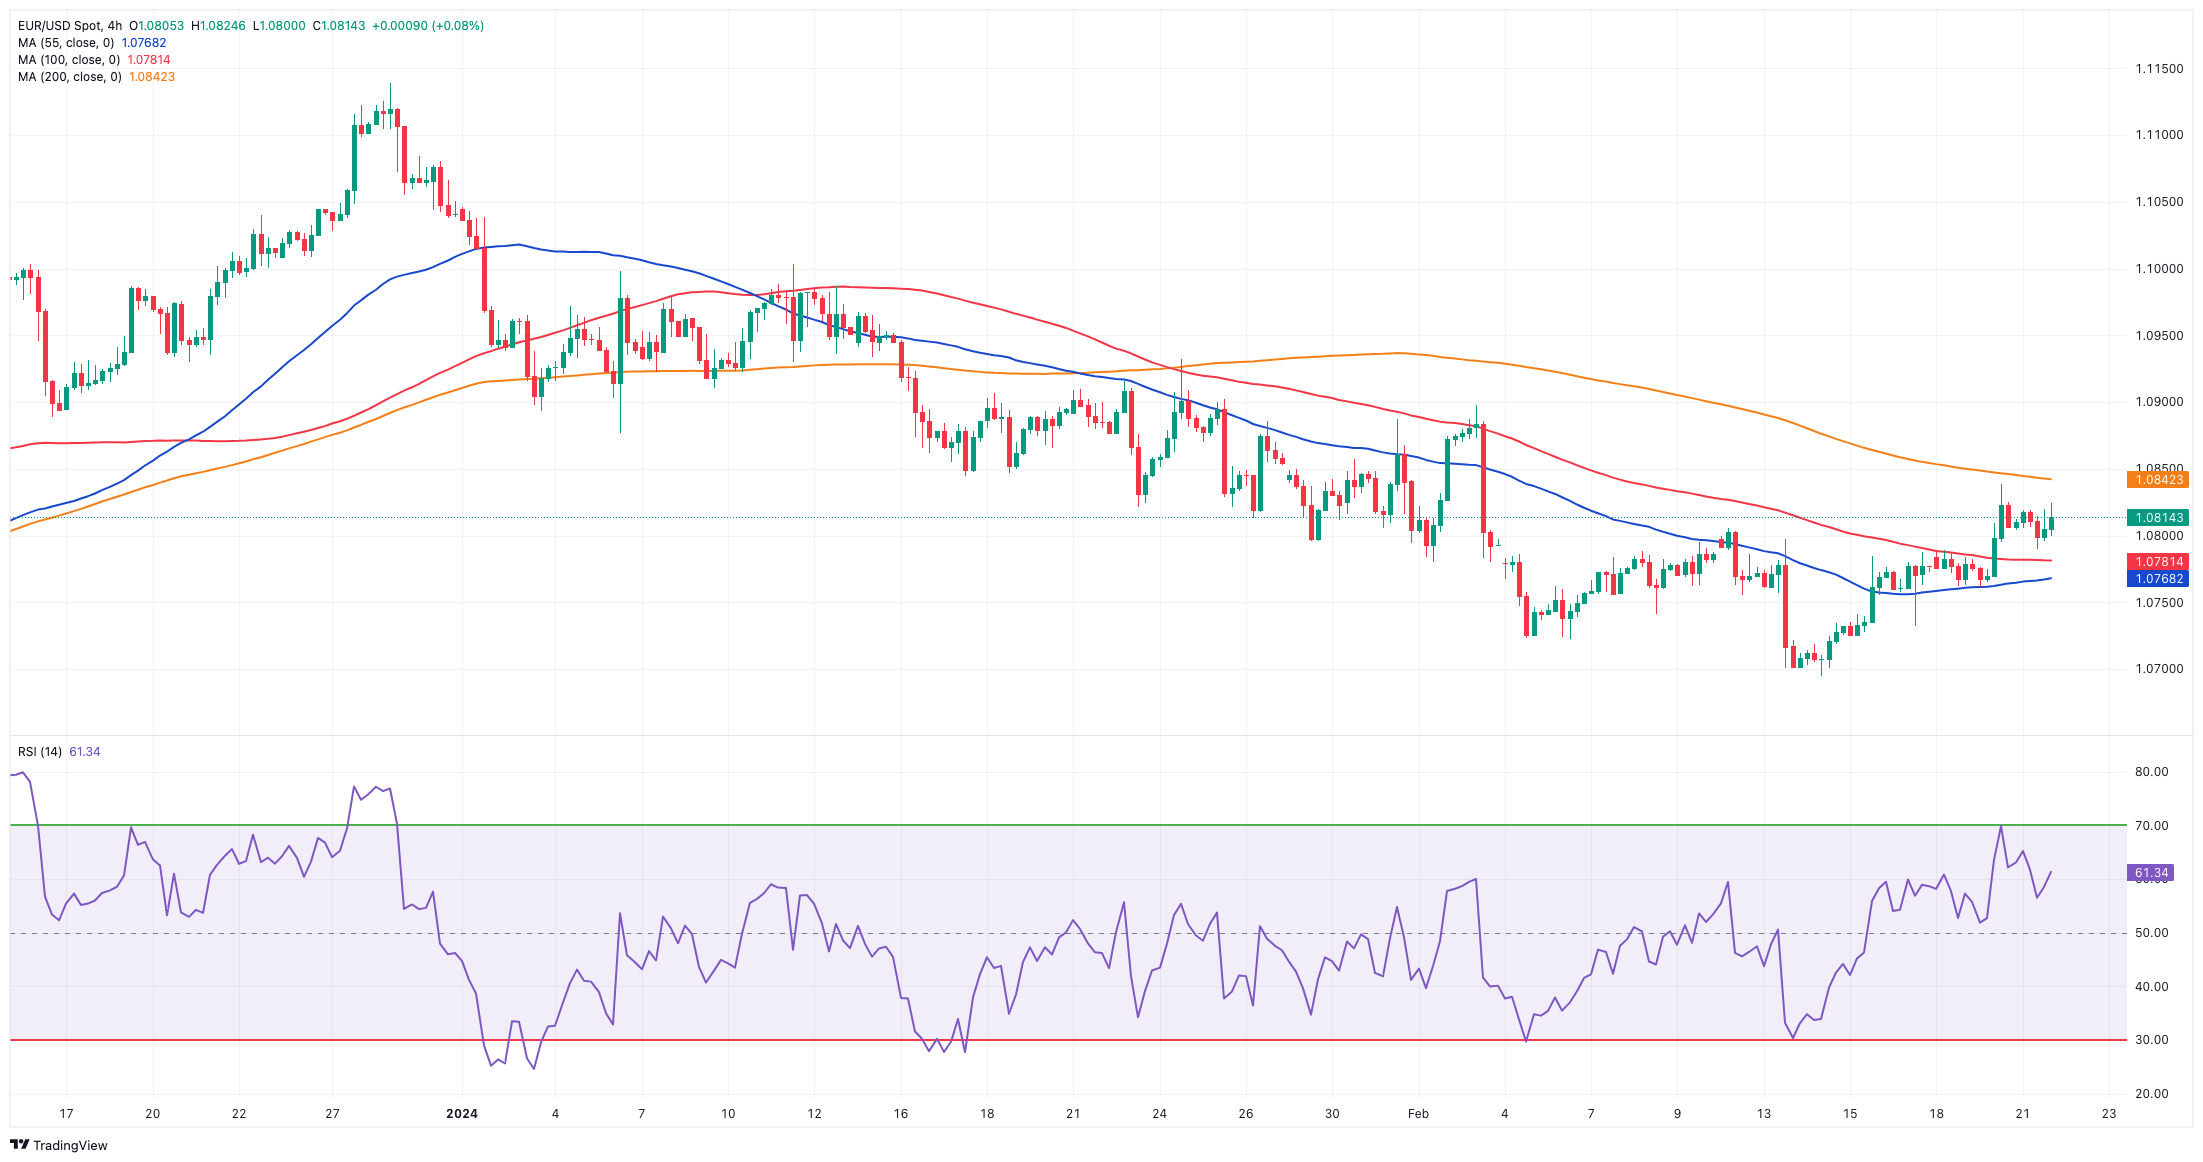
Another soft price action in the greenback gave extra legs to EUR/USD, which tested the 1.0820 region on Wednesday, adding to gains seen in the previous session.
On the flip side, the USD Index (DXY) challenged once again the 104.00 region amidst an inconclusive day in US yields across the curve and the broad-based lack of direction in the global markets.
The salient event of the day was the release of the FOMC Minutes, where staff members considered the possibility that achieving further reductions in inflation might require more time than initially anticipated. The staff's economic forecast was marginally more optimistic compared to the December projection. Policymakers, on the whole, indicated a reluctance to decrease the funds rate until they were more assured of inflation making sustainable progress toward the 2% target. Several officials observed the potential for a slowdown in the progress of inflation.
In addition, FOMC Barkin (Richmond) noted that while US inflation and employment data are generally positive, recent figures on the CPI and PPI show less favourable results, suggesting a reliance on goods for disinflation. He emphasized the need for a smooth economic transition.
In the US, Mortgage Applications contracted by 10.6% in the week to February 16.
In the euro calendar, Consumer Confidence in the region, as gauged by the European Commission (EC), improved slightly to -15.5 in February.
EUR/USD continues to flirt with the crucial 200-day SMA at 1.0826. The surpass of this region could pave the way for more rises in the short term. However, there is an immediate obstacle at the temporary 55-day SMA at 1.0881 prior to the weekly highs of 1.0932 (January 24) and 1.0998 (January 5, 11). The breakout of this area reveals the December 2023 top of 1.1139 (December 27), which is supported by the 200-week SMA of 1.1148 and comes before the 2023 peak of 1.1275 (July 18). In the other direction, the 2024 low of 1.0694 (February 14) comes next, then the weekly low of 1.0495 (October 13, 2023), the 2023 low of 1.0448 (October 3), and the round level of 1.0400. The daily RSI edged slightly higher to the proximity of 50.
Resistance levels: 1.0838 1.0845 1.0932 (4H chart)
Support levels: 1.0732 1.0694 1.0656 (4H chart)
USDJPY
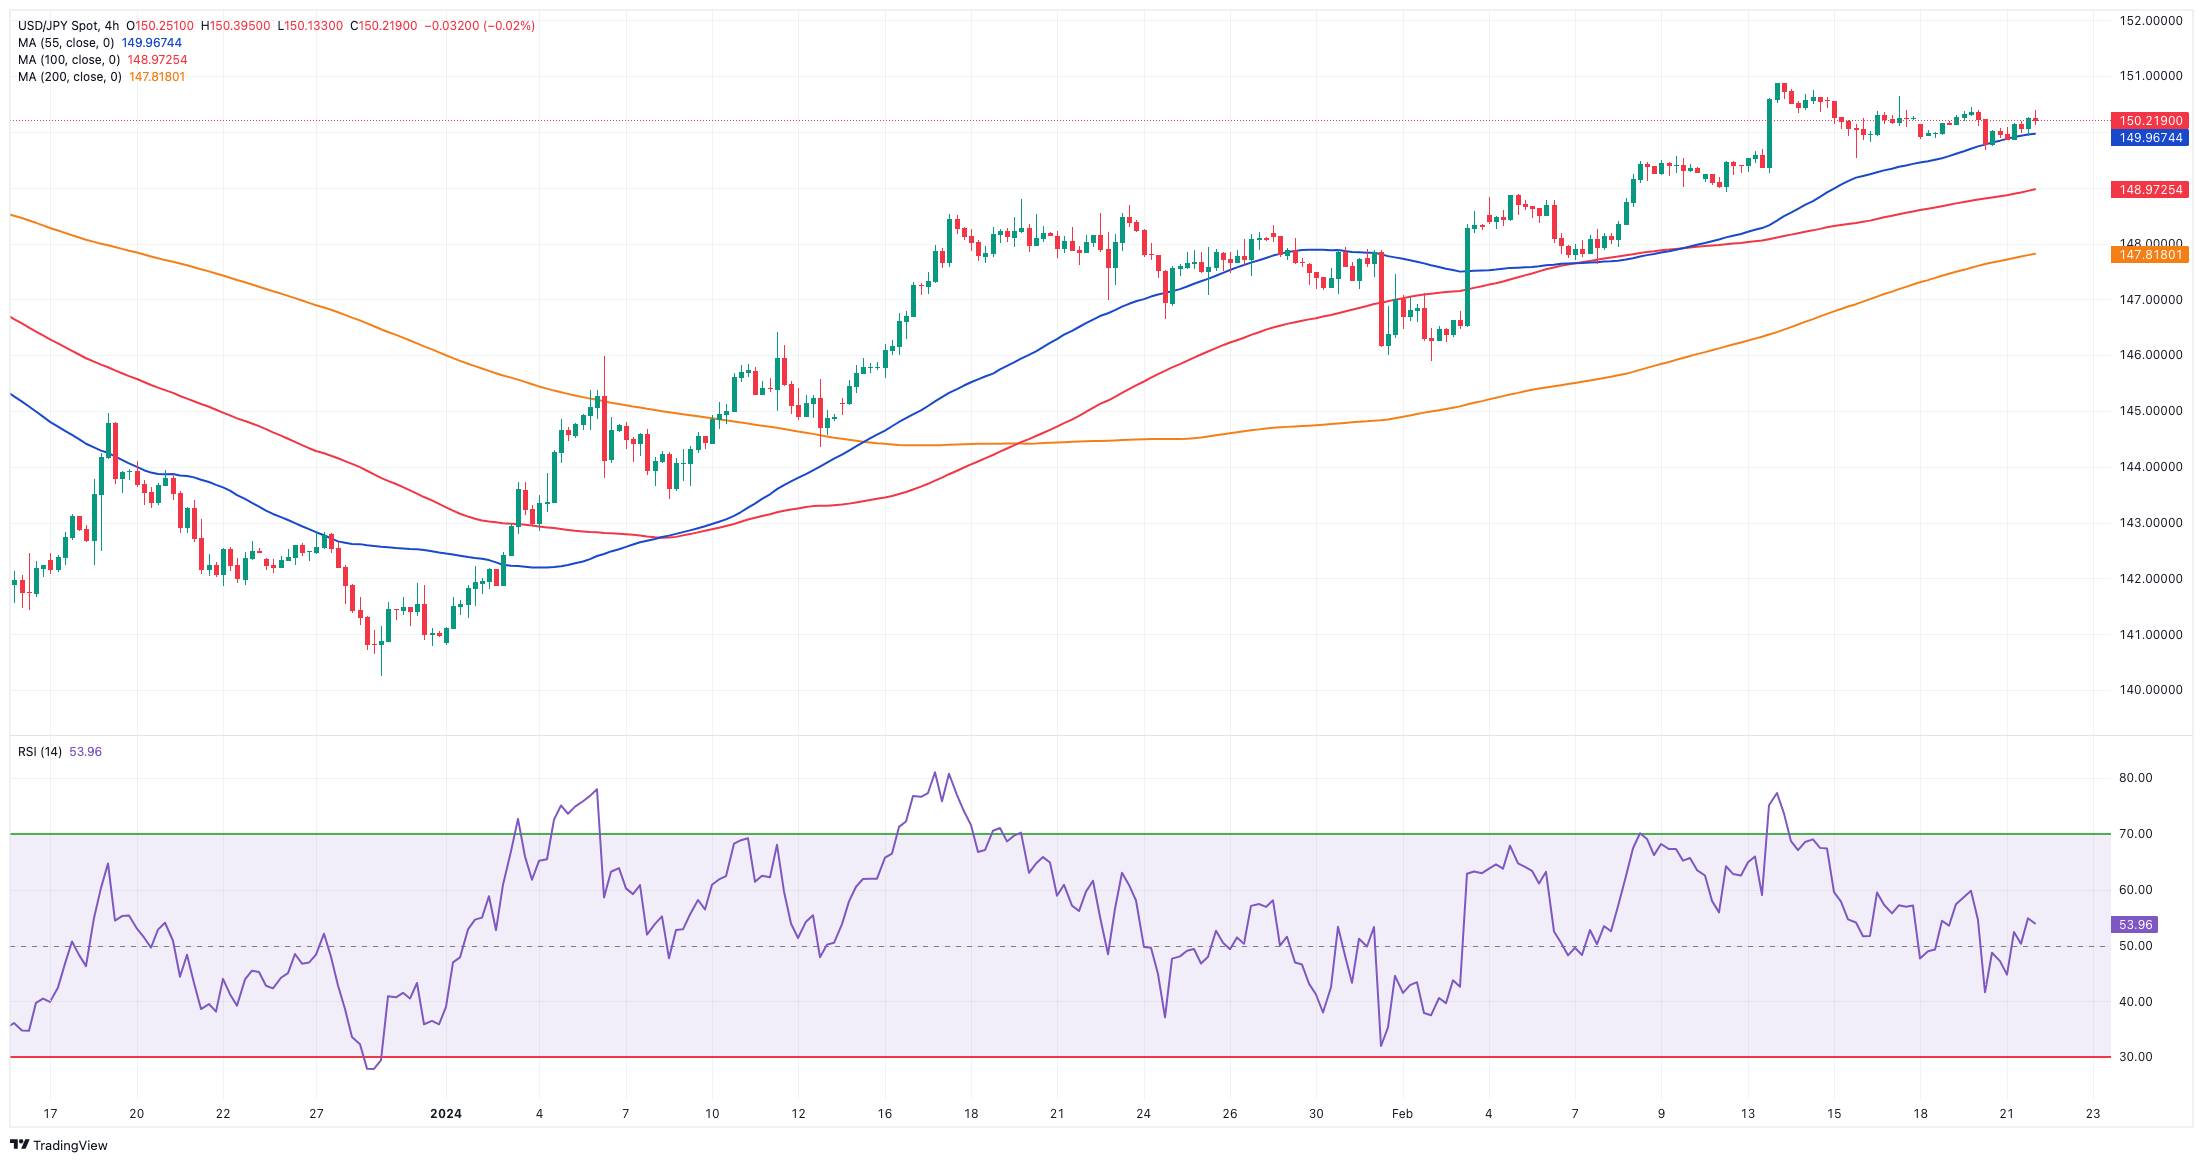
USD/JPY set aside two consecutive sessions of losses and regained the area beyond the key 150.00 barrier on Wednesday.
The renewed optimism in the pair came on the back of the mild advance in the greenback along with a decent bounce in US yields across different timeframes.
On the domestic front, according to the government's monthly report for February, the economy is showing signs of moderate recovery, but certain sectors are experiencing sluggishness. The Cabinet Office has lowered its assessment of production due to manufacturing weakness and private consumption due to household spending weakness. This indicates that the weakness observed in Q3 and Q4 may extend into Q1. These developments pose a challenge for the BoJ as it deliberates on the timing of potential interest rate hikes this year. Currently, the market consensus points to June as the probable timeframe for such a move.
In the meantime, the Reuters Tankan Index worsened to -1 in February, and the trade deficit shrank less than estimated by ¥1758.3B in January.
If bulls regain the lead, USD/JPY might hit its 2024 high of 150.88 (February 13), ahead of the 2023 top of 151.90 (November 13). Further north, the 2022 peak of 151.94 (October 21) is closely followed by the round figure of 152.00. On the contrary, the 100-day SMA should give temporary support at 147.63, ahead of the February low of 145.89 (February 1), which is still supported by the preliminary 55-day SMA. The key 200-day SMA at 145.51 precedes the December 2023 low of 140.24 (December 28), the round number of 140.00, and the July low of 137.23 (July 14). The daily RSI surpassed the 64 level.
Resistance levels: 150.88 151.43 151.90 (4H chart)
Support levels: 149.50 148.92 147.61 (4H chart)
GBPUSD
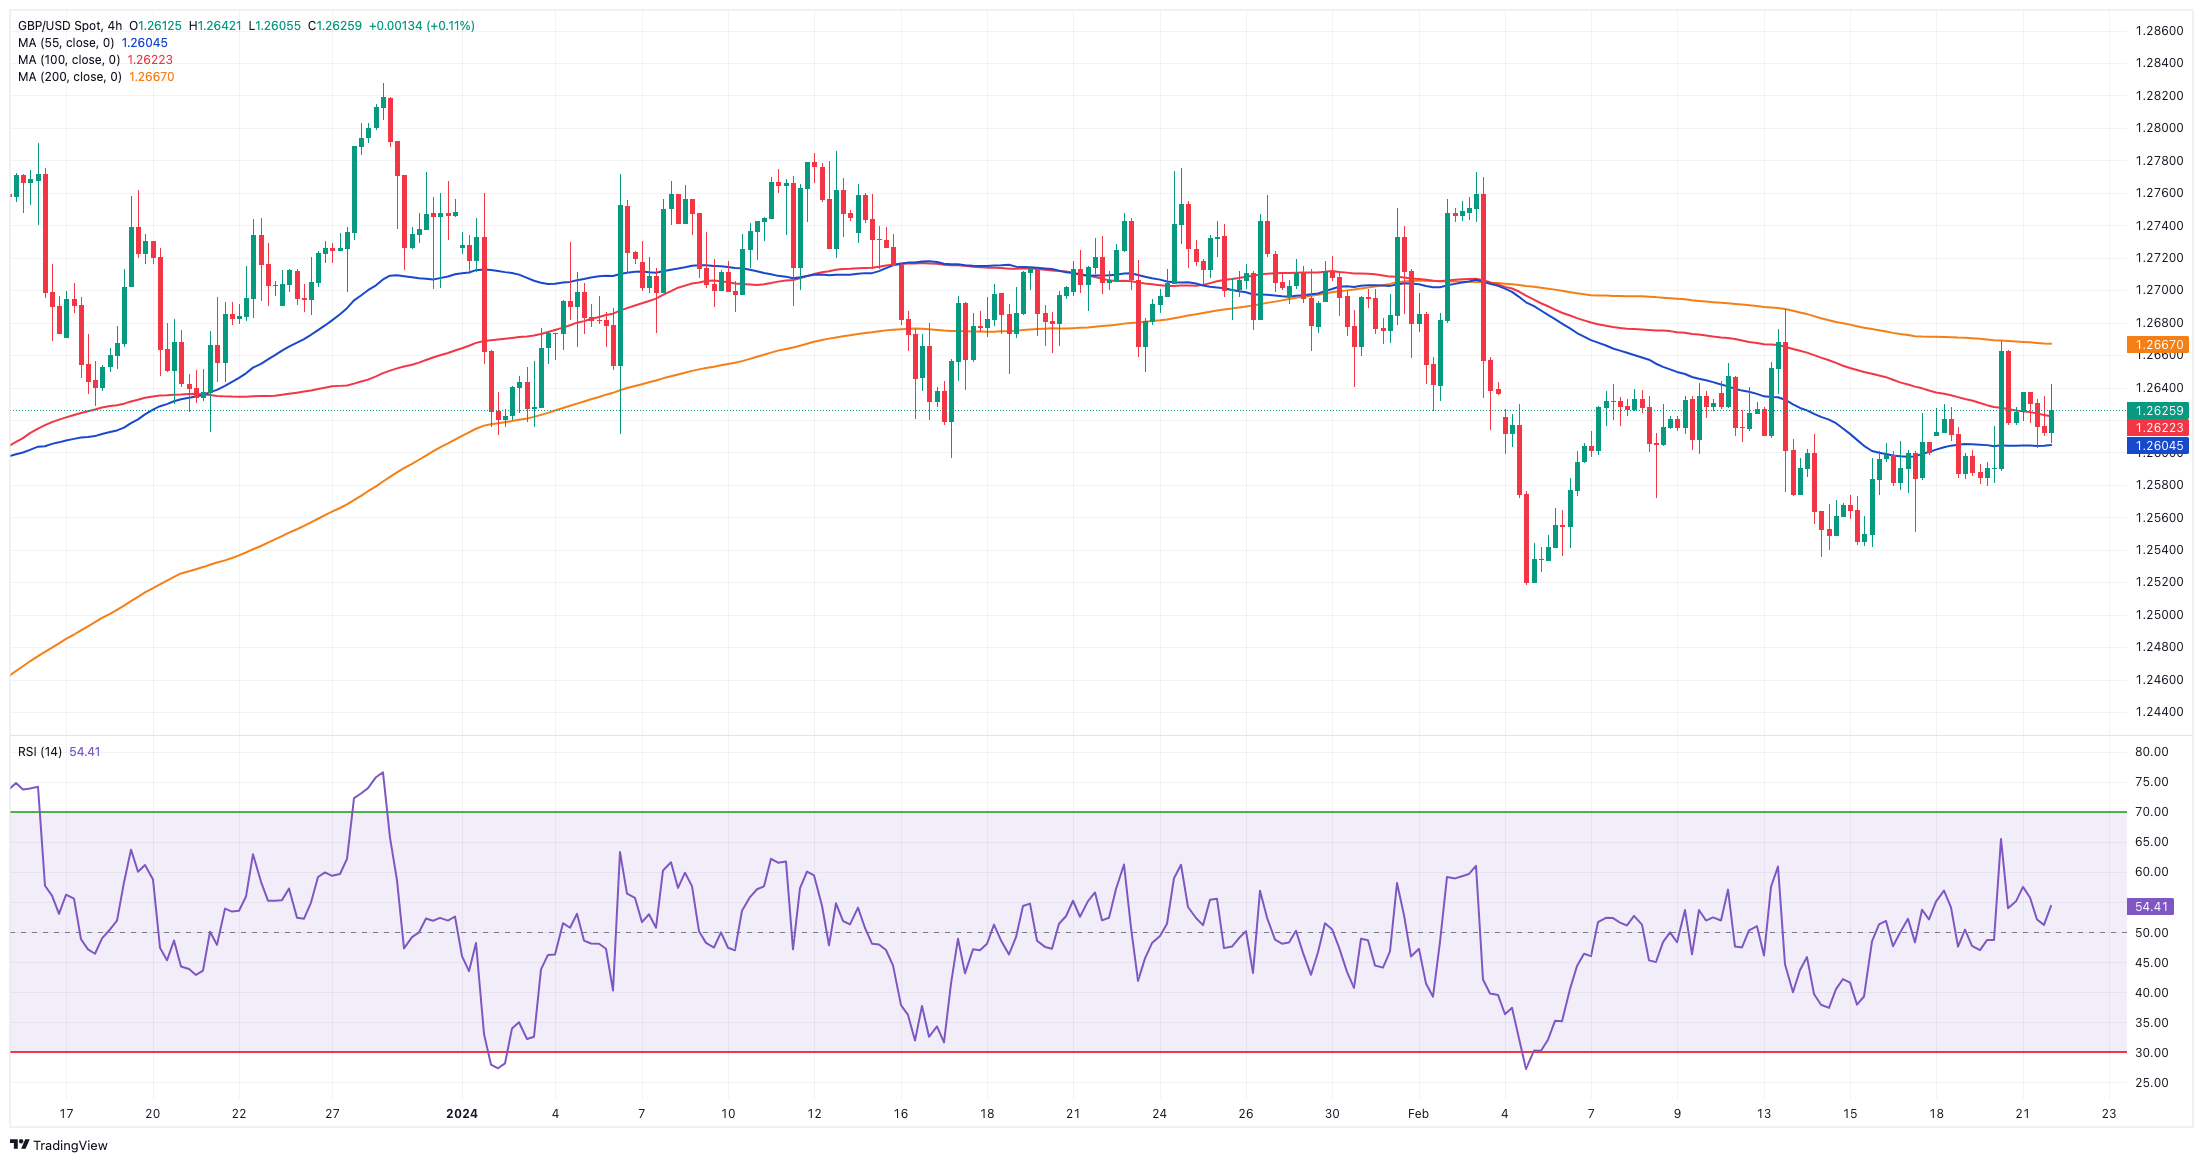
GBP/USD traded in an inconclusive manner around 1.2620 following the equally vacillating developments around the dollar on Wednesday.
Indeed, Cable mirrored the performance of its risk-associated peers and navigated in a narrow range with a decent contention zone around the 1.2600 neighbourhood.
On another front, BoE MPC S. Dhingra emphasized that excessive tightening policies frequently result in harsh economic downturns and long-term damage to supply capabilities. In the UK, consumer spending still lags behind pre-pandemic levels, presenting a notable disparity compared to the Eurozone and the United States. He added that the forecast for headline inflation seems uncertain but tends towards a downward trajectory.
Still around the BoE, investors expect the bank to reduce its policy rate at some point in the summer.
In the UK, Public Sector Net Borrowing rose by £17.62B in January.
Further rises in the GBP/USD target the weekly high at 1.2683, ahead of the February top of 1.2772 (February 2) and the 2024 peak at 1.2785 (January 12). The latter's breakout might lead to a test of the December high of 1.2827 (December 28), followed by the weekly top of 1.2995 (July 27, 2023), and the key 1.3000 yardstick. On the downside, the initial target is the 2024 low of 1.2518 (February 5), seconded by the December 2023 low of 1.2500 (December 13), both supported by the intermediate 100-day SMA at 1.2509. Additional weakness may prompt spot to transfer its emphasis to the weekly bottom of 1.2187 (November 10, 2023), before the October 2023 low of 1.2037 (October 3), and the critical 1.2000 level, all prior to the 2023 low of 1.1802 (March 8). The day-to-day RMA eased to the 47 area.
Resistance levels: 1.2668 1.2683 1.2772 (4H chart)
Support levels: 1.2518 1.2500 1.2448 (4H chart)
GOLD
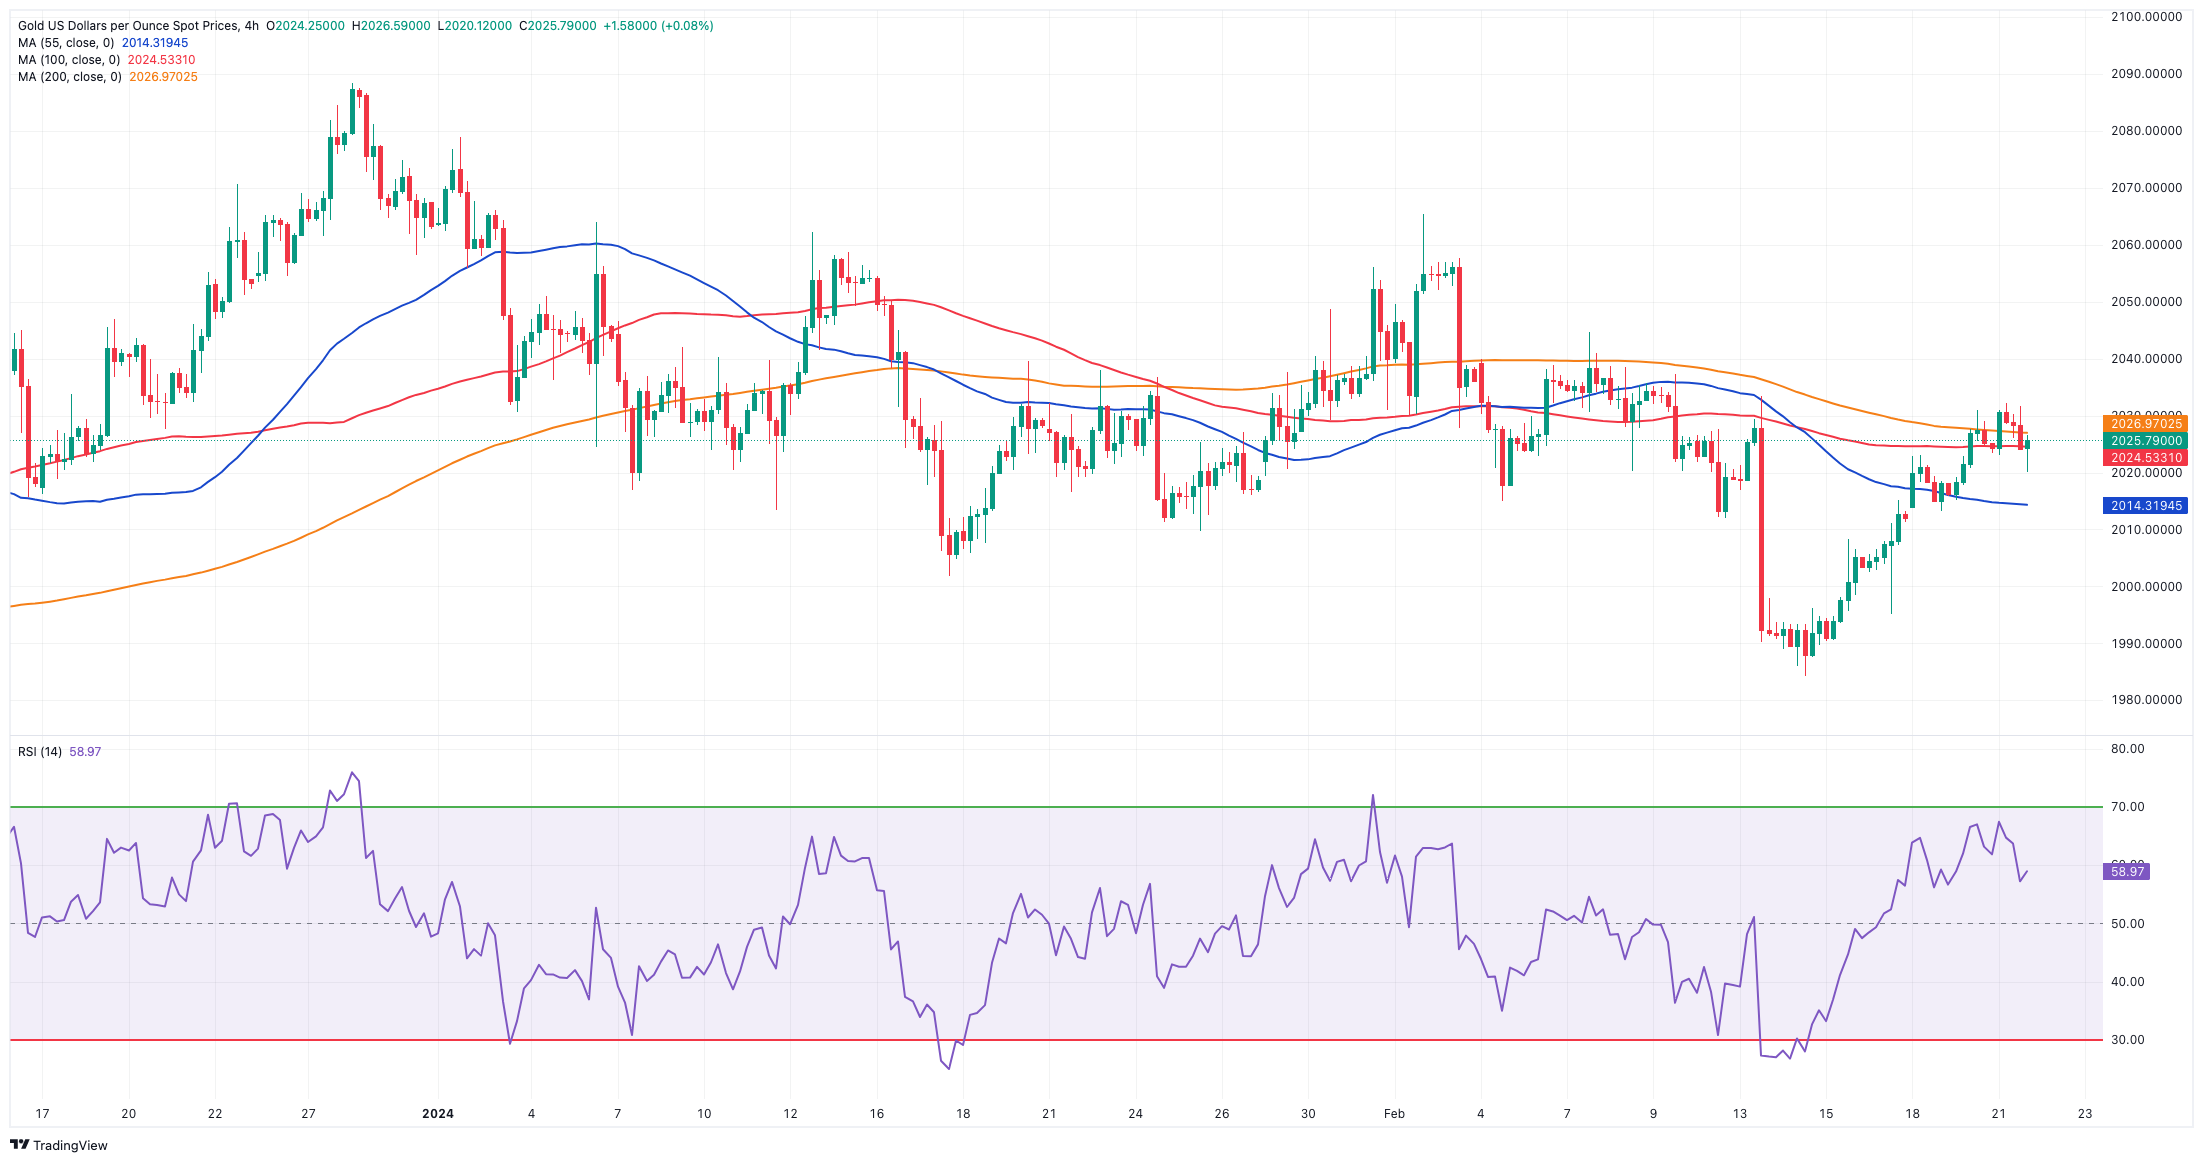
Gold prices traded in an irresolute fashion around the $2,030 zone on Wednesday.
The directionless performance of the precious metal followed marginal losses in the greenback and a move higher in US yields across different maturities, all after the FOMC Minutes failed to surprise market participants.
Looking ahead, there is an anticipation that the precious metal will be closely observed in the upcoming weeks as speculation grows regarding the possibility of the Federal Reserve delaying the implementation of its easing measures until its June meeting.
Extra bounce might push Gold back to its February peak of $2,065 (February 1), ahead of the weekly high of $2,088 (December 28) and all-time top of $2,150 (December 4, 2023). On the flip side, the initial downside target is the 2024 low of $1,984 (February 14), followed by the December 2023 low of $1,973, which is supported by the close closeness to the critical 200-day SMA at $1,965. A further slide might refocus attention on the November 2023 bottom of $1,931, ahead of the October 2023 low of $1,810, the 2023 low of $1,804, and the $1,800 contention zone.
Resistance levels: $2,032 $2,044 $2,065 (4H chart)
Support levels: $1,984 $1,973 $1,965 (4H chart)
CRUDE WTI
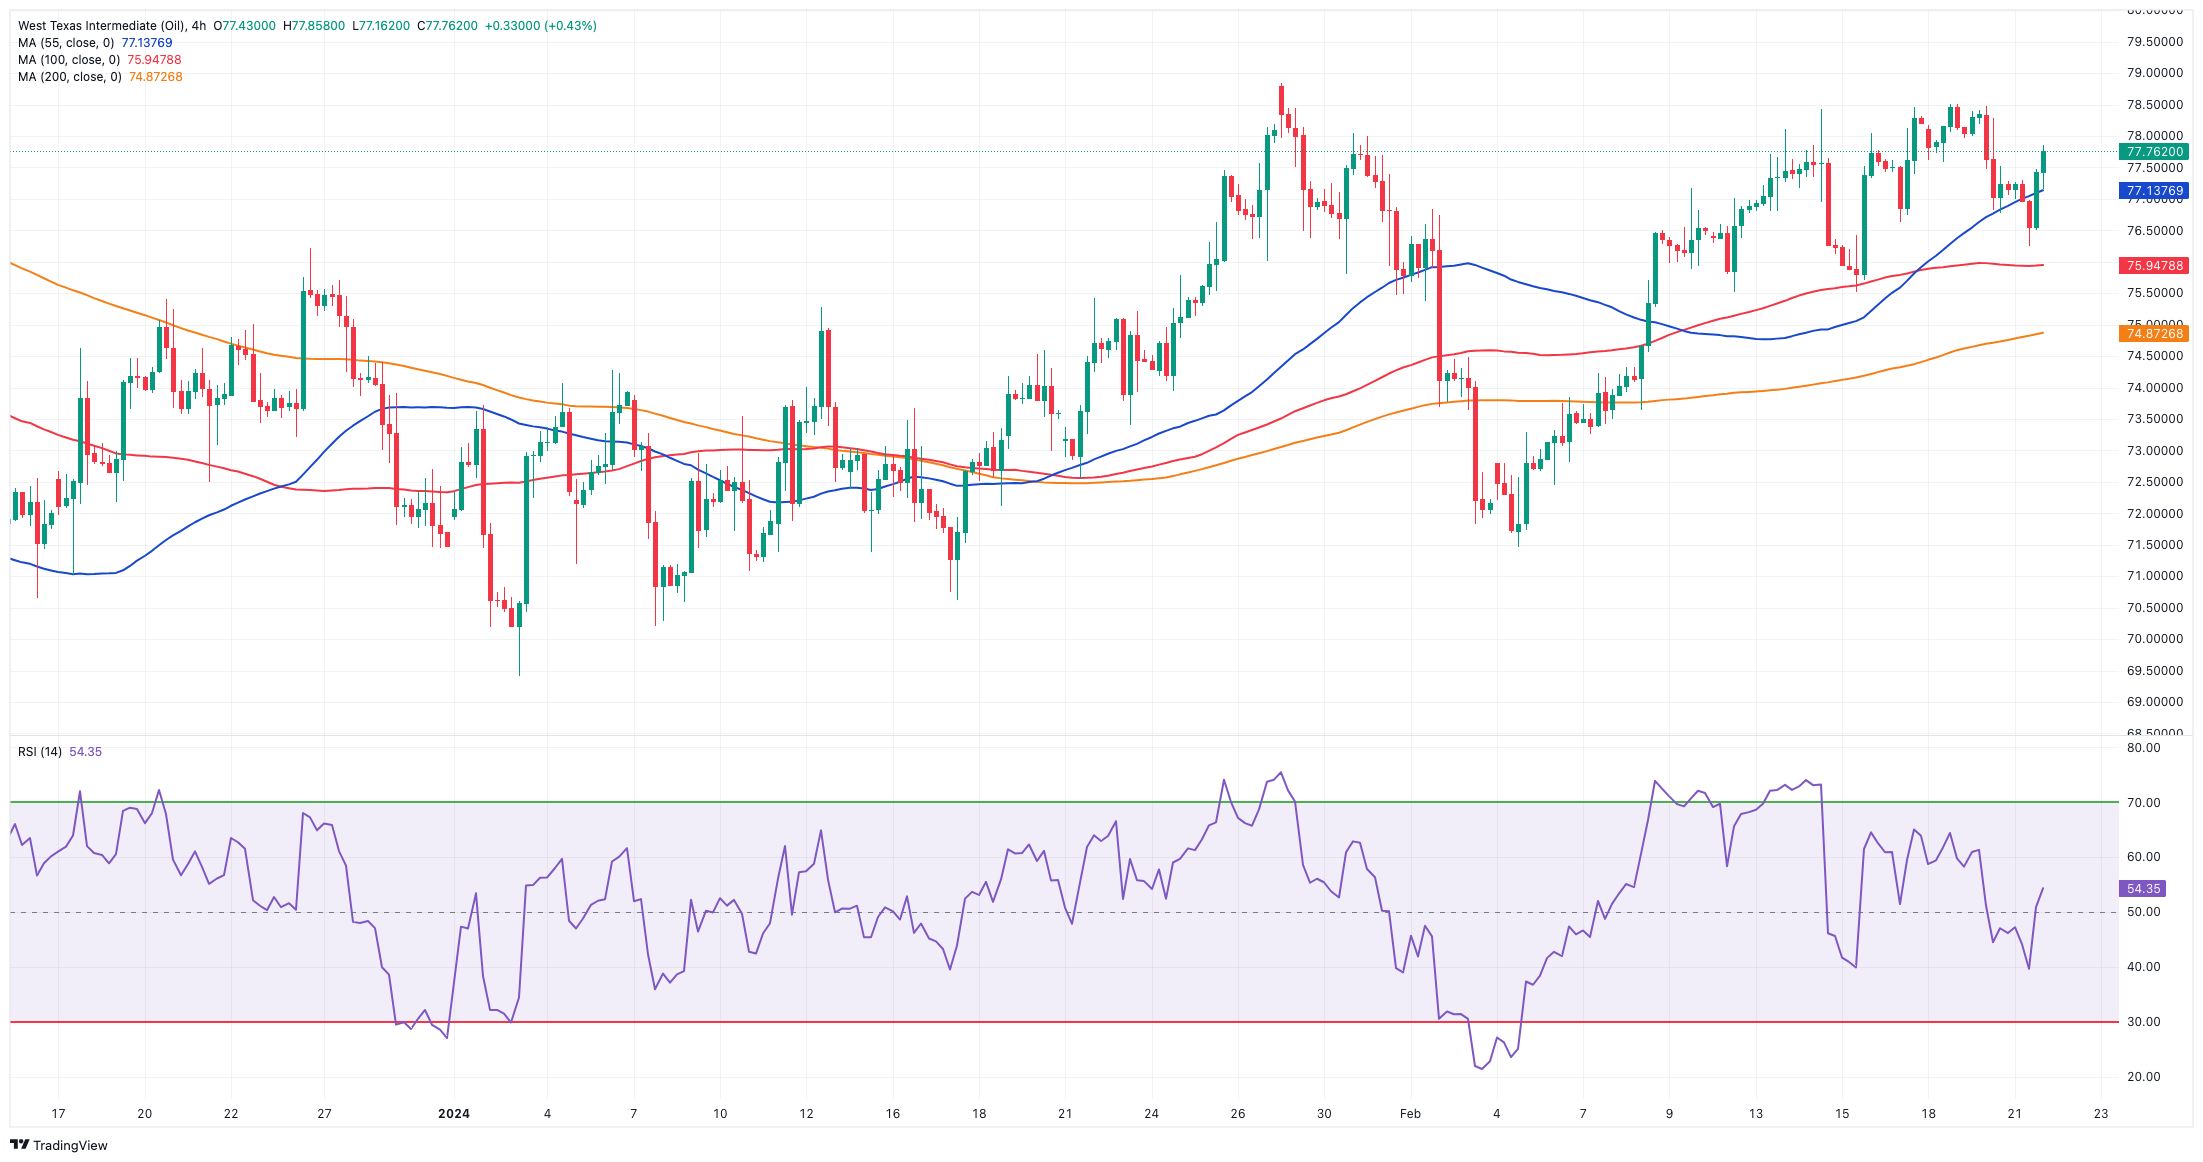
Crude oil prices regained upside traction and quickly left behind Tuesday’s pullback, advancing to the boundaries of the $78.00 mark per barrel midweek.
The resurgence of buying pressure in the commodity followed rising concerns over the tightness of the market, while geopolitical jitters from the Middle East and the Red Sea also underpinned the upside bias in WTI.
The next up-barrier for WTI is the February high of $78.44, which comes ahead of the 2024 top of $79.25 (January 29) and the important $80.00 barrier, all before the November 2023 peak of $80.15 (November 3). Extra gains from here may propel the commodity back to its weekly high of $89.83 (October 18, 2023), ahead of the 2023 top of $94.99 (September 28, 2023), the August 2022 peak of $97.65 (August 30), and the psychological $100.00 mark. In contrast, the loss of the February low of $71.43 (February 5) may bring the critical $70.00 barrier back into play, followed by the 2024 bottom of $69.31 (January 3).
Resistance levels: $78.74 $79.25 $79.56 (4H chart)
Support levels: $76.29 $75.49 $74.69 (4H chart)
GER40
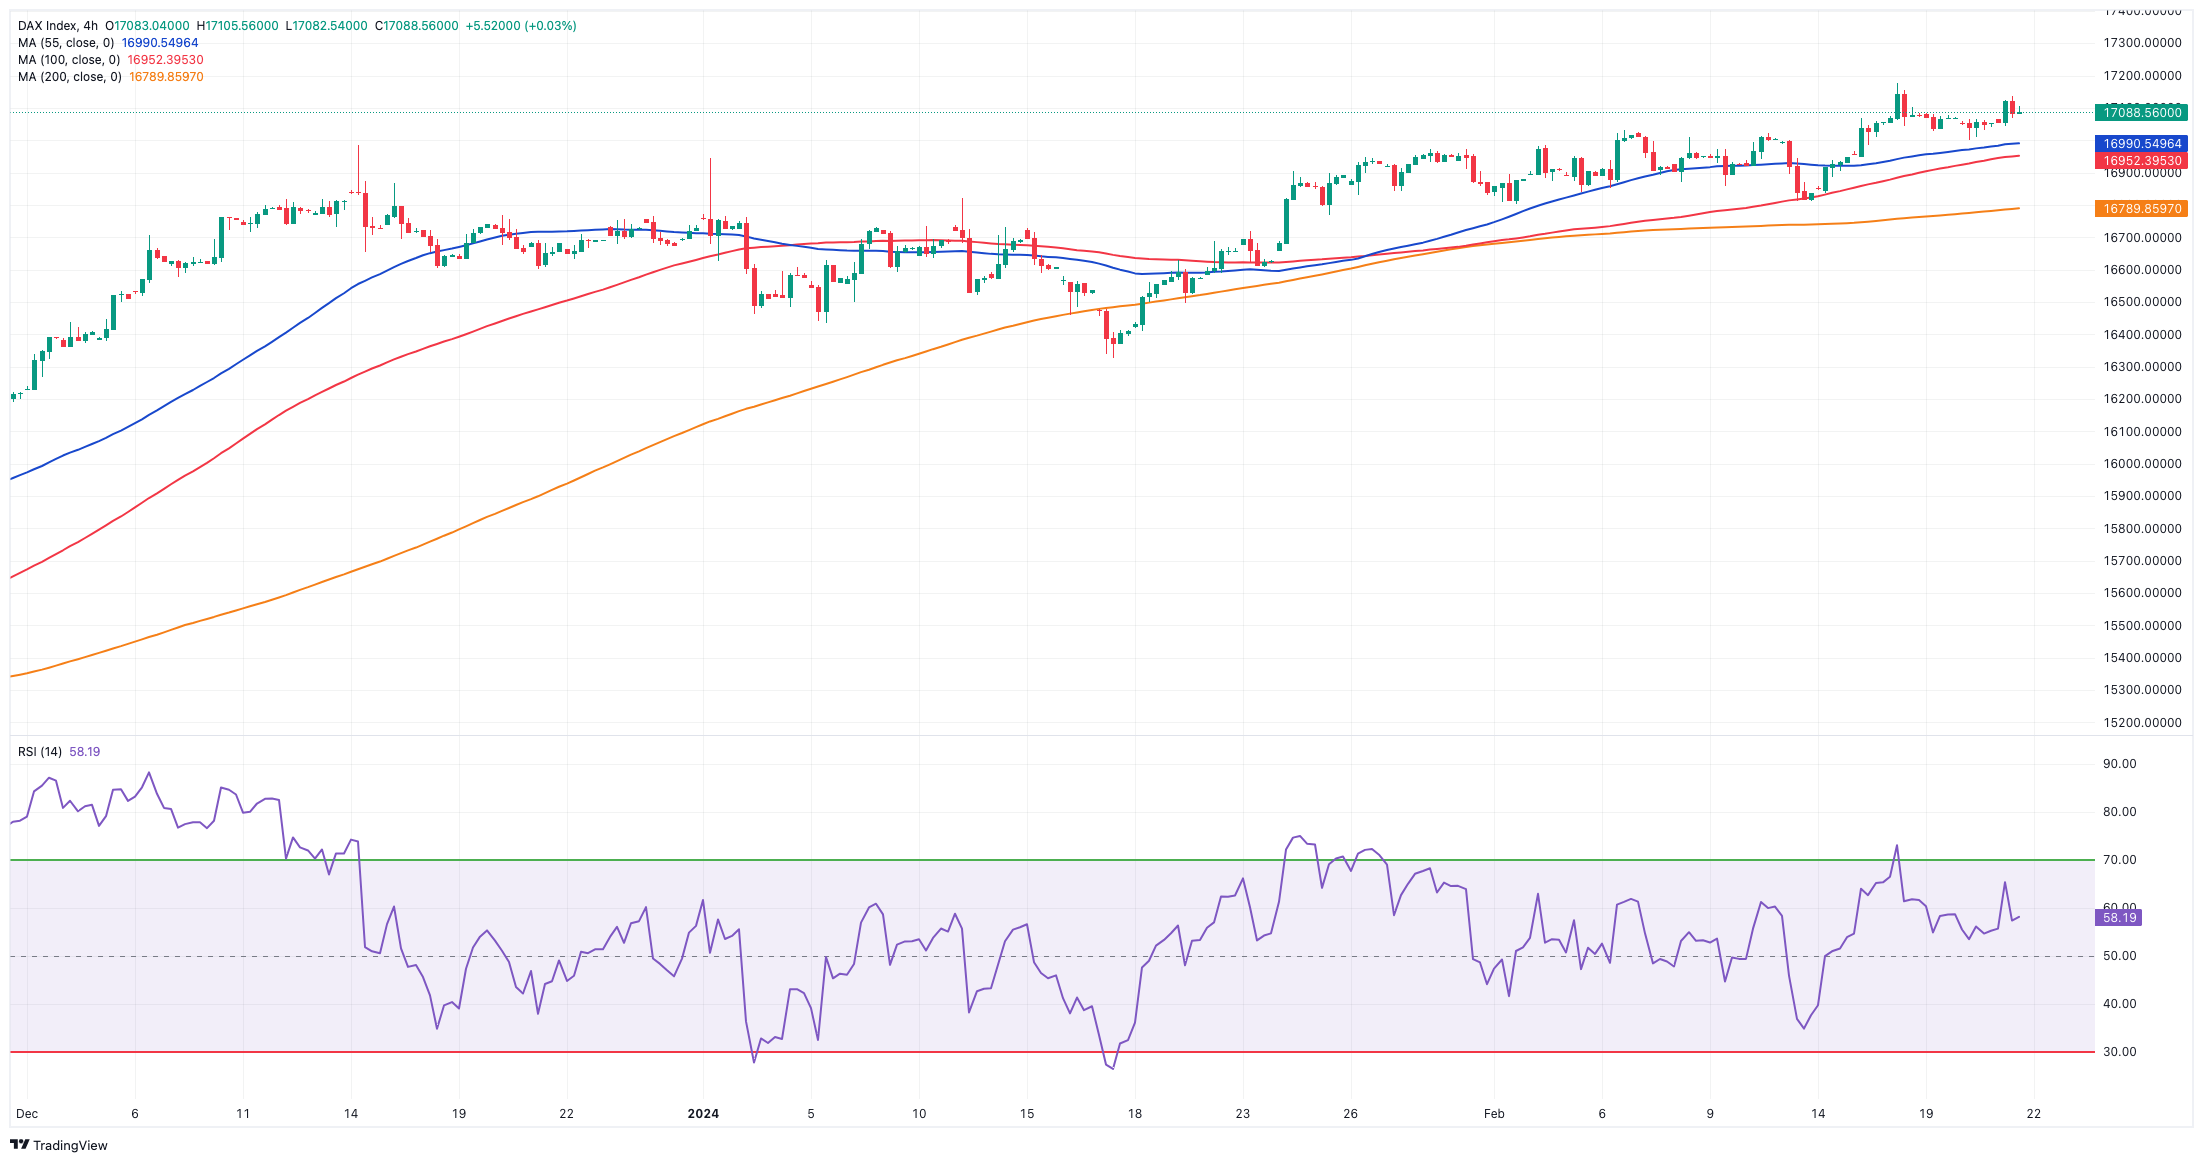
Following two consecutive sessions of losses, Germany’s stock reference DAX40 managed to print decent gains on Wednesday around the 17,100 region.
The move higher in the index came amidst the broad-based mixed tone of European equities, all ahead of the publication of the FOMC Minutes and prior to the release of corporate earnings results by chip maker NVIDIA.
On another page, German Economy Minister Habeck remarked that the recovery from the crisis is proceeding at a slower pace than anticipated, primarily due to the sluggish global economy and increasing interest rates. He, however, anticipates a GDP growth rate of approximately 1% in 2025, accompanied by an inflation rate of 2%. Furthermore, he characterized Germany's economic circumstances as exceedingly difficult.
In the domestic money market, 10-year bund yields climbed to levels last seen in early December, around 2.45%.
The DAX40's next upward hurdle is its all-time high at 17,198 (February 16). Just the opposite, the February low of 16,821 (February 1) provides immediate support and seems to be bolstered by the short-term 55-day SMA at 16,779. The loss of this zone might bring a test of the 2024 bottom at 16,345 (January 17) back into focus ahead of the 200-day SMA at 16,025. A deeper decline may revisit the weekly low of 15,915 (November 28), followed by the October 2023 low of 14,630 (October 23), and the March 2023 low of 14,458 (March 20). The daily RSI improved to the vicinity of 62.
Best Performers: Siemens Energy AG, BMW ST, Dr Ing hc F Porsche Prf
Worst Performers: Siemens Healthineers, Symrise AG, Deutsche Boerse
Resistance levels: 17,198 (4H chart)
Support levels: 16,831 16,639 16,345 (4H chart)
GBPJPY
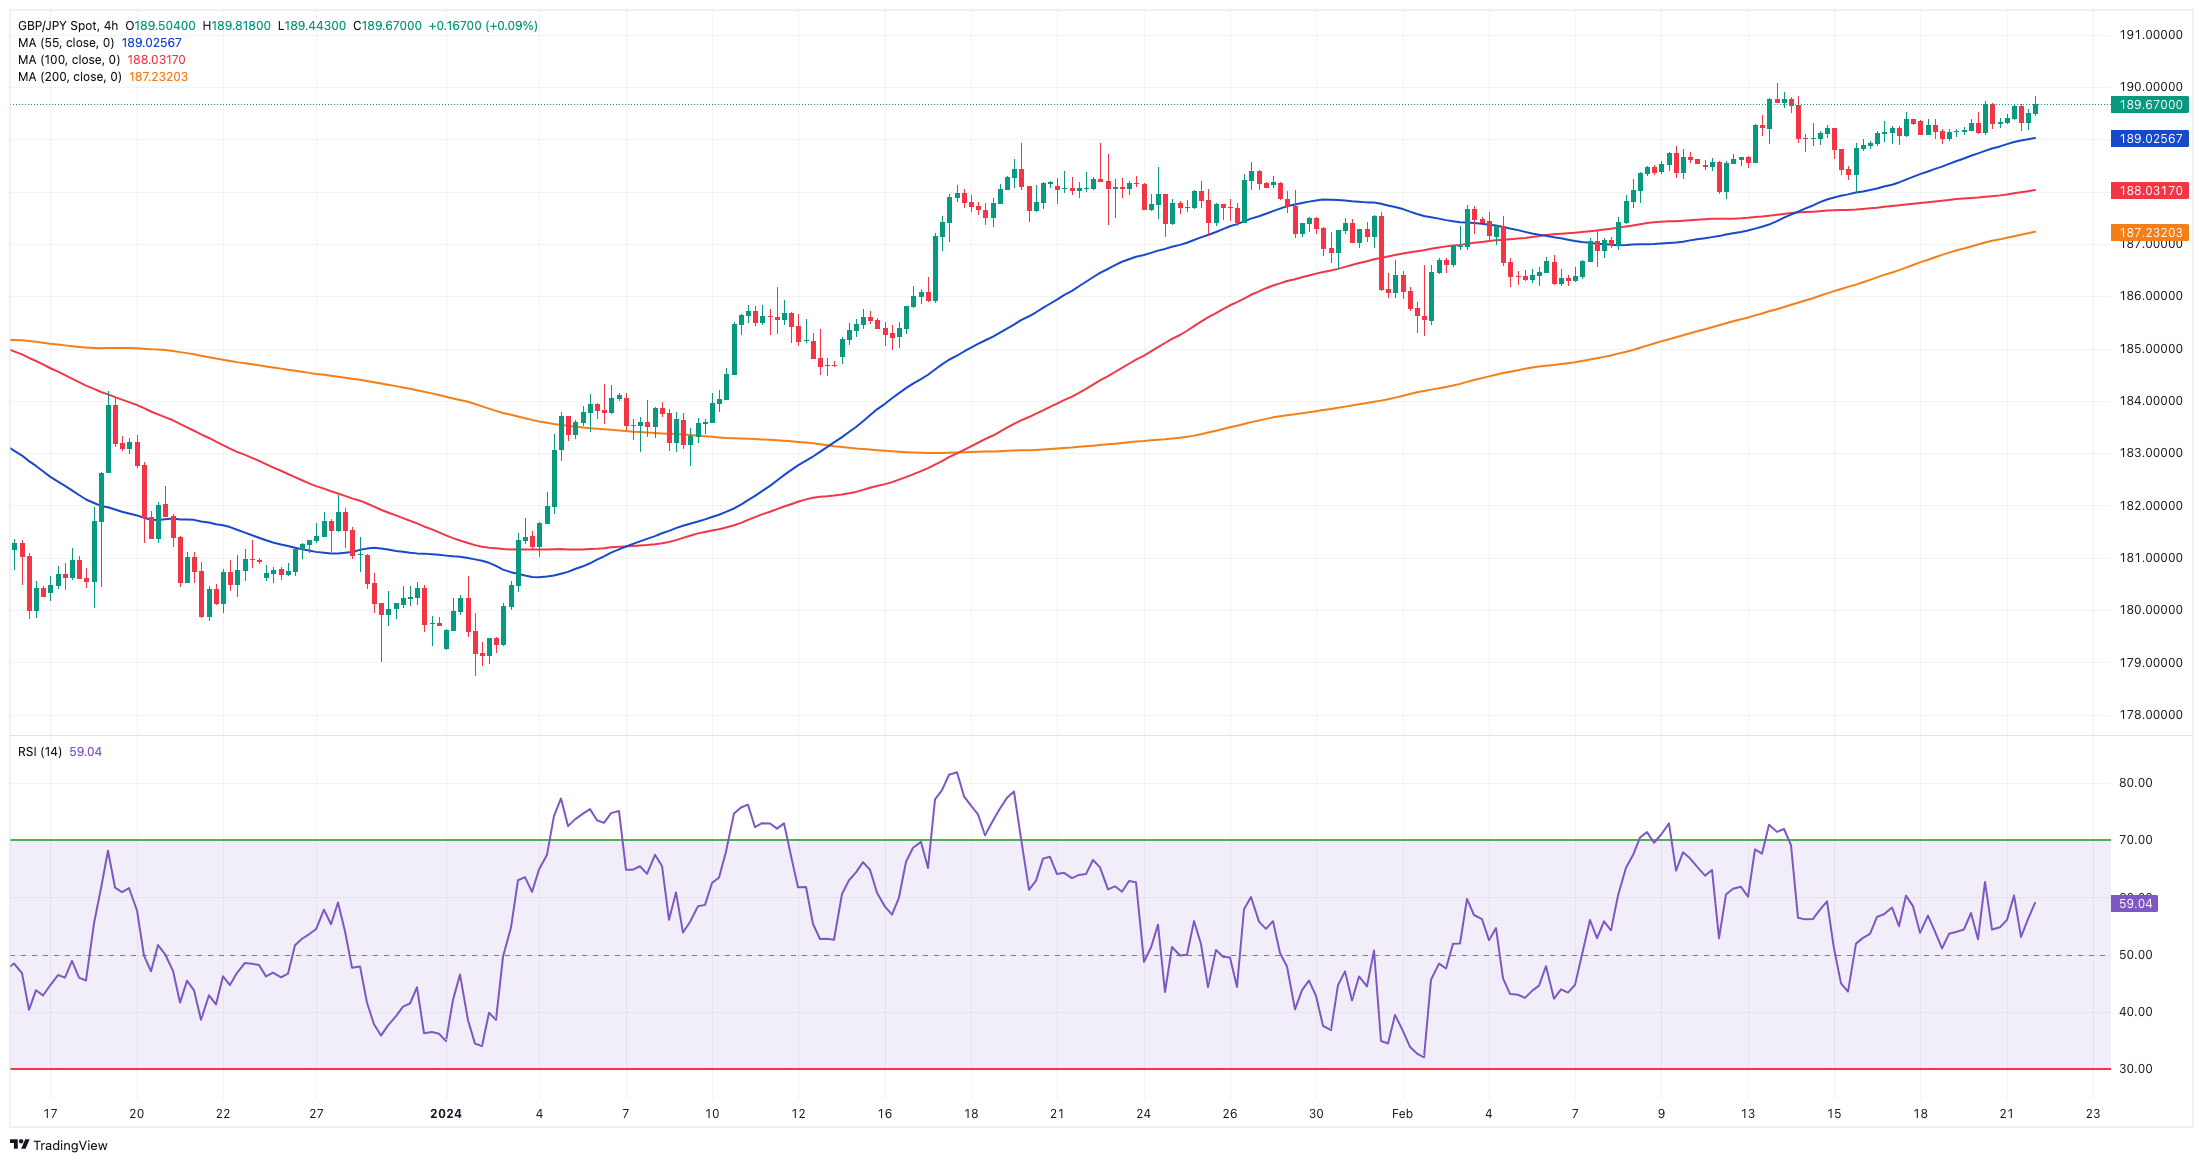
GBP/JPY added to Tuesday’s gains and approached the key round level at 190.00 on Wednesday in the context of alternating risk appetite trends.
The positive price action in the cross came amidst further depreciation of the Japanese yen, all amidst the slight bounce in the greenback and marginal losses in the British Pound.
The next target for GBP/JPY is the 2024 high of 190.08 (February 13), ahead of the August 2015 record of 195.28. If bears regain control, spot may initially fall to its February low of 185.22 (February 1) before finding intermediate support at the 55-day and 100-day SMAs of 185.17 and 184.79, respectively. South of here is the more significant 200-day SMA at 182.79, prior to the December 2023 bottom of 178.33 (December 14) and the October 2023 low of 178.03 (October 3). A deeper decline may provide a challenge to the July 2023 low of 176.30, before the May 2023 low of 167.84 (May 11). The day-to-day RSI climbed over 64.
Resistance levels: 189.77 190.08 195.28 (4H chart)
Support levels: 187.99 186.18 185.22 (4H chart)
NASDAQ
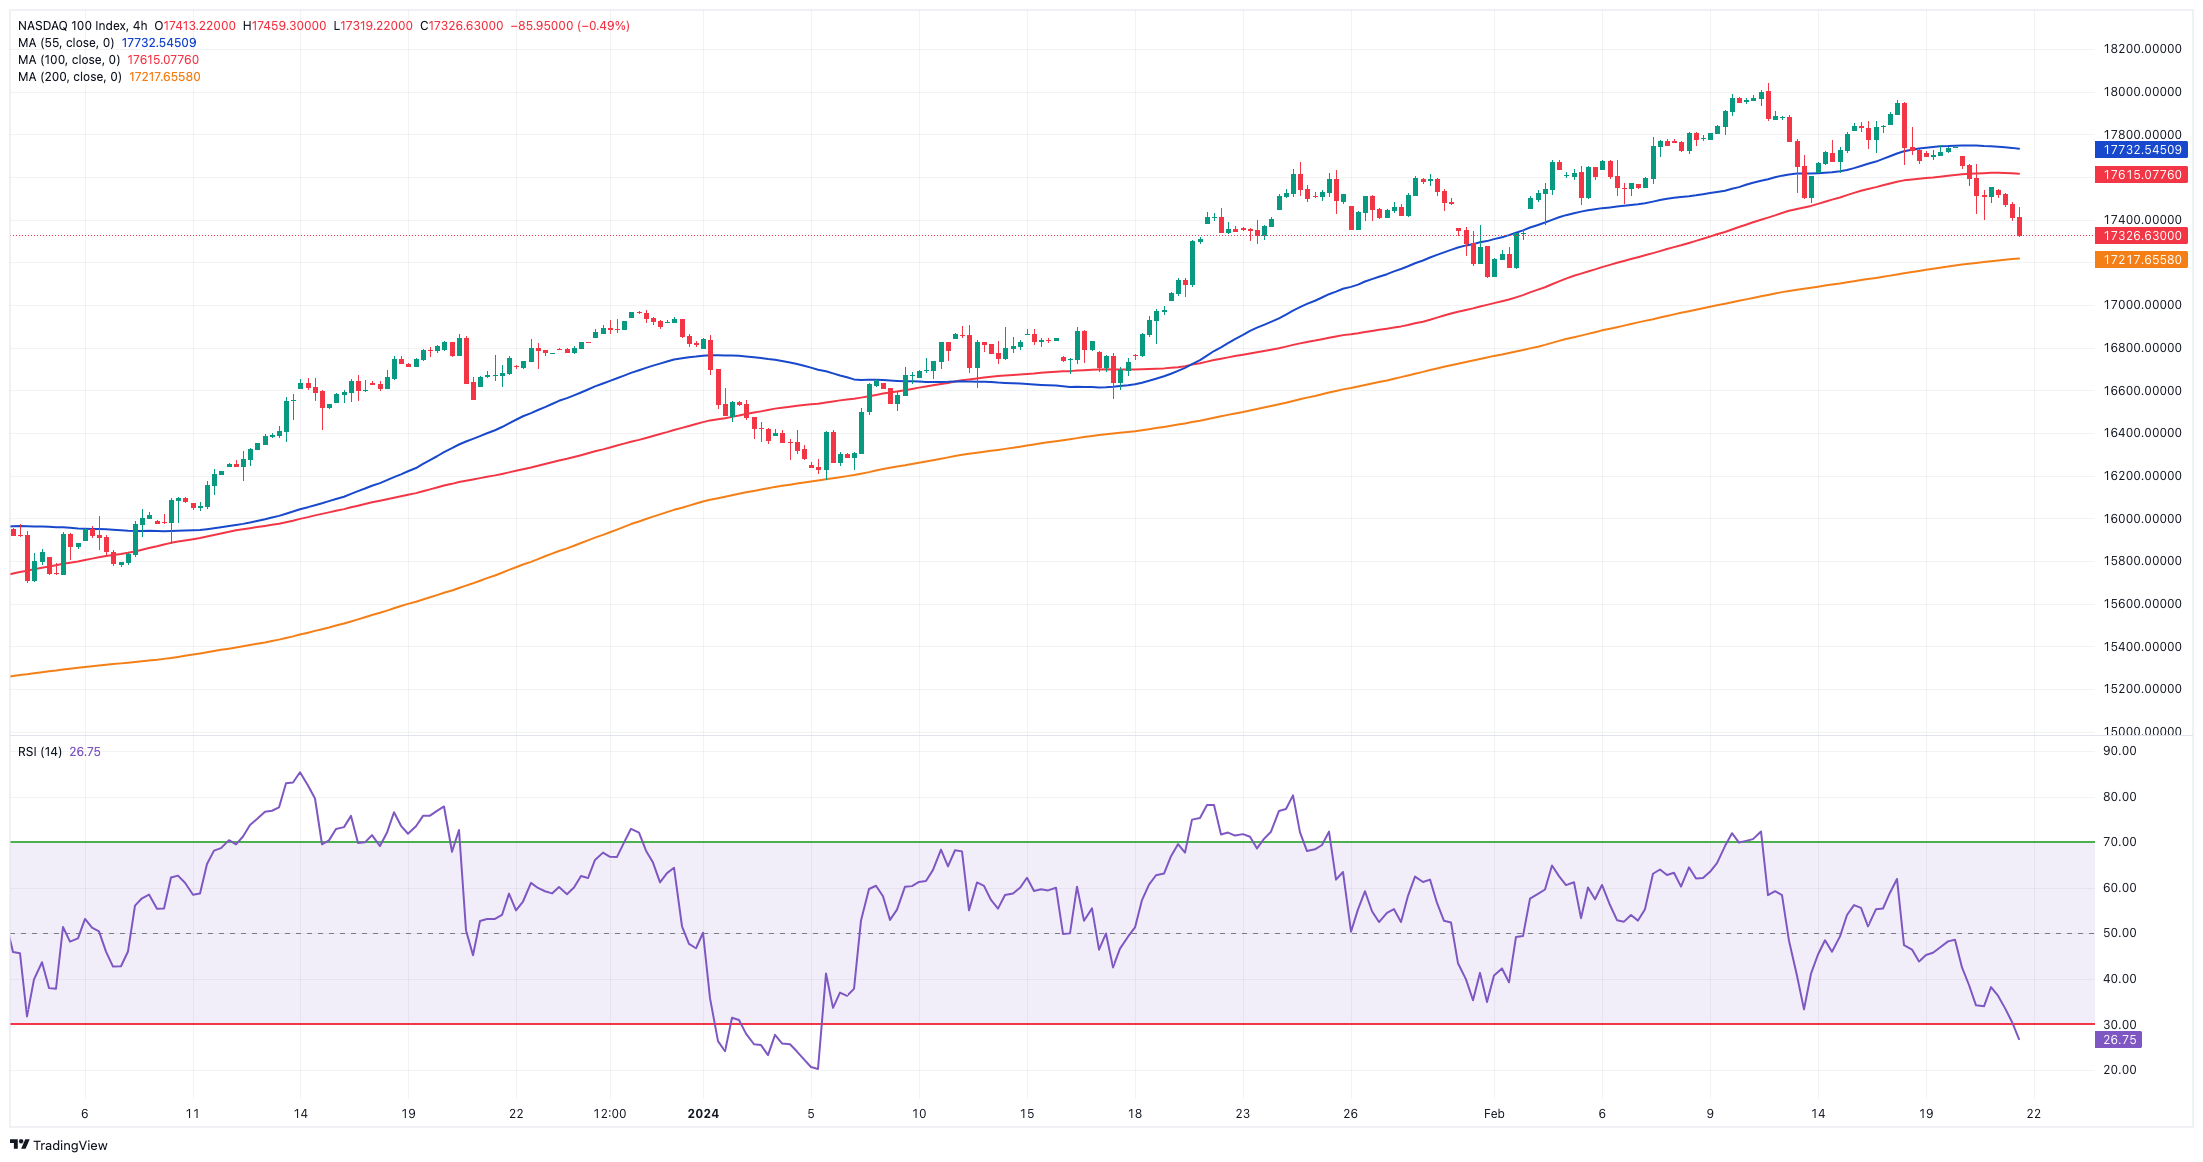
The US tech sector maintained the bearish tone well in place for the third session in a row on Wednesday, dragging the benchmark Nasdaq 100 to multi-session lows near the 17,300 zone.
Higher US yields in combination with rising prospects and a tighter-for-longer stance from the Fed kept the sentiment among investors depressed on Wednesday, while rising prudence ahead of the key release of the earnings report by megacap NVIDIA also added to the generalized sour mood.
A further fall may see the Nasdaq 100 revisit the weekly low of 17,128 (January 31), which comes before the interim 55-day SMA of 16,962 and the 2024 low of 16,249 (January 5). If the index goes below this level, it might touch the December 2023 low of 15,695 (December 4) before reaching the crucial 200-day SMA of 15,507. A breakdown of this level may result in a probable decline to the October 2023 low of 14,058 (October 26), before the April 2023 low of 12,724 (April 25), the March 2023 low of 11,695 (March 13), and the 2023 low of 10,696 (January 3). Instead, sporadic bullish attempts continue to aim for a new record high of 18,041 (February 12). The daily RSI dropped to the 48 zone.
Top Gainers: Exelon, CoStar, Kraft Heinz
Top Losers: Palo Alto Networks, Zscaler, CrowdStrike Holdings
Resistance levels: 18,041 (4H chart)
Support levels: 17,372 17,128 16,561 (4H chart)
All Information & Updates provided by:

All information relating to the financial markets available on this page has been prepared and issued by FXStreet (Forexstreet SL, Spain, Reg: B62498233) on the basis of publicly available information and all information believed to be reliable and does not conflict with Kuwaiti local laws, and all necessary care has been taken to before the company to ensure that the facts mentioned are correct from the source.
NCM Investment nor any of its directors or employees shall in any way be held responsible for the contents of this news, and the information contained on this page is intended only to provide clients with publicly available information and should not be construed as investment advice, report or analysis and/or constitute an offer or invitation to buy or sell financial instruments of any kind.
RISK WARNING: Forex and CFDs are highly risky leveraged products, as losses can exceed deposits. Please ensure you understand all the risks and take independent advice if necessary. NCM will segregate the clients based on the criteria of the regulator and its bylaws. NCM does not provide any advisory service; the material published does not constitute advice or a recommendation for a transaction in any financial instrument. NCM accepts no responsibility for any use of the content presented and any consequences of that use. Anyone acting on the information provided does so at their own risk.