
- Contact Us:
-

-

-

-


Daily Market Updates
23 Feb 2024
EURUSD
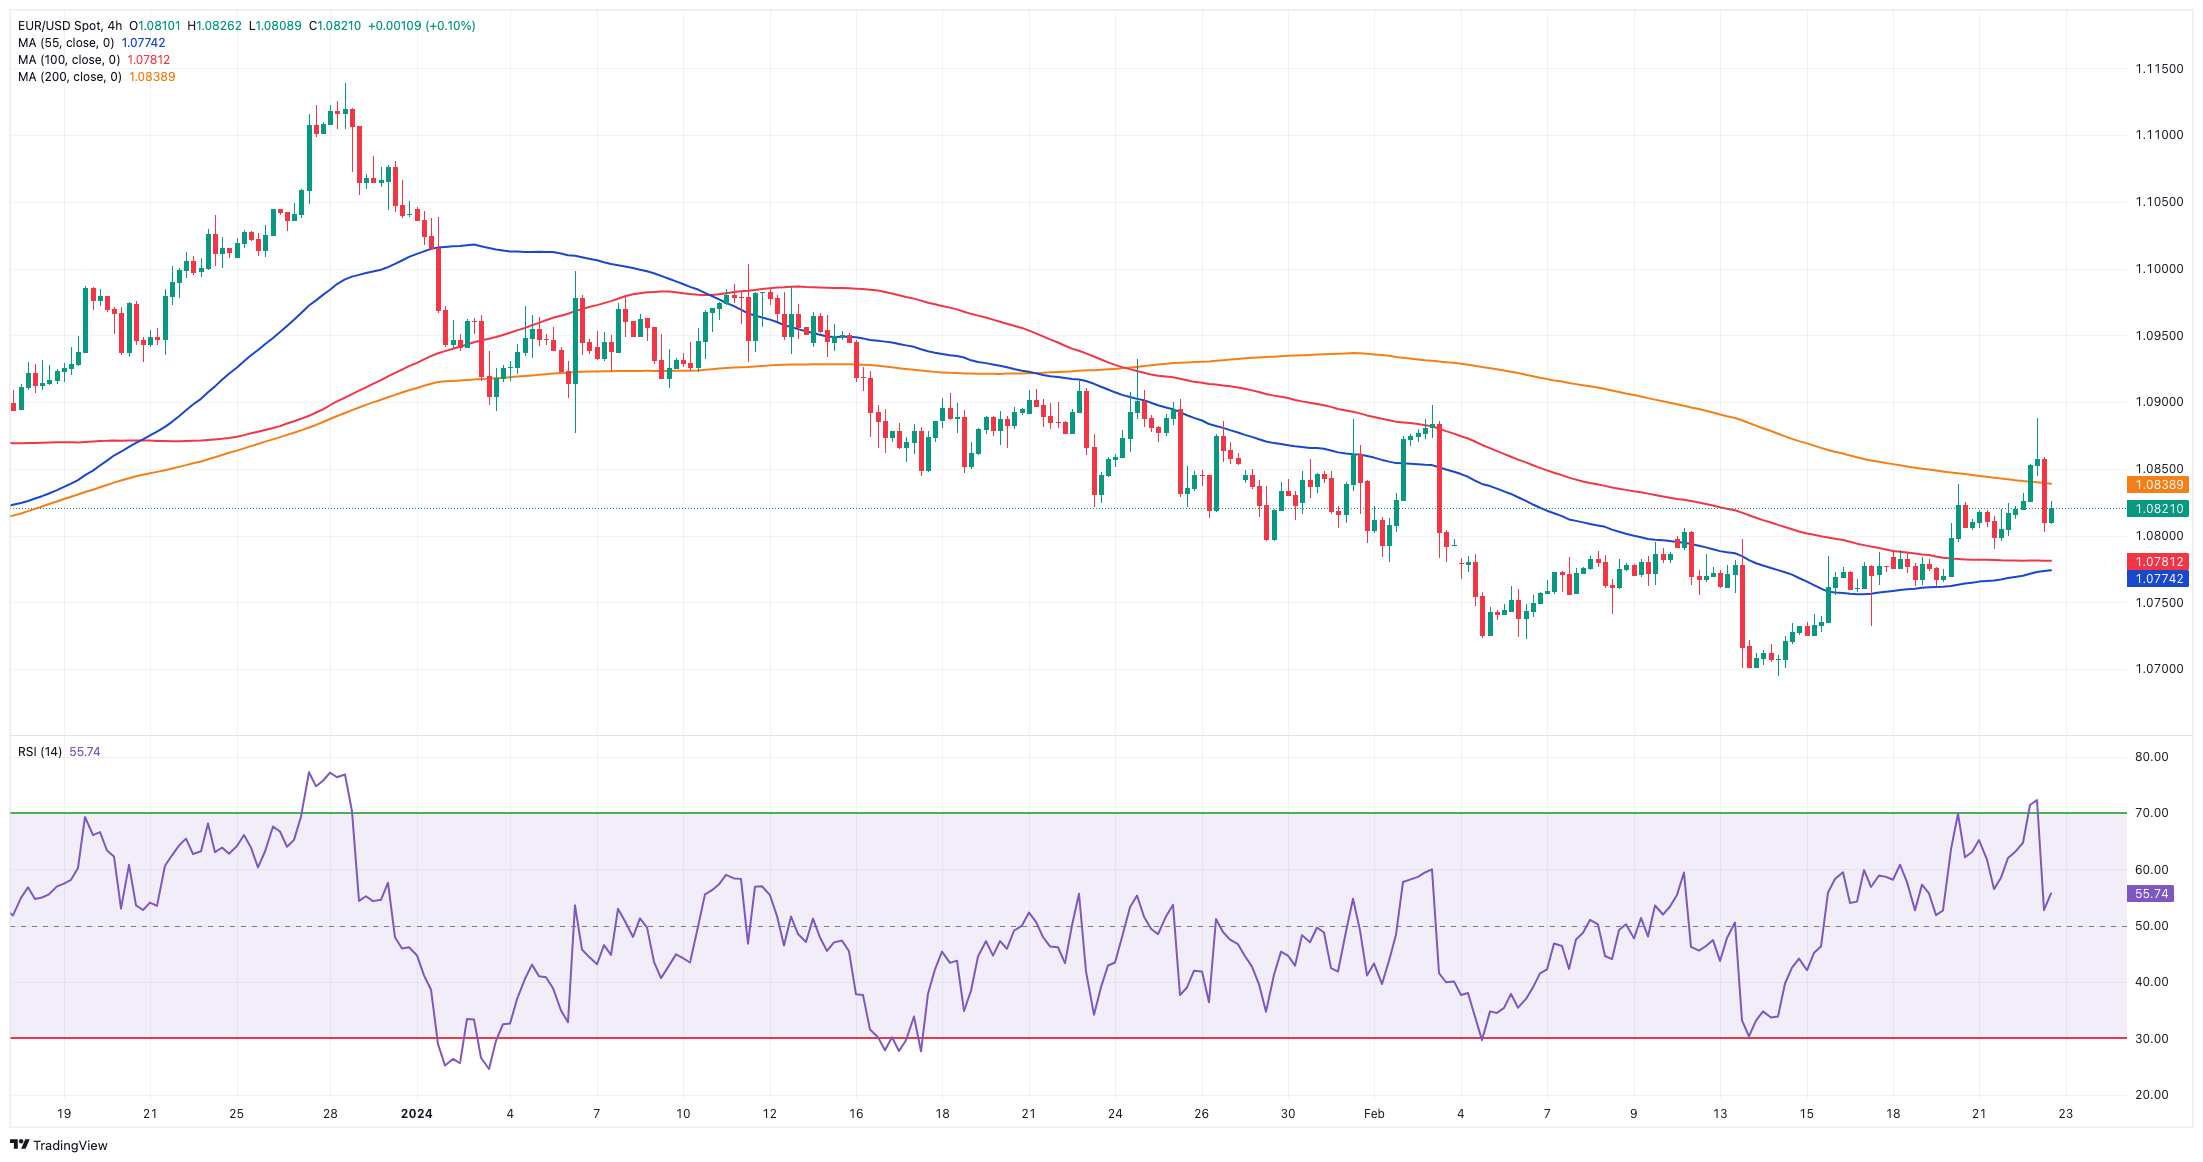
EUR/USD ended Thursday’s session marginally up around the 1.0820 region after failing to extend the earlier uptick to the boundaries of 1.0900 the figure, or three-week highs, on the back of upbeat prints from advanced PMIs in the old continent.
The greenback, on the other hand, remained on the defensive most of the session, although firm weekly Claims briefly lifted the USD Index (DXY) to positive ground above the 104.00 milestone amidst mixed US yields.
In the meantime, the macro scenario kept signalling rising bets for a later-than-anticipated rate cut by the Fed, with June being the most likely candidate so far.
On the domestic calendar, final inflation figures in the broader euroland showed the headline CPI rose 2.8% YoY in January and 3.3% when it came to the Core CPI. In addition, the advanced Manufacturing PMI eased to 42.3 in Germany and to 46.1 in the euro bloc. The flash Services PMI is seen improving to 48.2 in Germany and 50 in the broader region.
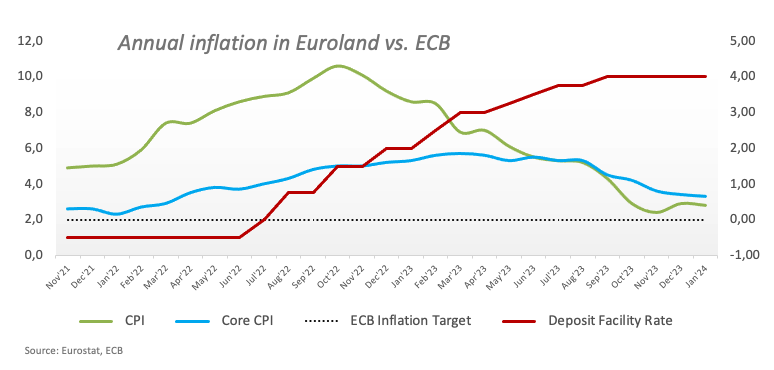
Finally, the ECB Accounts consensus is that rate reductions are premature and the March 2024 inflation forecast may be revised downward. Policymakers warn that financial market relaxation measures could disrupt or postpone the inflation target's timely attainment.
In the US docket, Initial Claims rose by 201K in the week to February 17, the Chicago Fed National Activity Index worsened to -0.3 in January, and the advanced Manufacturing and Services PMI came in at 51.5 and 51.3, respectively. Finally, Existing Home Sales expanded at a monthly 3.1% in January.
EUR/USD is expected to meet its initial hurdle at the weekly high of 1.0888 (February 22), an area reinforced by the temporary 55-day SMA. North from here comes the weekly tops of 1.0932 (January 24) and 1.0998 (January 5, 11). The breakout of this region exposes the December 2023 peak of 1.1139 (December 27), which is supported by the 200-week SMA of 1.1148 and occurs before the 2023 high of 1.1275 (July 18). In the other direction, the 2024 low of 1.0694 (February 14) is next, followed by the weekly low of 1.0495 (October 13, 2023), the 2023 low of 1.0448 (October 3), and the round level of 1.0400. The daily RSI ticked marginally higher to the 51 region.
Resistance levels: 1.0888 1.0897 1.0932 (4H chart)
Support levels: 1.0761 1.0732 1.0694 (4H chart)
USDJPY
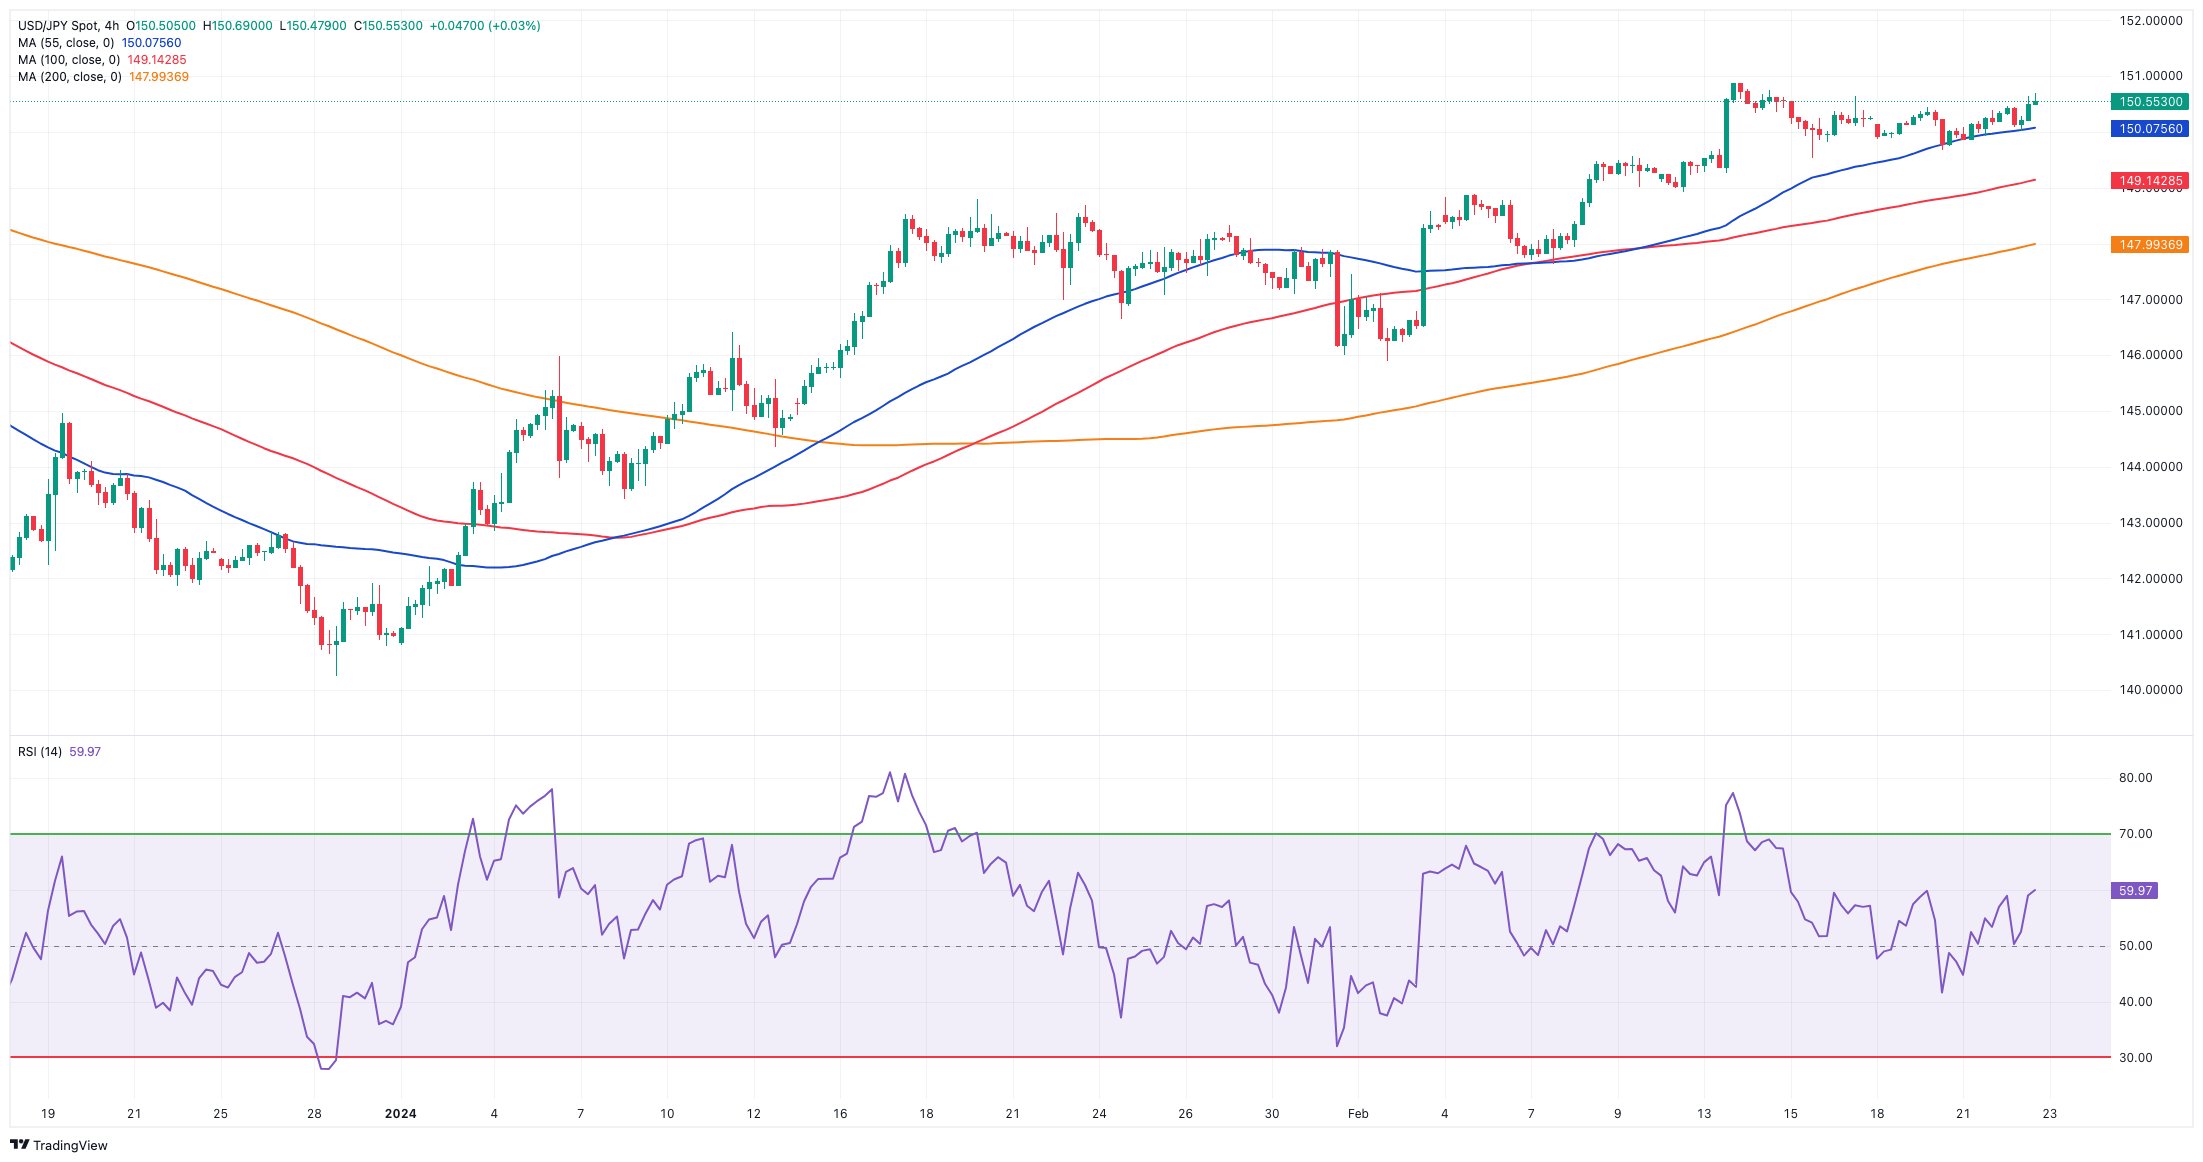
USD/JPY climbed to multi-day highs and revisited the 150.65/70 band on Thursday.
Further gains in the pair came despite the small retracement in the greenback, while mixed price action in US yields across the curve seems to have propped up the upside bias in spot.
In addition, BoJ Governor Ueda spoke before the parliament, and he stated that the nation's inflation was steadily increasing due to a tight labour market driving up wages. He reiterated the bank's belief that circumstances conducive to ending negative interest rates were aligning.
In Japan, Foreign Bond Investment shrank to ¥560.8B in the week to February 17.
If bulls retake the lead, USD/JPY may reach its 2024 top of 150.88 (February 13), ahead of the 2023 peak of 151.90 (November 13). Further north, the 2022 high of 151.94 (October 21) is closely followed by the round figure of 152.00. On the contrary, the 100-day SMA should provide temporary support around 147.65, ahead of the February low of 145.89 (February 1), which remains supported by the preliminary 55-day SMA. The crucial 200-day SMA at 145.58 comes before the December 2023 low of 140.24 (December 28), the round number of 140.00, and the July low of 137.23 (July 14). The daily RSI exceeded the 65 threshold.
Resistance levels: 150.88 151.43 151.90 (4H chart)
Support levels: 149.68 148.92 147.61 (4H chart)
GBPUSD
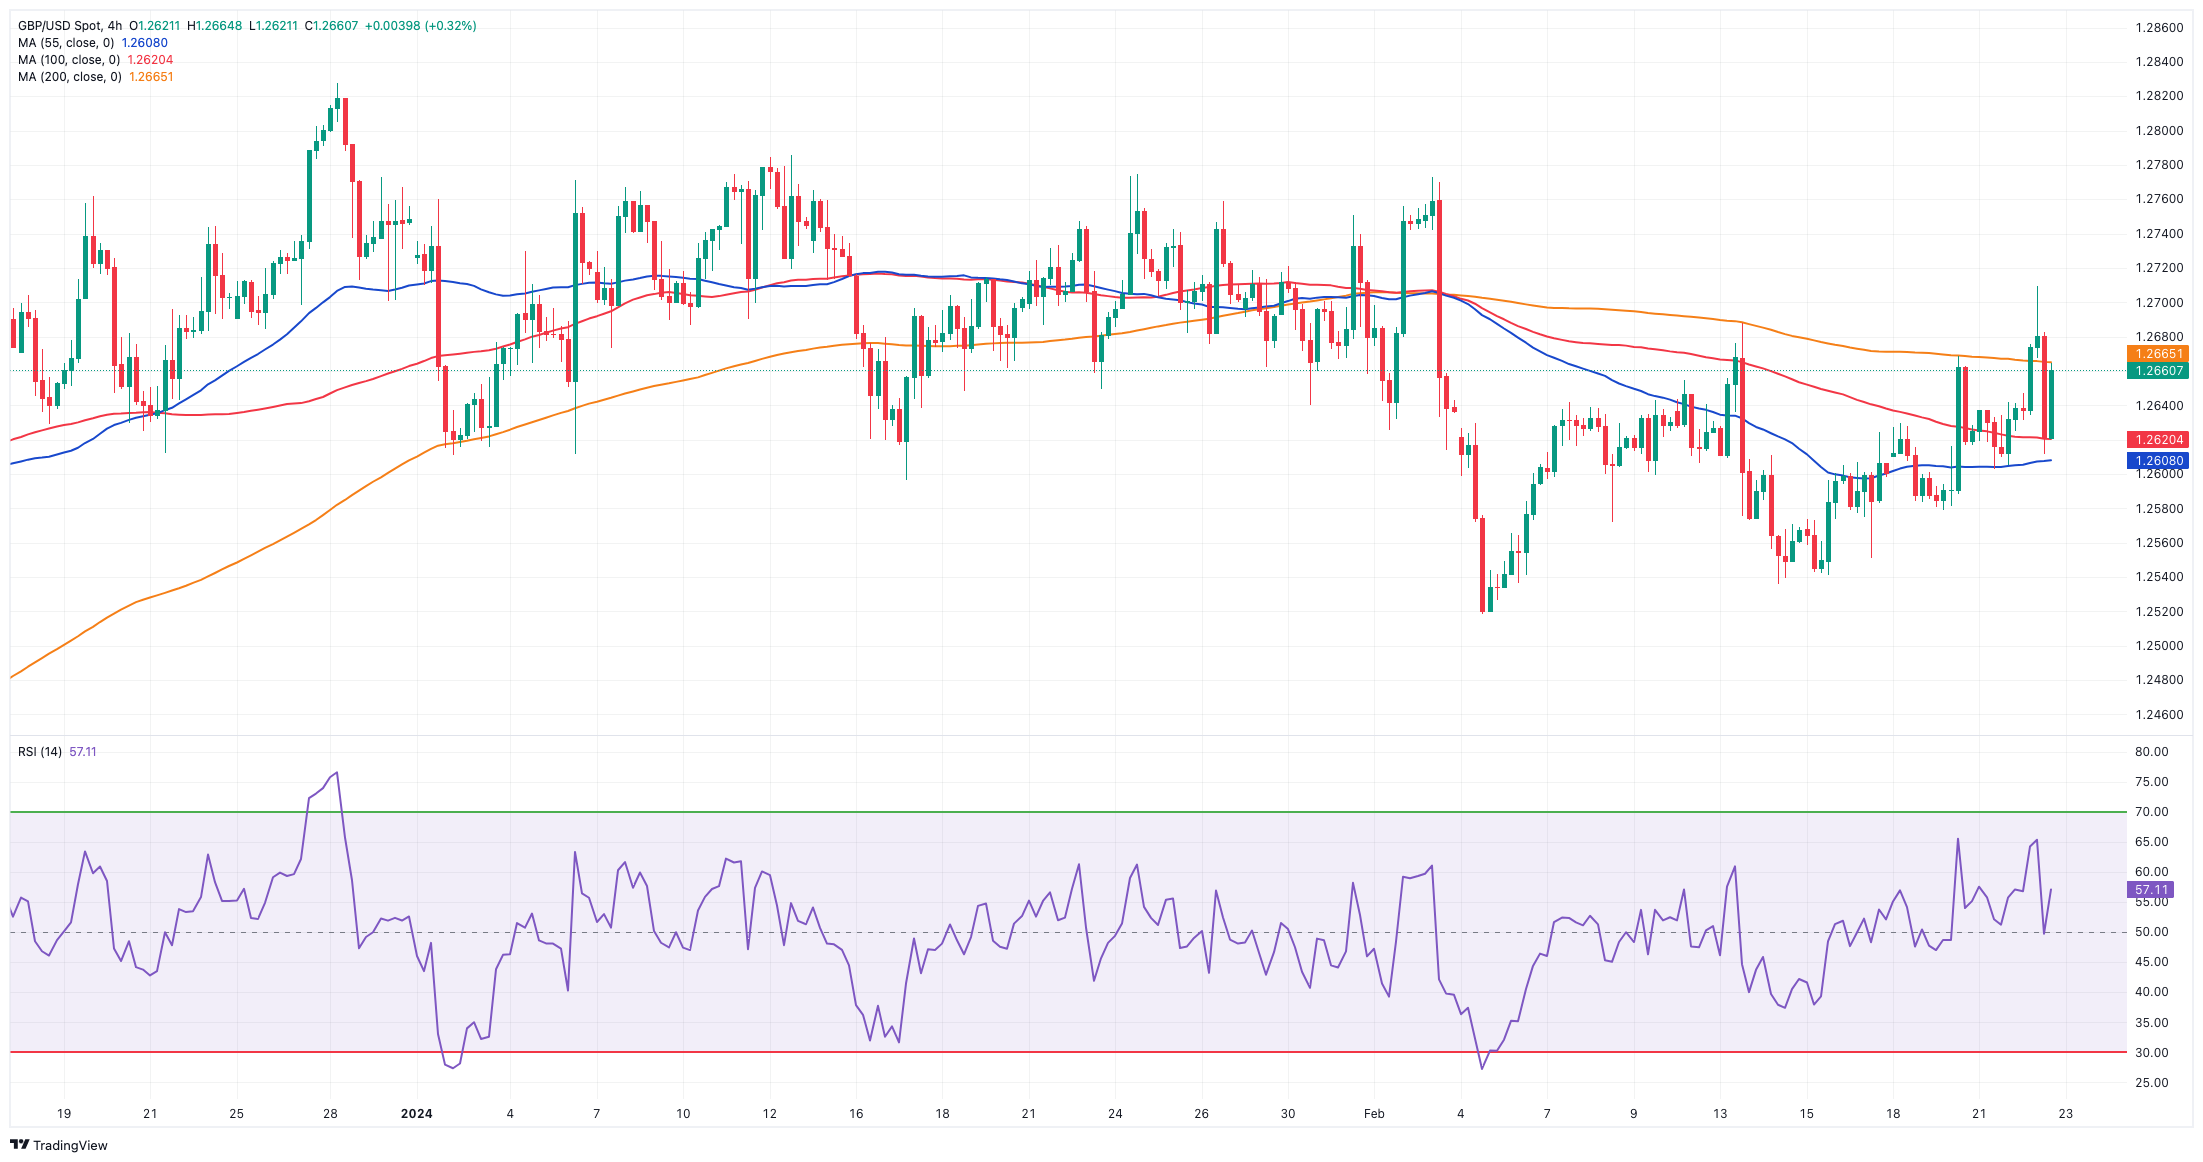
GBP/USD extended its weekly recovery, advancing for the third consecutive session and briefly surpassing the 1.2700 barrier, or three-week peaks, although running out of steam afterwards.
Cable once again could capitalize on the inconclusive price action around the greenback despite steady speculation of a rate cut by the Fed later than investors’ expectations.
Extra strength for the quid came after flash Manufacturing and Services PMIs in the UK came in at 47.1 and 54.3, respectively, for the month of February.
From the BoE, MPC member Greene maintained a cautious stance towards easing. She stated, "I would require further evidence suggesting that inflation isn't as deeply rooted as we had anticipated before considering a vote for a rate cut." Nevertheless, Greene acknowledged that the factors contributing to heightened services inflation "are beginning to diminish, indicating that trends are moving positively.
Further increases in the GBP/USD target the weekly high of 1.2703, ahead of the February top of 1.2772 (February 2) and the 2024 peak of 1.2785 (January 12). The latter's breakthrough might lead to a test of the December high of 1.2827 (December 28), followed by the weekly top of 1.2995 (July 27, 2023) and the critical 1.3000 yardstick. On the downside, the first target is the 2024 low of 1.2518 (February 5), followed by the December 2023 low of 1.2500 (December 13), which are both supported by the intermediate 100-day SMA at 1.2515. Additional weakening may cause spot to shift its focus to the weekly bottom of 1.2187 (November 10, 2023), before the October 2023 low of 1.2037 (October 3), and the key 1.2000 mark, all preceding the 2023 low of 1.1802 (March 8). The day-to-day RMA leapt past 52.
Resistance levels: 1.2709 1.2772 1.2827 (4H chart)
Support levels: 1.2579 1.2518 1.2500 (4H chart)
GOLD
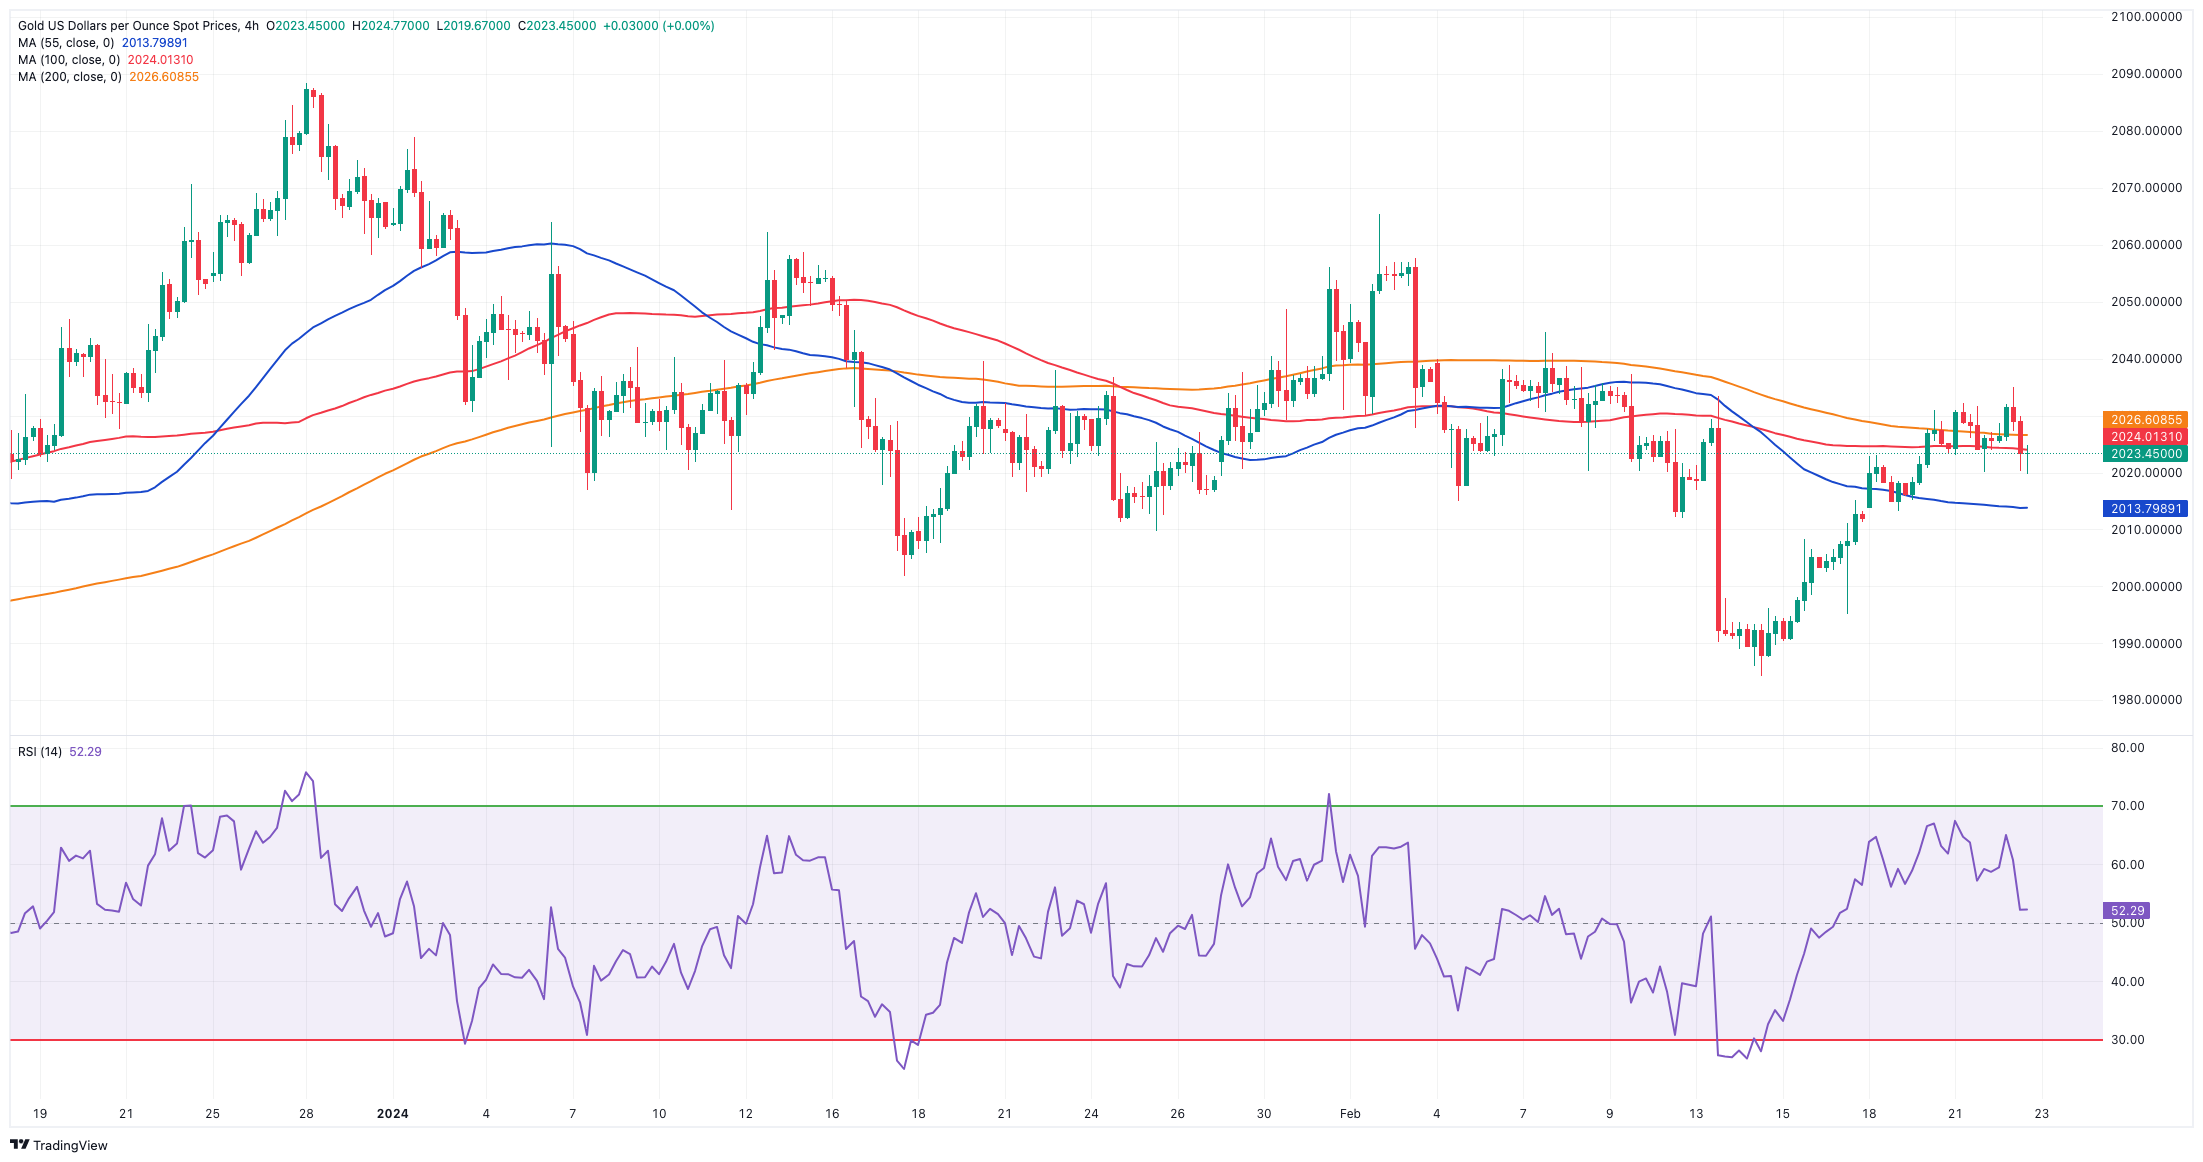
Prices of the troy ounce of the yellow metal seem to have met some decent resistance around the $2,035 mark on Thursday.
In fact, gold prices retreated modestly despite the persistent absence of direction in the greenback, while humble gains in the short end and the belly of the US yield curve appear to have put the metal under pressure.
In the weeks to come, there is a growing expectation that there will be close scrutiny of the precious metal, as speculation increases about the Fed potentially postponing the implementation of its easing measures until its June meeting (or later?).
Extra rebound might send gold back to its February peak of $2,065 (February 1), ahead of the weekly high of $2,088 (December 28) and all-time top of $2,150 (December 4, 2023). On the flip side, the initial downside objective is the 2024 low of $1,984 (February 14), followed by the December 2023 low of $1,973, which is supported by its proximity to the crucial 200-day SMA at $1,965. A deeper decline might refocus attention on the November 2023 low of $1,931, which is ahead of the October 2023 low of $1,810, the 2023 low of $1,804, and the $1,800 contention zone.
Resistance levels: $2,034 $2,044 $2,065 (4H chart)
Support levels: $1,984 $1,973 $1,965 (4H chart)
CRUDE WTI
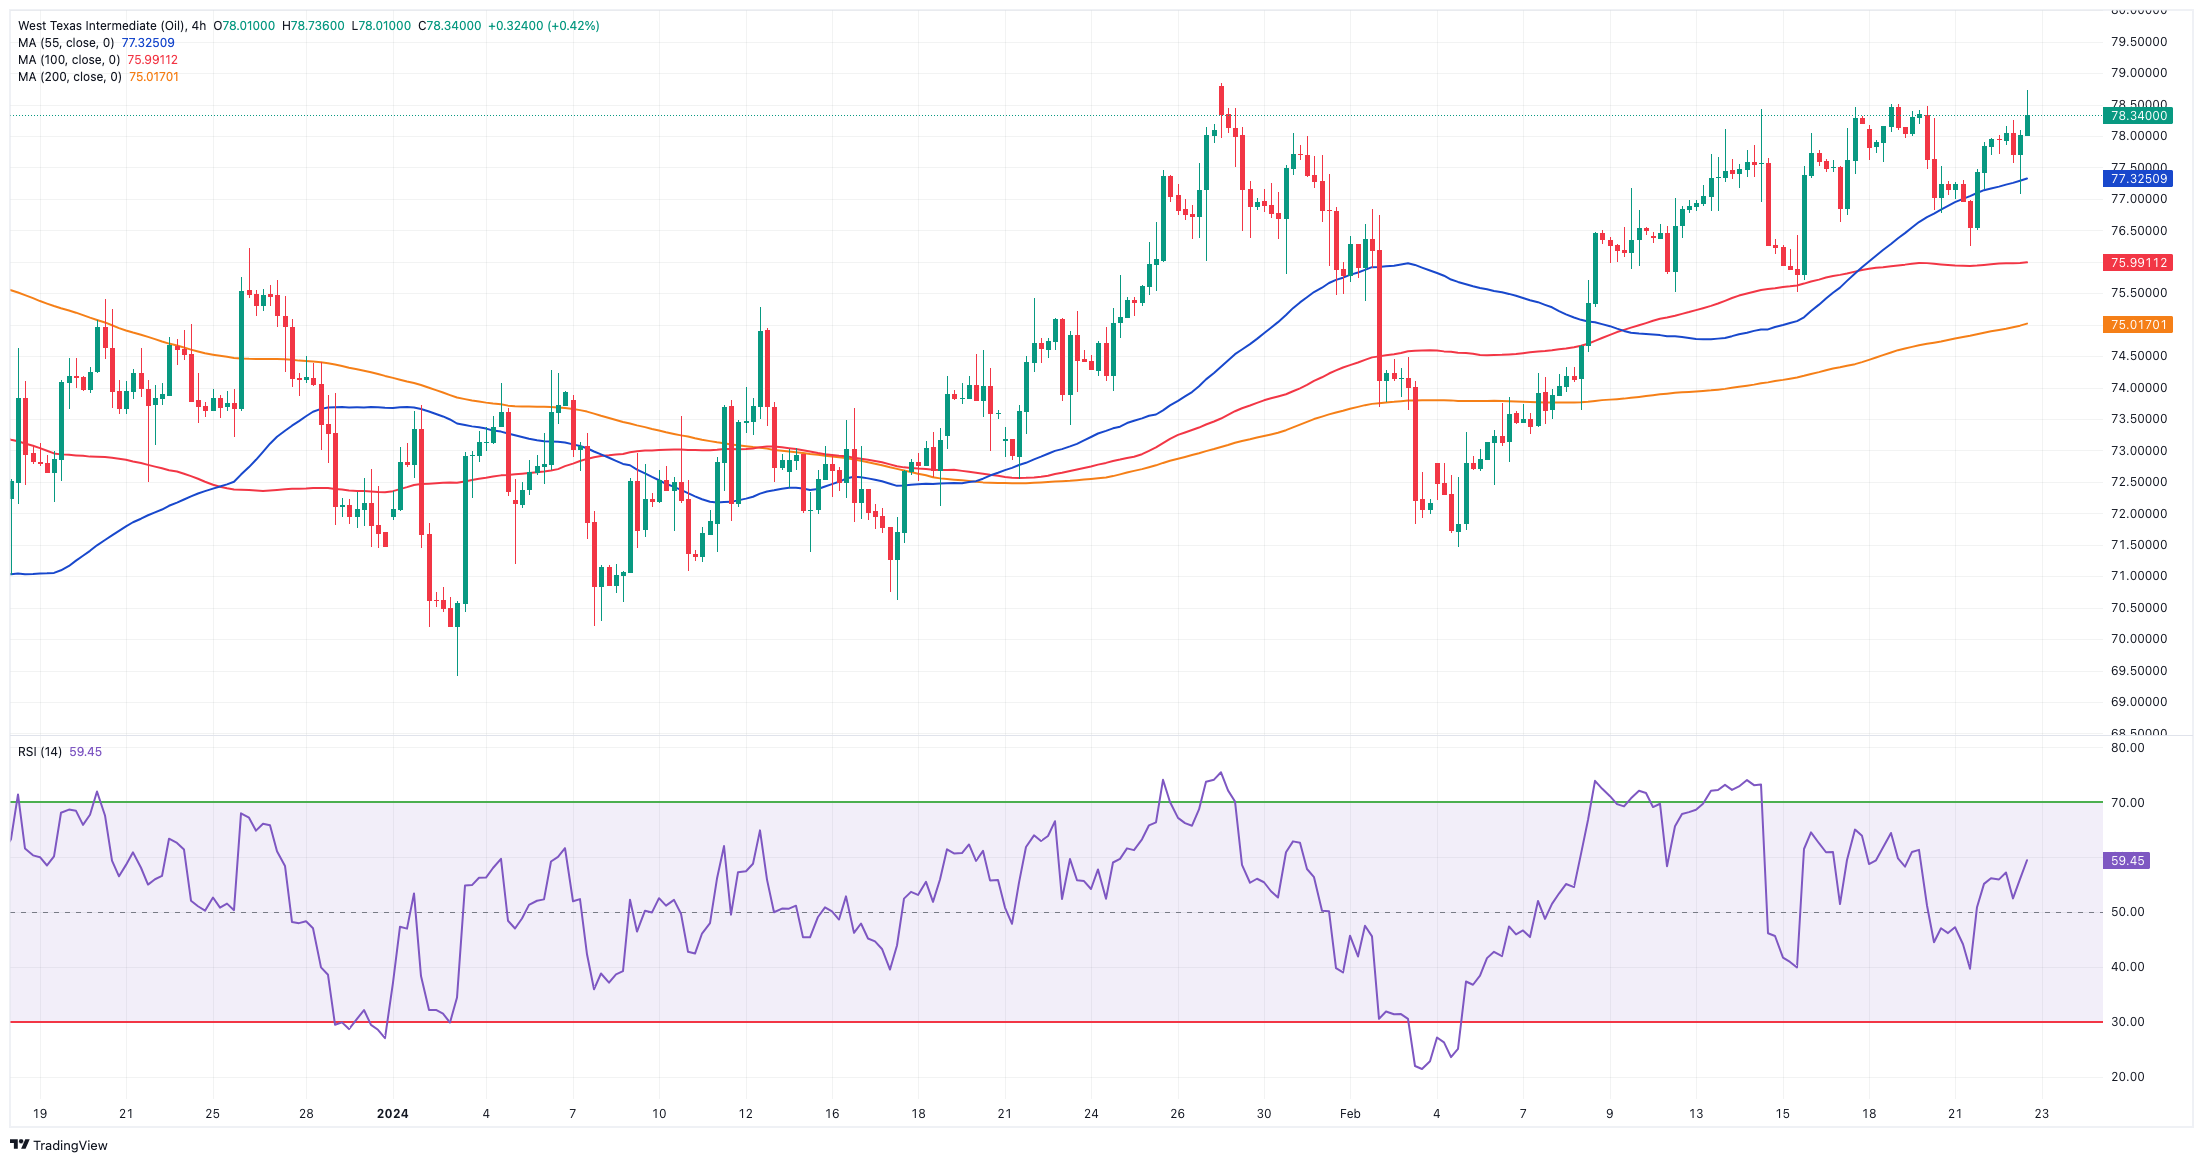
Prices of WTI rose to a new monthly high near the $79.00 mark per barrel on Thursday.
The continuation of the upside momentum in the commodity followed increasing geopolitical concerns after Houthi attacks to vessels in the Red Sea.
Nevertheless, gains were restricted by a surge in crude inventories last week due to refinery maintenance and outages.
On the latter, the EIA reported that US crude oil inventories unexpectedly rose by 3.514M barrels in the week to February 16, while supplies at Cushing increased by 0.741M barrels, Weekly Distillate Stocks shrank more than expected by 4.009M barrels and gasoline stockpiles contracted by 0.294M barrels
The next upward hurdle for WTI is the February high of $78.88 (February 22), which comes ahead of the 2024 top of $79.25 (January 29) and the key $80.00 barrier, all before the November 2023 peak of $80.15 (November 3). Extra gains from here might take the commodity back to its weekly high of $89.83 (October 18, 2023), ahead of the 2023 top of $94.99 (September 28, 2023), the August 2022 peak of $97.65 (August 30), and the psychological $100.00 threshold. In contrast, the loss of the February low of $71.43 (February 5) might put the important $70.00 barrier back into play, followed by the 2024 bottom of $69.31 (January 3).
Resistance levels: $78.88 $79.25 $79.56 (4H chart)
Support levels: $76.29 $75.49 $71.37 (4H chart)
GER40
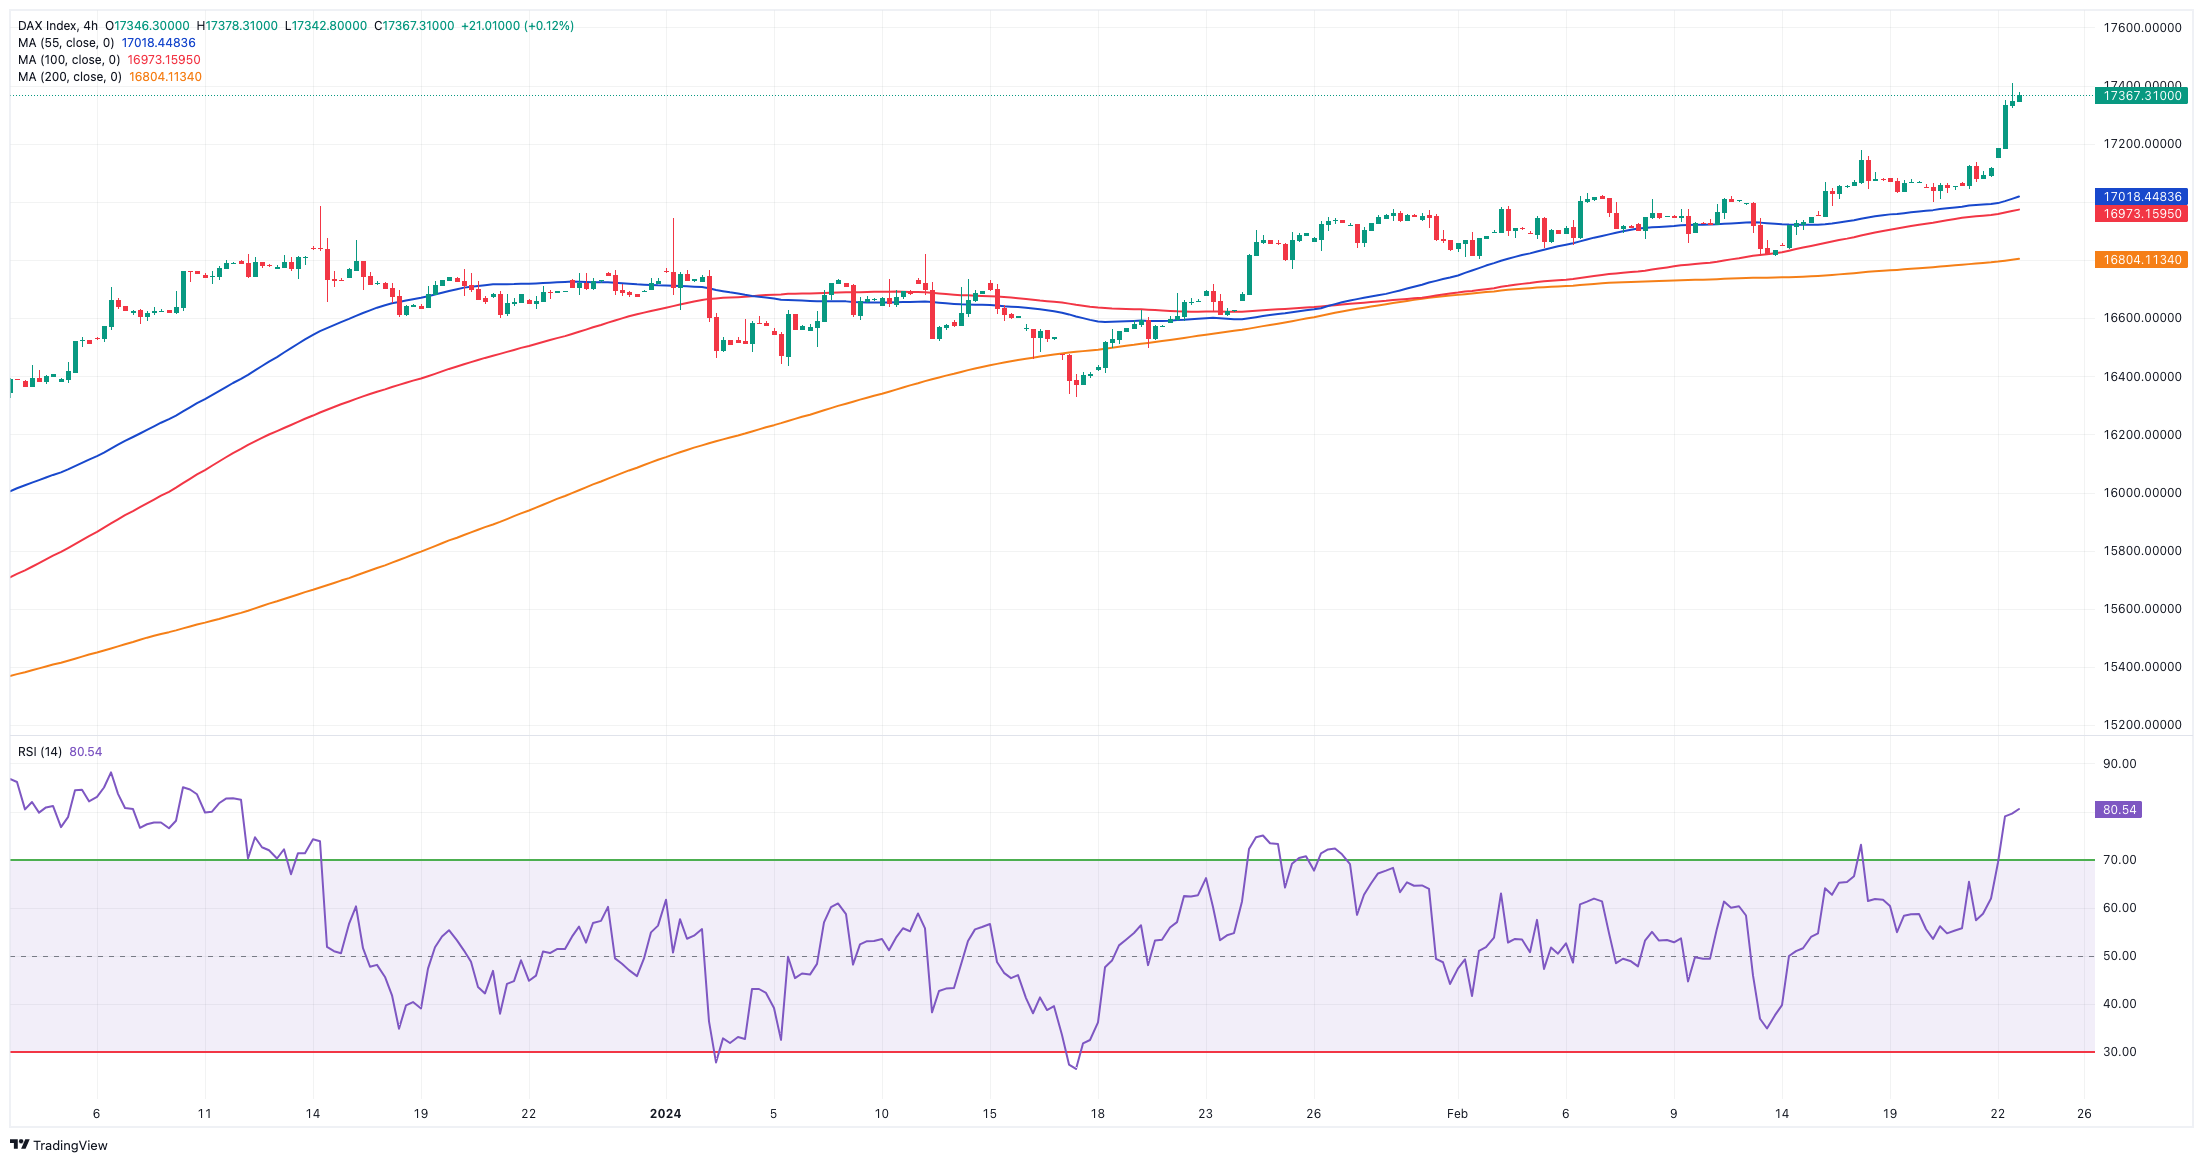
In line with its European peers, the German stock reference DAX40 rose to an all-time high around the 17,400 region on Thursday.
Further upside momentum of equities in the old continent followed the strong sentiment in the tech sector and AI-related stocks, which were bolstered by NVIDIA results published late on Wednesday.
Further buoying sentiment, and according to ECB Accounts, policymakers reached a consensus last month that inflation is becoming manageable. However, they deemed discussions of rate cuts premature due to rapid wage growth and ample underlying price pressures.
In the German bond market, 10-year bund yields rose to fresh tops around 2.50%, although the move fizzled out as the session drew to a close.
The DAX40's next upward barrier is its all-time high of 17,429 (February 22). On the contrary, the February low of 16,821 (February 1) offers immediate support and appears to be strengthened by the short-term 55-day SMA of 16,797. The loss of this zone may bring back into focus a challenge of the 2024 bottom at 16,345 (January 17), which is ahead of the 200-day SMA at 16,032. A further slide may revisit the weekly low of 15,915 (November 28), followed by the October 2023 low of 14,630 (October 23) and the March 2023 low of 14,458 (March 20). The daily RSI improved to the boundaries of the 70 threshold, flirting with the overbought zone.
Best Performers: Porsche, Covestro, Mercedes Benz Group
Worst Performers: Heidelbergcement, MTU Aero, Fresenius SE
Resistance levels: 17,429 (4H chart)
Support levels: 16,831 16,662 16,345 (4H chart)
GBPJPY
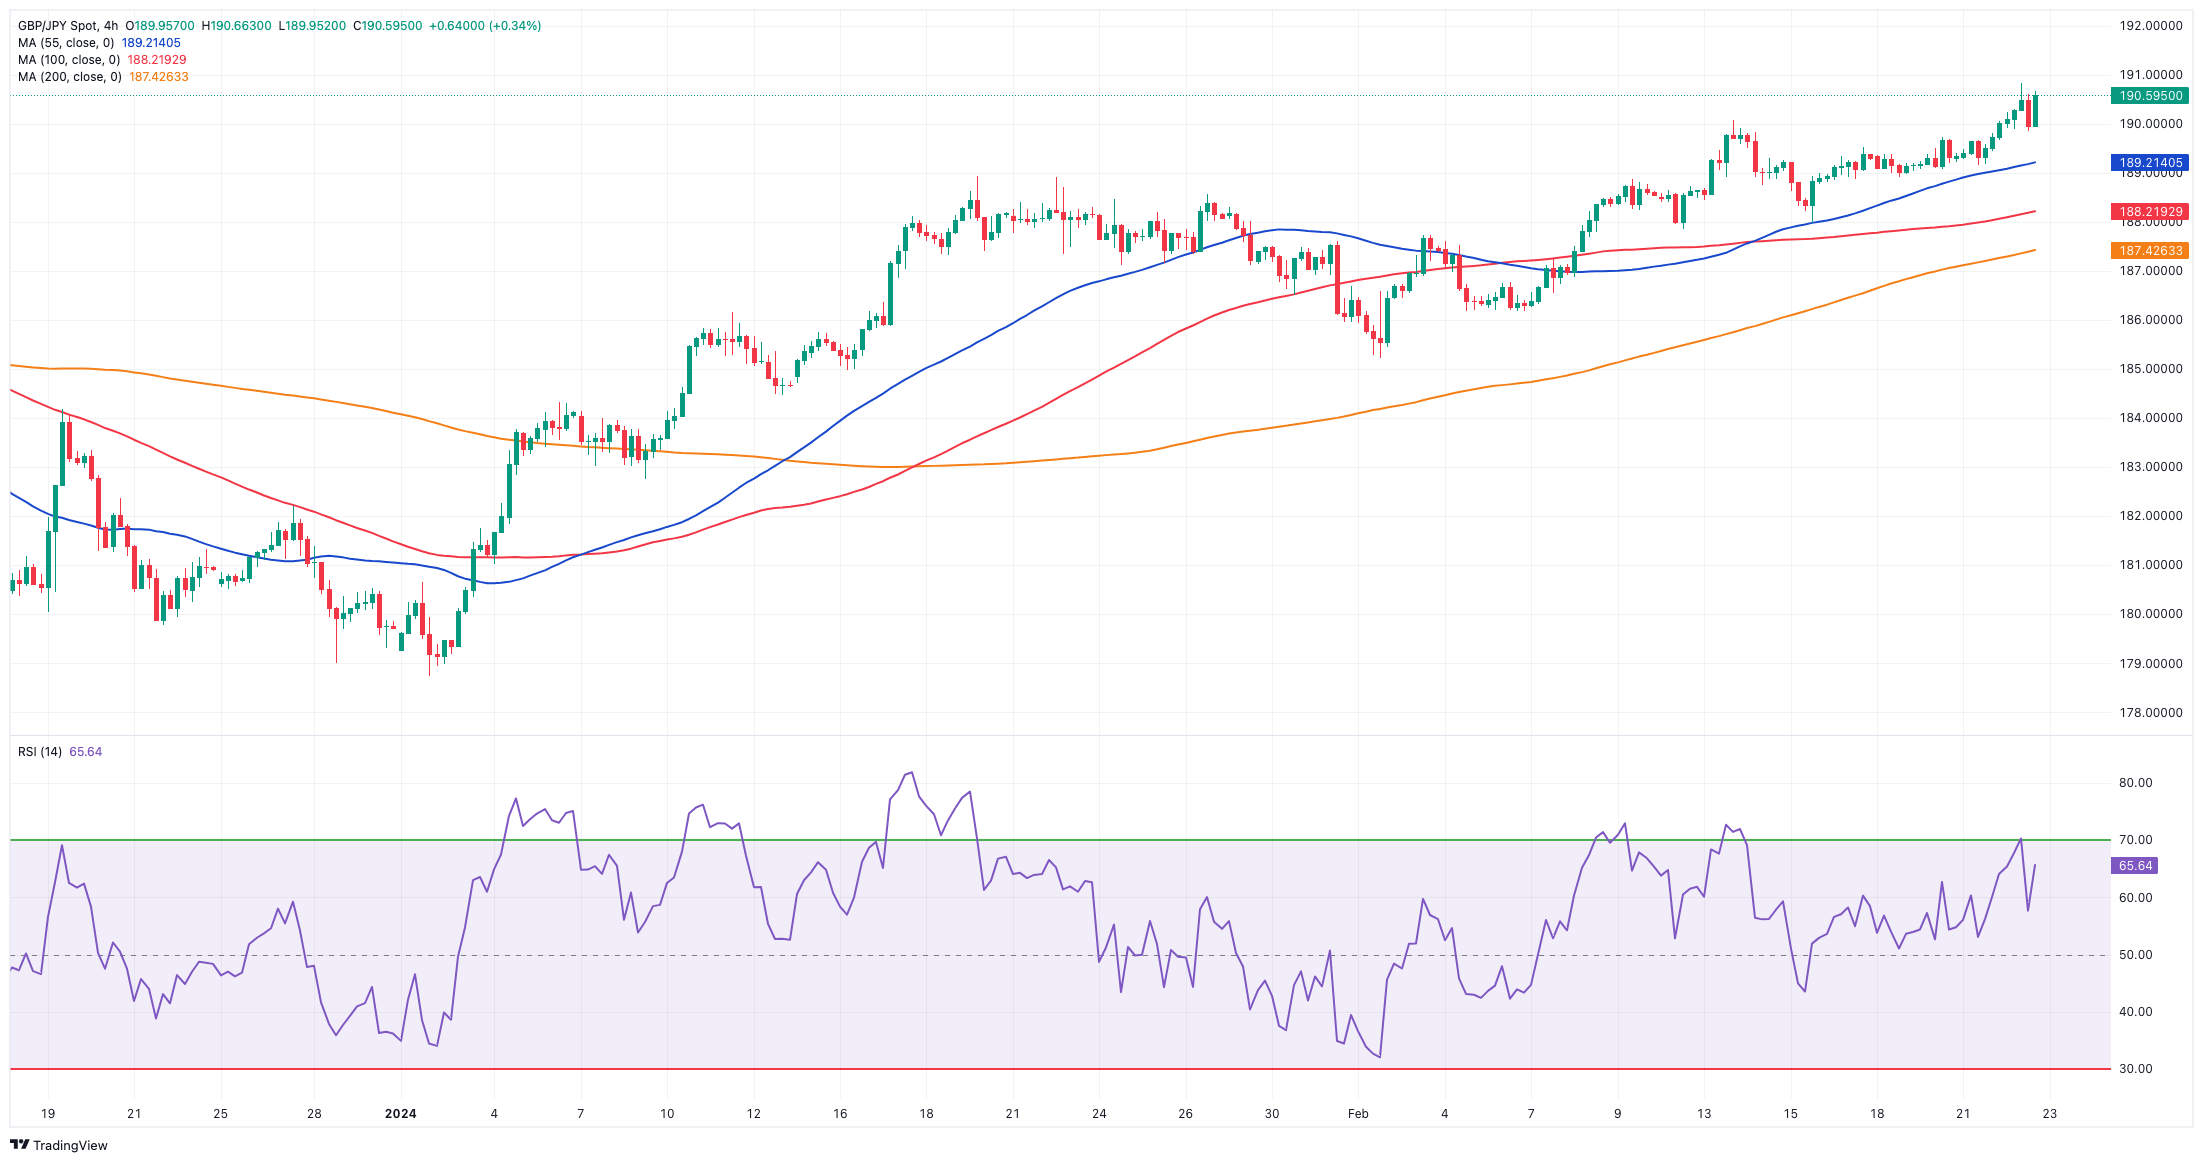
Further weakness in the Japanese currency in combination with the decent advance in the British pound helped GBP/JPY reach a new high around 190.85.
In fact, the cross clinched fresh tops in levels last seen in late August 2015 in the context of the prevailing appetite for risk-associated assets, advancing at the same time for the third straight session.
The next objective for GBP/JPY is the 2024 high of 190.84 (February 22), which comes ahead of the August 2015 top of 195.28 (August 18) and the record peak of 195.88 (June 24, 2015). If bears take control, spot may fall to its February low of 185.22 (February 1) before finding intermediate support at the 100-day SMA of 184.90. South of here is the more crucial 200-day SMA at 182.89, prior to the December 2023 low of 178.33 (December 14) and the October 2023 low of 178.03 (October 3). A further slide may provide a challenge to the July 2023 bottom of 176.30, which precedes the May 2023 low of 167.84 (May 11). The daily RSI rose over 68.
Resistance levels: 190.84 195.28 195.88 (4H chart)
Support levels: 187.99 186.18 185.22 (4H chart)
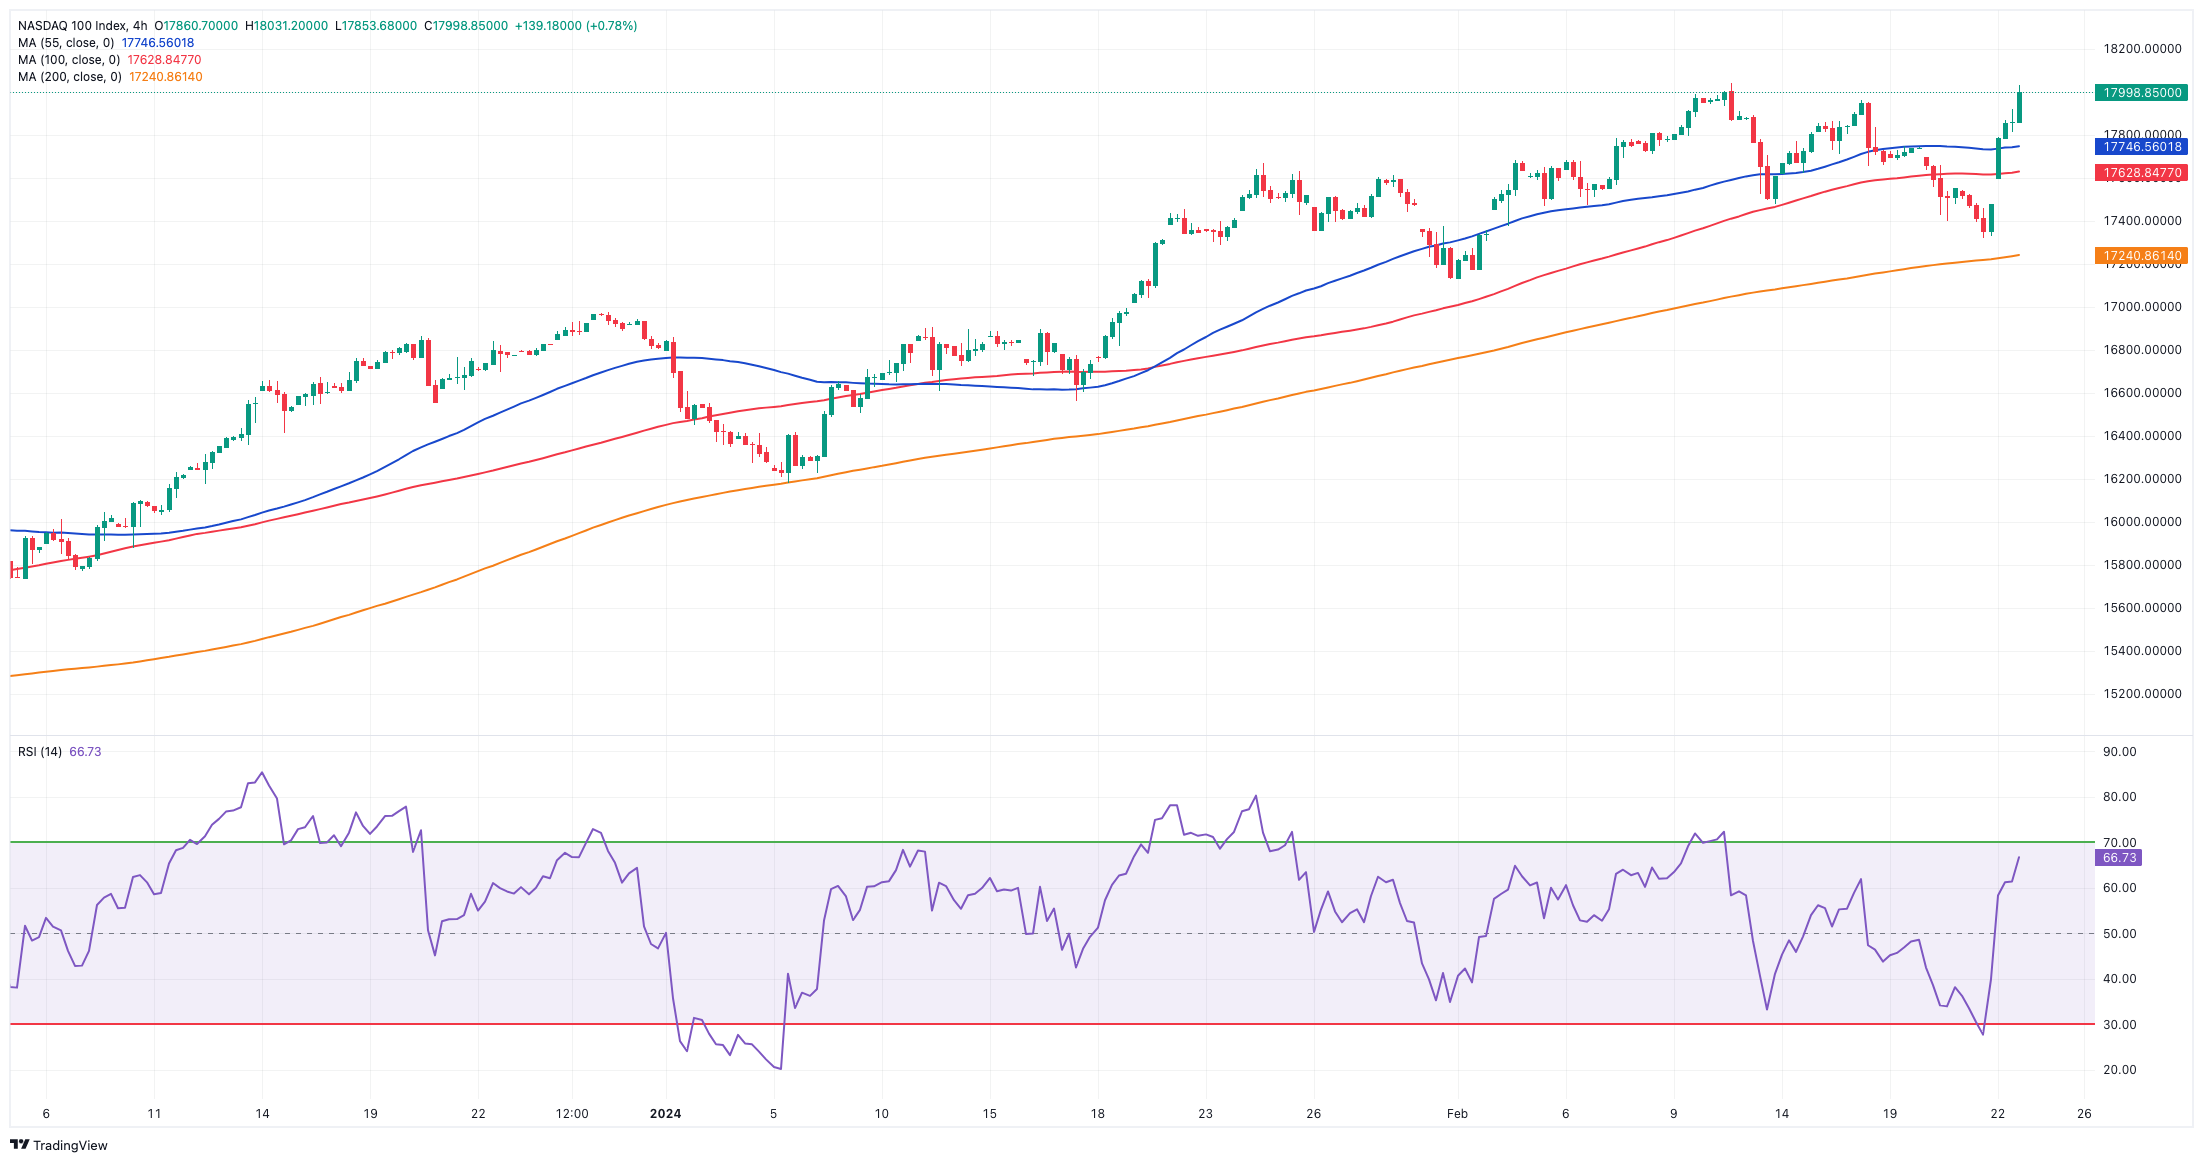
NASDAQ
The tech reference Nasdaq 100 reversed three consecutive daily losses and advanced to an all-time peak around the 18,030 zone on Thursday.
The strong reversal in the index came exclusively on the back of the positive surprise from Nvidia’s corporate earnings report published late on Wednesday.
In fact, the positive news from the chip maker seems to have prompted investors to stop worrying, at least temporarily, about the most-likely tighter-for-longer stance from the Fed.
Extra gains in the Nasdaq 100 targets the all-time high of 18,034 (February 22). Having said that, occasional bearish moves might see the index revisit the weekly low of 17,128 (January 31), which comes before the interim 55-day SMA of 17,002 and the 2024 low of 16,249 (January 5). If the index falls below this level, it may hit the December 2023 low of 15,695 (December 4) before reaching the critical 200-day SMA of 15,531. A breach of this level might result in a probable slide to the October 2023 low of 14,058 (October 26), before the April 2023 low of 12,724 (April 25), the March 2023 low of 11,695 (March 13), and the 2023 low of 10,696. (January 3). The daily RSI jumped past 63.
Top Gainers: Moderna, NVIDIA, AMD
Top Losers: Keurig Dr Pepper, CoStar, American Electric Power
Resistance levels: 18,041 (4H chart)
Support levels: 17,319 17,128 16,561 (4H chart)
All Information & Updates provided by:

All information relating to the financial markets available on this page has been prepared and issued by FXStreet (Forexstreet SL, Spain, Reg: B62498233) on the basis of publicly available information and all information believed to be reliable and does not conflict with Kuwaiti local laws, and all necessary care has been taken to before the company to ensure that the facts mentioned are correct from the source.
NCM Investment nor any of its directors or employees shall in any way be held responsible for the contents of this news, and the information contained on this page is intended only to provide clients with publicly available information and should not be construed as investment advice, report or analysis and/or constitute an offer or invitation to buy or sell financial instruments of any kind.
RISK WARNING: Forex and CFDs are highly risky leveraged products, as losses can exceed deposits. Please ensure you understand all the risks and take independent advice if necessary. NCM will segregate the clients based on the criteria of the regulator and its bylaws. NCM does not provide any advisory service; the material published does not constitute advice or a recommendation for a transaction in any financial instrument. NCM accepts no responsibility for any use of the content presented and any consequences of that use. Anyone acting on the information provided does so at their own risk.