
- Contact Us:
-

-

-

-


Daily Market Updates
26 Feb 2024
EURUSD
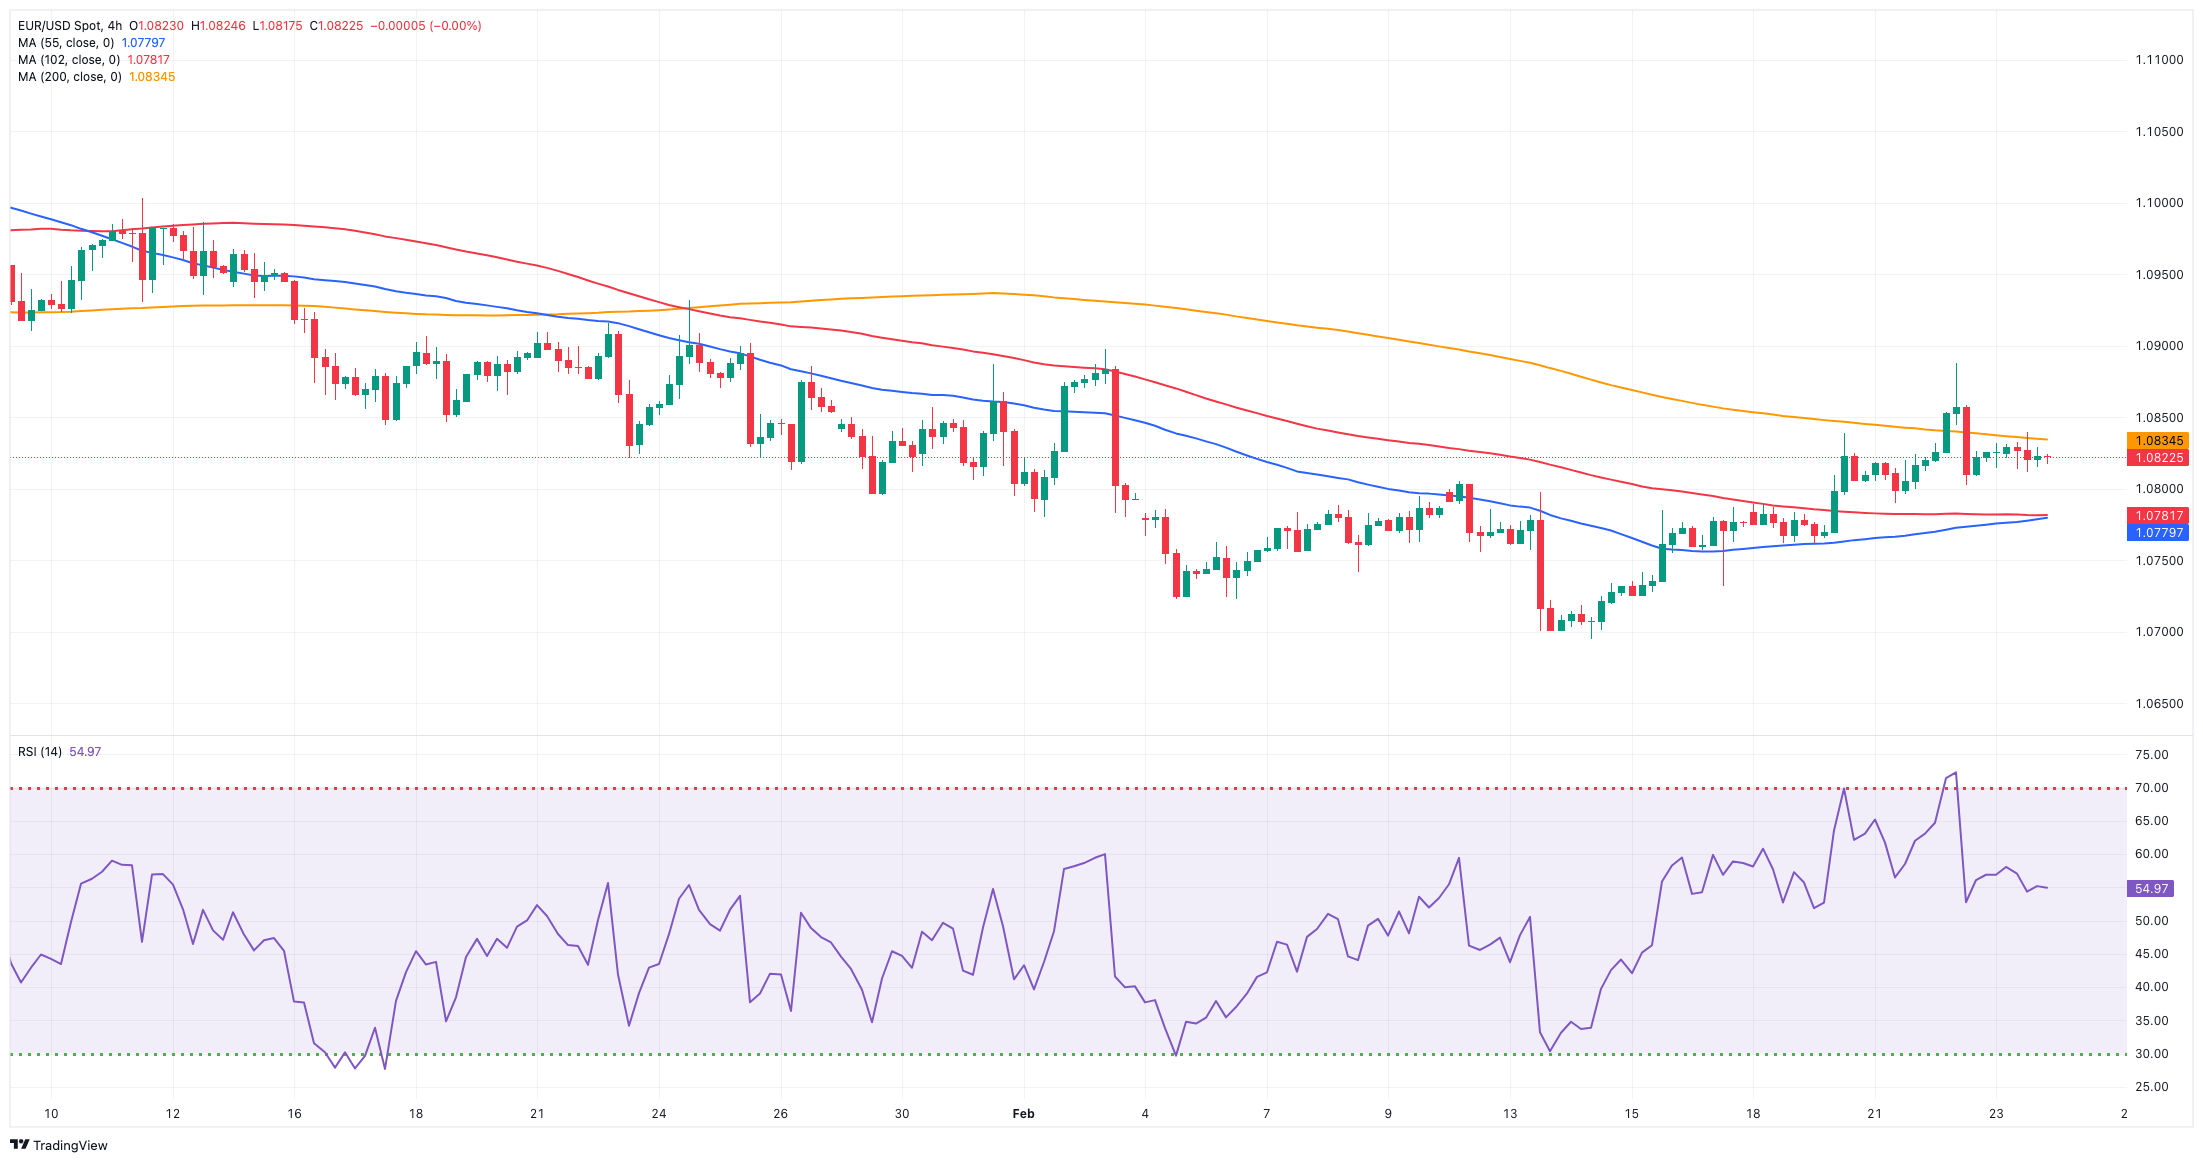
EUR/USD closed the week marginally down around 1.0820, although it finally managed to print the first week of gains after five consecutive declines.
On the other side of the equation, the USD Index (DXY) gyrated around the 104.00 zone after dropping to three-week lows, as investors seem to have already factored in a probable interest rate cut by the Fed at the June 12 event.
On the latter, CME Group’s FedWatch Tool sees the probability of such a scenario at around 55% and remains propped up by hawkish Fedspeak and strong US fundamentals, at a time when investors shifted their focus to the release of inflation figures tracked by the PCE and due next week.
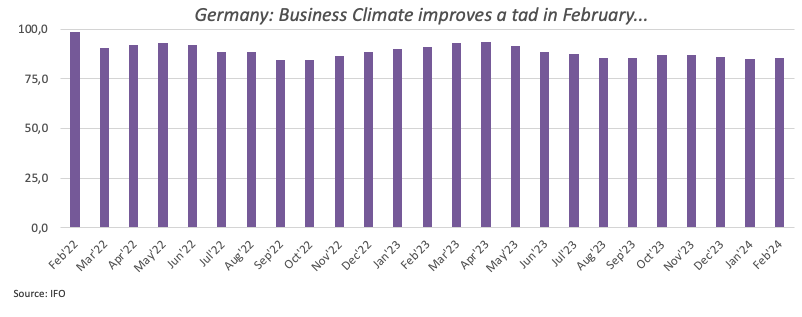
Initial support for the European currency also came after Germany’s Business Climate tracked by the IFO institute improved marginally to 85.5 for the current month. Additionally, the final GDP Growth Rate saw the German economy contract by 0.3% QoQ in the October–December period and by 0.2% over the last twelve months.
Around the ECB, Board members Simkus and Stournaras ruled out a rate cut in March and even April, while their colleague Muller said he needed to assess wage data in Q1 before deciding on rates.
Further upside momentum could prompt EUR/USD to test the weekly high of 1.0888 (February 22), which is supported by the temporary 55-day SMA. North from here comes the weekly tops of 1.0932 (January 24) and 1.0998 (January 5, 11). The breakout in this region reveals the December 2023 peak of 1.1139 (December 27), which is supported by the 200-week SMA of 1.1148 and comes before the 2023 high of 1.1275 (July 18). In the other direction, the 2024 low of 1.0694 (February 14) comes next, then the weekly low of 1.0495 (October 13, 2023), the 2023 low of 1.0448 (October 3), and the round level of 1.0400. The daily RSI deflated modestly to the 50 region.
Resistance levels: 1.0888 1.0897 1.0932 (4H chart)
Support levels: 1.0761 1.0732 1.0694 (4H chart)
USDJPY
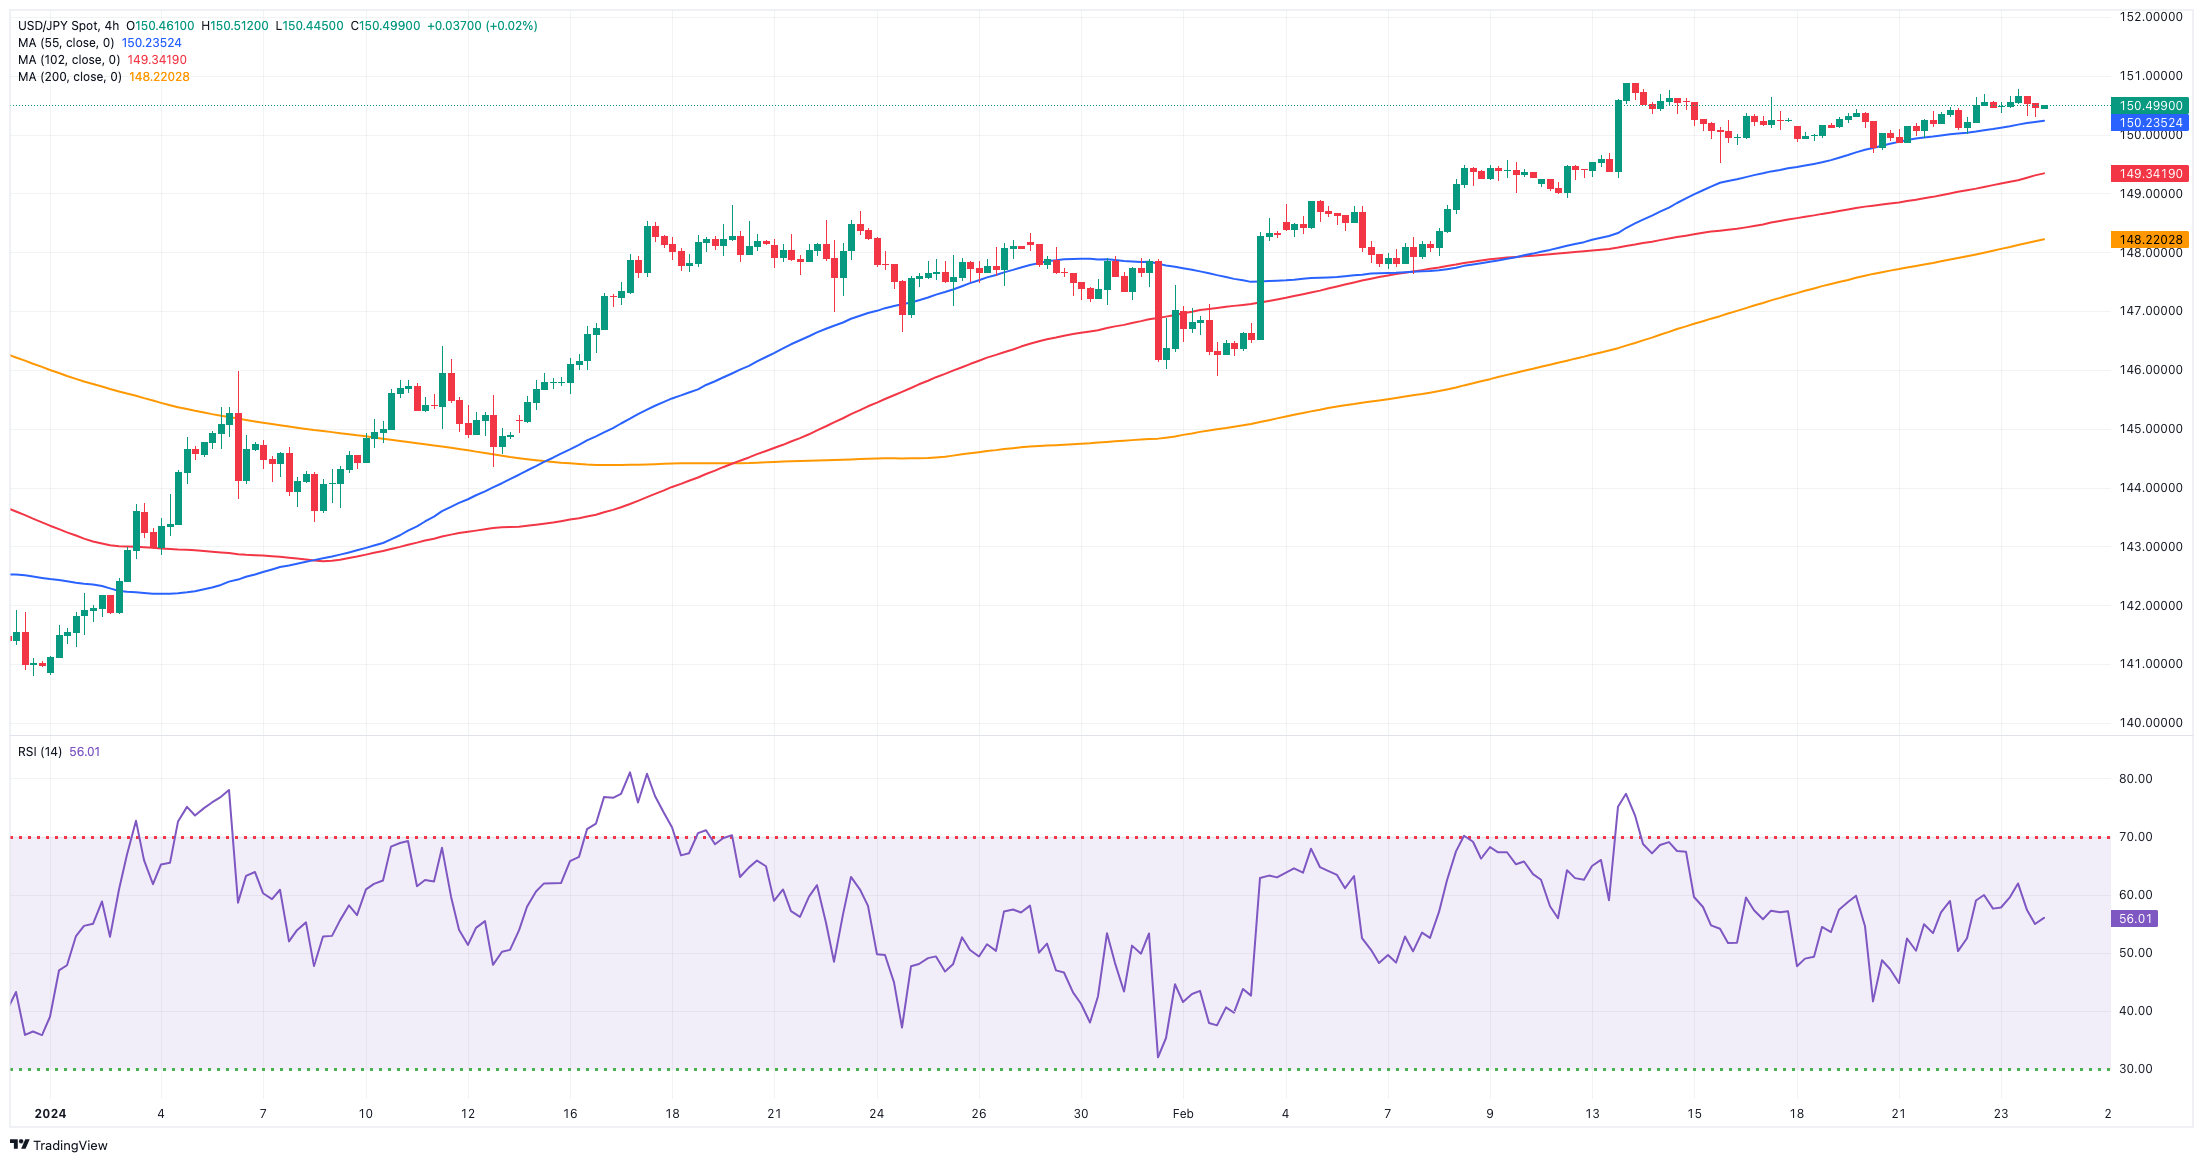
Despite Friday’s marginal knee-jerk, USD/JPY managed well to maintain the trade above the key 150.00 hurdle, extending its positive streak for the fourth week in a row.
The daily retracement in spot was accompanied by another irresolute session in the greenback in combination with a marked decline in US yields across the board.
In the Japanese money market, JGB 10-year yields extended their side-lined mood above 0.70%.
So far, market participants have not responded to the recent hawkish remarks made by BoJ Governor K. Ueda. During his testimony before the parliament on Thursday, Ueda highlighted that the country's inflation was steadily rising as a result of a tight labour market leading to wage growth. He reiterated the bank's confidence that conditions necessary for ending negative interest rates were coming together.
There were no scheduled releases in “The Land of the Rising Sun” on Friday.
If bulls recover the lead, USD/JPY may hit its 2024 top of 150.88 (February 13), ahead of the 2023 peak of 151.90 (November 13). Further north, the 2022 high of 151.94 (October 21) is closely followed by the round number of 152.00. On the contrary, there is temporary contention at the 100-day and 55-day SMAs at 147.67 and 146.27, respectively, prior to the February low of 145.89 (February 1). The critical 200-day SMA at 145.64 comes before the December 2023 low of 140.24 (December 28), the round number of 140.00, and the July low of 137.23 (July 14). The daily RSI retreated to the are below 65.
Resistance levels: 150.88 151.43 151.90 (4H chart)
Support levels: 149.68 148.92 147.61 (4H chart)
GBPUSD
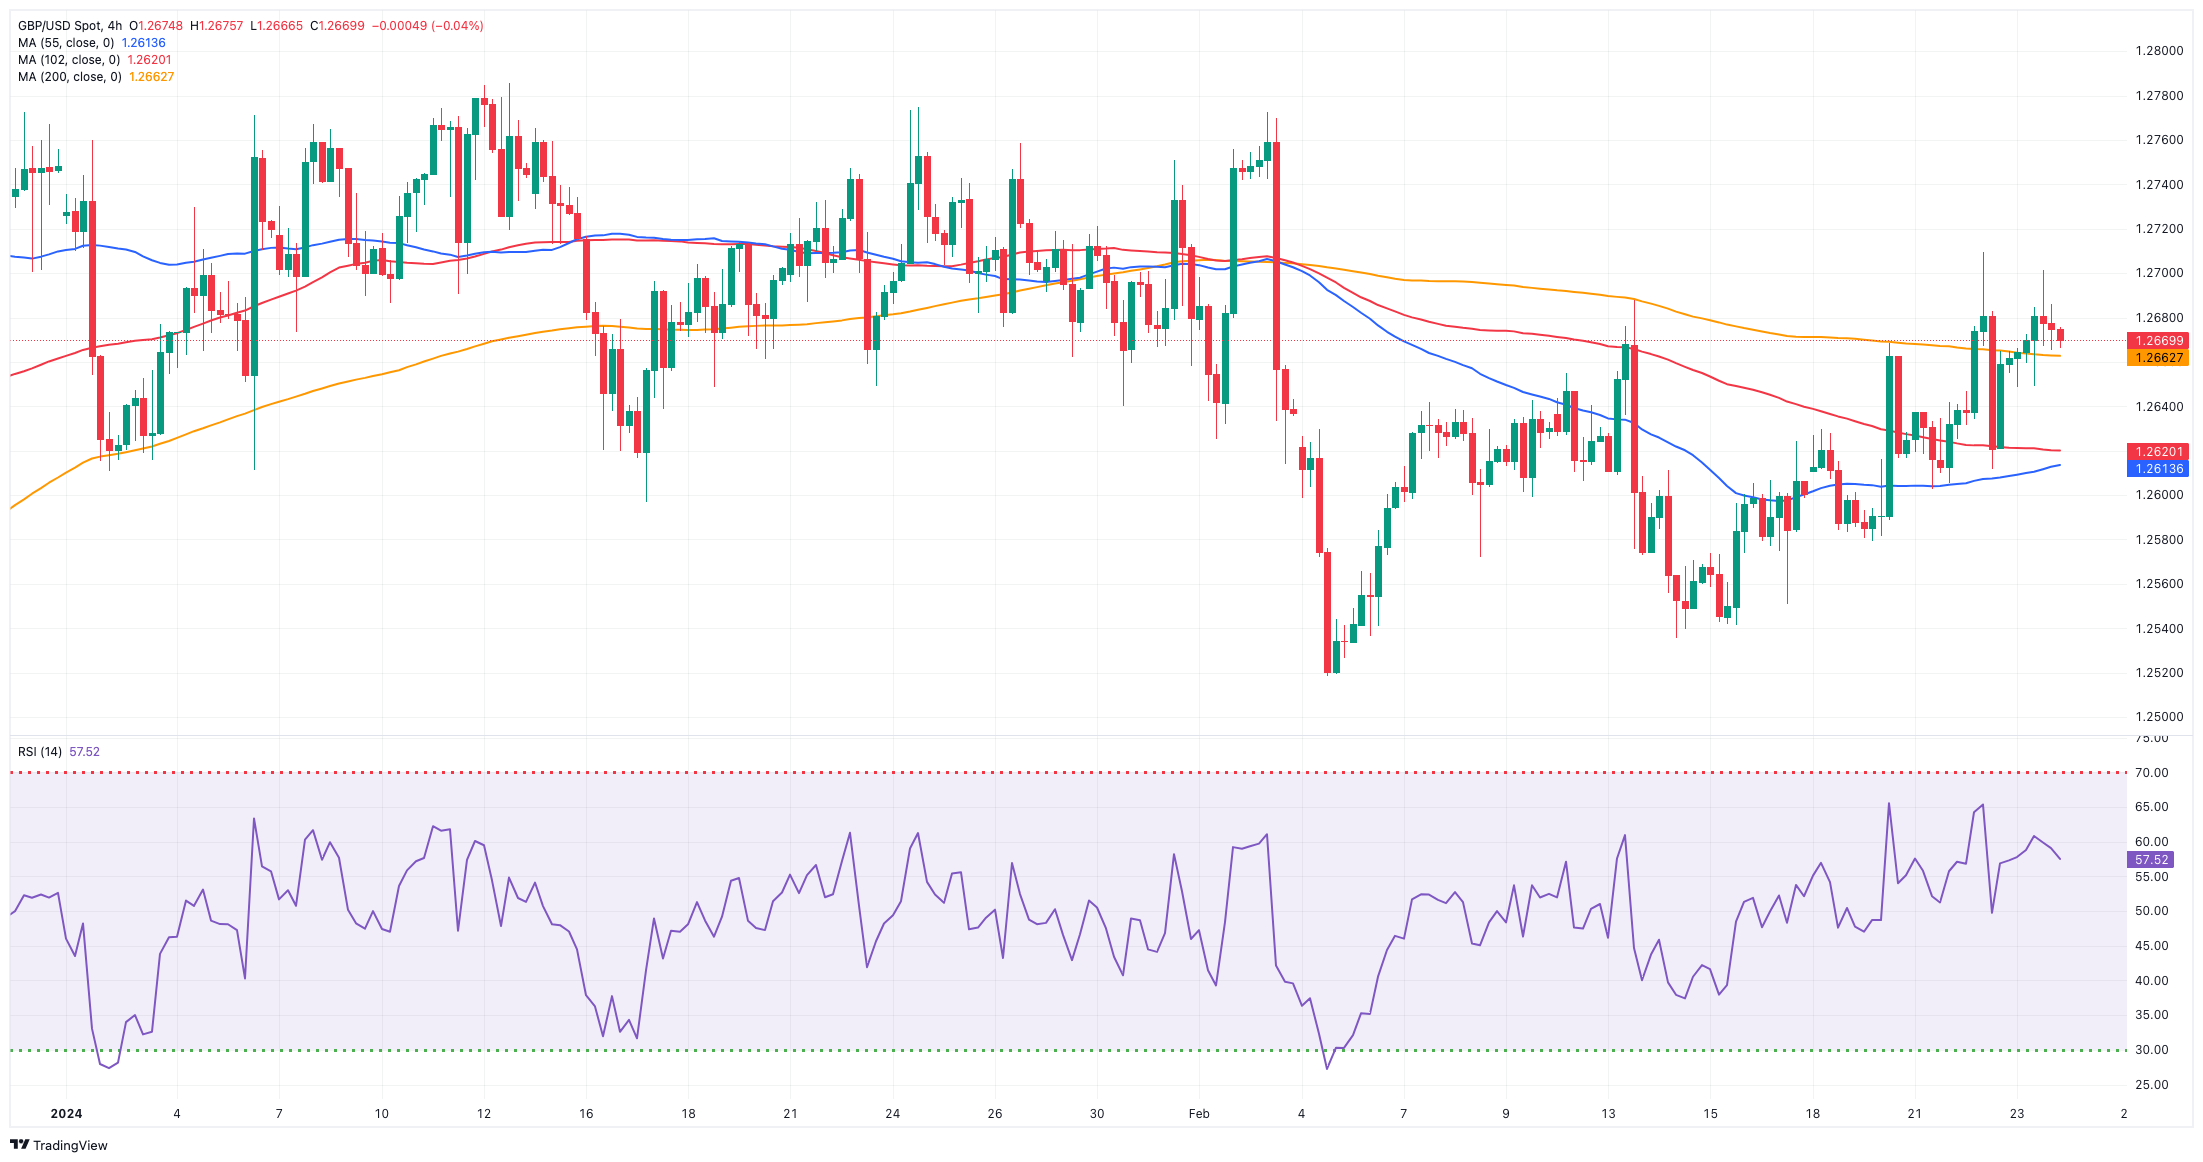
A very positive week for the British pound and risk-linked assets in general saw GBP/USD clinch its fourth straight session of gains on Friday, briefly challenging the key 1.2700 hurdle once again.
The persevering weakness in the dollar allowed Cable to extend its recovery from last week’s lows around 1.2540, gaining more than a cent and getting ready for a potential assault on the 1.2700 milestone sooner rather than later.
In the UK, Consumer Confidence measured by GfK receded to -21 in February. Nevertheless, consumer confidence surpasses levels from a year ago, indicating a promising outlook for consumer spending in the UK.
Furthermore, the enhanced economic prospects have diminished expectations for easing by the BoE, with the market indicating a negligible probability of a rate cut on March 21, gradually increasing to 15% on May 9 and 45% on June 20. A rate cut is not fully anticipated until August 1.
Further gains in the GBP/USD target the weekly high of 1.2709 (February 22), ahead of the February top of 1.2772 (February 2) and the 2024 peak of 1.2785 (January 12). The latter's breach might lead to a dispute of the December high of 1.2827 (December 28), then the weekly top of 1.2995 (July 27, 2023), and the key 1.3000 yardstick. On the downside, the initial target is the 2024 low of 1.2518 (February 5), just ahead of the December 2023 low of 1.2500 (December 13), both of which are supported by the proximity of the intermediate 100-day SMA (1.2521). Further weakness may force spot to turn its emphasis to the weekly bottom of 1.2187 (November 10, 2023), before the October 2023 low of 1.2037 (October 3), and the critical 1.2000 mark, all preceding the 2023 low of 1.1802 (March 8). The day-to-day RSI climbed past 53.
Resistance levels: 1.2709 1.2772 1.2827 (4H chart)
Support levels: 1.2579 1.2518 1.2500 (4H chart)
GOLD
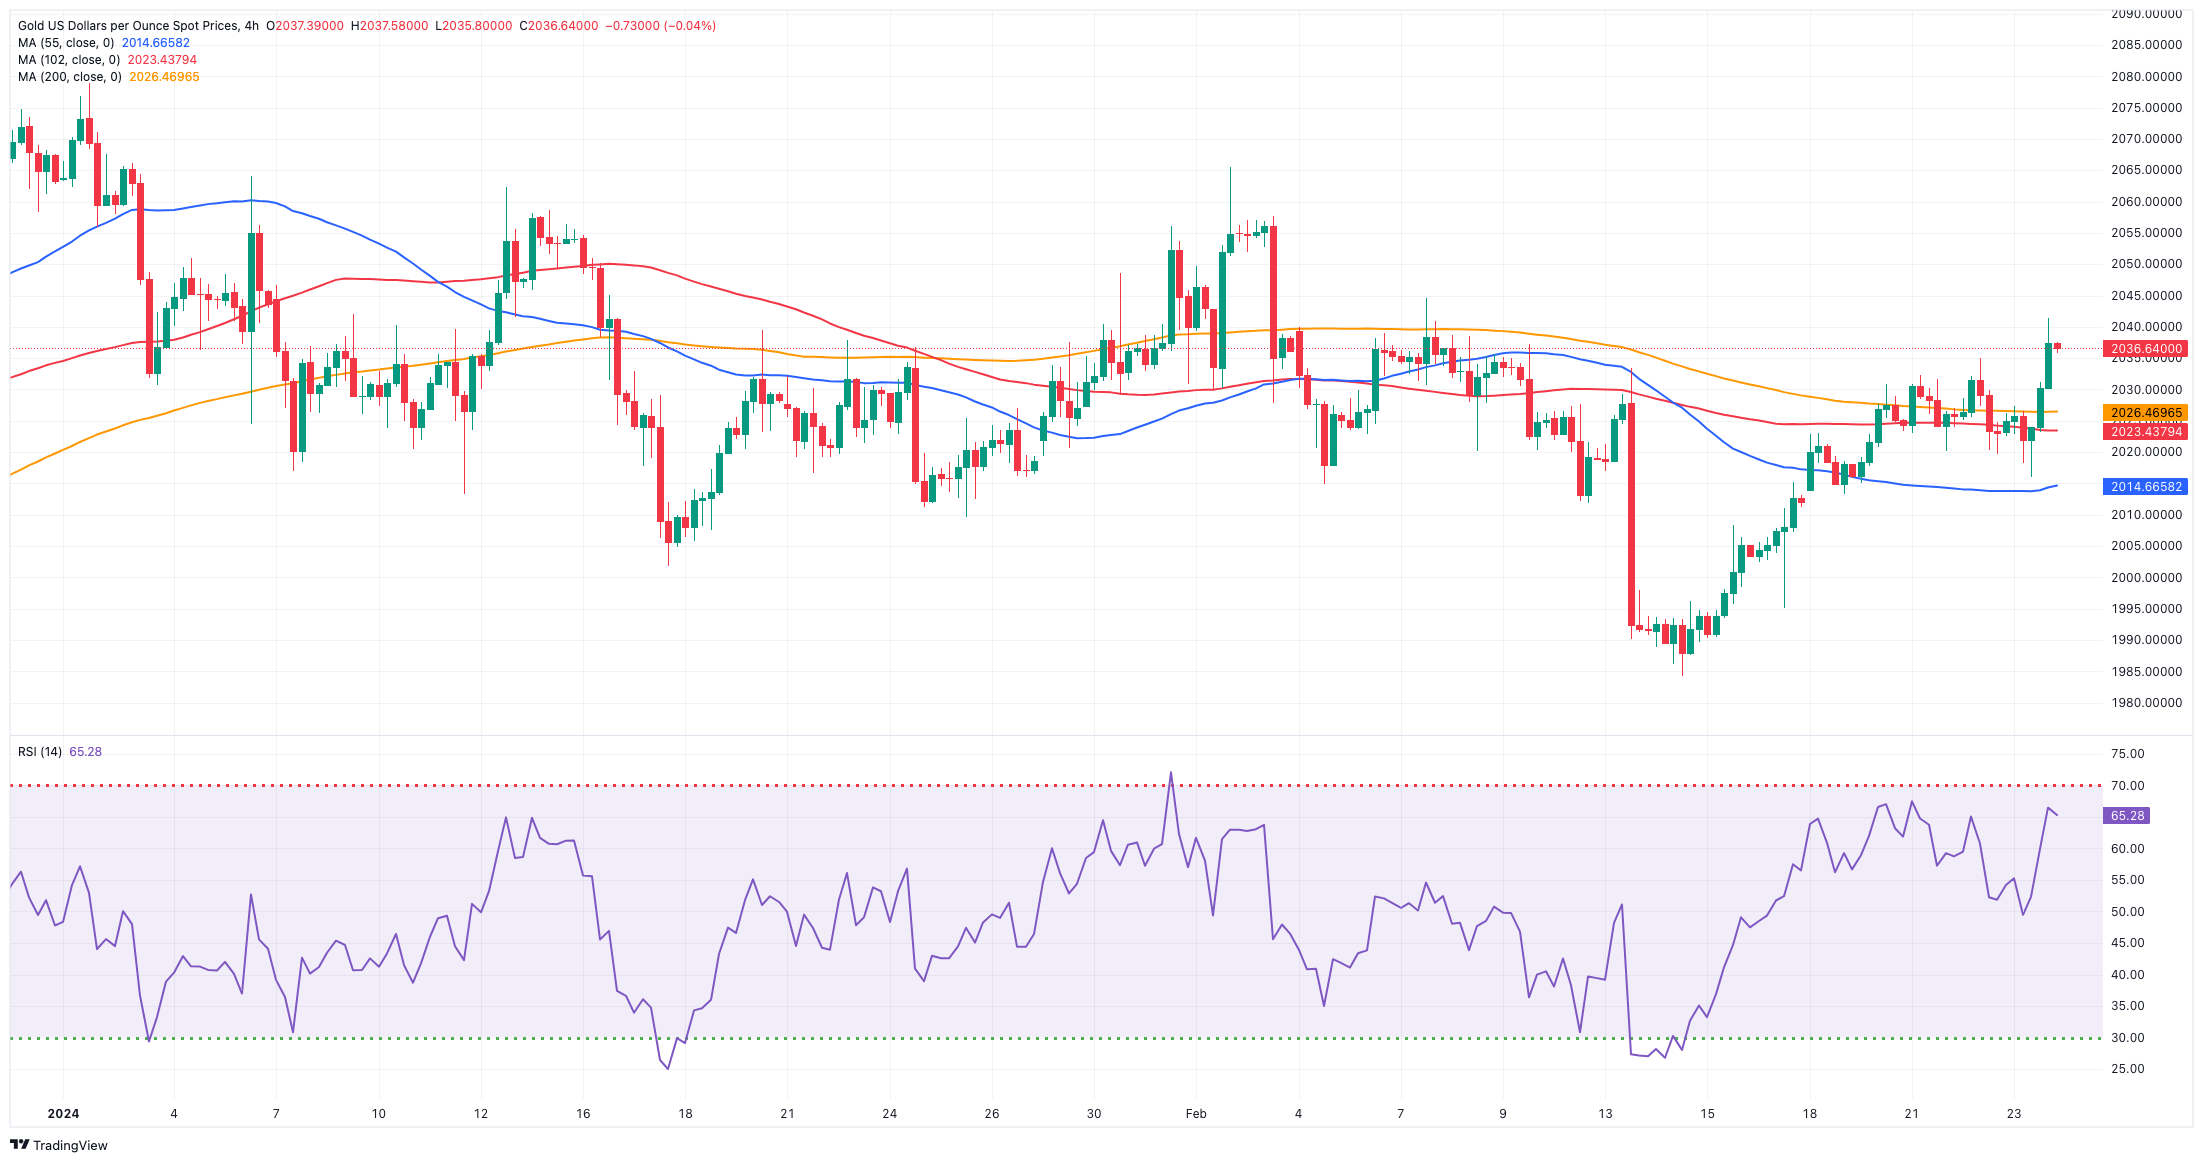
Gold prices rose to fresh two-week highs just above the $2,040 mark per troy ounce at the end of the week.
The continuation of the weekly recovery in the precious metal was accompanied by another session of directionless price action in the greenback, while the corrective decline in US yields across different timeframes also collaborated with the daily uptick.
Looking ahead, there's an increasing anticipation for heightened scrutiny of the yellow metal preceding the publication of US inflation data monitored by the PCE on March 1. This comes amidst ongoing speculation about the Fed potentially delaying the execution of its easing measures until its June meeting (or beyond).
Extra bounce may push gold back to its February peak of $2,065 (February 1), ahead of the weekly high of $2,088 (December 28) and all-time top of $2,150 (December 4, 2023). On the flip side, the initial downside target is the 2024 low of $1,984 (February 14), followed by the December 2023 low of $1,973, which is supported by its proximity to the critical 200-day SMA at $1,965. A deeper slide might refocus attention on the November 2023 low of $1,931, prior to the October 2023 low of $1,810, the 2023 low of $1,804, and the $1,800 contention zone.
Resistance levels: $2,041 $2,065 $2,078 (4H chart)
Support levels: $1,984 $1,973 $1,965 (4H chart)
CRUDE WTI
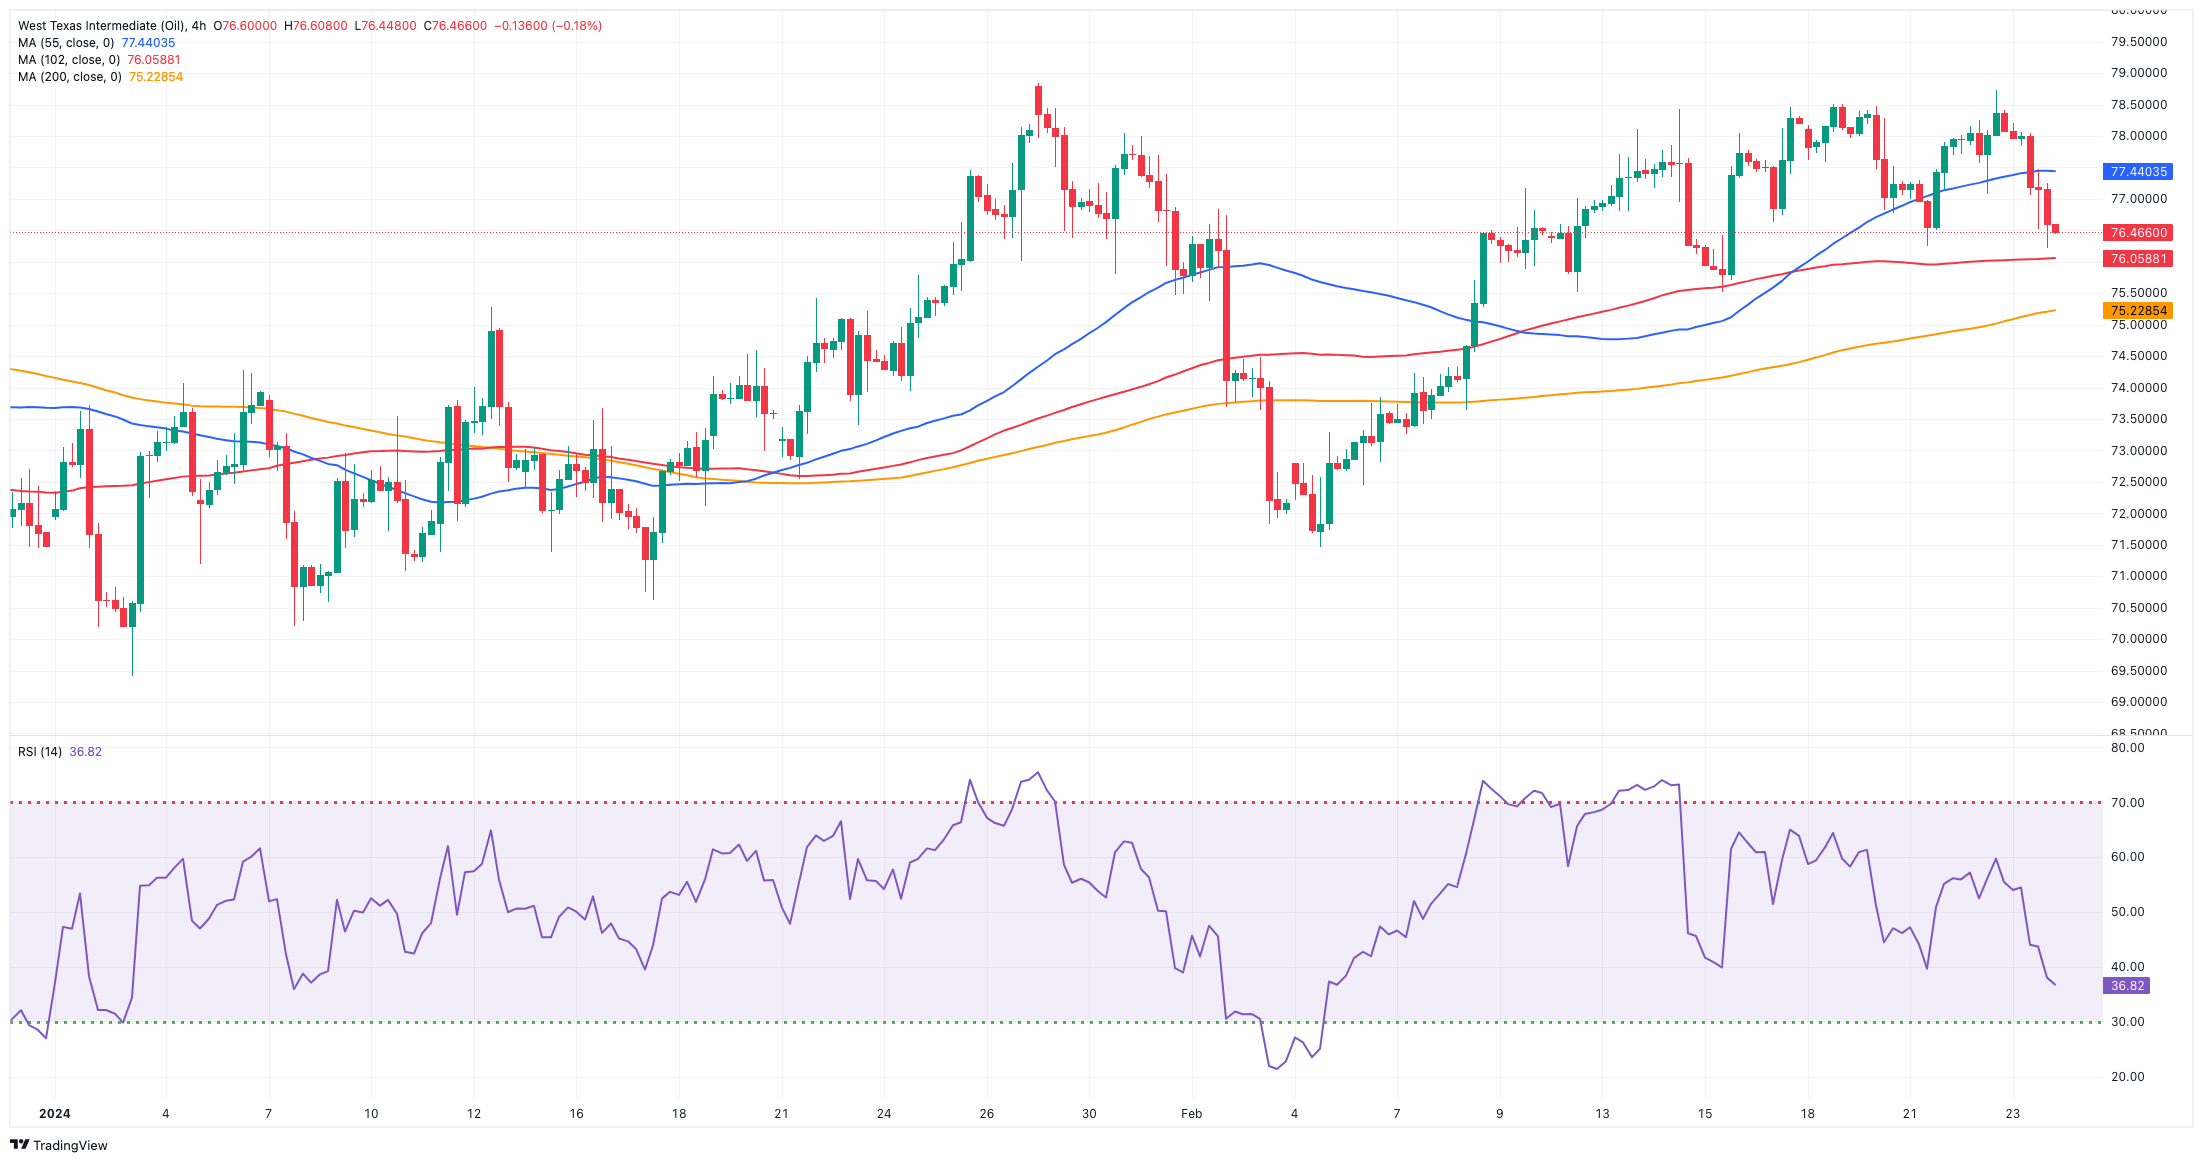
Prices of the American reference for sweet light crude oil retreated markedly on Friday, coming down to the $76.40 zone and eventually closing the first week of losses after two consecutive advances.
In fact, crude oil reacted negatively to persistent speculation that the Fed might delay even more the start of its easing cycle, a view that has been further reinforced by Fed officials as well as by strong fundamentals.
Adding to the sour sentiment among traders emerged talks of a potential ceasefire in the Israel-Hamas conflict, which should somewhat alleviate geopolitical concerns despite the unabated crisis in the Red Sea.
In the docket, driller Baker Hughes said the US oil rig count went up by 6 to 503 total active oil rigs in the week to February 23.
The next upward obstacle for WTI is the February high of $78.88 (February 22), which comes ahead of the 2024 top of $79.25 (January 29) and the critical $80.00 barrier, all before the November 2023 peak of $80.15 (November 3). Extra gains from here may propel the commodity back to its weekly high of $89.83 (October 18, 2023), prior to the 2023 top of $94.99 (September 28, 2023), the August 2022 peak of $97.65 (August 30), and the psychological $100.00 mark. Just the opposite, the loss of the February low of $71.43 (February 5) may bring the critical $70.00 barrier back into play, followed by the 2024 bottom of $69.31 (January 3).
Resistance levels: $78.88 $79.25 $79.56 (4H chart)
Support levels: $76.29 $75.49 $71.37 (4H chart)
GER40
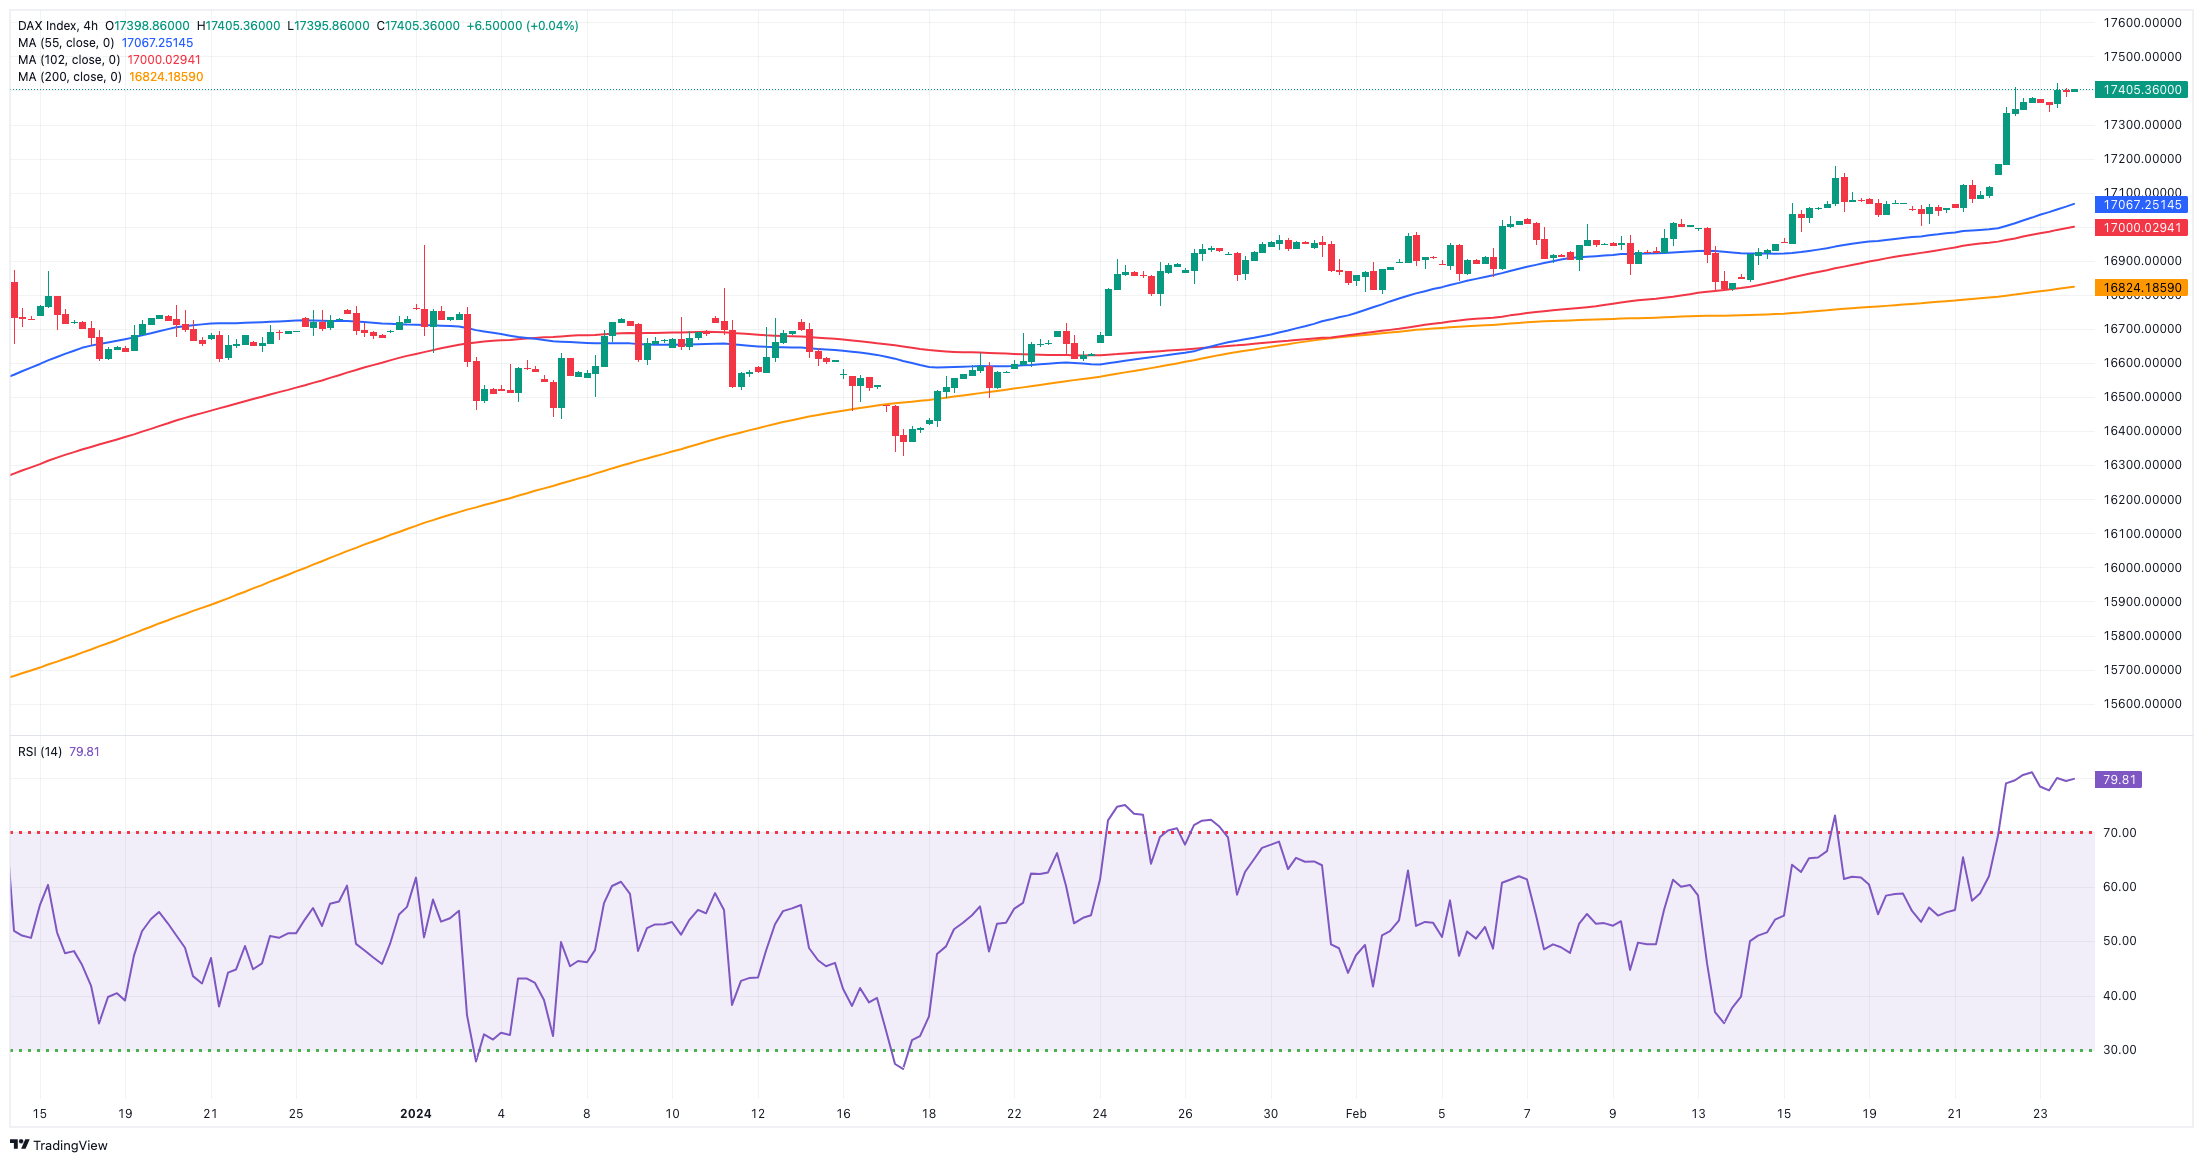
Germany’s stick reference DAX40 advanced for the third straight session and reached a new record high near the 17,500 region at the end of the week.
The continuation of the march north in German equities followed the generalized optimism around the tech sector on both sides of the Atlantic, particularly after the release of a stronger-than-expected earnings report from chip maker Nvidia.
Contrasting with the prevailing upbeat mood, ECB President C. Lagarde remarked on Friday that while Q4 wage growth data appear relatively benign, they are still insufficient to instill confidence in the central bank regarding the defeat of inflation.
In the same line, Bundesbank President J. Nagel cautioned against the early reduction of interest rates by the ECB, particularly prior to the release of crucial wage data in the April-June period.
Regarding the domestic bond market, 10-year bund yields added to Thursday’s retracement and approached 2.35%.
The DAX40's next upward hurdle is its all-time peak at 17,443 (February 23). The other way around, the February low of 16,821 (February 1) provides immediate contention and seems to be backed up by the transitory 55-day SMA of 16,813. The breakdown of this zone may bring back into focus the 2024 bottom at 16,345 (January 17), before the key 200-day SMA at 16,040. A further drop may revisit the weekly low of 15,915 (November 28), followed by the October 2023 low of 14,630 (October 23) and the March 2023 low of 14,458 (March 20). The daily RSI rose past 71, entering the overbought zone.
Best Performers: Rheinmetall AG, Siemens AG, Dr Ing hc F Porsche Prf
Worst Performers: Allianz, Infineon, Siemens Energy AG
Resistance levels: 17,443 (4H chart)
Support levels: 16,831 16,685 16,345 (4H chart)
GBPJPY
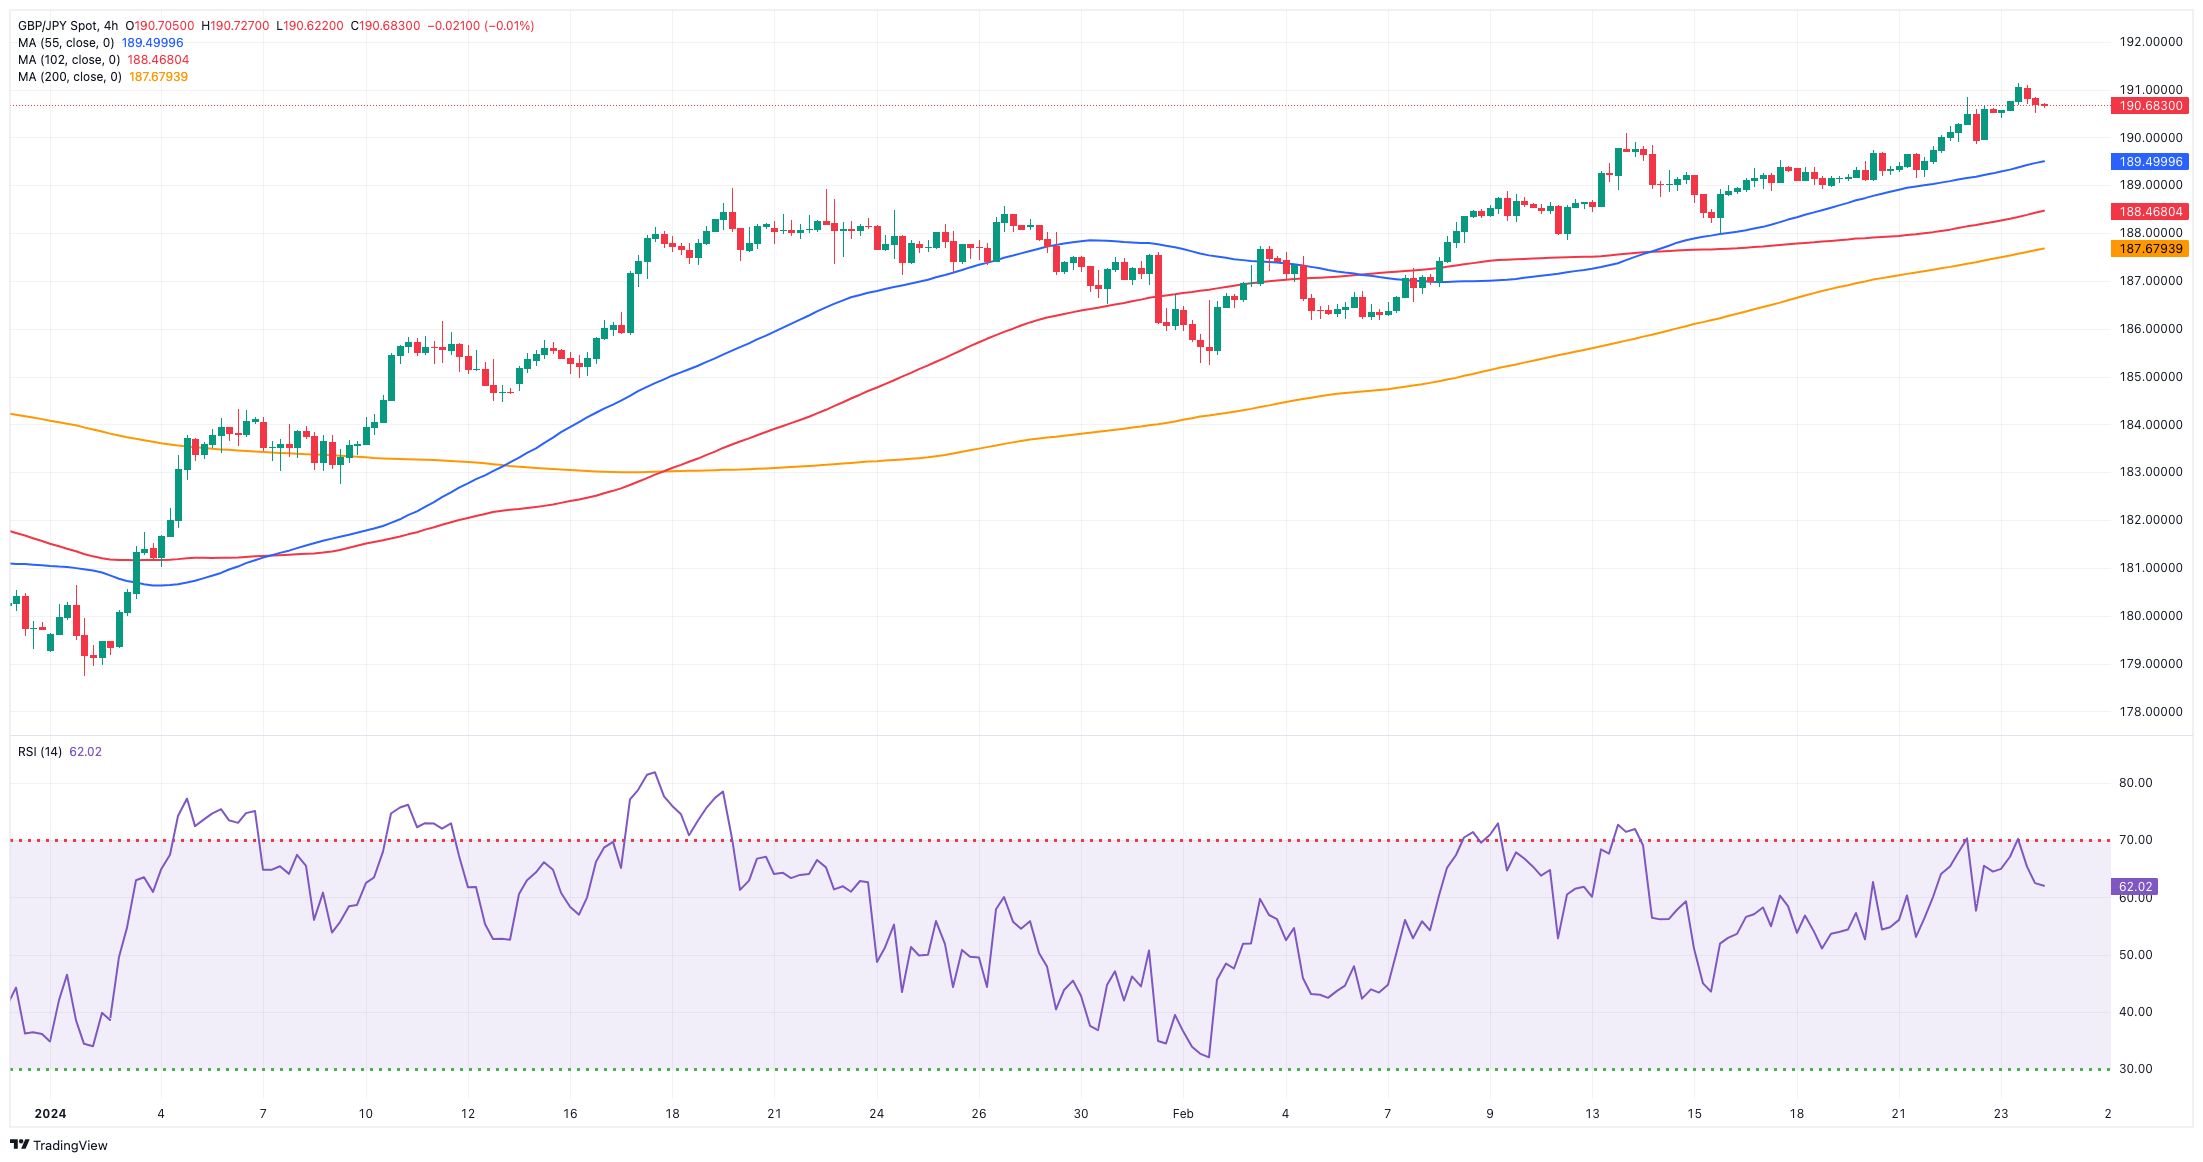
Once again, the prevailing risk-on mood lent legs to GBP/JPY and lifted it to a new 2024 peak beyond the 191.00 milestone at the end of the week.
Renewed JPY selling in combination with the intense upside bias in the British pound helped the cross reach levels last seen in the summer of 2015, advancing for the fourth consecutive session and closing its third week in a row of gains.
The following target for GBP/JPY is the 2024 high of 191.14 (February 23), which comes ahead of the August 2015 top of 195.28 (August 18) and the record peak of 195.88 (June 24, 2015). Occasional bearish attempts should motivate the cross to revisit its February low of 185.22 (February 1) before finding intermediate support at the 100-day SMA of 185.00. South of here is the more critical 200-day SMA at 182.98, preceding the December 2023 bottom of 178.33 (December 14) and the October 2023 low of 178.03 (October 3). A further decline may provide a challenge to the July 2023 bottom of 176.30, which comes before the May 2023 low of 167.84 (May 11). The everyday RSI soared over 68.
Resistance levels: 191.14 195.28 195.88 (4H chart)
Support levels: 189.85 188.90 187.99 (4H chart)
NASDAQ
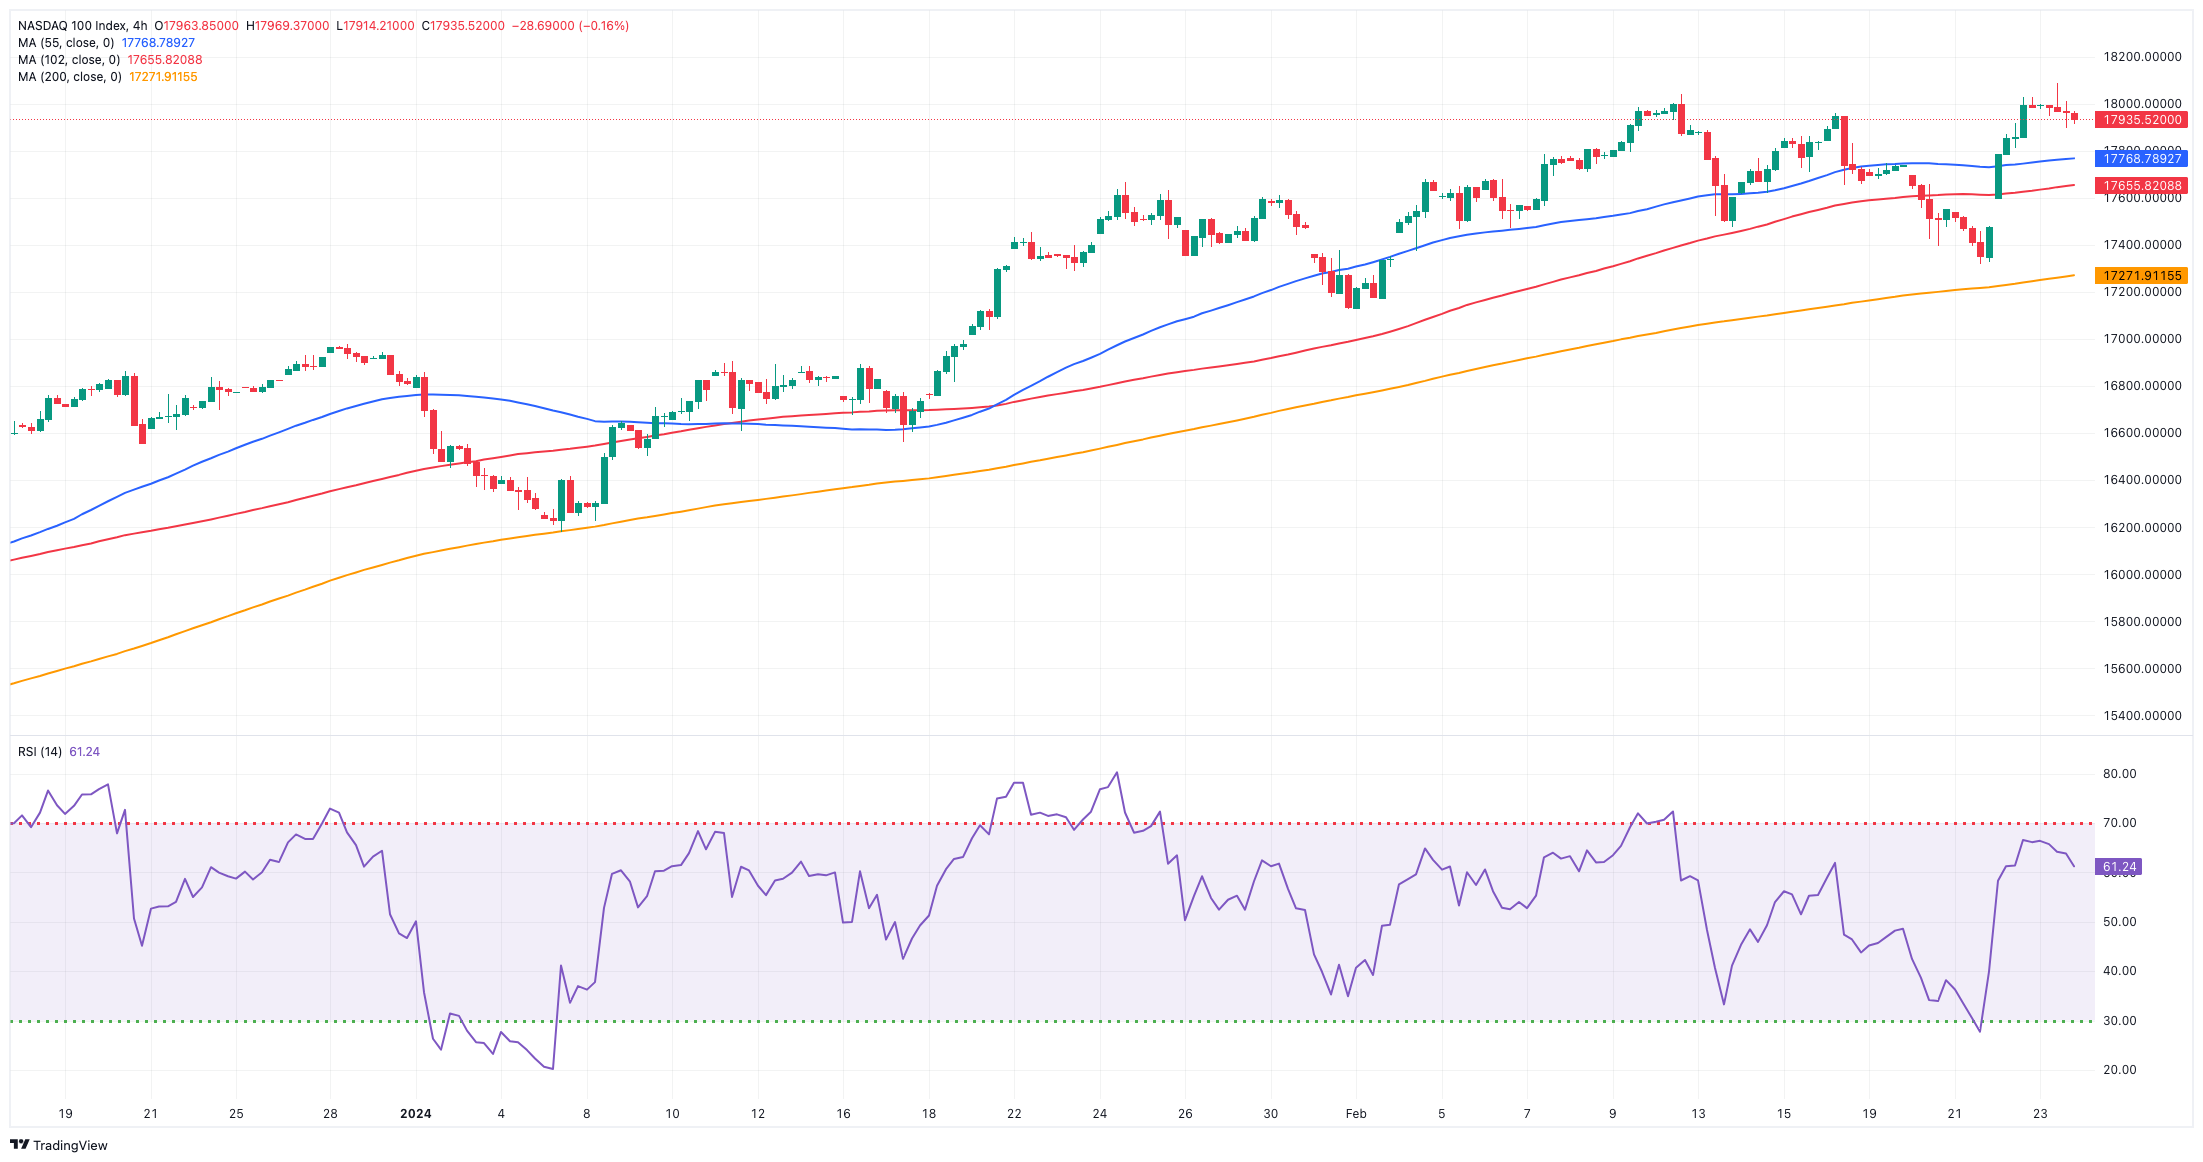
The Nasdaq 100 ended the week slightly on the defensive following a corrective move after hitting a new record high near the 18,100 region on Friday.
Despite daily losses, the tech index closed the week with gains and reversed the previous weekly decline, always underpinned by the increasing buying interest around AI-related stocks, which was reinvigorated in response to Nvidia’s stellar earnings report.
Regarding the chip maker, it is worth mentioning that it achieved a market capitalization milestone, reaching $2 trillion for the first time on Friday.
Additional increases on the Nasdaq 100 target the all-time high of 18,091 (February 23). Instead, infrequent bearish swings may see the index retest the weekly lows of 17,319 (February 21) and 17,128 (January 31), which come before the transitory 55-day SMA of 17,039 and the 2024 low of 16,249 (January 5). The breach of the latter might spark a move to the December 2023 low of 15,695 (December 4) before reaching the key 200-day SMA of 15,554. Down from here emerges the October 2023 low of 14,058 (October 26), followed by the April 2023 low of 12,724 (April 25), the March 2023 low of 11,695 (March 13), and the 2023 low of 10,696 (January 3). The daily RSI dropped to the sub-61 area.
Top Gainers: Palo Alto Networks, Zscaler, Copart
Top Losers: MercadoLibre, Booking, Warner Bros Discovery
Resistance levels: 18,091 (4H chart)
Support levels: 17,319 17,128 16,561 (4H chart)
DOW JONES
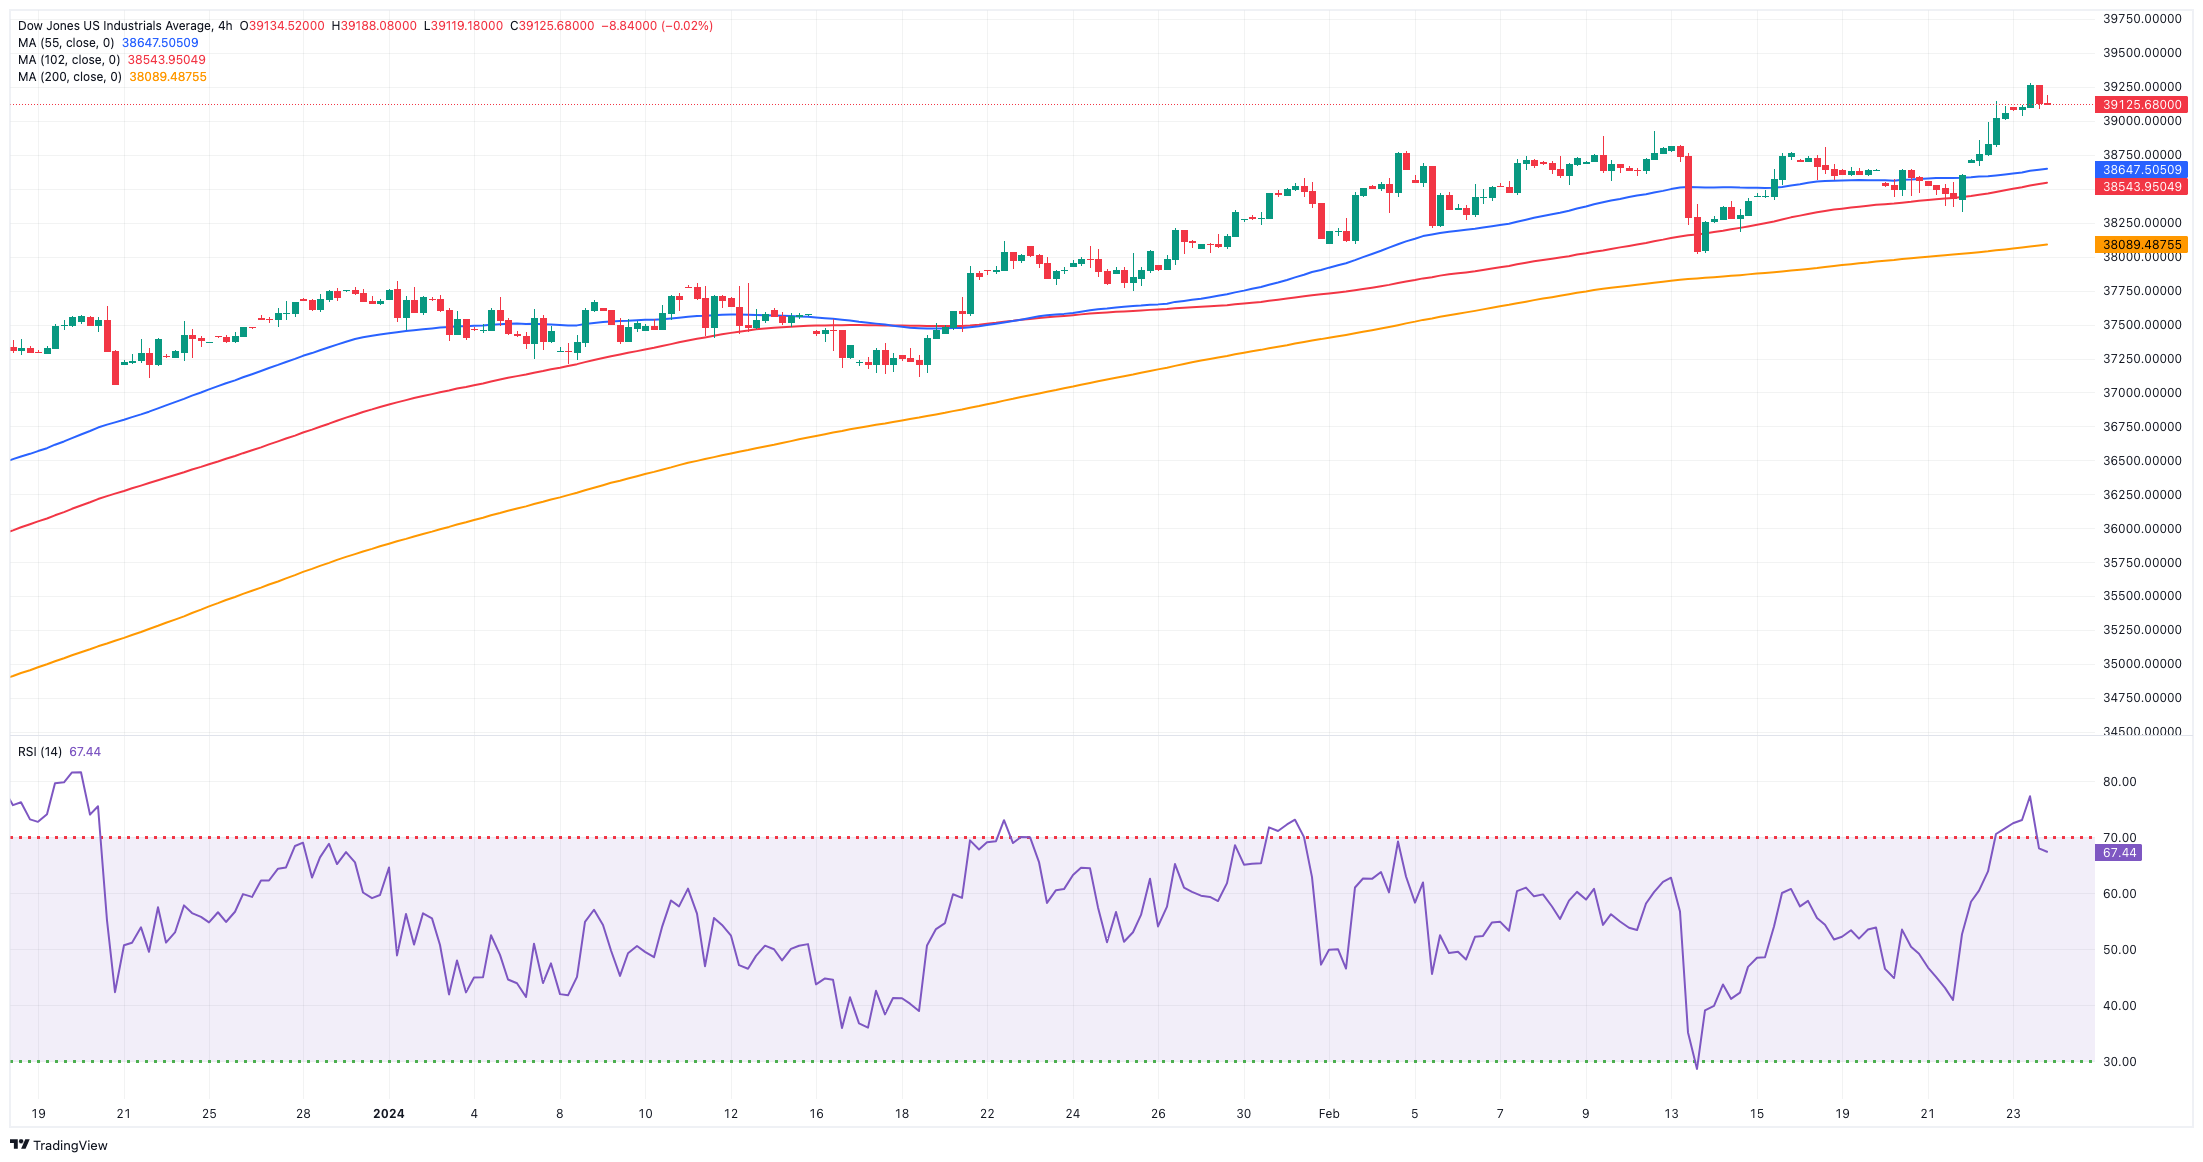
The US stock benchmark index Dow Jones ended Friday’s session with humble gains after clocking an all-time top near the 39,300 zone.
That said, the index remains firmly on its way to close the fourth consecutive month of gains, having closed in negative territory in only two weeks since late November.
The upside momentum in stocks appears to have taken a breather in light of recent robust gains, all against the backdrop of auspicious corporate earnings reports and a growing debate around the potential timing of the start of the Fed’s easing cycle.
On the latter, New York Fed J. Williams believes that the Fed is still on course for interest rate cuts "later this year." This remains the case despite the January readings on inflation and the labour market being stronger than anticipated.
At the end of the week, the Dow Jones rose 0.16% to 39,131, the S&P 500 gained 0.03% to 5,088, and the tech-centric Nasdaq Composite receded 0.28% to 15,996.
The Dow Jones index is facing an immediate upward challenge at its all-time high of 39,282 (February 23). The 55-day SMA at 37,781 provides temporary support, followed by the 2024 low of 37,122 (January 18) and the weekly low of 37,073 (December 20, 2023). A dip below this level may provide a challenge to the intermediate 100-day SMA at 36,122, before reaching the 200-day SMA at 35,199. The weekly low of 33,859 (November 7, 2023) is next, ahead of the October 2023 low of 32,327 (October 27) and the 2023 low of 31,429 (March 15). The daily RSI rose over 66.
Top Performers: Amgen, J&J, IBM
Worst Performers: Apple, Travelers, Chevron
Resistance levels: 39,282 (4H chart)
Support levels: 38,039 37,122 36,021 (4H chart)
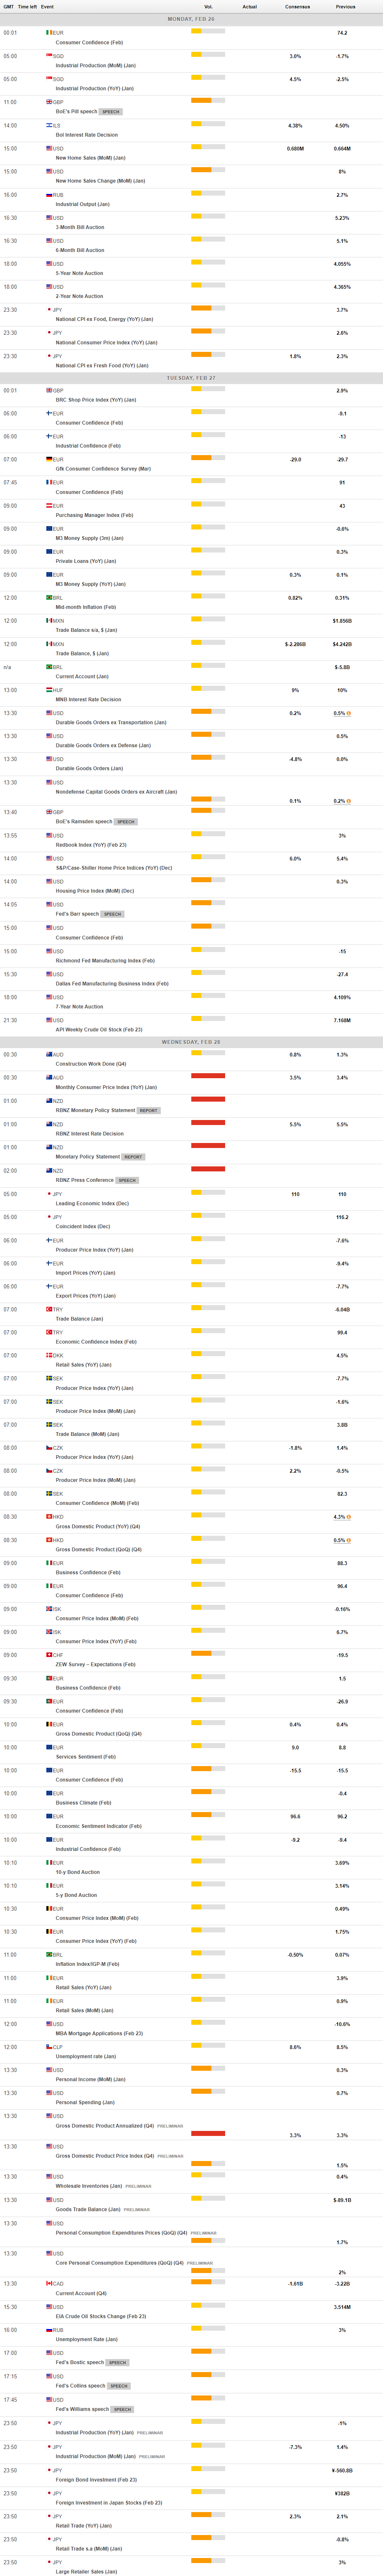
MACROECONOMIC EVENTS
All Information & Updates provided by:

All information relating to the financial markets available on this page has been prepared and issued by FXStreet (Forexstreet SL, Spain, Reg: B62498233) on the basis of publicly available information and all information believed to be reliable and does not conflict with Kuwaiti local laws, and all necessary care has been taken to before the company to ensure that the facts mentioned are correct from the source.
NCM Investment nor any of its directors or employees shall in any way be held responsible for the contents of this news, and the information contained on this page is intended only to provide clients with publicly available information and should not be construed as investment advice, report or analysis and/or constitute an offer or invitation to buy or sell financial instruments of any kind.
RISK WARNING: Forex and CFDs are highly risky leveraged products, as losses can exceed deposits. Please ensure you understand all the risks and take independent advice if necessary. NCM will segregate the clients based on the criteria of the regulator and its bylaws. NCM does not provide any advisory service; the material published does not constitute advice or a recommendation for a transaction in any financial instrument. NCM accepts no responsibility for any use of the content presented and any consequences of that use. Anyone acting on the information provided does so at their own risk.