
- Contact Us:
-

-

-

-


Daily Market Updates
28 Feb 2024
EURUSD
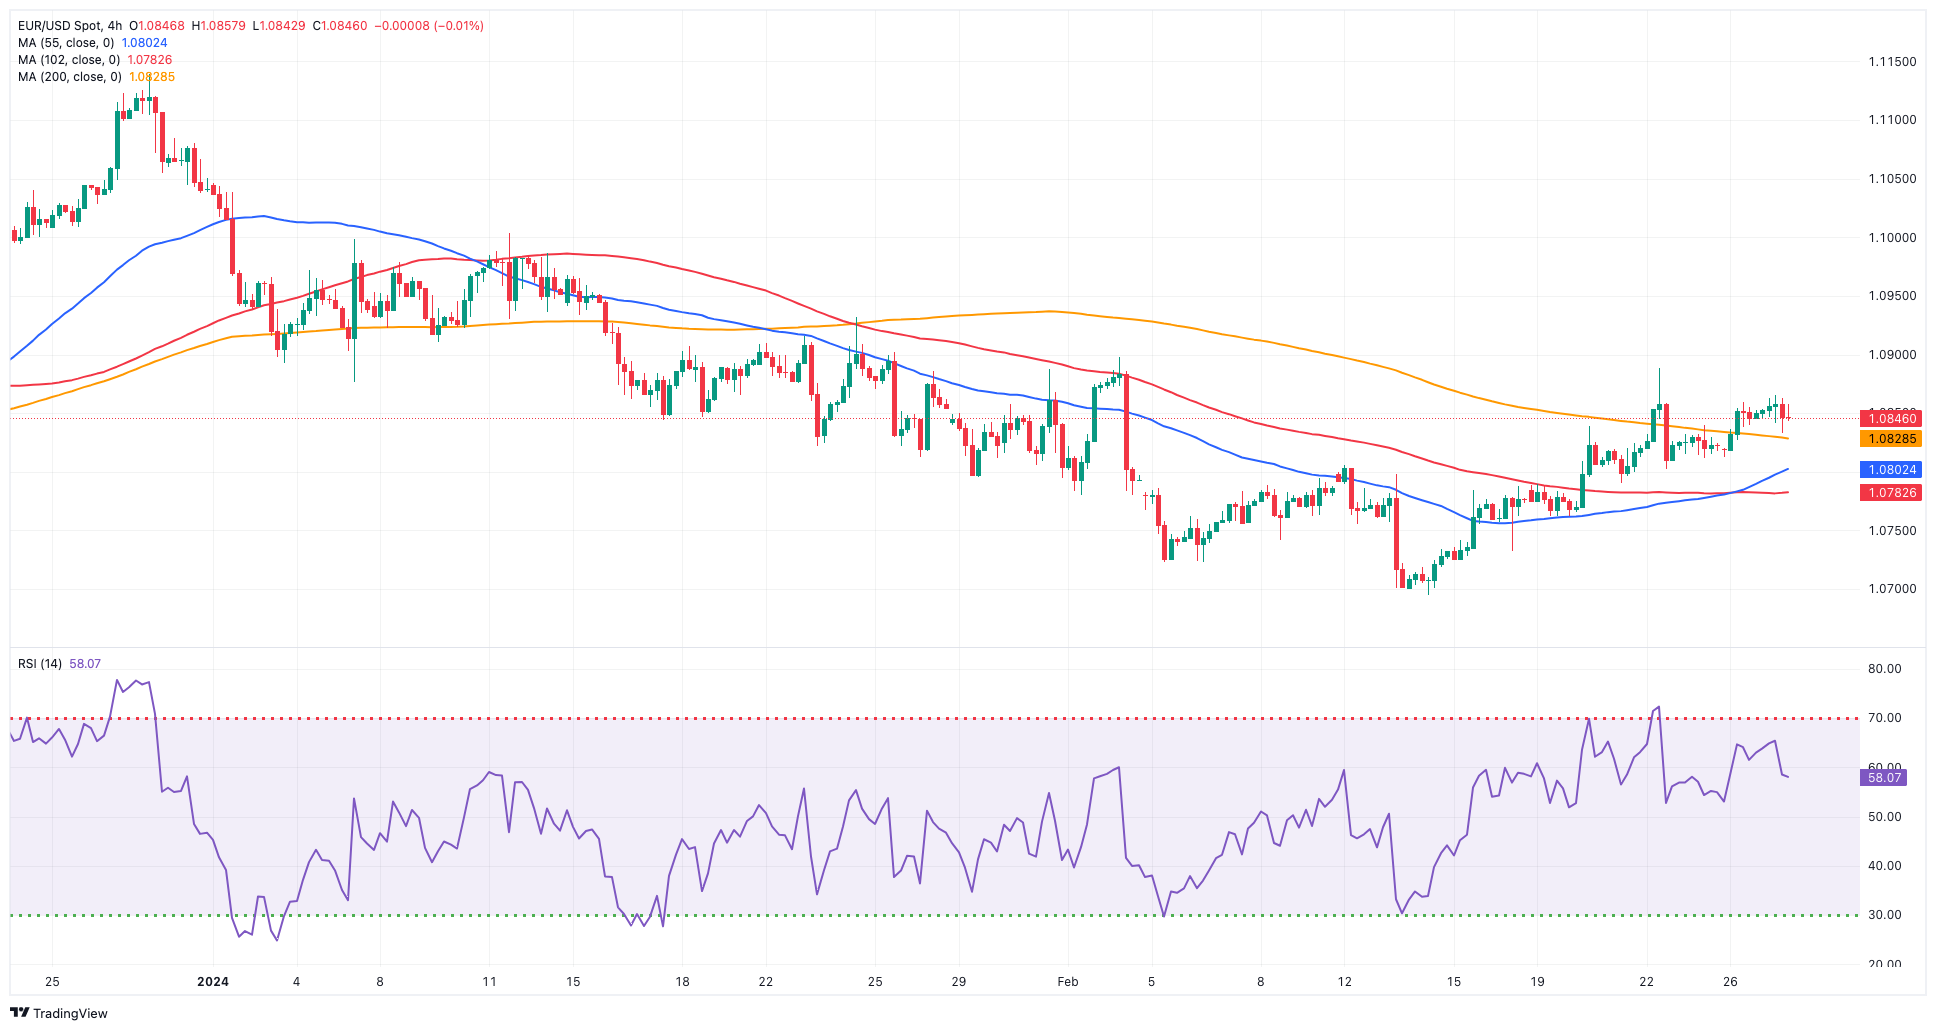
The greenback's additional indecisive price action bolstered the equally inconclusive session in EUR/USD, which remained stuck around the 1.0850 region on turnaround Tuesday.
In the same line, the USD Index (DXY) remained under pressure around the 103.80 zone amidst mixed US yields across the curve, with investors poised to focus on the release of US inflation figures tracked by the PCE later in the week.
In the macroeconomic landscape, market participants completely discounted any action on interest rates by the Fed at its March meeting, while speculation regarding a potential rate cut in June continued to gain momentum.
On this, the Fed’s Schmid (Kansas City) suggested that, given the current conditions, it is prudent to maintain the current policy stance and carefully observe how the economy evolves. This approach allows policymakers to make more informed decisions based on strong evidence and ensures a more effective response to inflation, labour markets, and demand.
On the euro docket, Germany’s Consumer Confidence improved marginally to -29 in March, according to GfK.
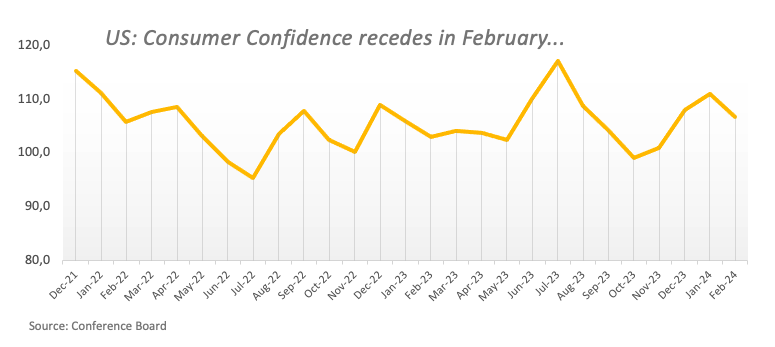
In the US, Durable Goods Orders contracted at a monthly 6.1% in January, while the FHFA’s House Price Index rose by 0.1% in December from a month earlier and the Consumer Confidence gauged by the Conference Board eased to 106.7 for the current month.
Further rising momentum may propel EUR/USD over the weekly high of 1.0888 (February 22), which is supported by the temporary 55-day SMA. North from here are the weekly tops of 1.0932 (January 24) and 1.0998. (January 5, 11). The breakout of this region reveals the December 2023 peak of 1.1139 (December 27), which is reinforced by the 200-week SMA of 1.1148 and comes before the 2023 high of 1.1275 (July 18). In the other direction, the 2024 low of 1.0694 (February 14) comes next, followed by the weekly low of 1.0495 (October 13, 2023), the 2023 low of 1.0448 (October 3), and the round level of 1.0400. The daily RSI climbed past 56.
Resistance levels: 1.0865 1.0888 1.0897 (4H chart)
Support levels: 1.0828 1.0789 1.0732 (4H chart)
USDJPY
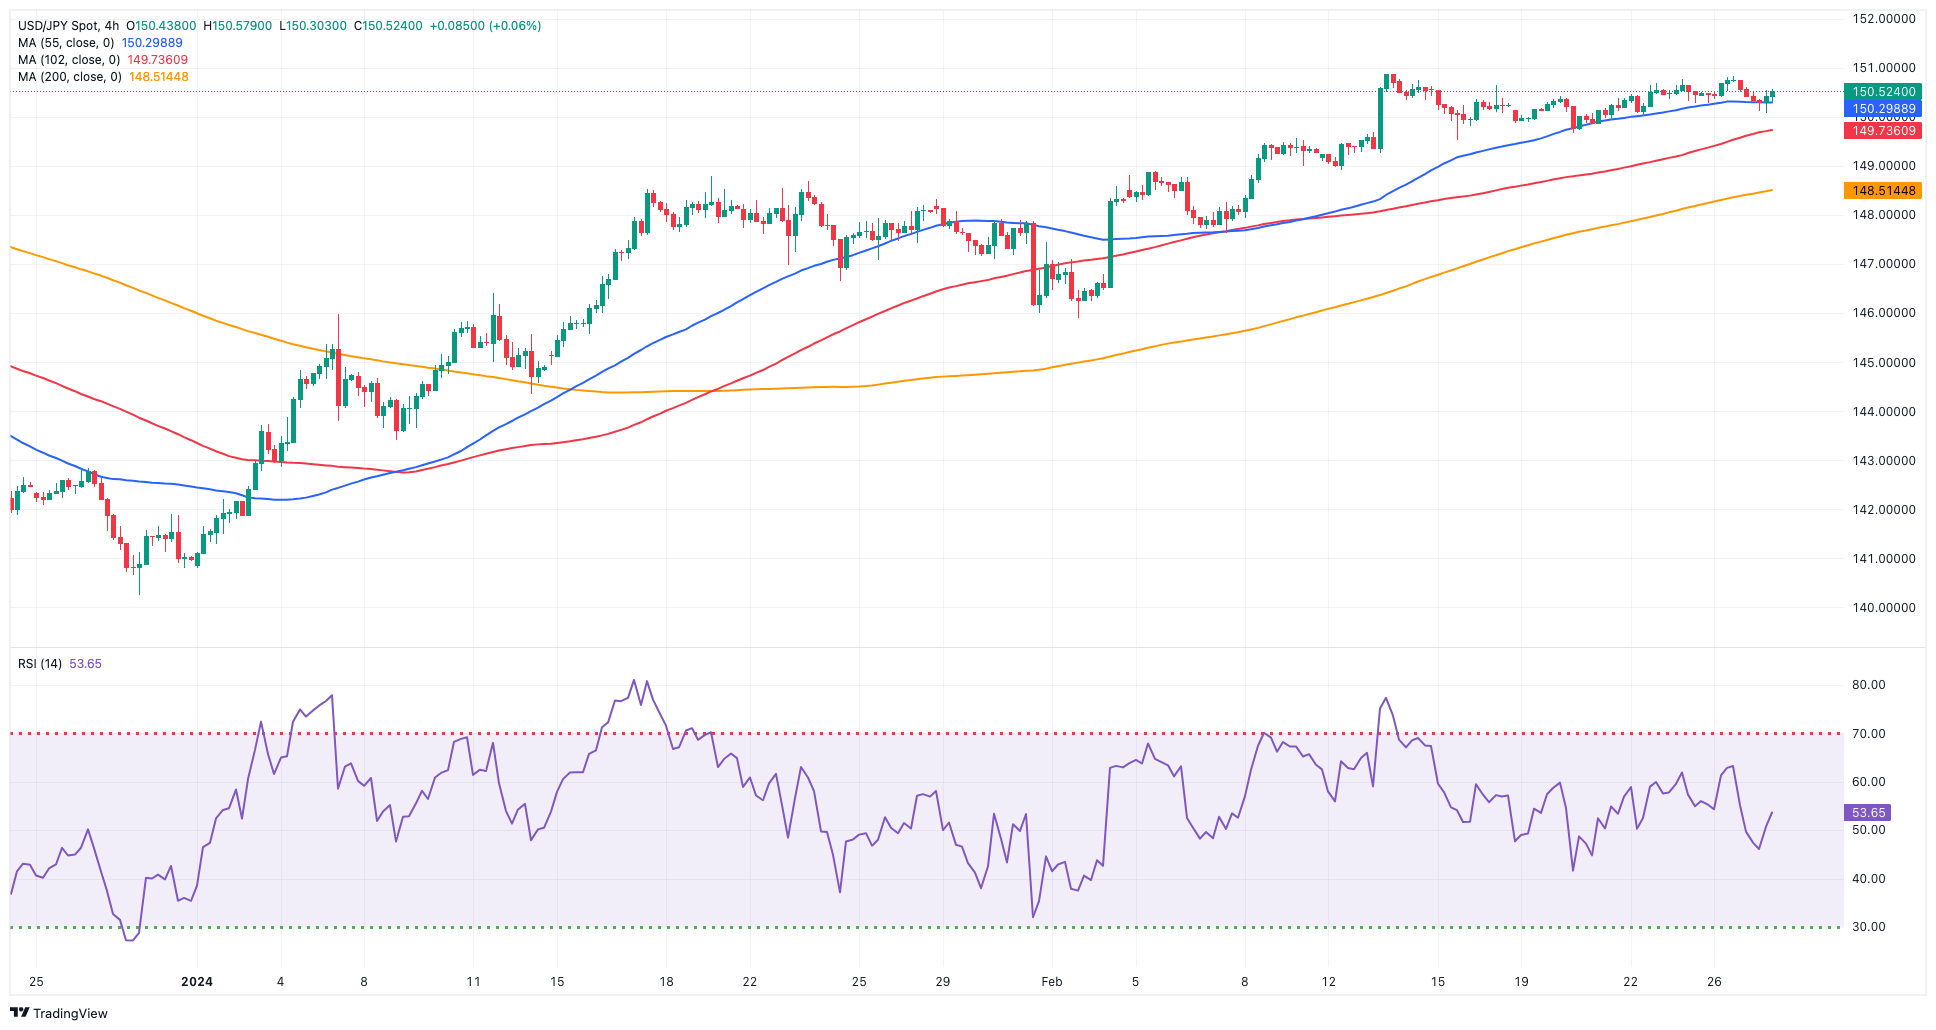
USD/JPY traded on the defensive, fading Monday’s pullback and revisiting the area of three-day lows near the 150.00 neighbourhood on Tuesday.
The resumption of the buying momentum in the Japanese yen came on the back of higher-than-expected inflation figures in Japan during January, which encouraged investors to start pricing in a potential lift-off by the BoJ in the next few months (June?).
In addition, further weakness in the dollar and mixed US yields vs. a small uptick in JGB 10-year yields seem to have underpinned the move lower in the pair.
On the docket, Japan’s Inflation Rate rose 2.2% in the year to January, the Core Inflation Rate ticked higher by 2.0% YoY, and the Inflation Rate Ex-Food and Energy rose by 3.5% over the last twelve months.
If bulls reclaim the lead, USD/JPY may hit its 2024 high of 150.88 (February 13), prior to the 2023 top of 151.90 (November 13). Further north, the 2022 peak of 151.94 (October 21) is closely followed by the round figure of 152.00. In contrast, there is temporary contention at the 100-day and 55-day SMAs at 147.70 and 146.45, respectively, just before the February low of 145.89 (February 1). The crucial 200-day SMA at 145.76 is next, ahead of the December 2023 low of 140.24 (December 28), the round number of 140.00, and the July low of 137.23 (July 14). The day-to-day RSI deflated to the 62 zone.
Resistance levels: 150.88 151.43 151.90 (4H chart)
Support levels: 149.68 148.92 147.61 (4H chart)
GBPUSD
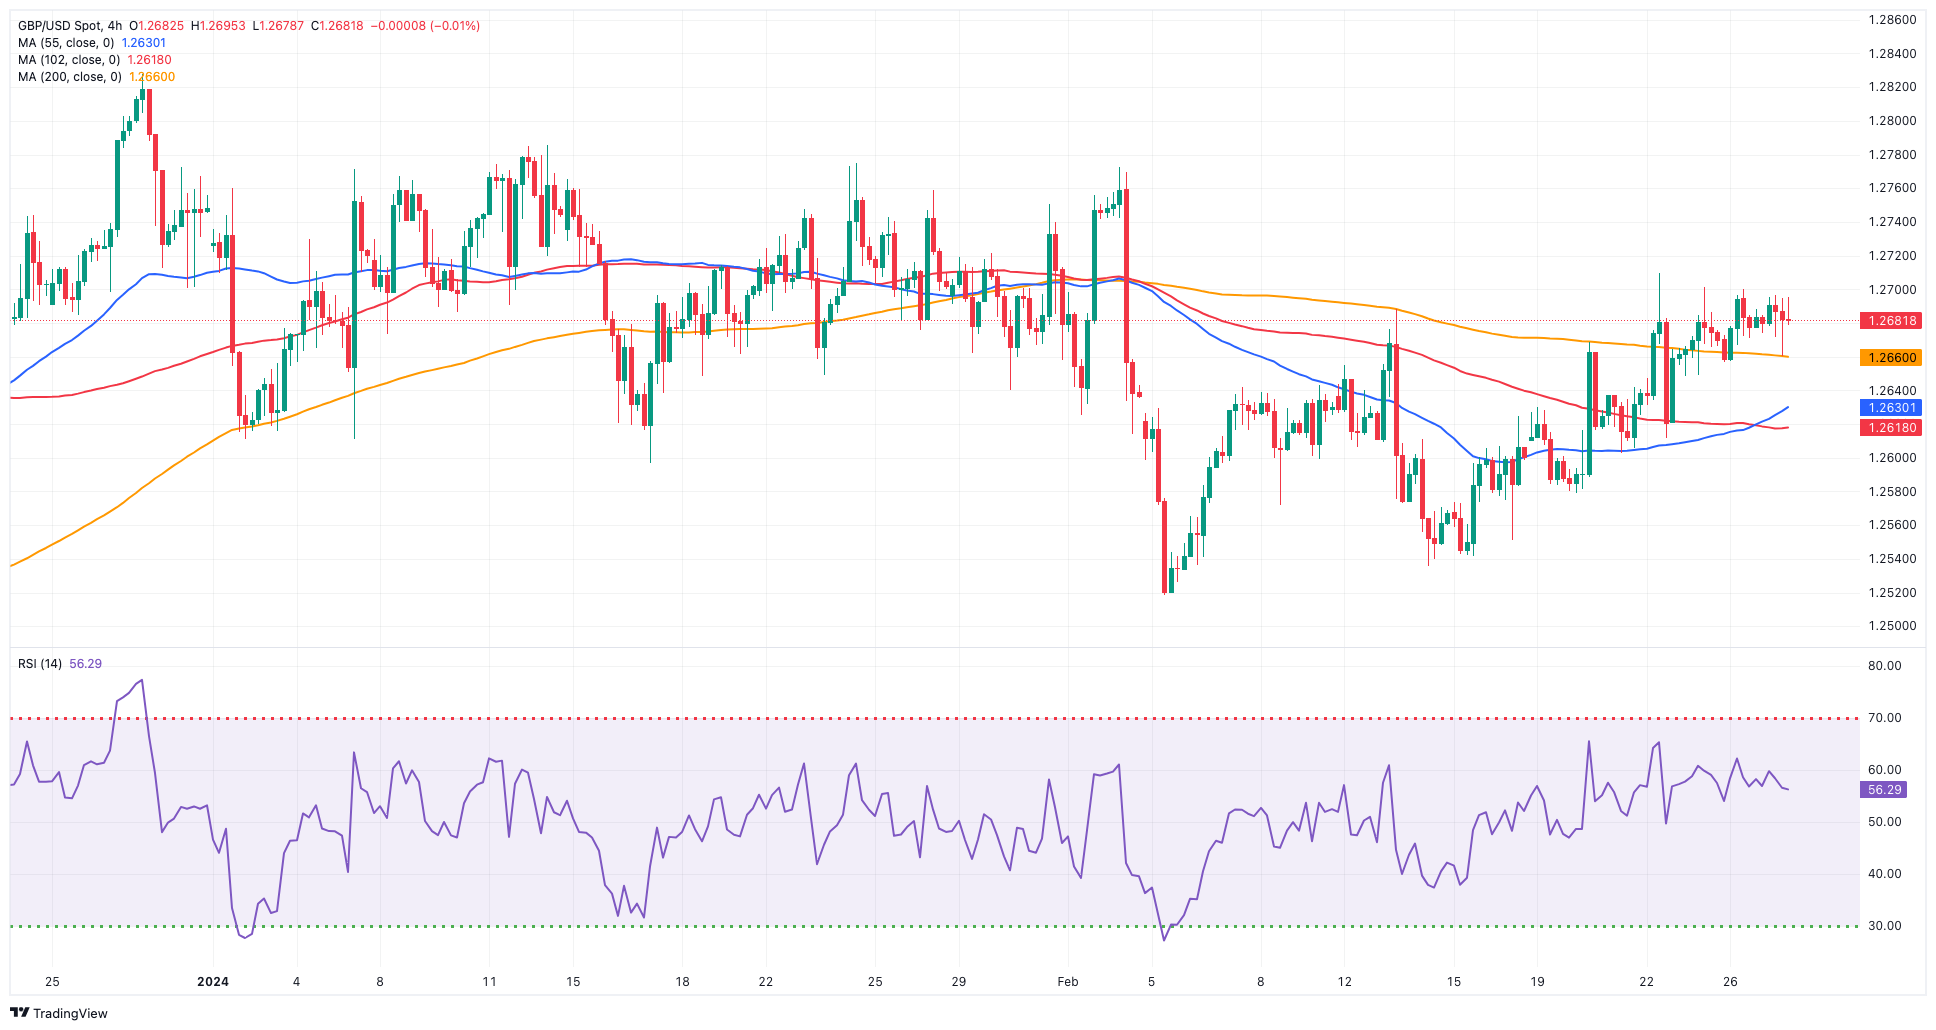
GBP/USD faltered once again just ahead of the key hurdle at 1.2700 on Tuesday, trading in an irresolute fashion following several sessions of gains.
Against this, Cable managed to keep the trade in the upper end of the range, benefiting from the ongoing directionless mood in the greenback, which maintained pressure on the USD Index (DXY) well below the 104.00 threshold.
In the UK money market, 10-year gilt yields added to Monday’s advance and surpassed the 4.20% level.
On the domestic front, BoE’s Ramsden emphasized that stability cannot be assumed and highlighted the initiation of the balance sheet normalization process. He added that key indicators reflecting the persistence of inflation remain at elevated levels. Ramsden also expressed the need for further evidence to assess the depth of this persistence and consequently determine the duration for which the current bank rate should be upheld.
Further gains in GBP/USD target the weekly high of 1.2709 (February 22), before the February top of 1.2772 (February 2) and the 2024 peak of 1.2785 (January 12). The breakout of this level may result in a struggle over the December high of 1.2827 (December 28), which is ahead of the weekly top of 1.2995 (July 27, 2023) and the critical 1.3000 level. On the downside, the initial objective is the 2024 low of 1.2518 (February 5), somewhat ahead of the December 2023 low of 1.2500 (December 13), both of which are supported by the proximity of the intermediate 100-day SMA (1.2530). Further weakness may force Cable to focus on the weekly bottom of 1.2187 (November 10, 2023), before the October 2023 low of 1.2037, the key 1.2000 mark and the 2023 low of 1.1802 (March 8). The everyday RSI ticked rose above the 56 level.
Resistance levels: 1.2709 1.2772 1.2827 (4H chart)
Support levels: 1.2611 1.2579 1.2518 (4H chart)
GOLD
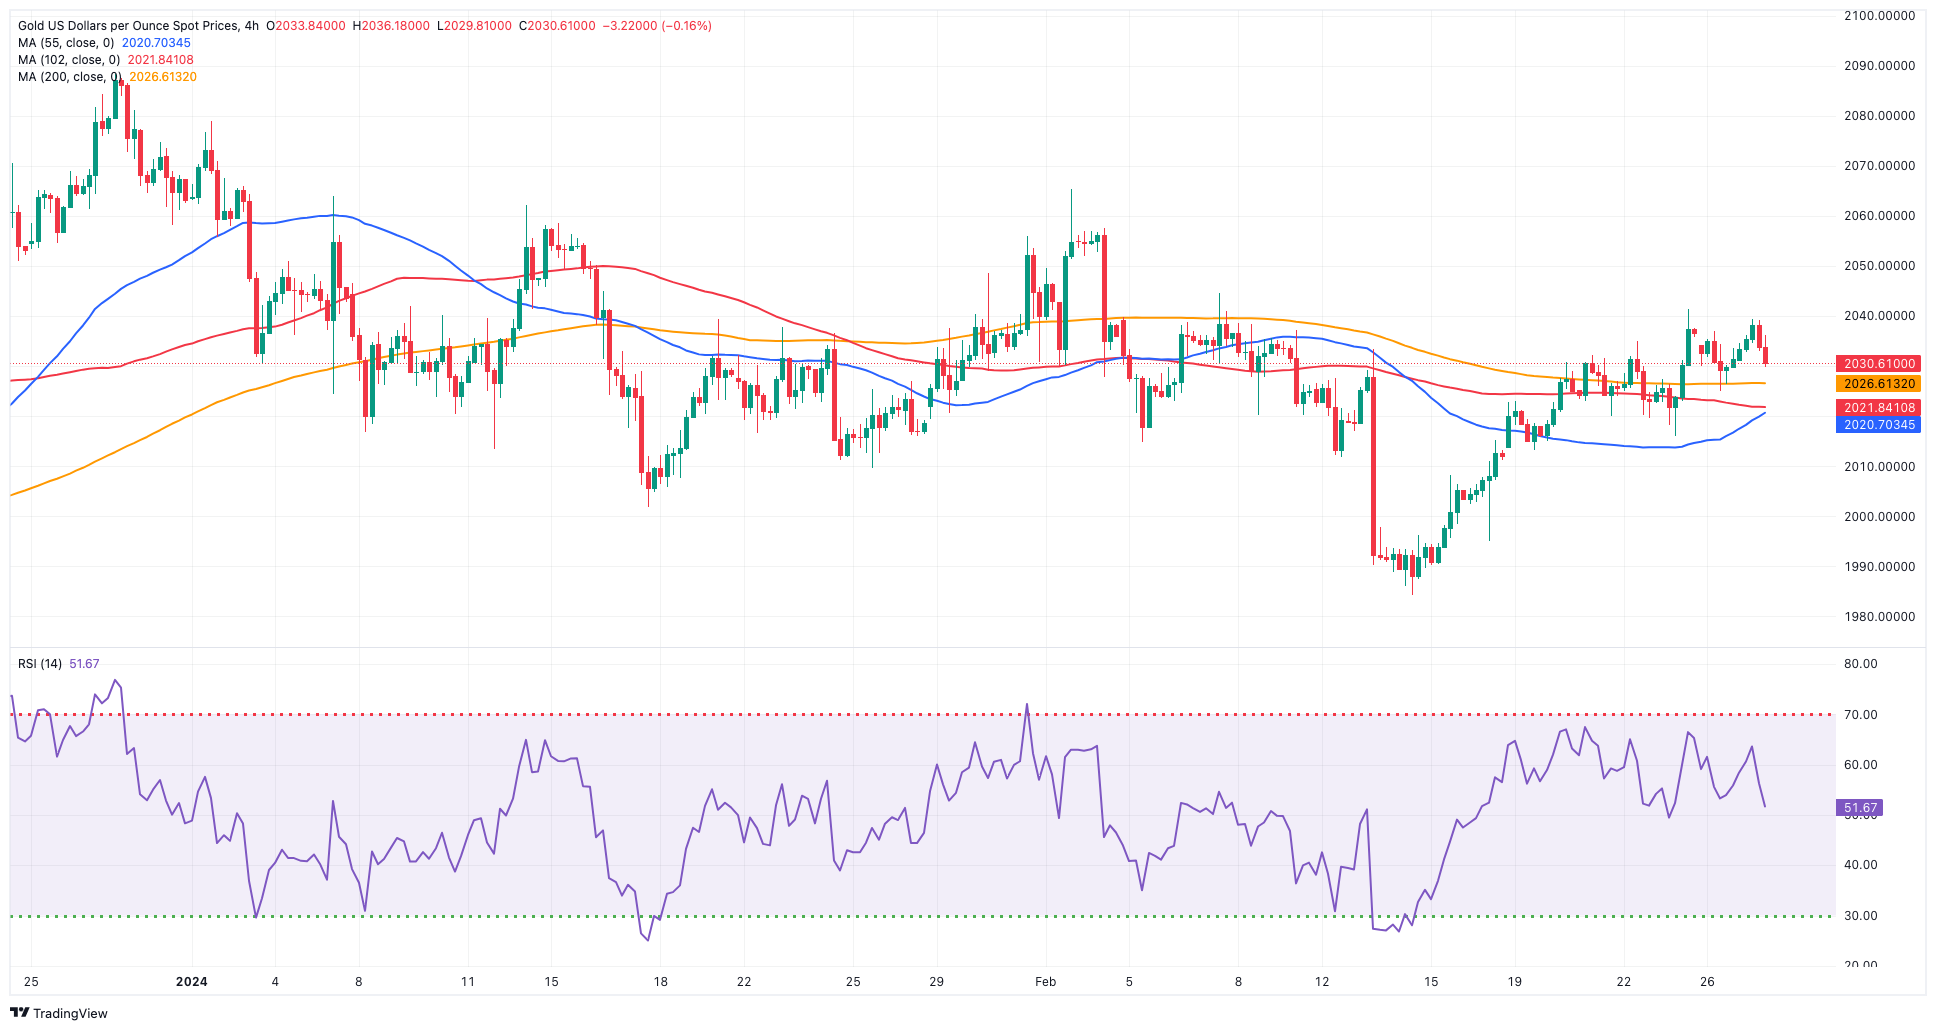
The price of gold remained within its recent range, although it managed to reverse Monday’s decline, reclaiming the area near the $2,040 mark per troy ounce on Tuesday.
This uptick in the precious metal was accompanied by minor losses in the greenback amid the prevailing directionless theme, while the mixed performance in US yields across various maturity periods also contributed to the bounce in the metal.
As we look ahead, the yellow metal should remain under the microscope ahead of the run-up to the release of US inflation data measured by the PCE on March 1, all against the backdrop of continuous speculation about the timing of the first interest rate cut by the Fed.
Extra bounce may push gold back to its February peak of $2,065 (February 1), ahead of the weekly high of $2,088 (December 28) and all-time top of $2,150 (December 4, 2023). Alternatively, the immediate downside target is the 2024 low of $1,984 (February 14), followed by the December 2023 low of $1,973, which is bolstered by its proximity to the critical 200-day SMA at $1,966. A deeper decline might refocus attention on the November 2023 bottom of $1,931, seconded by the October 2023 low of $1,810, the 2023 low of $1,804, and the key $1,800 contention zone.
Resistance levels: $2,041 $2,065 $2,078 (4H chart)
Support levels: $2,016 $1,984 $1,973 (4H chart)
CRUDE WTI
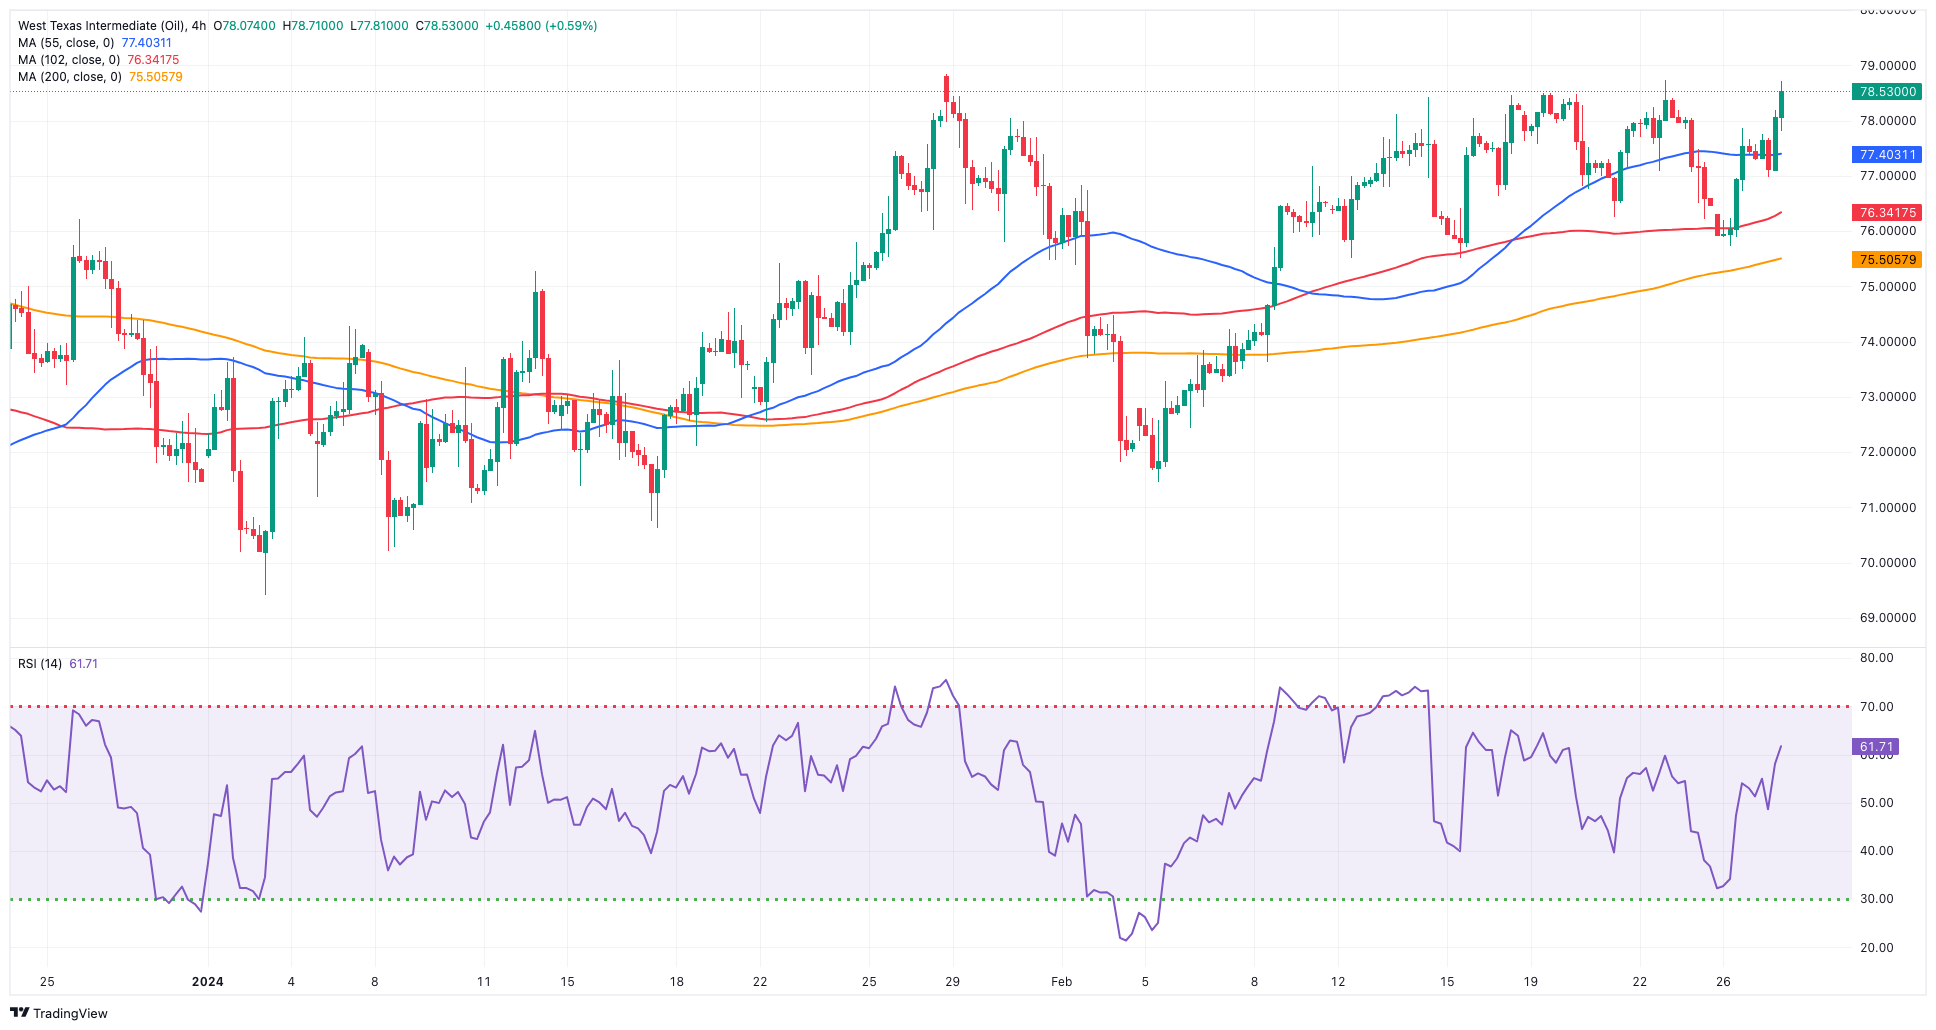
WTI prices extended Monday’s optimism and rose to the boundaries of the $79.00 mark per barrel, trading at shouting distance from yearly peaks.
Crude oil prices saw their upside momentum reinvigorated after OPEC+ could extend its voluntary output cuts into the second quarter.
Further support for the commodity came in response to rising cautiousness in the current ceasefire talks in the Israel-Hamas conflict, while the Red Sea crisis appears far from mitigated and speculation around a bounce in Chinese demand for crude oil also collaborated with the upside.
On the other hand, Libya’s National Oil Corporation (NCO) announced its intentions to keep increasing its crude oil production after it reported its production rose to around 1.25 mbpd.
The next upward test for WTI is the February high of $78.94 (February 27), which comes ahead of the 2024 top of $79.25 (January 29), and the critical $80.00 barrier, all before the November 2023 peak of $80.15 (November 3). Extra gains from here may propel the commodity back to its weekly high of $89.83 (October 18, 2023), ahead of the 2023 top of $94.99 (September 28, 2023), the August 2022 peak of $97.65 (August 30), and the psychological $100.00 threshold. Having said that, the loss of the February low of $71.43 (February 5) might bring the critical $70.00 barrier back into play, followed by the 2024 bottom of $69.31 (January 3).
Resistance levels: $78.94 $79.25 $79.56 (4H chart)
Support levels: $75.81 $75.49 $71.37 (4H chart)
GER40
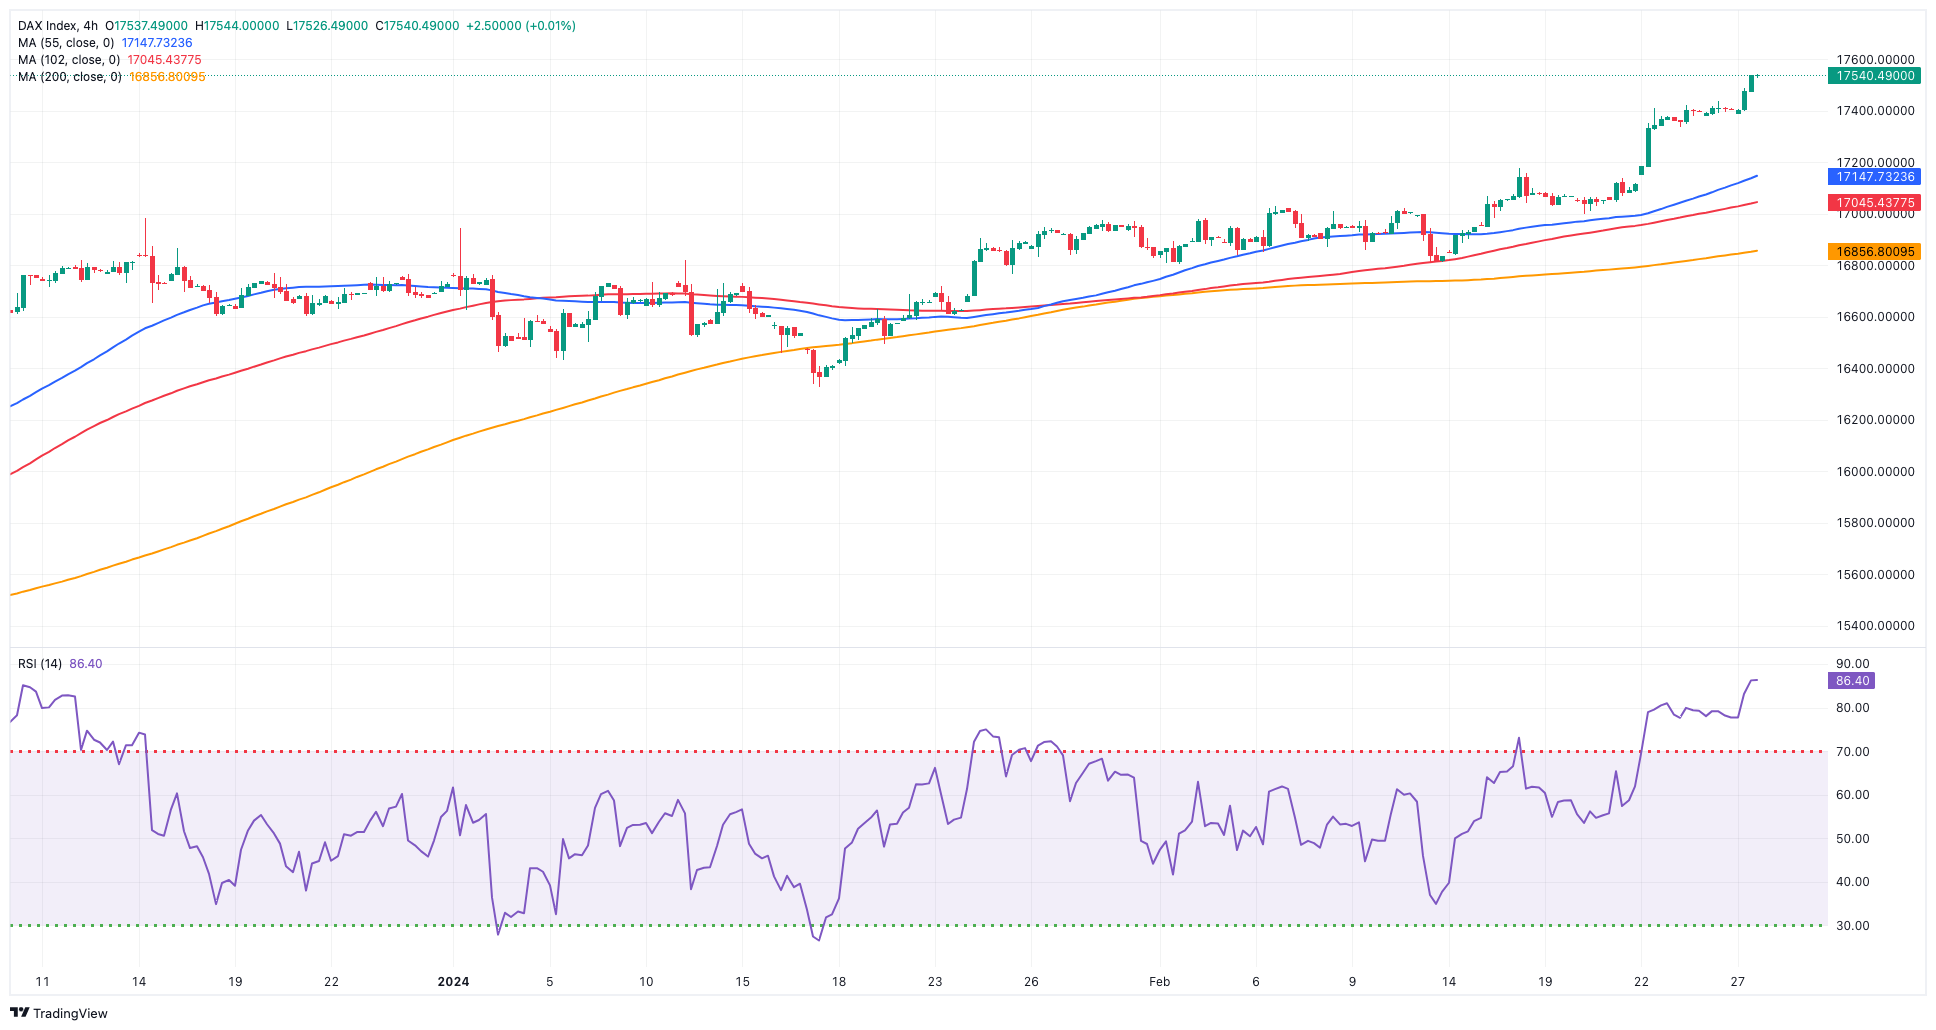
The optimism in the German stock market remained unabated for the fifth session in a row on Tuesday, lifting the benchmark DAX40 to a new all-time high near the 17,600 level.
Further gains in the German index came on the back of the solid performance of the Autos sector amidst the generalized muted price action in the rest of the European markets.
In addition, cautiousness also kept the price action somewhat limited ahead of key data releases in the US and the euro dockets in the latter part of the week, while speculation around the timing of the Fed’s rate cut continued to hover around markets.
The uptick in the DAX40 came in tandem with another move higher in 10-year bund yields, this time approaching the 2.50% level.
The DAX40's next upward hurdle is its all-time high at 17,56327 (February 26). Quite the opposite, the February low of 16,821 (February 1) provides immediate support and looks to be propped up by the temporary 55-day SMA of 16,844. The breakdown of this zone might bring back into focus the 2024 bottom at 16,345 (January 17), which is just ahead of the crucial 200-day SMA at 16,054. A subsequent decline might revisit the weekly bottom of 15,915 (November 28), before the October 2023 low of 14,630 (October 23) and the March 2023 low of 14,458 (March 20). The daily RSI advanced further in the overbought zone, over 74.
Best Performers: Infineon, BASF, Continental AG
Worst Performers: Rheinmetall AG, Symrise AG, Beiersdorf AG
Resistance levels: 17,563 (4H chart)
Support levels: 17,039 16,831 16,732 (4H chart)
GBPJPY
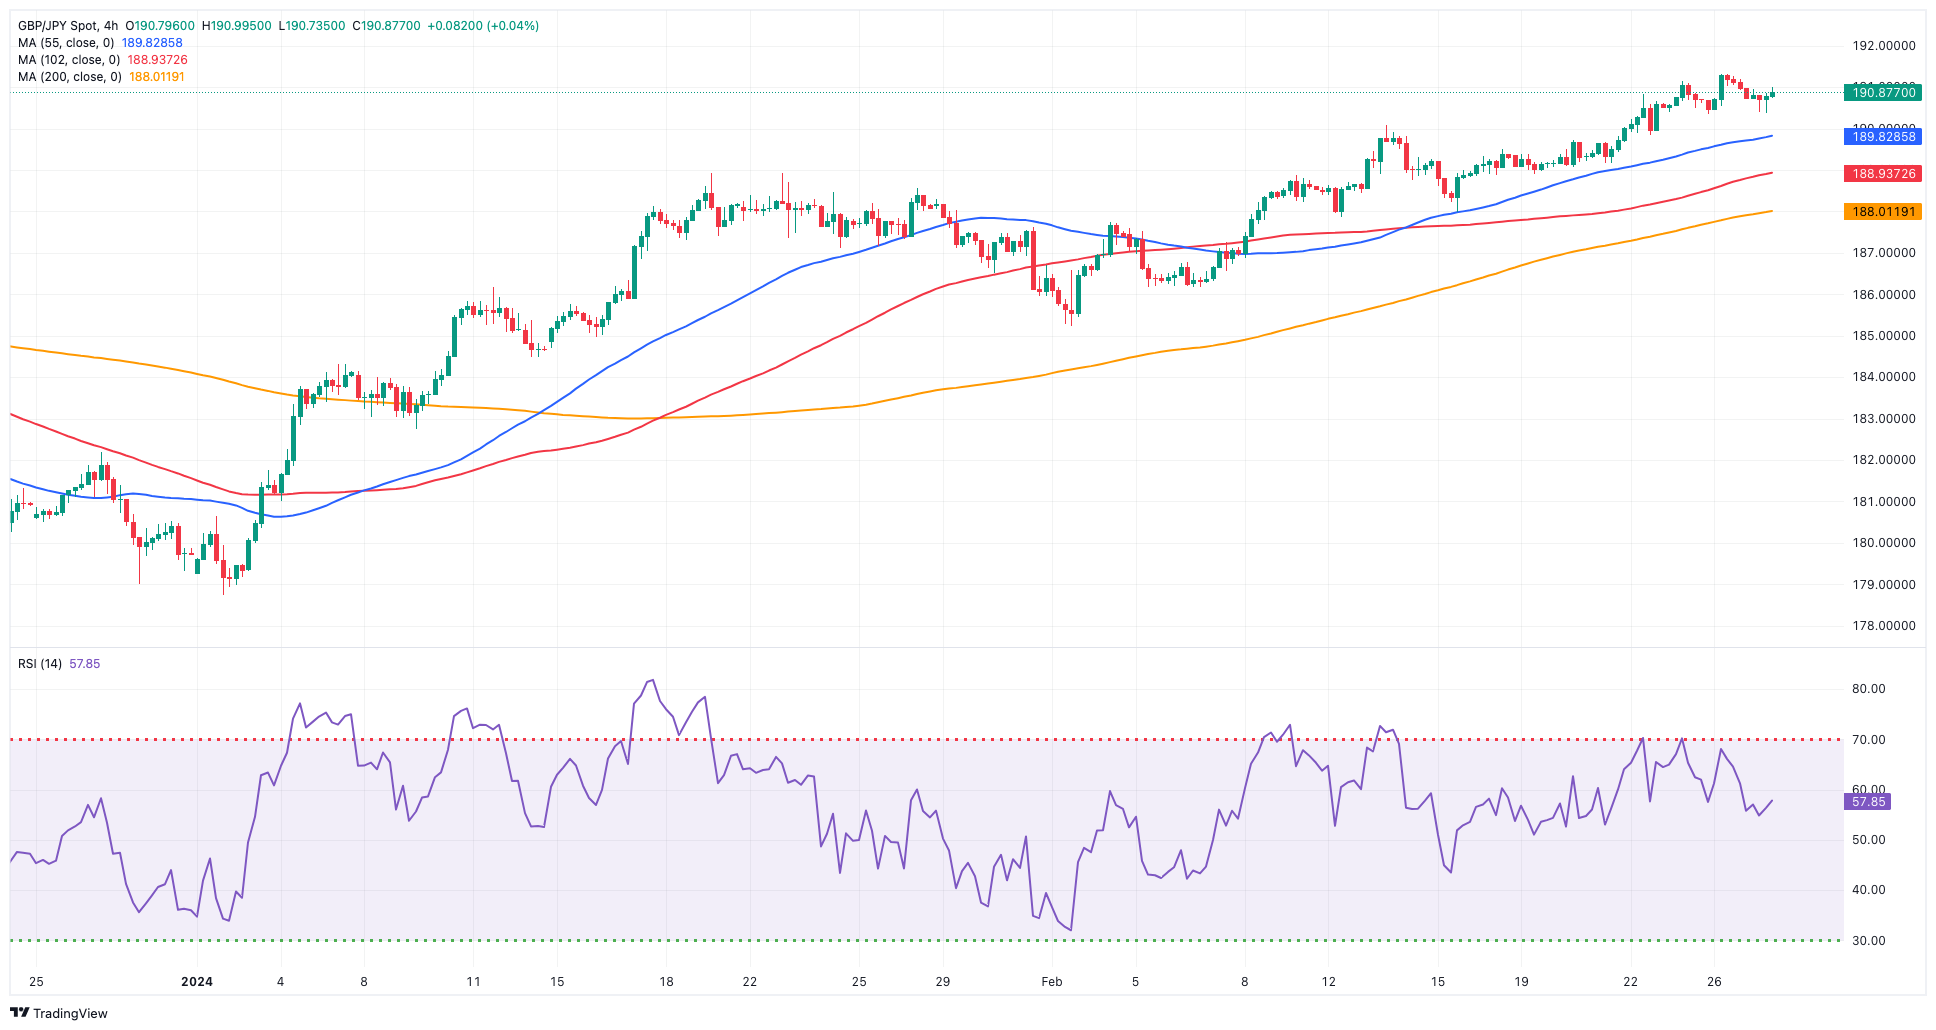
Renewed strengthening of the Japanese yen, along with slight gains in the British pound, maintained price action in GBP/JPY depressed on Tuesday, prompting the cross to trade with losses for the first time after five consecutive daily advances.
Furthermore, the cross came under pressure soon after hitting a new 2024 peak past the 191.00 yardstick at the beginning of the week.
Fresh buying interest in the yen came after Japanese inflation figures surpassed estimates during January, sparking speculation of a potential exit of the BoJ’s ultra-accommodative monetary policy stance.
The following target for GBP/JPY is the 2024 high of 191.32 (February 26), which comes ahead of the August 2015 top of 195.28 (August 18) and the record peak of 195.88 (June 24, 2015). Just the opposite, the February low of 185.22 (February 1) aligns as the immediate support before the intermediate 100-day SMA at 185.18. South of here is the more critical 200-day SMA at 183.18, which precedes the December 2023 low of 178.33 (December 14) and the October 2023 low of 178.03 (October 3). A deeper pullback might provide a challenge to the July 2023 bottom of 176.30, which is ahead of the May 2023 low of 167.84 (May 11). The daily RSI retreated to the vicinity of 67.
Resistance levels: 191.32 195.28 195.88 (4H chart)
Support levels: 189.79 187.99 185.22 (4H chart)
NASDAQ
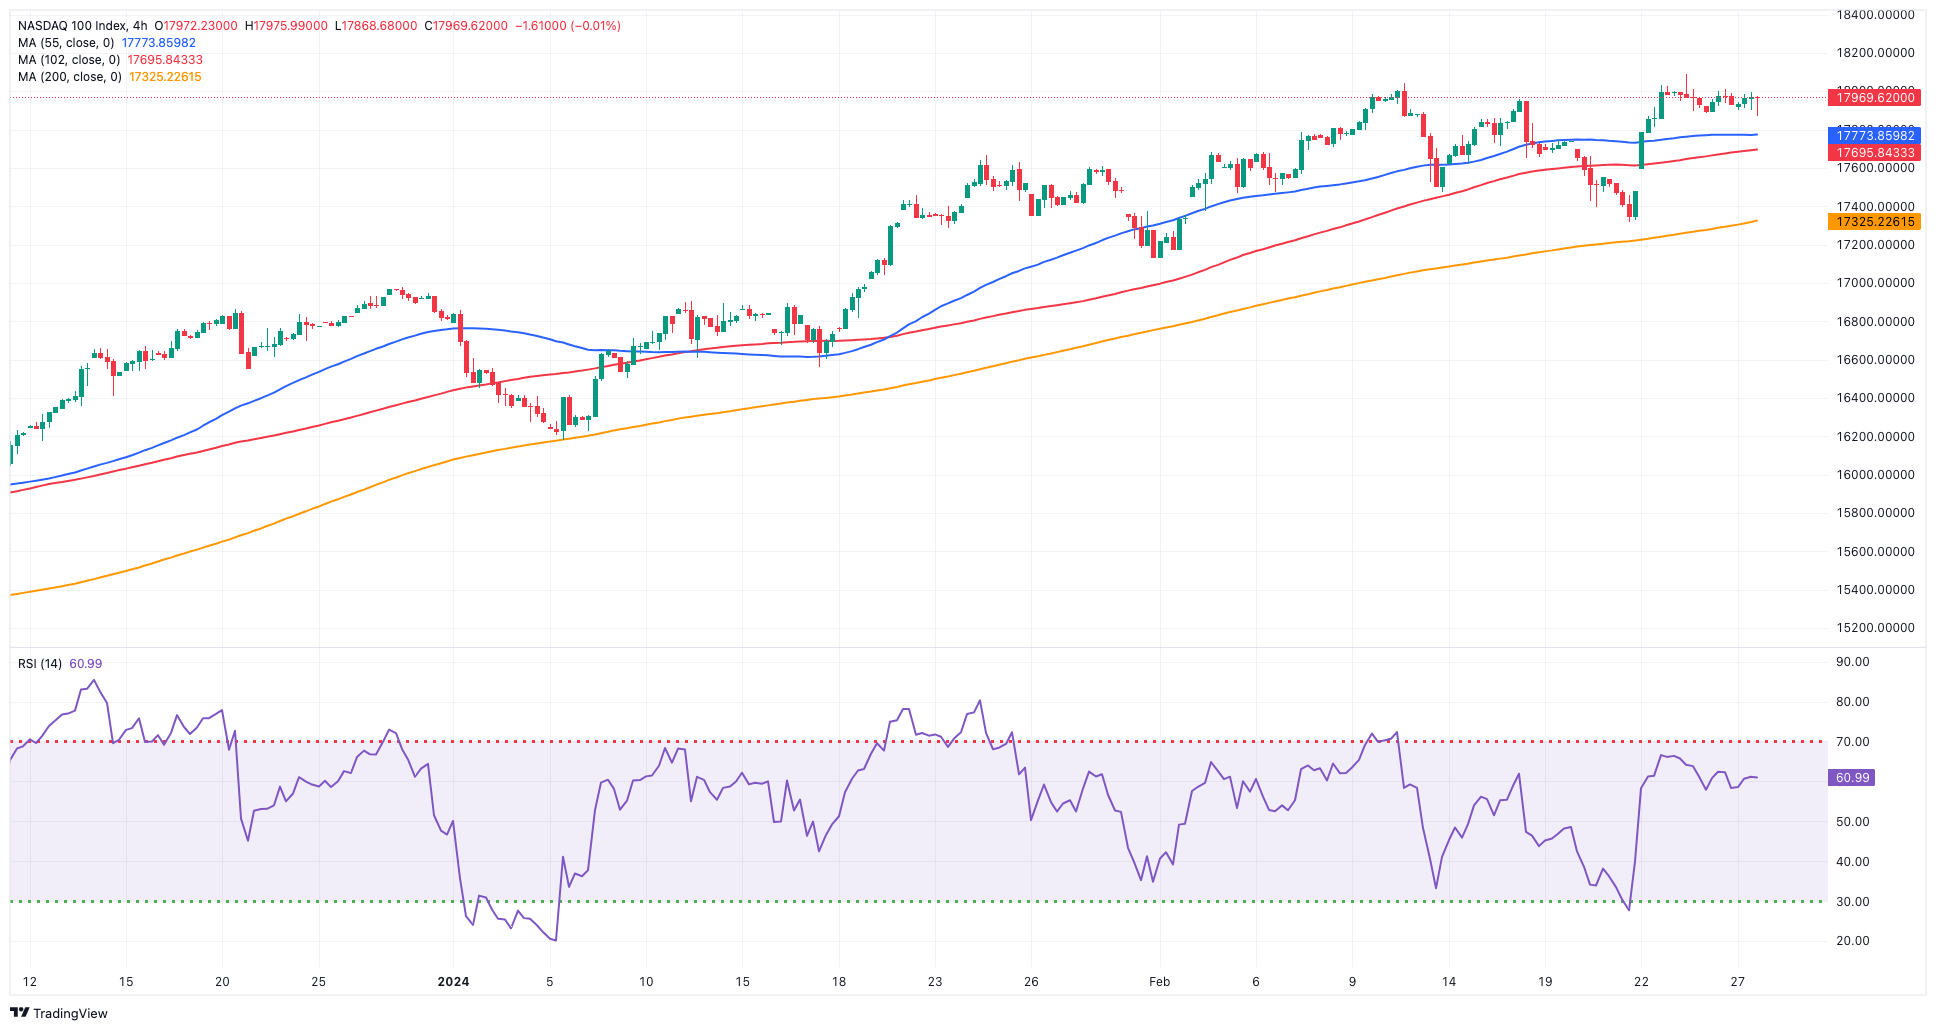
The Nasdaq 100 added to the ongoing bearish trend and went down for the third consecutive session on turnaround Tuesday.
Despite the daily pullback, the index maintained its trade in the upper end of the range and near its recent record high past the 18,000 mark (February 23).
Meanwhile, traders are expected to exercise caution in anticipation of the upcoming release of US inflation data, specifically measured by the PCE, later in the week. The market will closely analyse this data to gauge its potential impact on the Fed’s likely intentions to implement rate cuts in the coming months.
So far, CME Group’s FedWatch Tool sees the probability of a rate cut at the Fed’s June 12 meeting at around 50%.
Further gains on the Nasdaq 100 target the all-time high of 18,091 (February 23). On the other hand, the index may retest the weekly lows of 17,319 (February 21) and 17,128 (January 31), which occur before the transitory 55-day SMA of 17,116 and the 2024 low of 16,249 (January 5). A break below the latter might result in a drop to the December 2023 low of 15,695 (December 4), which appears underpinned by the key 200-day SMA of 15,601. The low for October 2023 is 14,058 (October 26), followed by the April 2023 low of 12,724 (April 25), the March 2023 low of 11,695 (March 13), and the 2023 low of 10,696 (January 3). The daily RSI moved below 61.
Top Gainers: Constellation Energy, The Trade Desk, Moderna
Top Losers: Workday, Amgen, Electronic Arts
Resistance levels: 18,091 (4H chart)
Support levels: 17,319 17,128 16,561 (4H chart)
DOW JONES
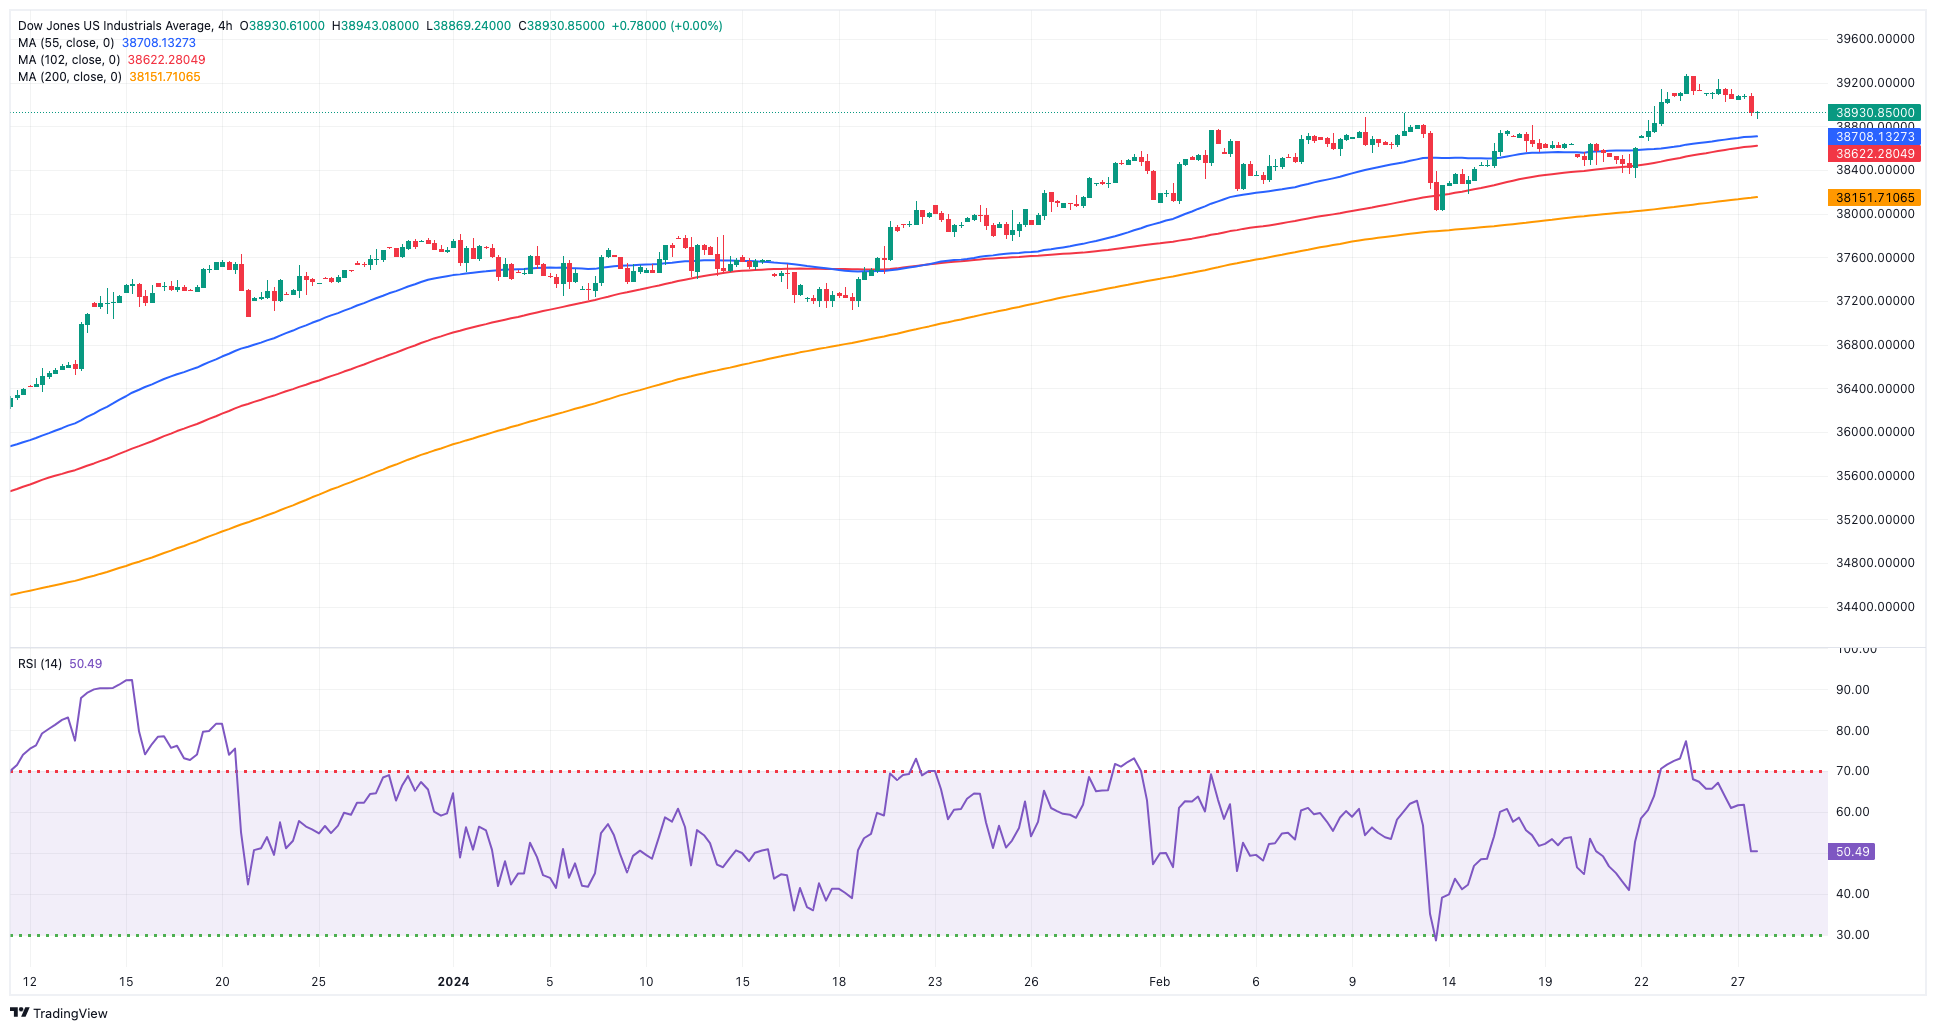
On Tuesday, US equities gauged by the reference Dow Jones extended their bearish start of the week as investors eagerly anticipated a pivotal inflation report and other economic data that would provide additional insights into the timing of rate cuts by the Fed.
Indeed, prudence kept increasing ahead of the publication of US inflation figures tracked by the PCE (February 29), all against the backdrop of firm speculation over a potential rate cut by the Fed in June (or later).
Following a previous week dominated by excitement surrounding AI, which propelled the S&P500 and Dow Jones to record peaks and overshadowed concerns about delayed rate cuts, market attention has now shifted back to the Fed’s monetary policy trajectory.
On the latter, FOMC’s M. Bowman emphasized caution in monetary policy, stating that if inflation approaches the 2% target, lowering interest rates may be suitable but warning against premature reductions. Bowman said she is prepared to raise rates if inflation stagnates.
On Monday, the Dow Jones retreated 0.38% to 38,921, the S&P 500 dropped 0.03% to 5,068, and the tech-focused Nasdaq Composite advanced 0.02% to 15,981.
The Dow Jones Index confronts an immediate upward challenge at its all-time high of 39,282 (February 23). The 55-day SMA at 37,887 provides temporary support, followed by the 2024 low of 37,122 (January 18) and the weekly low of 37,073 (December 20, 2023). A dip below this level may provide a challenge to the intermediate 100-day SMA at 36,238, before the 200-day SMA at 35,253. The weekly low of 33,859 (November 7, 2023) is next, ahead of the October 2023 low of 32,327 (October 27) and the 2023 low of 31,429 (March 15). The daily RSI deflated to the 60 area.
Top Performers: Walt Disney, Boeing, Dow
Worst Performers: Amgen, Chevron, Amazon.com
Resistance levels: 39,282 (4H chart)
Support levels: 38,338 38,039 37,122 (4H chart)
MACROECONOMIC EVENTS

All Information & Updates provided by:

All information relating to the financial markets available on this page has been prepared and issued by FXStreet (Forexstreet SL, Spain, Reg: B62498233) on the basis of publicly available information and all information believed to be reliable and does not conflict with Kuwaiti local laws, and all necessary care has been taken to before the company to ensure that the facts mentioned are correct from the source.
NCM Investment nor any of its directors or employees shall in any way be held responsible for the contents of this news, and the information contained on this page is intended only to provide clients with publicly available information and should not be construed as investment advice, report or analysis and/or constitute an offer or invitation to buy or sell financial instruments of any kind.
RISK WARNING: Forex and CFDs are highly risky leveraged products, as losses can exceed deposits. Please ensure you understand all the risks and take independent advice if necessary. NCM will segregate the clients based on the criteria of the regulator and its bylaws. NCM does not provide any advisory service; the material published does not constitute advice or a recommendation for a transaction in any financial instrument. NCM accepts no responsibility for any use of the content presented and any consequences of that use. Anyone acting on the information provided does so at their own risk.