
- Contact Us:
-

-

-

-


Daily Market Updates
29 Feb 2024
EURUSD
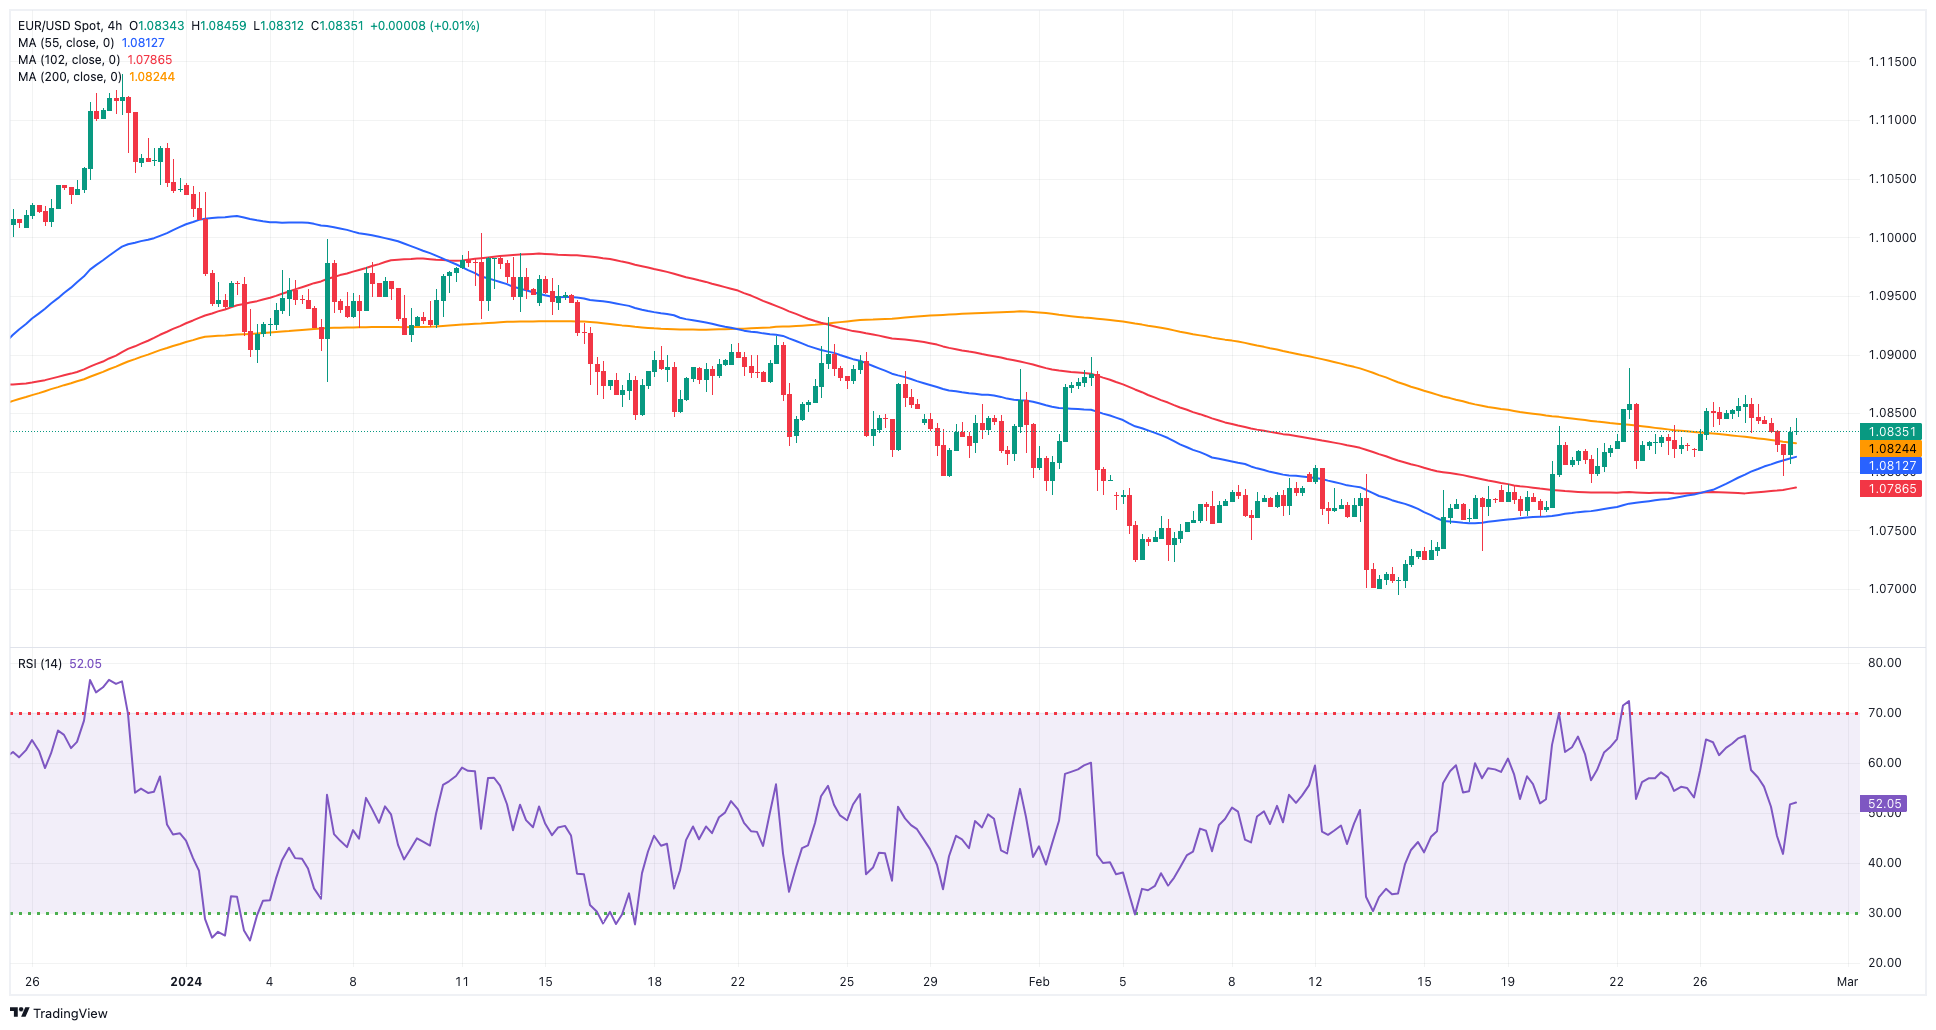
EUR/USD added to Tuesday’s pullback and dropped to fresh multi-session lows just below 1.0800 the figure, just to regain some traction afterwards and eventually end the day with marginal losses.
The opposite way faced the greenback, which rose past the 104.00 barrier when tracked by the USD Index (DXY) and ran out of steam after another revision of the US Q4 GDP Growth Rate came in slightly below estimates.
The small retracement in the pair also came amidst a generalized knee-jerk in US and German yields, always amidst steady speculation of the Fed’s rate cut in June.
Still around the Fed, J. Williams (New York) stated that the ongoing discussion regarding rate cuts indicates progress in efforts to reduce inflation, adding that it's probable that the Fed will implement rate cuts later in the year. Williams emphasized the importance of monitoring data to inform decisions regarding rate reductions.
Meanwhile, expectations around a similar move by the ECB in June were also reinforced after Boar member Kazimir noted rapid headline disinflation, but uncertainties remain regarding core indicators. He suggested a June rate cut followed by policy easing, refraining from forward guidance in March, and adding that current pricing for rate cuts is more realistic.
His colleague de Guindos predicted a more favourable inflation outlook, with prices expected to decrease. He suggested that the Governing Council adjust monetary policy if new data confirms this assessment.
On the domestic calendar, the final Consumer Confidence in the Euroland came in at -15.5 in February, while Economic Sentiment and Industrial Sentiment eased to 95.4 and -9.5, respectively.
Across the ocean, MBA’s Mortgage Applications contracted by 5.6% in the week to February 23, while the Q4 GDP Growth Rate showed the economy expanded by 3.2% over the last twelve months. Finally, the advanced Goods Trade Balance expects the trade deficit to widen to $90.2B in January.
Further upside momentum might push EUR/USD over the weekly top of 1.0888 (February 22), which is supported by the provisional 55-day SMA. North from here are the weekly peaks of 1.0932 (January 24) and 1.0998 (January 5, 11), which bolsters the psychological 1.1000 region. The breakout of this area exposes the December 2023 high of 1.1139 (December 27), which is reinforced by the 200-week SMA of 1.1147 and occurs before the 2023 top of 1.1275 (July 18). Just the opposite, the 2024 low of 1.0694 (February 14) is next, then the weekly low of 1.0495 (October 13, 2023), the 2023 low of 1.0448 (October 3), and the round level of 1.0400. The daily RSI dropped to the proximity of 48.
Resistance levels: 1.0865 1.0888 1.0897 (4H chart)
Support levels: 1.0796 1.0761 1.0732 (4H chart)
USDJPY
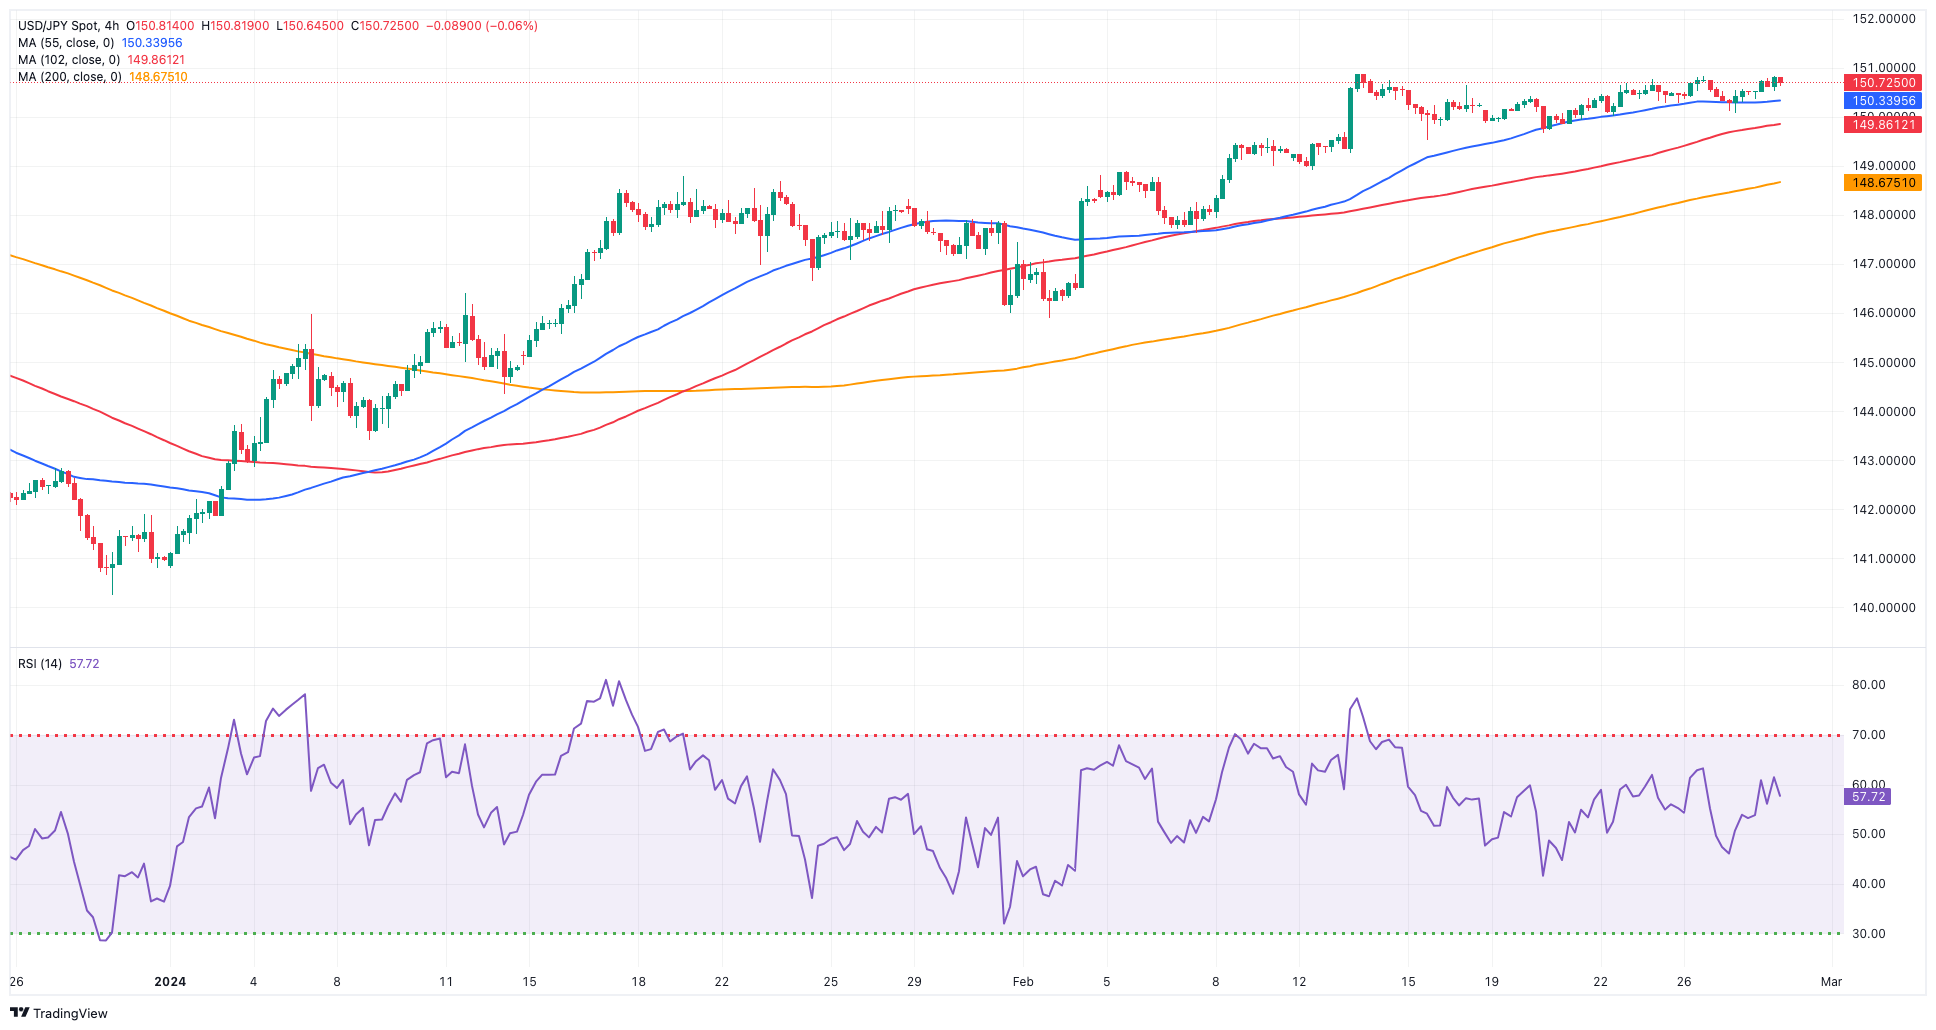
Further side-lined trade saw USD/JPY print decent gains above the 150.00 barrier, keeping the weekly erratic performance well in place and fading Tuesday’s decline at the same time.
Price action around the pair came amidst the resumption of bullish intentions in the greenback, while broad-based losses in the US yield curve seem to have also limited the upside.
In Japan, JGB 10-year yields reversed several sessions of losses and regained the 0.70% zone.
On the calendar, final prints saw the Coincident Index and the Leading Economic Index come in at 115.9 and 110.2, respectively, for the month of December.
If bulls retake the lead, USD/JPY may reach its 2024 high of 150.88 (February 13), prior to the 2023 top of 151.90 (November 13). Further north, the 2022 peak of 151.94 (October 21) is closely followed by the round figure of 152.00. In contrast, there is transitory contention at the 100-day and 55-day SMAs at 147.72 and 146.55, respectively, right before the February low of 145.89 (February 1). The critical 200-day SMA at 145.82 comes next, ahead of the December 2023 bottom of 140.24 (December 28), the round number of 140.00, and the July low of 137.23 (July 14). The day-to-day RSI rose to the boundaries of 65.
Resistance levels: 150.88 151.43 151.90 (4H chart)
Support levels: 149.68 148.92 147.61 (4H chart)
GBPUSD
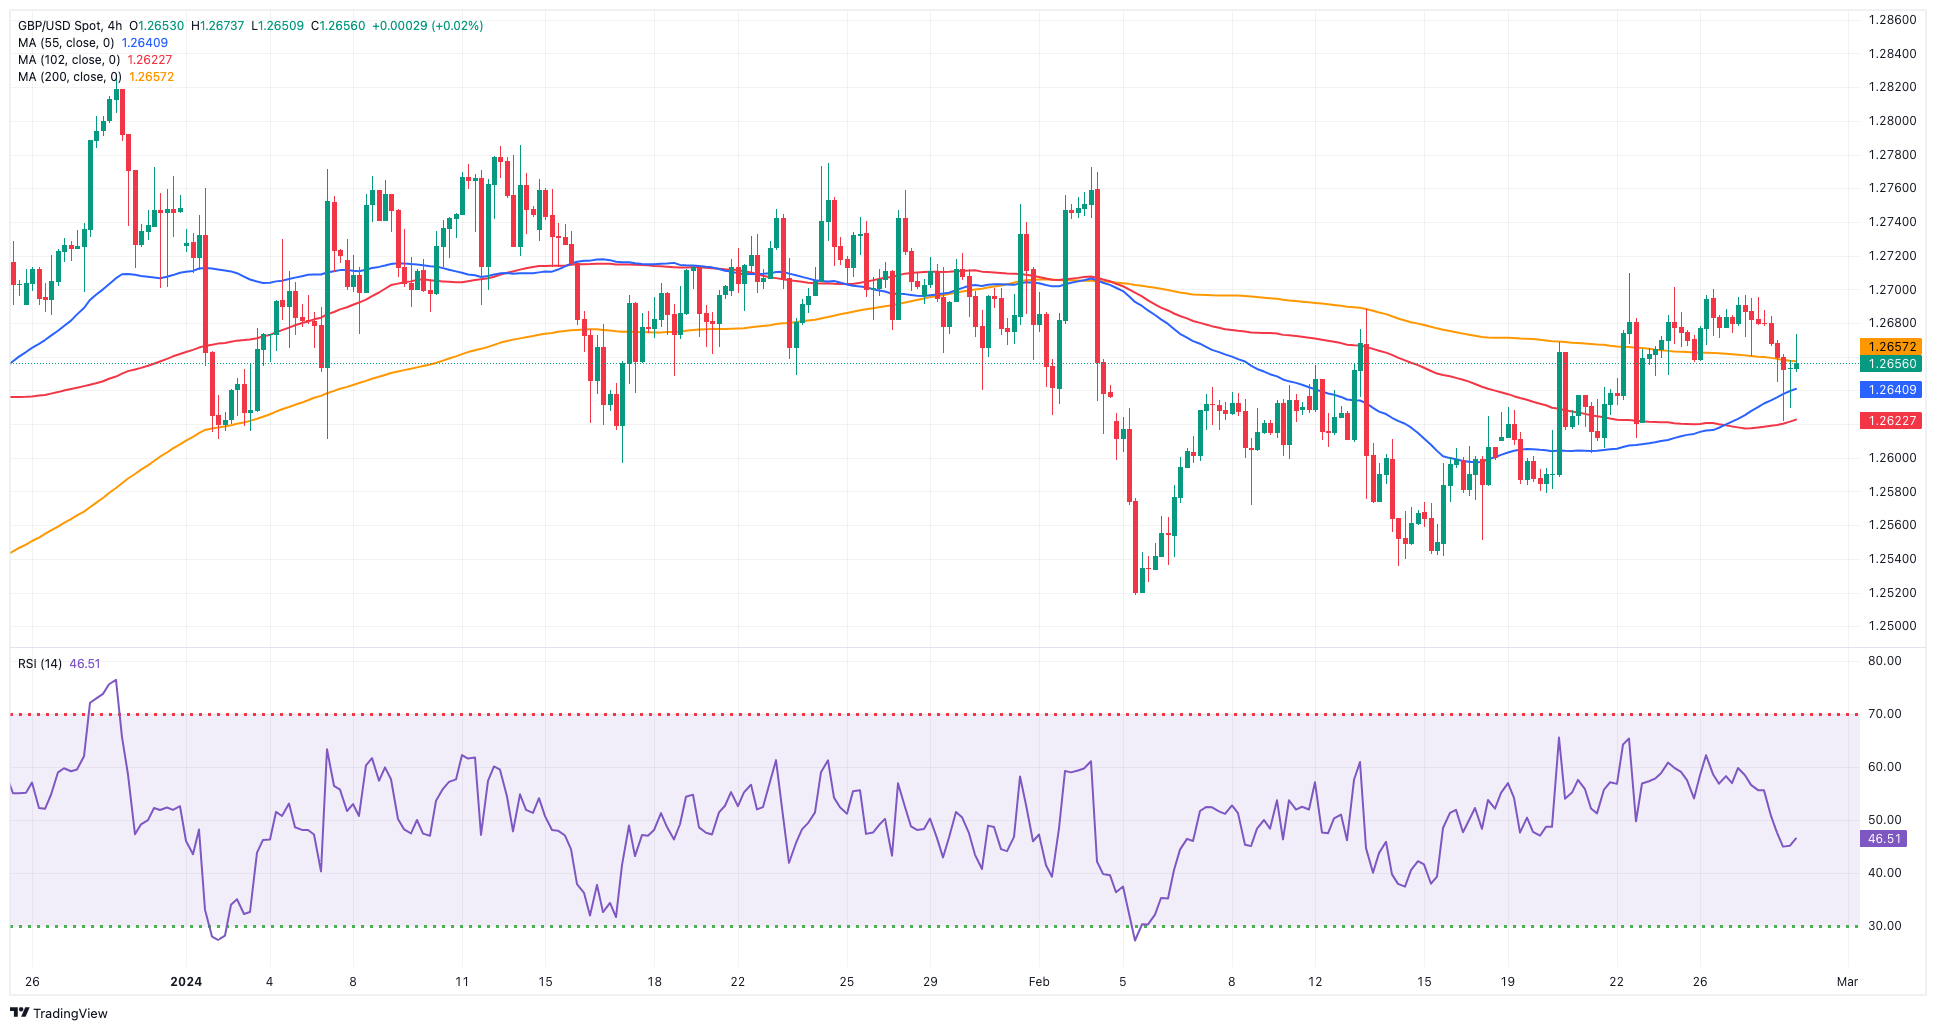
The selling pressure in GBP/USD gathered extra pace and dragged the pair to fresh four-day lows near the 1.2620 region on Wednesday.
The move lower in Cable followed the resurgence of buying interest in the greenback, which lifted the USD Index (DXY) back above the 104.00 hurdle despite yields being slightly on the defensive.
It was the second straight daily decline in the pair following a five-session recovery, as bulls seem to have met a tough nut to crack around the 1.2700 neighbourhood.
In the UK bond market, 10-year gilt yields maintained the upper end of the range, around 4.20%.
A deeper pullback might drag GBP/USD to revisit the key 200-day SMA at 1.2569 prior to the 2024 low of 1.2518 (February 5), and the December 2023 low of 1.2500 (December 13). Further decline might drive Cable to focus on the weekly bottom of 1.2187 (November 10, 2023), before the October 2023 low of 1.2037, the key 1.2000 mark and the 2023 low of 1.1802 (March 8). On the upside, there is an immediate barrier at the weekly top of 1.2709 (February 22), before the February peak of 1.2772 (February 2) and the 2024 high of 1.2785 (January 12). The breakout of the latter may lead to a battle for the December top of 1.2827 (December 28), which is ahead of the weekly peak of 1.2995 (July 27, 2023) and the important 1.3000 threshold. The everyday RSI broke below the 48 level.
Resistance levels: 1.2709 1.2772 1.2827 (4H chart)
Support levels: 1.2621 1.2579 1.2518 (4H chart)
GOLD
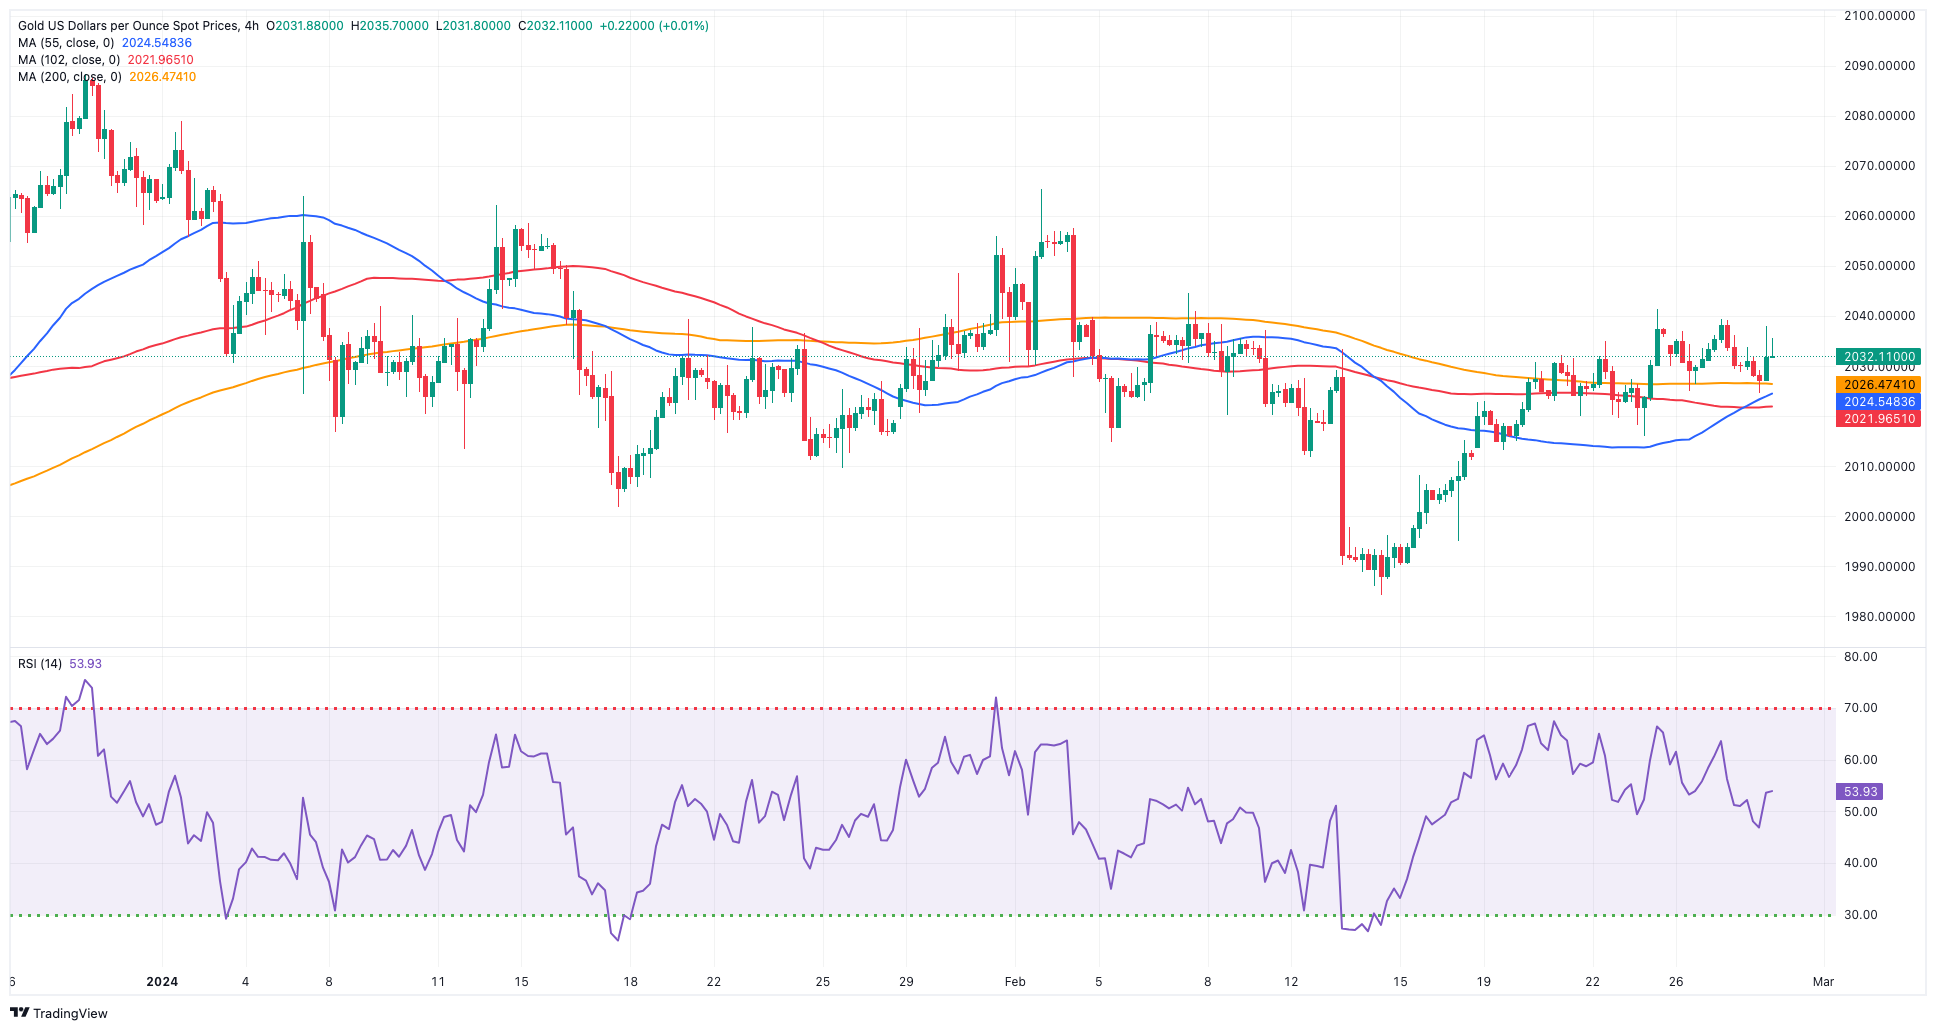
Gold prices saw a small recovery and managed to approach the $2,040 region per troy ounce on Wednesday.
The decent advance in the precious metal followed the continuation of the weekly choppy trade and came despite the rebound in the greenback. However, the generalized negative bias in US yields across different maturities appears to have sustained the daily uptick.
Looking forward, there will be continued close examination of the yellow metal leading up to the release of US inflation data, as measured by the PCE, on February 29, always against the backdrop of ongoing speculation about the timing of the Fed’s first interest rate cut, which should come around June, according to the broad consensus.
The surpass of the weekly peak of $2,041 (February 23) could propel Gold to its February high of $2,065 (February 1), prior to the weekly top of $2,088 (December 28) and all-time peak of $2,150 (December 4, 2023). Conversely, there is a temporary support at the 100-day SMA at $2,007 seconded by the 2024 low of $1,984 (February 14), and the December 2023 low of $1,973, which is supported by its proximity to the crucial 200-day SMA of $1,966 and emerges ahead of the November 2023 low of $1,931. A deeper retracement could see the yellow metal retest the October 2023 low of $1,810, ahead of the 2023 low of $1,804, and the critical $1,800 contention zone.
Resistance levels: $2,041 $2,065 $2,078 (4H chart)
Support levels: $2,024 $2,016 $1,984 (4H chart)
CRUDE WTI
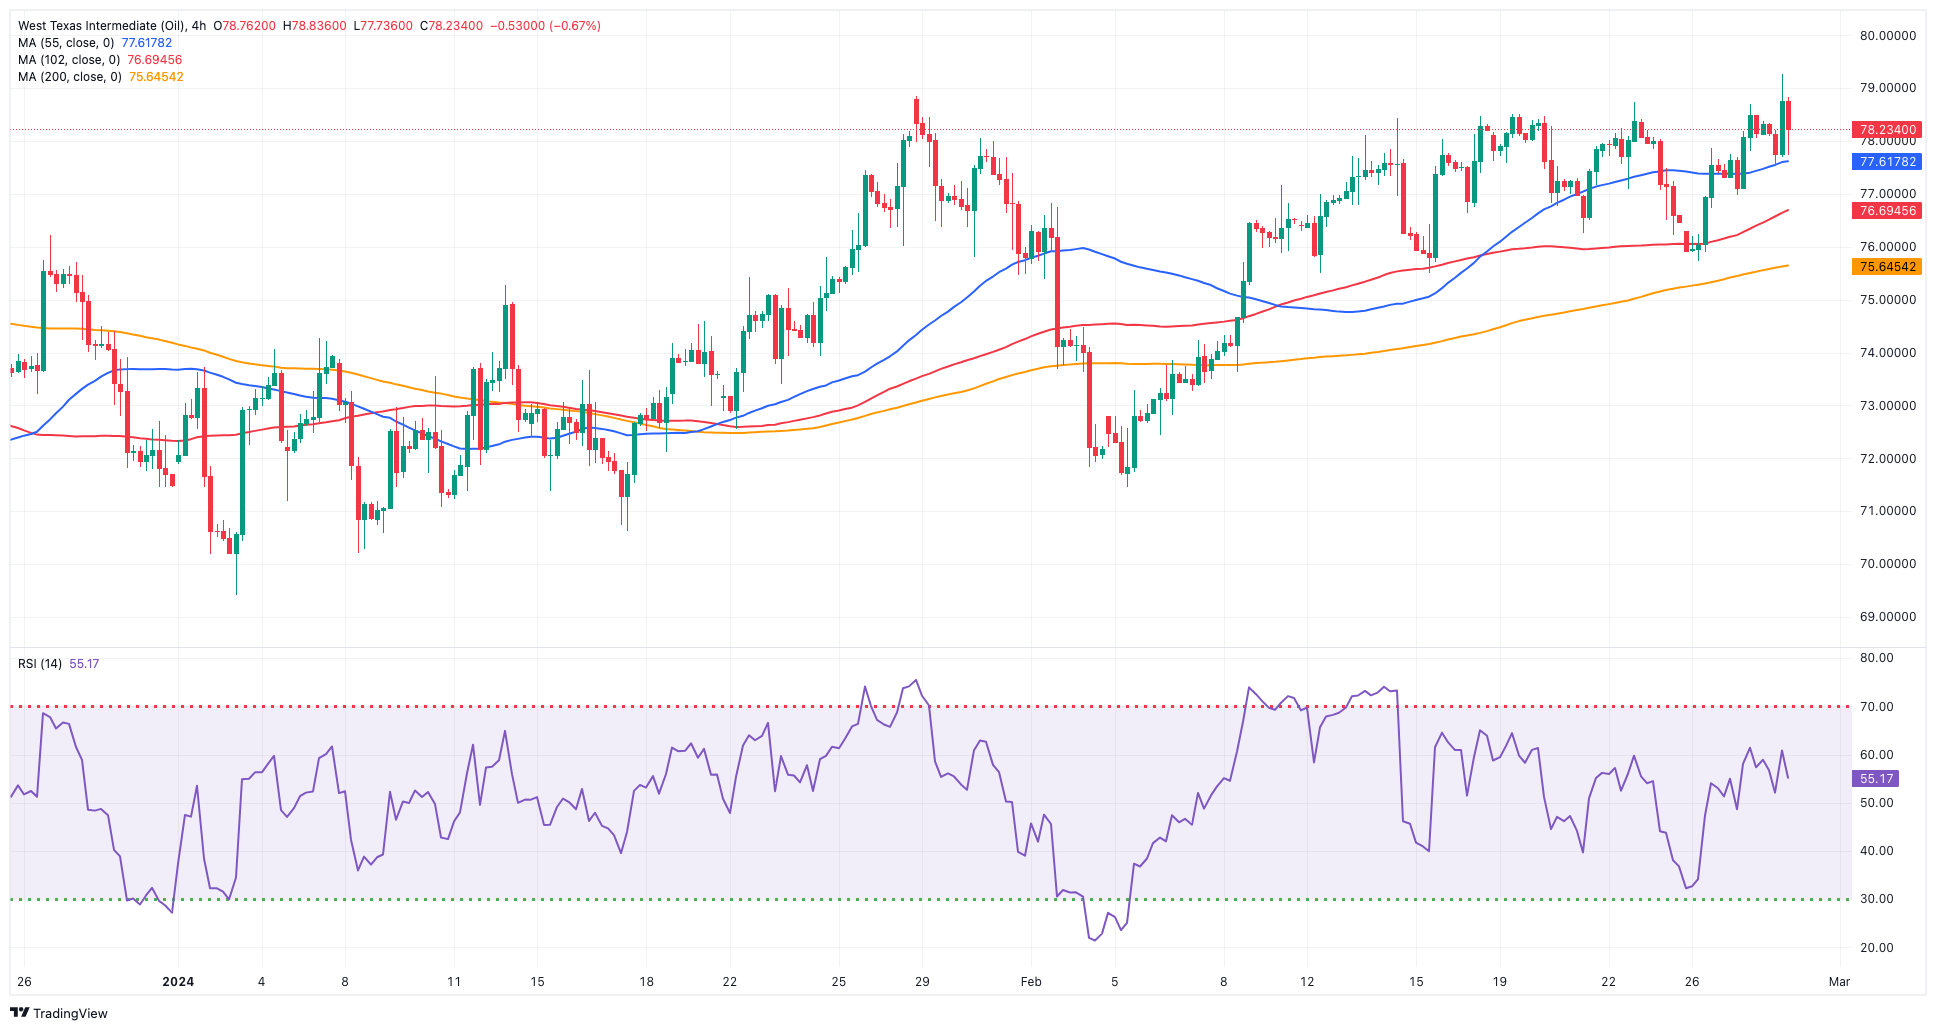
Prices of the American benchmark for sweet light crude oil extended their weekly bullish performance and clinched a new YTD peak around $79.60 per barrel on Wednesday.
Traders, however, could not sustain that initial bull run as persistent hopes of a ceasefire in the Middle East crisis and the larger-than-expected weekly build in US crude oil supplies eventually weighed on sentiment.
On the latter, the EIA reported that US crude oil inventories unexpectedly increased by 4.199M barrels in the week to February 23, while supplies at Cushing rose by 1.458M barrels, Weekly Distillate Stocks dropped by 0.510M barrels, and gasoline stockpiles contracted more than estimated by 2.832M barrels.
Collaborating with the upside momentum remained the likelihood that the OPEC+ could extend its supply cuts, as well as the still unabated effervescence in the Red Sea and omnipresent hopes of a rebound in crude oil demand in China.
The following upward challenge for WTI is the 2024 top of $79.58 (February 28), which comes just ahead of the important $80.00 barrier and the November 2023 peak of $80.15 (November 3). Once the commodity clears the latter, it could advance to its weekly high of $89.83 (October 18, 2023), ahead of the 2023 top of $94.99 (September 28, 2023), the August 2022 peak of $97.65 (August 30), and the psychological $100.00 barrier. Instead, the 55-day SMA should offer interim support at $74.44 prior to the February low of $71.43 (February 5) and he important $70.00. Down from here aligns the 2024 bottom of $69.31 (January 3).
Resistance levels: $79.58 $83.56 $85.85 (4H chart)
Support levels: $75.81 $75.49 $71.37 (4H chart)
GER40
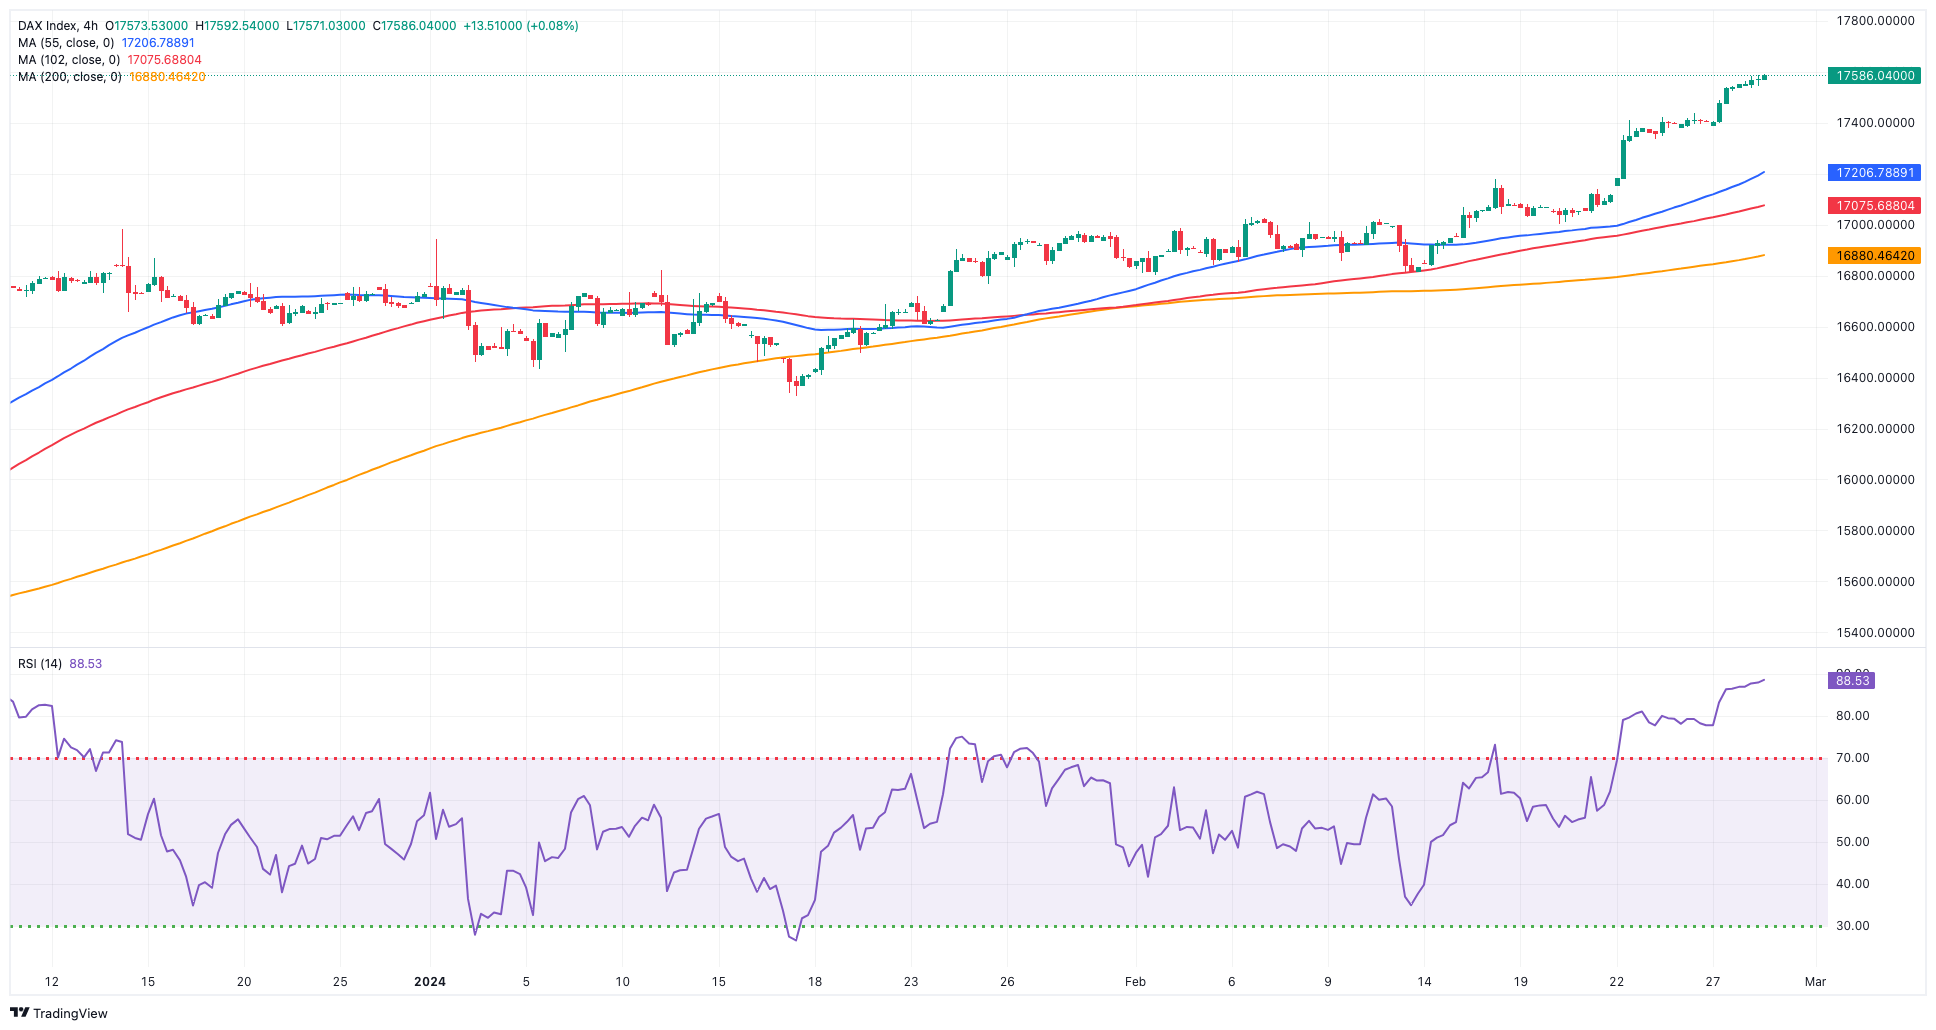
Another day, another record high in Germany’s DAX40, which this time advanced just beyond the 17,600 mark.
Further gains in German equities came in tandem with the mixed performance of their European peers and were underpinned by the solid price action around plane-maker Airbus.
Meanwhile, traders remained prudent ahead of the release of key inflation figures in the euro area and the US on Thursday, measured by the CPI and the PCE, respectively, always amidst ongoing speculation of the Fed and ECB intentions to reduce their interest rates at some point this summer.
Daily gains in the DAX40 were also accompanied by a marginal pullback in 10-year bund yields, which receded to the 2.45% zone.
The DAX40's next upward barrier is its all-time high of 17,605 (February 28). The other way around, there is transitory support at the 55-day SMA at 16,859, which precedes the February low of 16,821 (February 1). The breakdown of this zone might bring back into focus the 2024 bottom at 16,345 (January 17), which is just above the critical 200-day SMA at 16,061 and the weekly bottom of 15,915 (November 28). Down from here emerges the October 2023 low of 14,630 (October 23) followed by the March 2023 low of 14,458 (March 20). The daily RSI rose to the vicinity of 76, remaining well in the overbought region.
Best Performers: Airbus Group, MTU Aero, Heidelbergcement
Worst Performers: Infineon, Vonovia, Bayer
Resistance levels: 17,605 (4H chart)
Support levels: 17,039 16,831 16,732 (4H chart)
GBPJPY
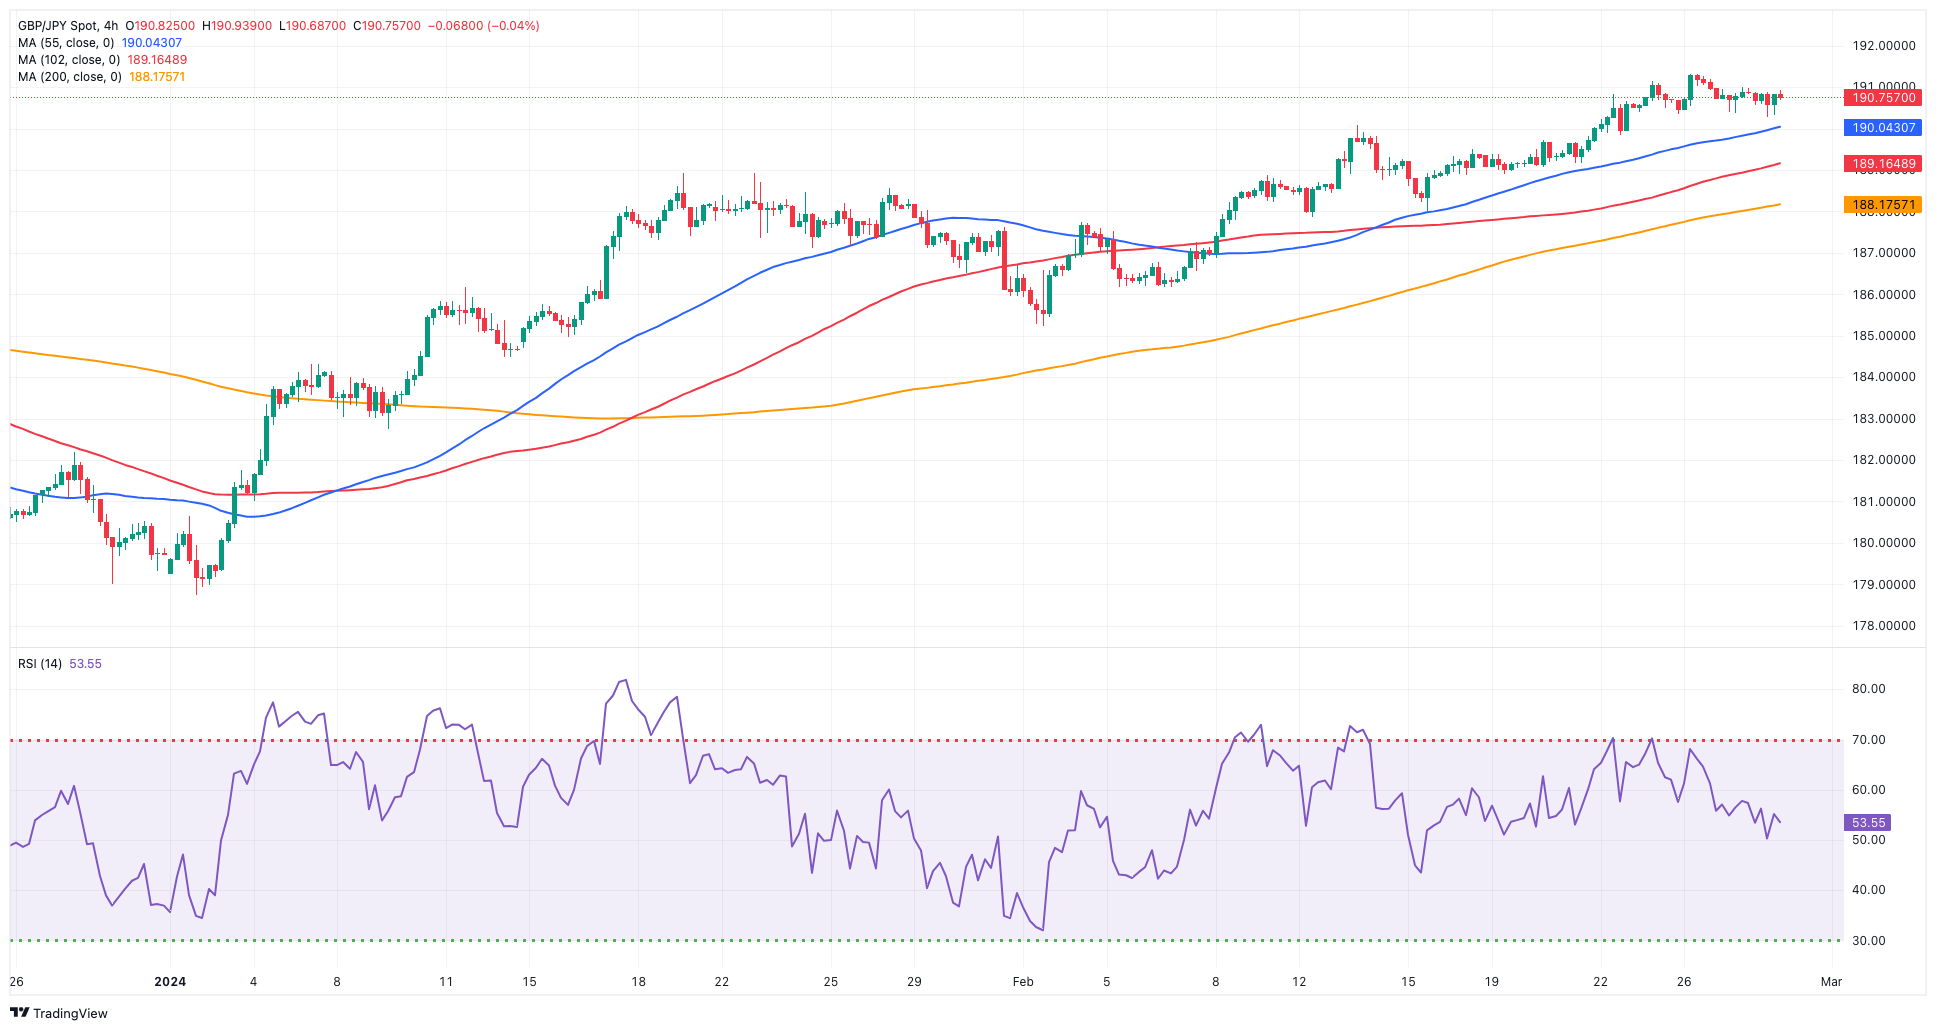
The combination of a stronger Japanese yen with the renewed selling pressure in the British pound played against any recovery in GBP/JPY, favouring instead the continuation of Tuesday’s downward bias.
In the meantime, the yen strengthened for the second session in a row after Tuesday’s inflation figures in Japan ignited chatter of a BoJ’s lift-off in the relatively short-term horizon, while lower US yields vs. the uptick in JGB 10-year yields also helped the yen extend its momentum.
The next goal for GBP/JPY is the 2024 high of 191.32 (February 26), which comes ahead of the August 2015 top of 195.28 (August 18), and the record peak of 195.88 (June 24, 2015). On the contrary, the 55-day SMA at 185.84 offers provisional support ahead of the February low of 185.22 (February 1), which remains underpinned by the interim 100-day SMA at 185.27 and comes before the more crucial 200-day SMA at 183.27. The loss of this region should not see any support of significance until the December 2023 bottom of 178.33 (December 14), seconded by the October 2023 low of 178.03 (October 3) and the July 2023 bottom of 176.30. On the daily chart, the RSI deflated to around 67.
Resistance levels: 191.32 195.28 195.88 (4H chart)
Support levels: 190.27 187.99 185.22 (4H chart)
NASDAQ
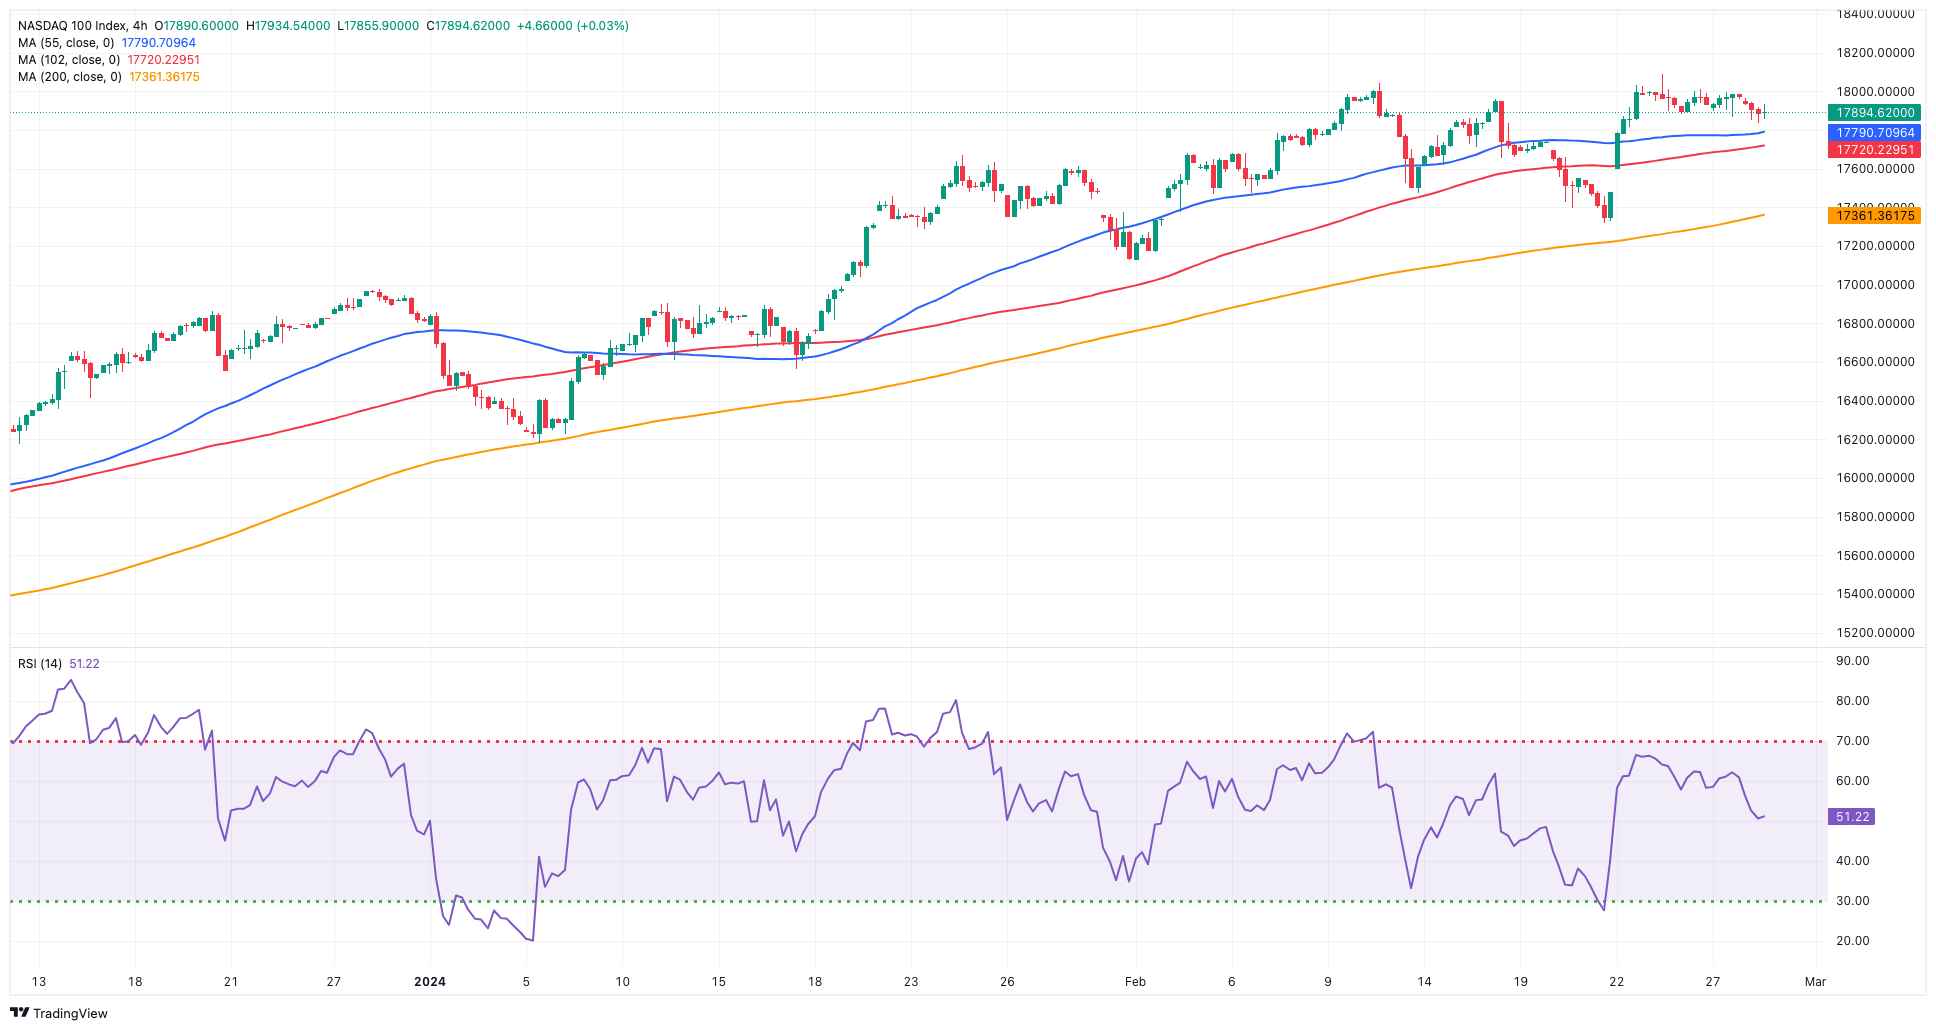
Matching their US peers, the tech benchmark Nasdaq 100 tested fresh multi-session lows in the sub-17,900 region on Wednesday.
The resumption of the bearish mood came pari passu with increasing cautiousness ahead of the publication of the Fed’s preferred gauge of inflation on February 29, the PCE.
Indeed, market participants will meticulously analyze this data to assess its potential influence on the Fed’s probable inclination to implement rate cuts in the upcoming months, with June still being the most probable timeframe.
Further increases in the Nasdaq 100 could revisit the all-time high of 18,091 (February 23). On the flip side, the index may retest the weekly lows of 17,319 (February 21) and 17,128 (January 31), which occur just ahead of the transitory 55-day SMA of 17,117. The breach of the latter could put a potential test of the 2024 low of 16,249 (January 5) back on the radar prior to the December 2023 low of 15,695 (December 4), and the important 200-day SMA of 15,601. The low in October 2023 is 14,058 (October 26), followed by the April 2023 low of 12,724 (April 25), the March 2023 low of 11,695 (March 13), and the 2023 low of 10,696 (January 3). The daily RSI dropped below 59.
Top Gainers: Constellation Energy, Tesla, Keurig Dr Pepper
Top Losers: Sirius XM, Applied Materials, Micron
Resistance levels: 18,091 (4H chart)
Support levels: 17,319 17,128 16,561 (4H chart)
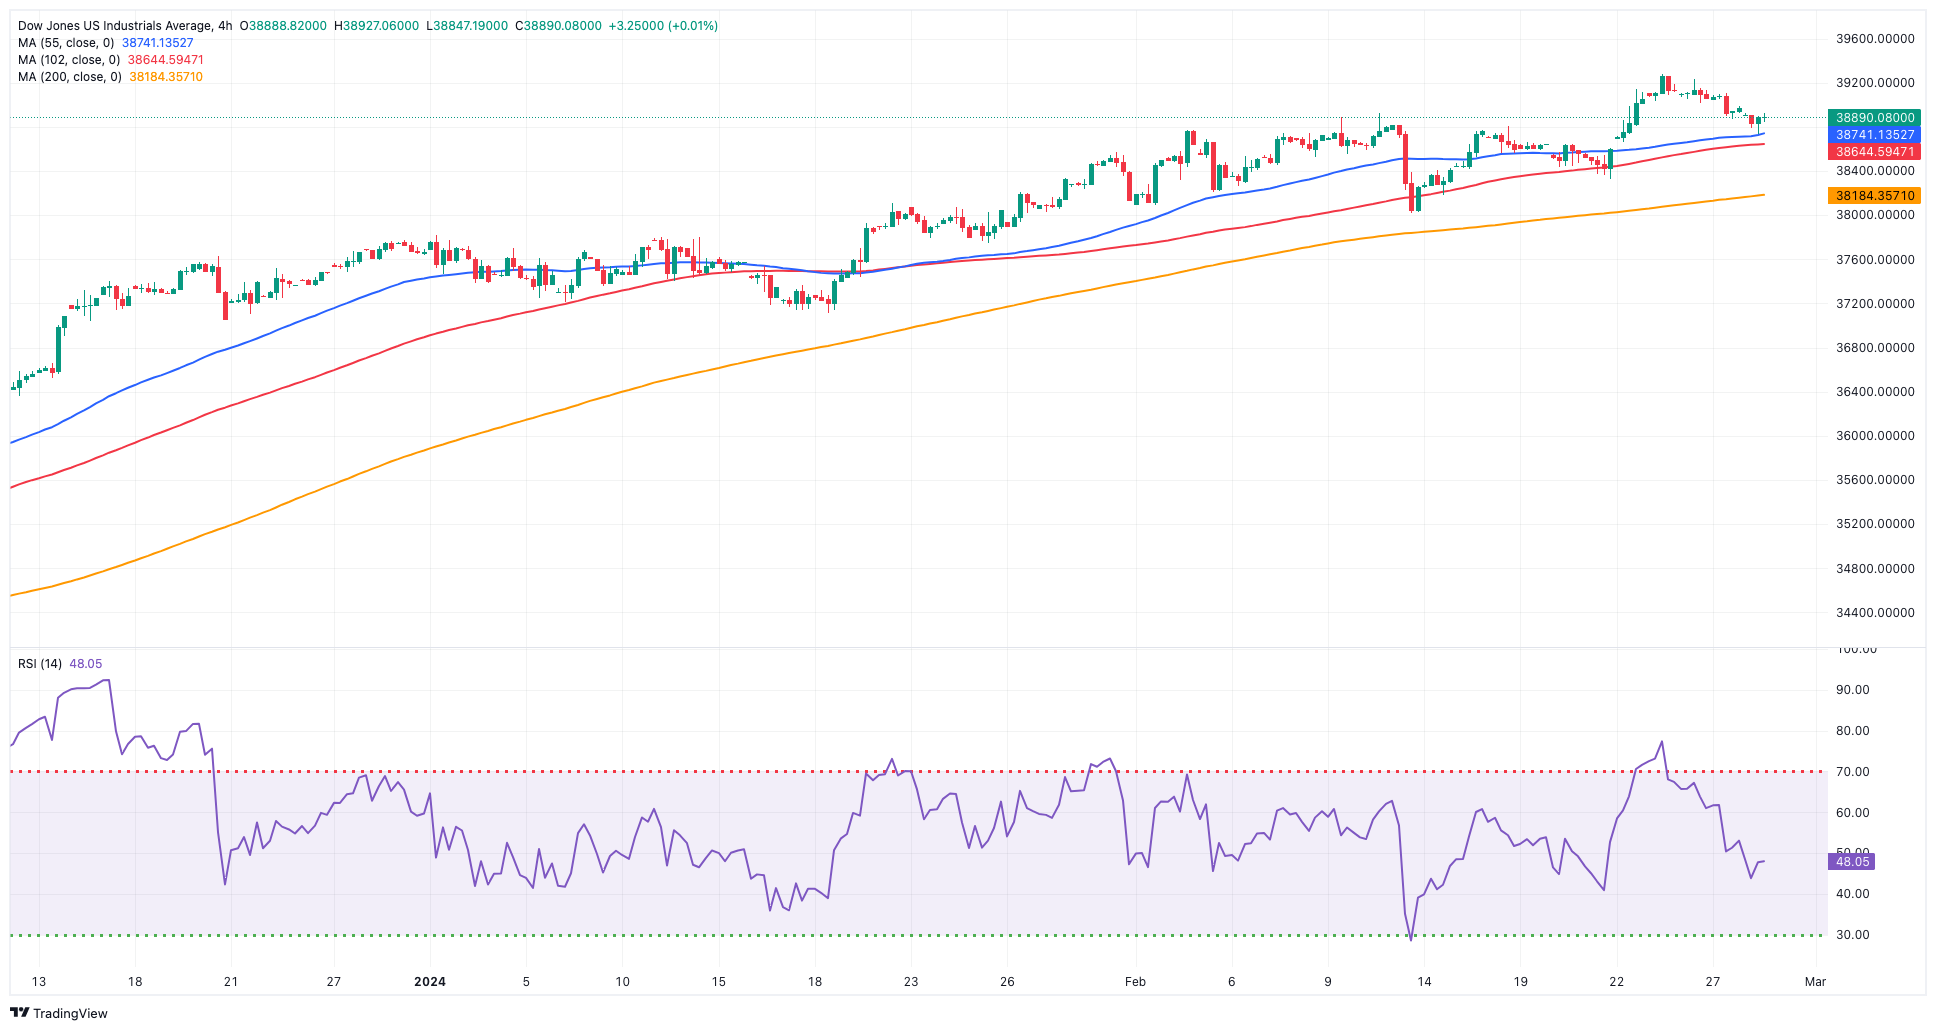
DOW JONES
The corrective move remained well in place for US stocks on Wednesday, prompting the Dow Jones to drop for the third consecutive session, as investors awaited an upcoming inflation report that would impact their expectations regarding the potential timing of the Fed interest rate cuts.
Certainly, caution continued to rise in anticipation of the release of US inflation data monitored by the PCE on February 29, amid persistent speculation regarding a prospective rate reduction by the Fed in June or beyond.
Still around the Fed, New York’s J. Williams noted tha the ongoing discussion regarding rate cuts is a positive indication of progress in the efforts to reduce inflation. Williams added that it is likely that the Fed will implement rate cuts later in the year as a part of their strategy.
On Wednesday, the Dow Jones dropped 0.13% to 38,921, the S&P 500 eased 0.07% to 5,074, and the tech-centric Nasdaq Composite retreated 0.47% to 15,960.
Bulls continue to target the record high of 39,282 (February 23). Having said that, the 55-day SMA at 37,887 serves as temporary support, followed by the 2024 low of 37,122 (January 18) and the weekly low of 37,073 (December 20, 2023). A drop below this level might motivate the Dow Jones to confront the intermediate 100-day SMA at 36,238, prior to the 200-day SMA at 35,253. The weekly low of 33,859 (November 7, 2023) comes next, ahead of the October 2023 low of 32,327 (October 27) and the 2023 low of 31,429 (March 15). The daily RSI fell towards the 60 level.
Top Performers: Boeing, Walt Disney, Goldman Sachs
Worst Performers: UnitedHealth, Intel, Apple
Resistance levels: 39,282 (4H chart)
Support levels: 38,501 38,039 37,122 (4H chart)
MACROECONOMIC EVENTS

All Information & Updates provided by:

All information relating to the financial markets available on this page has been prepared and issued by FXStreet (Forexstreet SL, Spain, Reg: B62498233) on the basis of publicly available information and all information believed to be reliable and does not conflict with Kuwaiti local laws, and all necessary care has been taken to before the company to ensure that the facts mentioned are correct from the source.
NCM Investment nor any of its directors or employees shall in any way be held responsible for the contents of this news, and the information contained on this page is intended only to provide clients with publicly available information and should not be construed as investment advice, report or analysis and/or constitute an offer or invitation to buy or sell financial instruments of any kind.
RISK WARNING: Forex and CFDs are highly risky leveraged products, as losses can exceed deposits. Please ensure you understand all the risks and take independent advice if necessary. NCM will segregate the clients based on the criteria of the regulator and its bylaws. NCM does not provide any advisory service; the material published does not constitute advice or a recommendation for a transaction in any financial instrument. NCM accepts no responsibility for any use of the content presented and any consequences of that use. Anyone acting on the information provided does so at their own risk.