
- Contact Us:
-

-

-

-


Daily Market Updates
01 Mar 2024
EURUSD
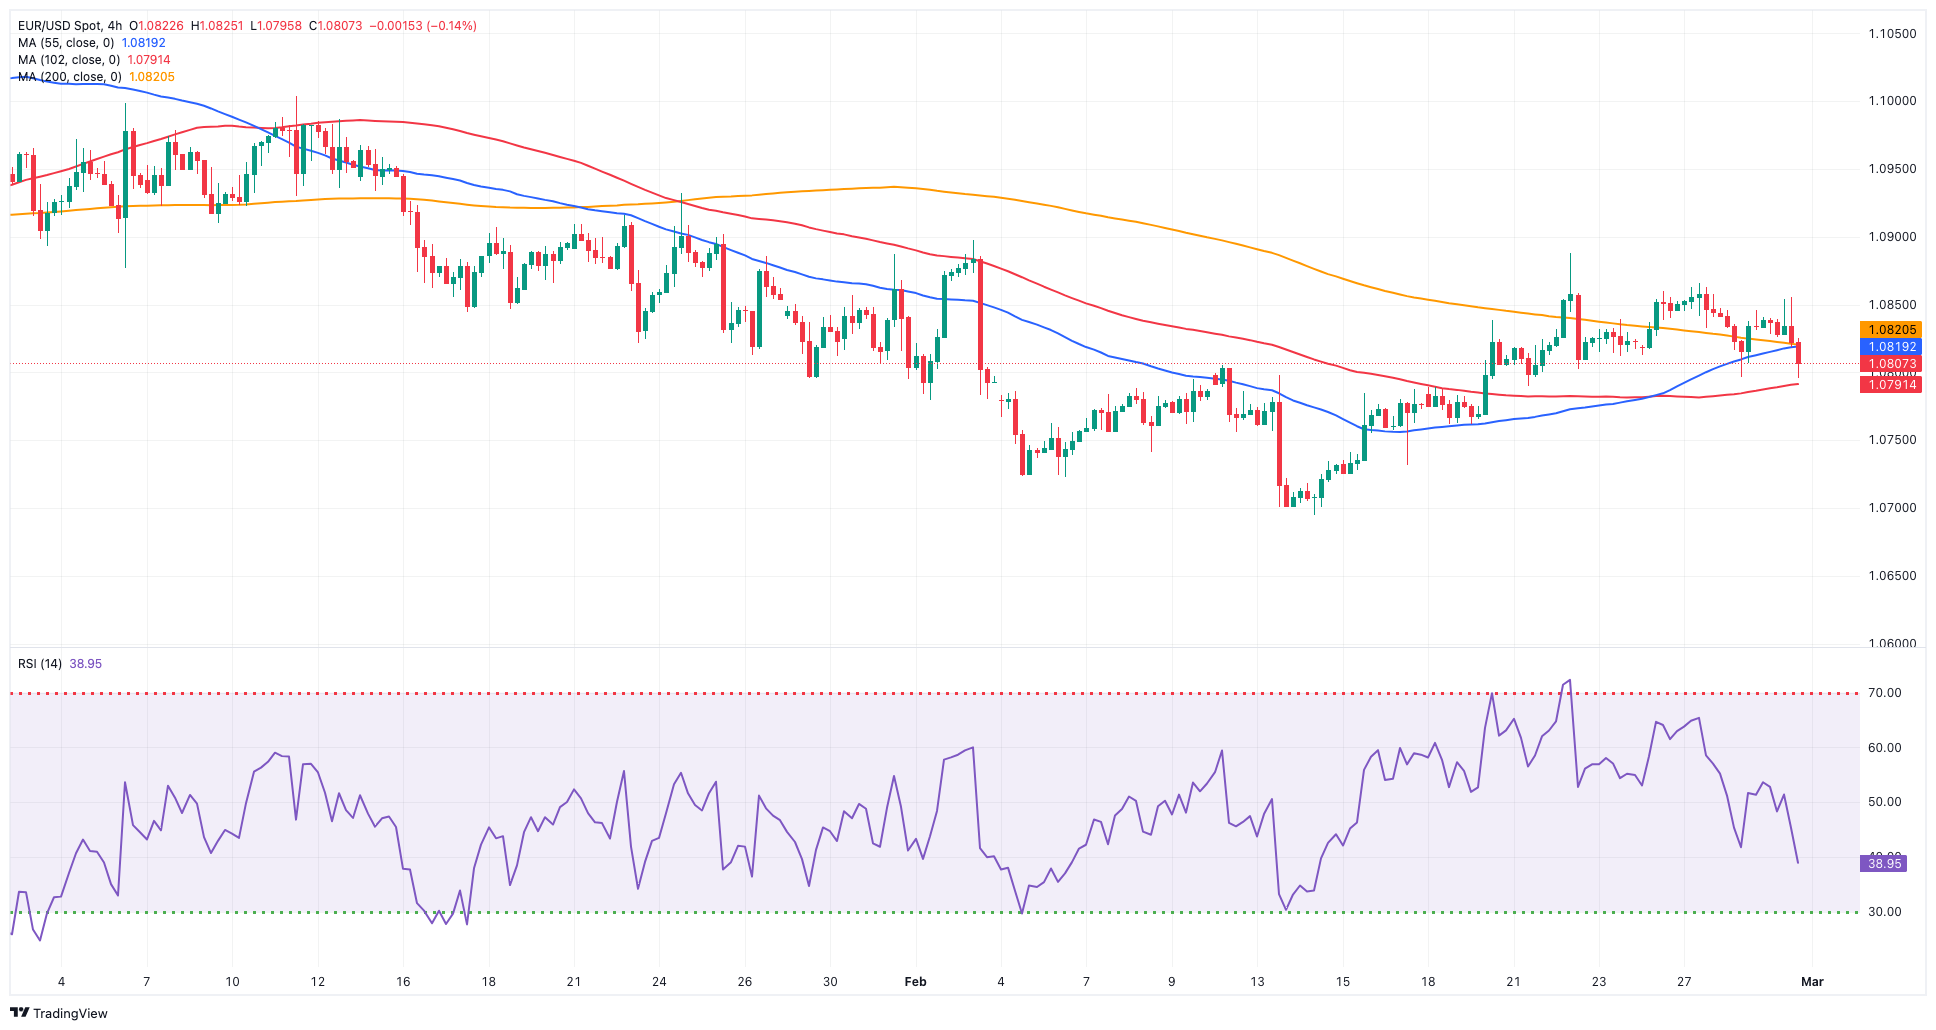
There was no respite for the selling pressure around the risk-associated universe on Thursday, with EUR/USD breaking below the 1.0800 support level to print fresh weekly lows.
The pair’s negative price action came in tandem with the intense upside momentum in the greenback, which motivated the USD Index (DXY) to return above the 104.00 hurdle despite lower yields, although underpinned by a steady tighter-for-longer narrative from Fed officials.
On the latter, the Fed's Bostic warned of a challenging journey to the 2% inflation target, suggesting vigilance and attentiveness. He suggested lowering the policy rate during the summer, with economic indicators determining the timing. His colleague Daly (San Francisco) hinted at the idea that inflation can get stuck if the Fed cuts rates sooner than expected.
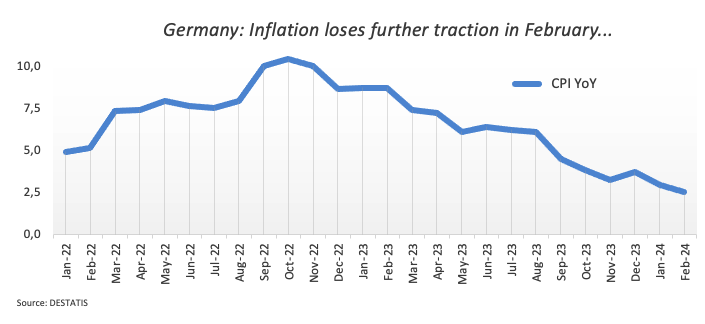
On the docket, Germany took centre stage after Retail Sales contracted 1.4% in the year to January. From the labour market report, the jobless rate held steady at 5.9% and the Unemployment Change increased by 11K individuals. Finally, advanced inflation figures saw the CPI gaining 2.5% YoY in February, less than estimated.

In the US, headline PCE rose 2.4% in the first month of the year and 2.8% when it came to the Core PCE. In addition, Personal Income increased by 1.0% MoM in January and Personal Spending rose by 0.2% from a month earlier. Finally, weekly Claims went up by 215K in the week to February 24 and Pending Home Sales contracted by 8.8% in the year to January.
Further weakness could see EUR/USD revisiting the 2024 low of 1.0694 (February 14), followed by the weekly low of 1.0495 (October 13, 2023), the 2023 low of 1.0448 (October 3), and the round level of 1.400. On the contrary, initial resistance emerges at the weekly high of 1.0888 (February 22), which is supported by the provisional 55-day SMA (1.0882). North of here are weekly tops of 1.0932 (January 24) and 1.0998 (January 5, 11), which support the psychological 1.1000 threshold. The breakout of this region reveals the December 2023 peak of 1.1139 (December 27), which is strengthened by the 200-week SMA of 1.1147 and happens before the 2023 high of 1.1275 (July 18). The daily RSI decreased to around 46.
Resistance levels: 1.0865 1.0888 1.0897 (4H chart)
Support levels: 1.0795 1.0761 1.0732 (4H chart)
USDJPY
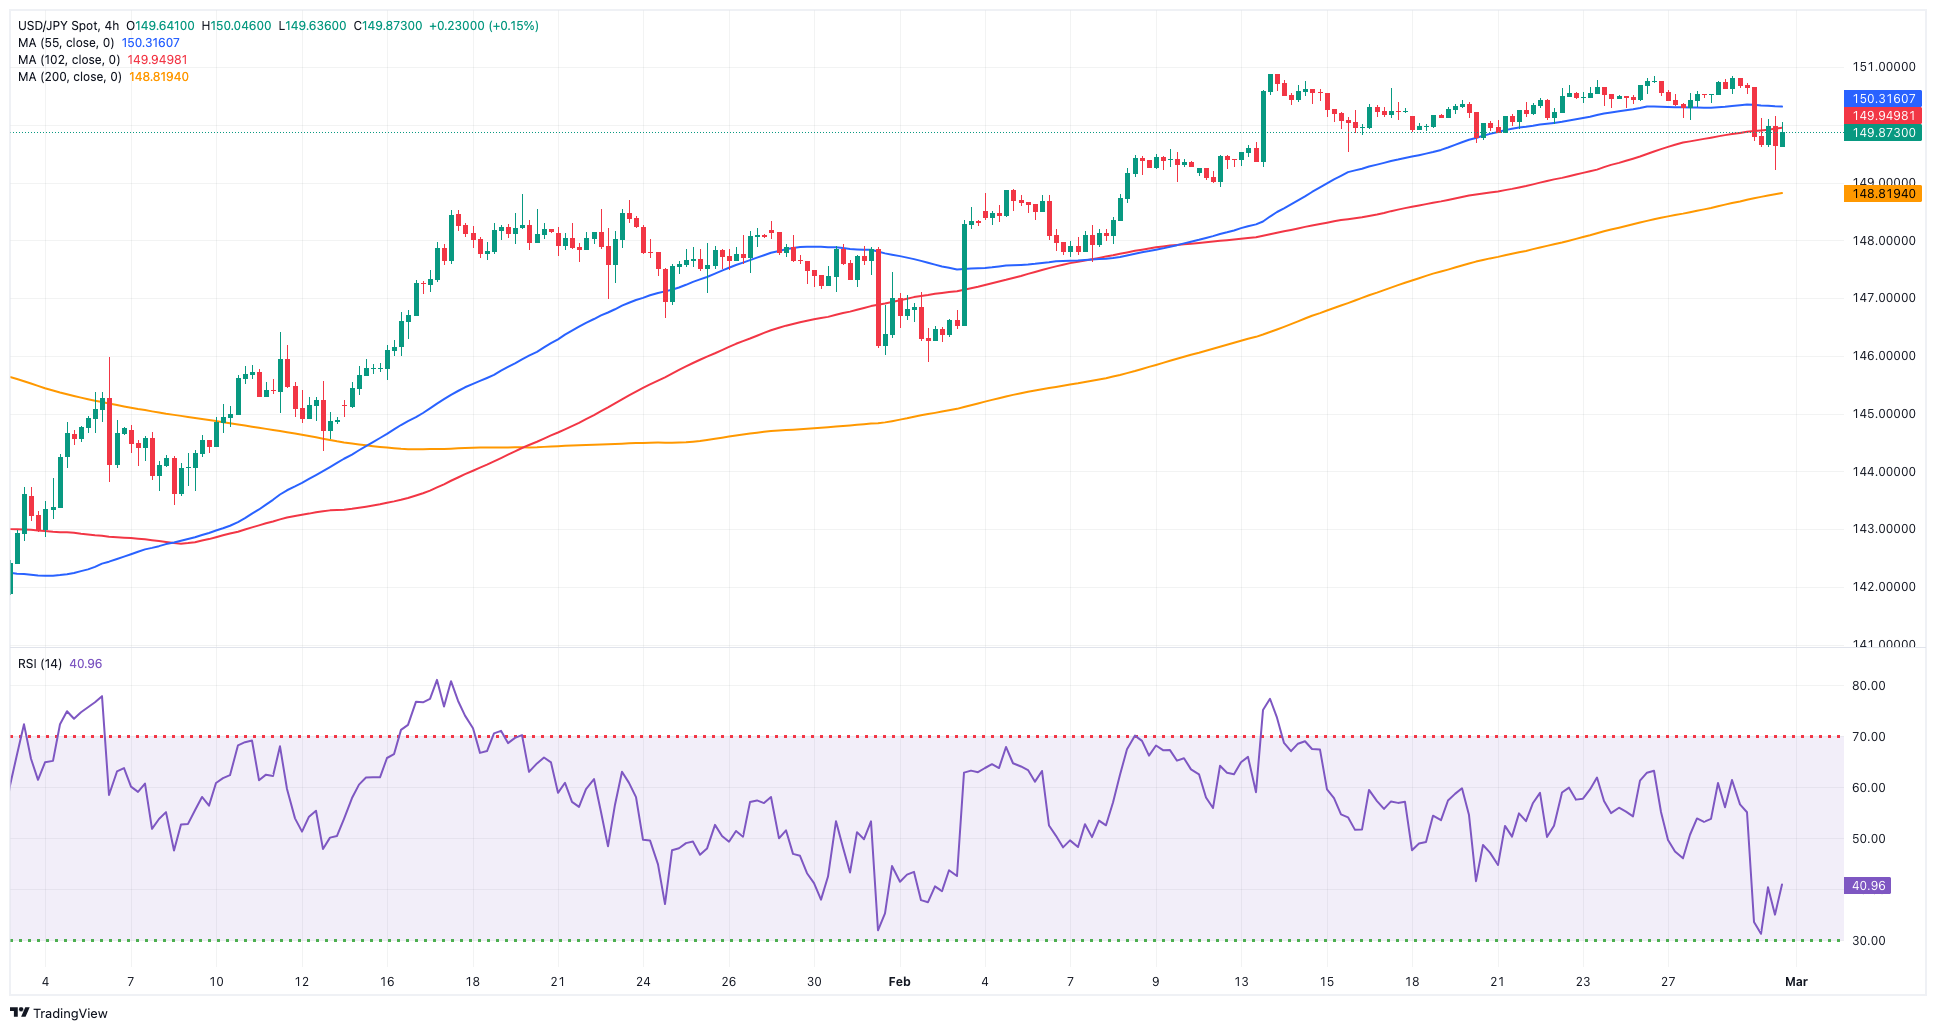
USD/JPY deflated to two-week lows well south of the 150.00 contention zone on Thursday.
In fact, the marked decline in the pair came despite the move higher in the dollar and exclusively followed hawkish comments from BoJ’s Board member Takata, who expressed that while uncertainties persist for Japan’s economy, he believes the price target is gradually becoming achievable. He noted that the economy is at a critical point where there is potential for a change in the prevailing belief that wages and inflation will remain stagnant. Takata emphasized the importance of contemplating adaptable measures, such as potential exits, such as terminating the yield curve control framework and negative interest rates, and addressing commitments to avoid overshooting.
Adding to the downside momentum in spot, US yields added to the weakness seen in the precious session vs. a move to multi-day peaks in JGB 10-year yields.
On the Japanese calendar, Foreign Bond Investment contracted to ¥257B in the week to February 24, flash Industrial Production contracted 1.5% YoY in January, and Retail Sales increased by 2.3% YoY in the same month. Closing the docket, Housing Starts dropped by 7.5% over the last twelve months.
If losses accelerate, USD/JPY could revisit the interim 100-day and 55-day SMAs at 147.73 and 146.68, respectively, before the February low of 145.89 (February 1). The important 200-day SMA at 145.87 is next, ahead of the December 2023 bottom of 140.24 (December 28), the round number of 140.00, and the July low of 137.23. (July 14). In contrast, the 2024 high of 150.88 (February 13) emerges as the immediate upside barrier prior to the 2023 top of 151.90 (November 13). Further north, the 2022 high of 151.94 (October 21) is closely followed by the round figure of 152.00. The daily RSI shrank to the 57 region.
Resistance levels: 150.88 151.43 151.90 (4H chart)
Support levels: 149.20 148.81 147.61 (4H chart)
GBPUSD
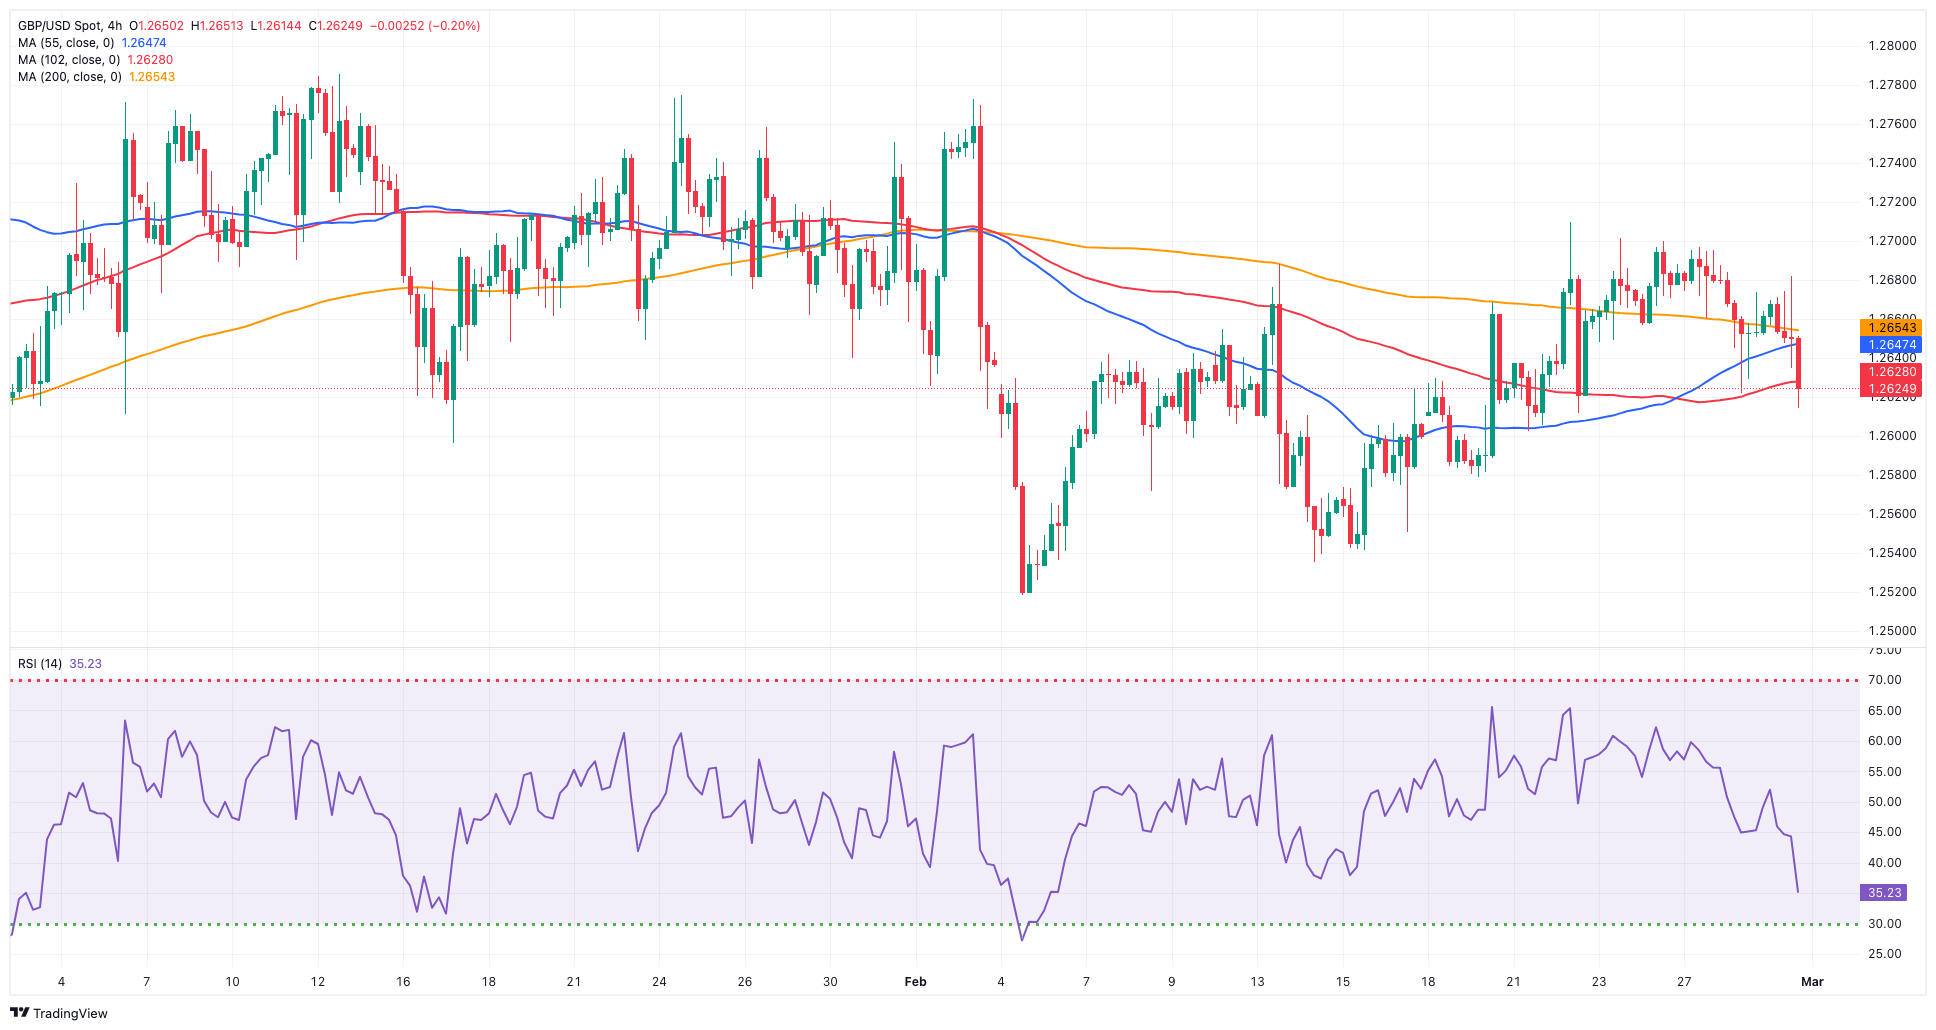
GBP/USD tumbled to fresh weekly lows in the 1.2615/10 band on Thursday, adding to Wednesday’s negative performance.
Indeed, Cable suffered the persistent buying pressure in the greenback, which seems to have been propped up by steady Fedspeak favouring a rate cut by the Fed in the summer despite US PCE showing further loss of momentum in inflation.
Accompanying the bearish tone in the British pound, UK 10-year gilt yields edged lower to the vicinity of 4.10% after three daily advances.
In the UK, Mortgage Approvals rose by 55.227K in January, and Mortgage Lending shrank by £1.086B in the same period.
A further drop may cause GBP/USD to retest the crucial 200-day SMA at 1.2569, prior to the interim 100-day SMA at 1.2538 and the 2024 bottom of 1.2518 (February 5). The breach of this level unveils the December 2023 low of 1.2500 (December 13) ahead of the weekly bottom of 1.2187 (November 10, 2023), the October 2023 low of 1.2037, the critical 1.2000 level, and the 2023 low of 1.1802 (March 8). On the upside, there is an immediate hurdle at the weekly top of 1.2709 (February 22), ahead of the February peak of 1.2772 (February 2) and the 2024 high of 1.2785. (January 12). The breakout of the latter might lead to a struggle for the December high of 1.2827 (December 28), which is ahead of the weekly top of 1.2995 (July 27, 2023) and the important 1.3000 threshold. The everyday RSI decreased to the 49 zone.
Resistance levels: 1.2709 1.2772 1.2827 (4H chart)
Support levels: 1.2614 1.2579 1.2518 (4H chart)
GOLD
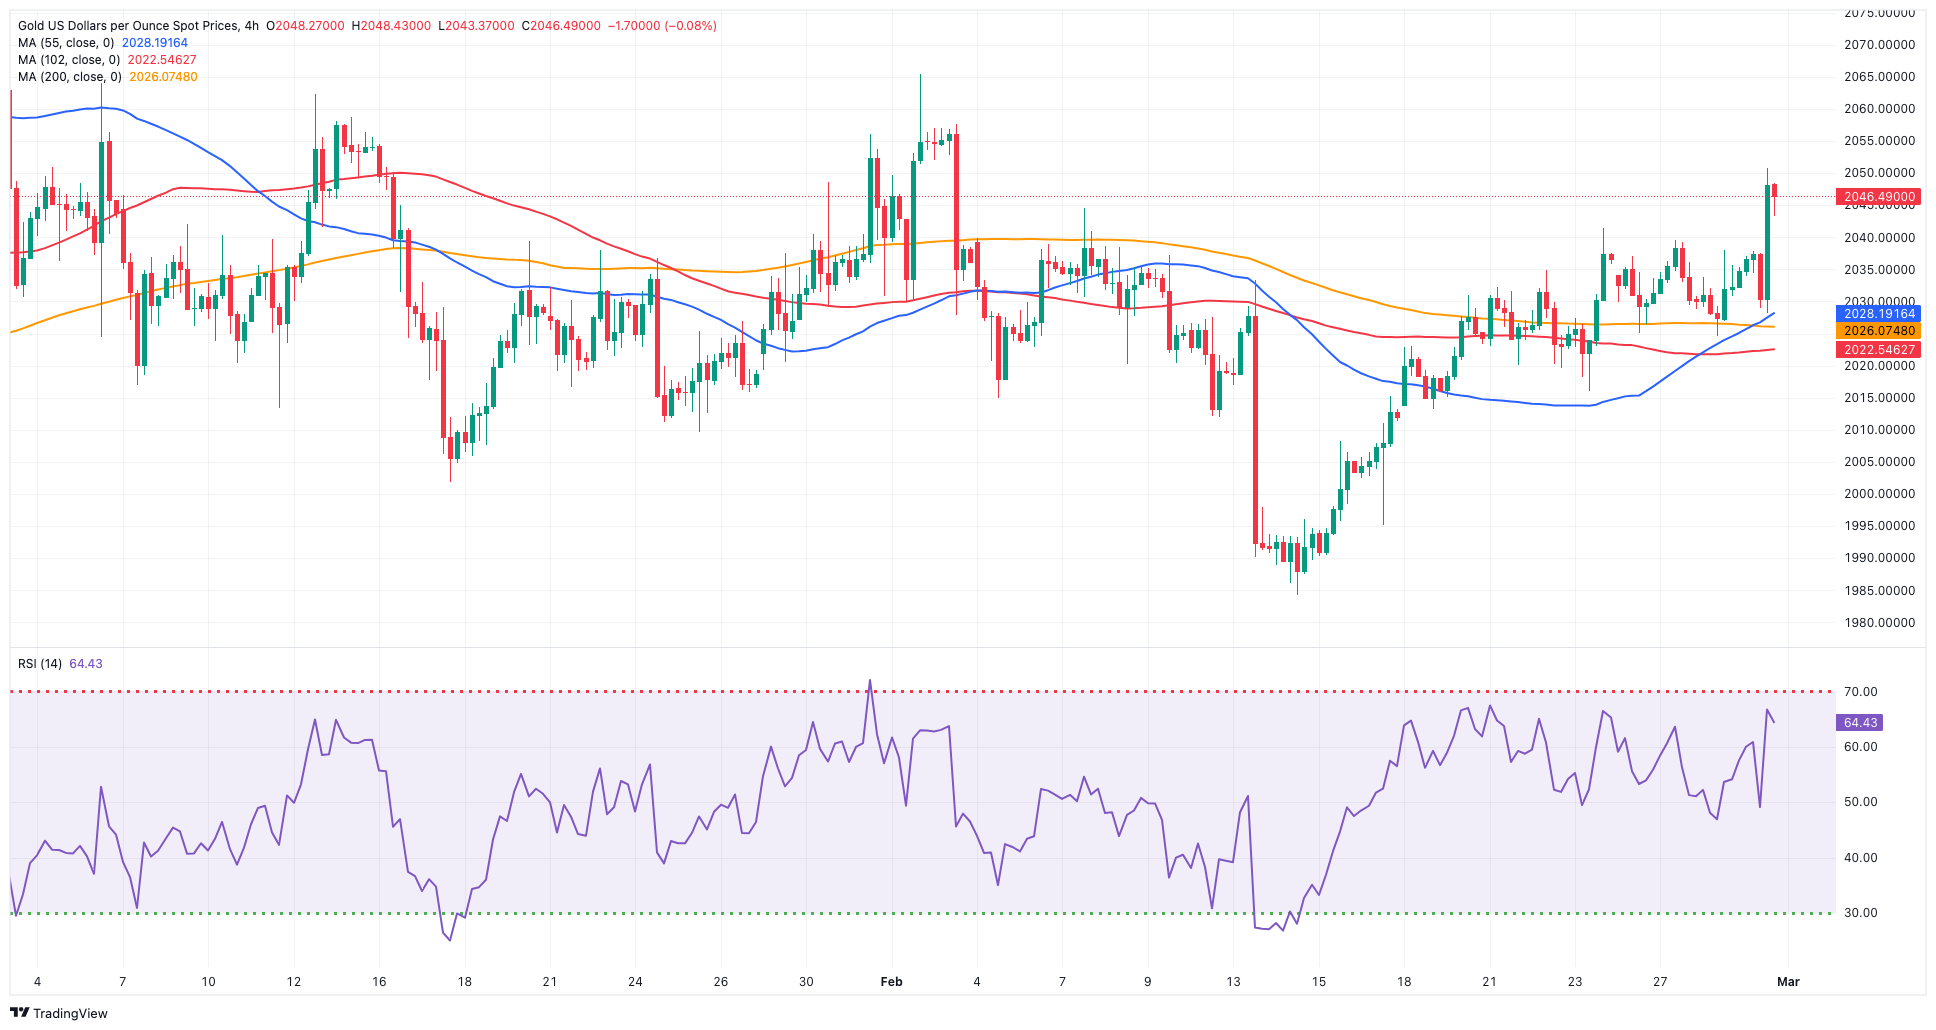
Gold prices added to Wednesday’s uptick and climbed to fresh four-week tops around the $2,050 region per troy ounce on Thursday.
Despite extra gains in the dollar and lower US inflation tracked by the PCE in January, the yellow metal appears to have derived strength from another negative session in US yields across the curve.
Moving forward, the precious metal should now refocus its attention on upcoming Fedspeak, as there seems to be a growing consensus of an interest rate reduction by the Federal Reserve at the June 12 event.
The surpassing of the weekly peak of $2,050 (February 29) might catapult Gold to its February high of $2,065 (February 1), prior to the weekly top of $2,088 (December 28) and the all-time peak of $2,150 (December 4, 2023). Instead, there is temporary support at the 100-day SMA at $2,009, followed by the 2024 low of $1,984 (February 14) and the December 2023 low of $1,973, which is supported by its proximity to the critical 200-day SMA of $1,967 and emerges ahead of the November 2023 low of $1,931. A further decline might lead to the yellow metal retesting the October 2023 low of $1,810, ahead of the 2023 low of $1,804 and the important $1,800 conflict zone.
Resistance levels: $2,050 $2,065 $2,078 (4H chart)
Support levels: $2,024 $2,016 $1,984 (4H chart)
CRUDE WTI
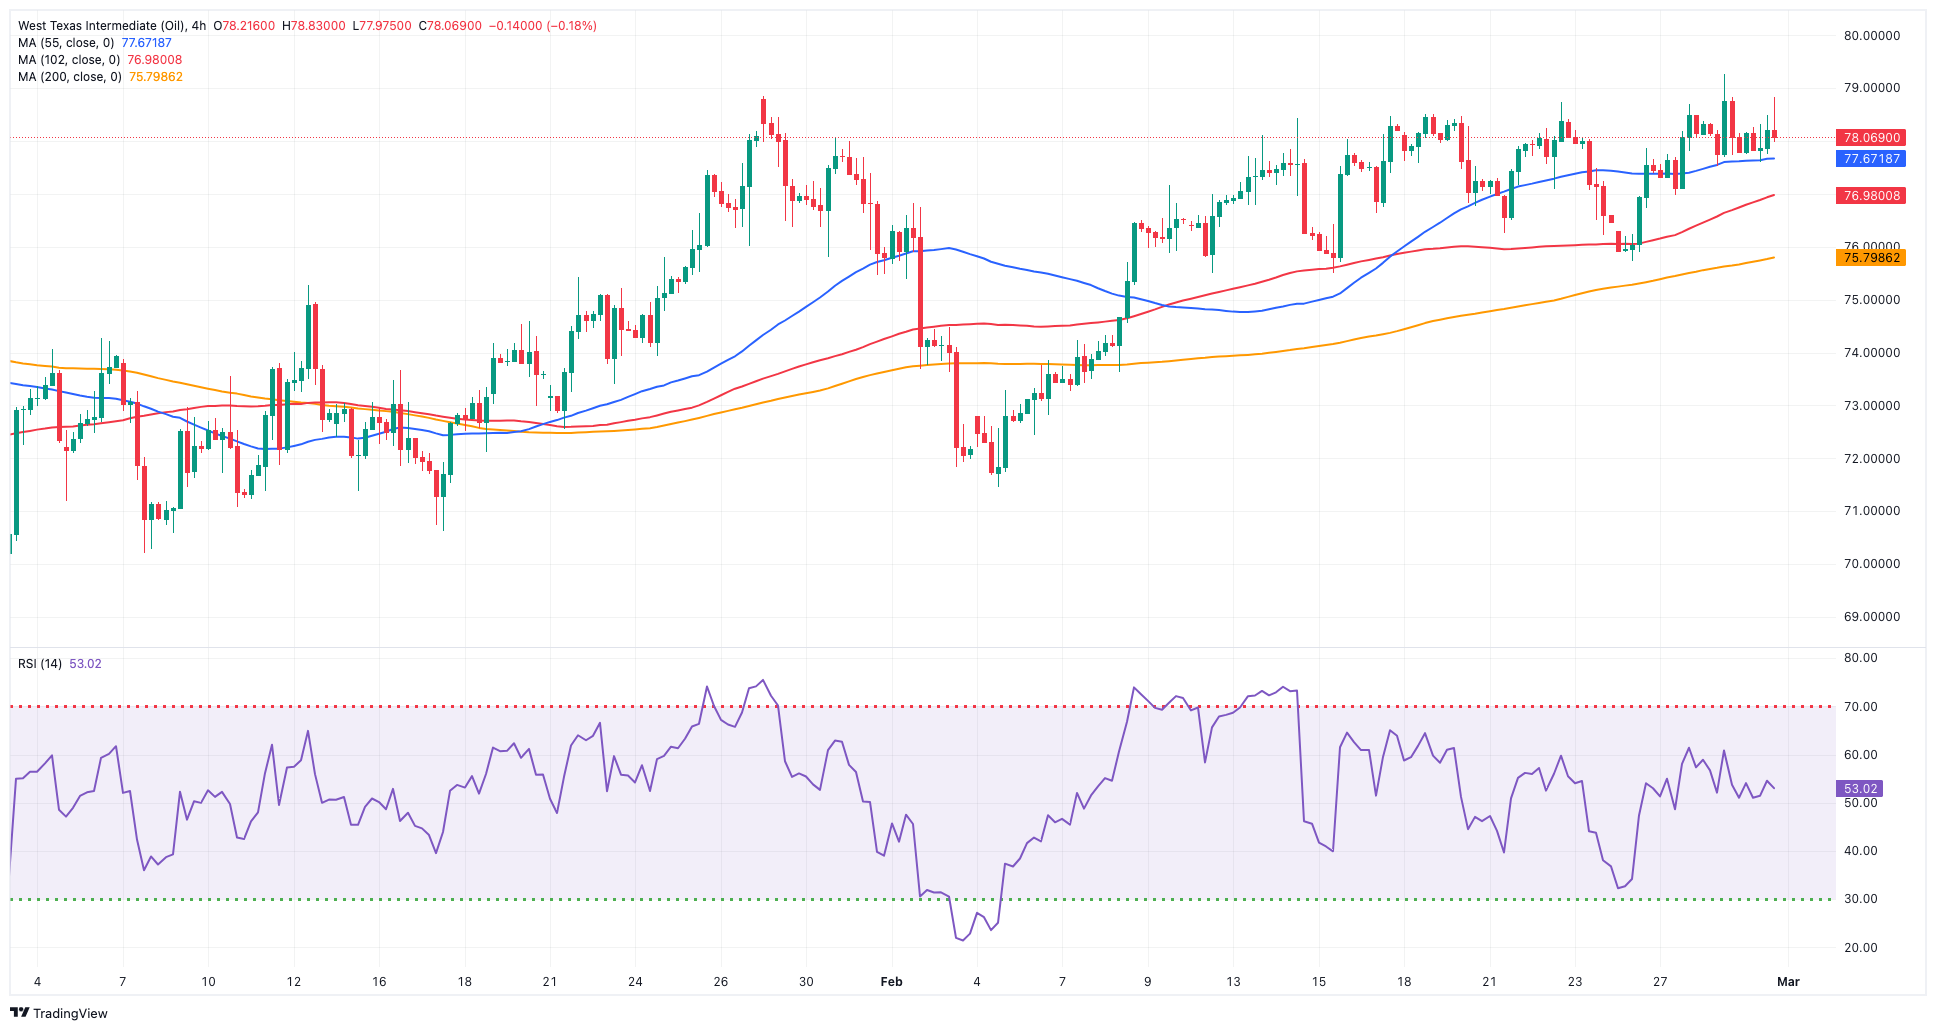
On Thursday, WTI prices experienced a decent increase due to the impact of lower US inflation data and comments by President Joe Biden.
In fact, the release of US inflation tracked by the PCE reinforced expectations for a potential interest rate cut in June, which strengthened the demand outlook and underpinned the upside bias in the commodity.
In addition, crude oil prices saw their upside exacerbated after President Biden seemed to have poured cold water over hopes of a ceasefire in the Israel-Hamas conflict.
Also contributing to the so-far weekly gains in WTI emerged the increasing probability that the OPEC+ could extend its supply cuts, while the persevering Red Sea crisis also added to the bullish sentiment.
The next upward test for WTI is the 2024 high of $79.58 (February 28), which comes just ahead of the key $80.00 barrier and the November 2023 top of $80.15 (November 3). Once it clears the latter, the commodity may rise to its weekly peak of $89.83 (October 18, 2023), ahead of the 2023 high of $94.99 (September 28, 2023), the August 2022 top of $97.65 (August 30), and the psychological $100.00 barrier. The other way around, the 55-day SMA should provide intermediate support around $74.61 prior to the February low of $71.43 (February 5). Further south aligns the critical $70.00 threshold before the 2024 bottom of $69.31 (January 3).
Resistance levels: $79.58 $83.56 $85.85 (4H chart)
Support levels: $75.81 $75.49 $71.37 (4H chart)
GER40
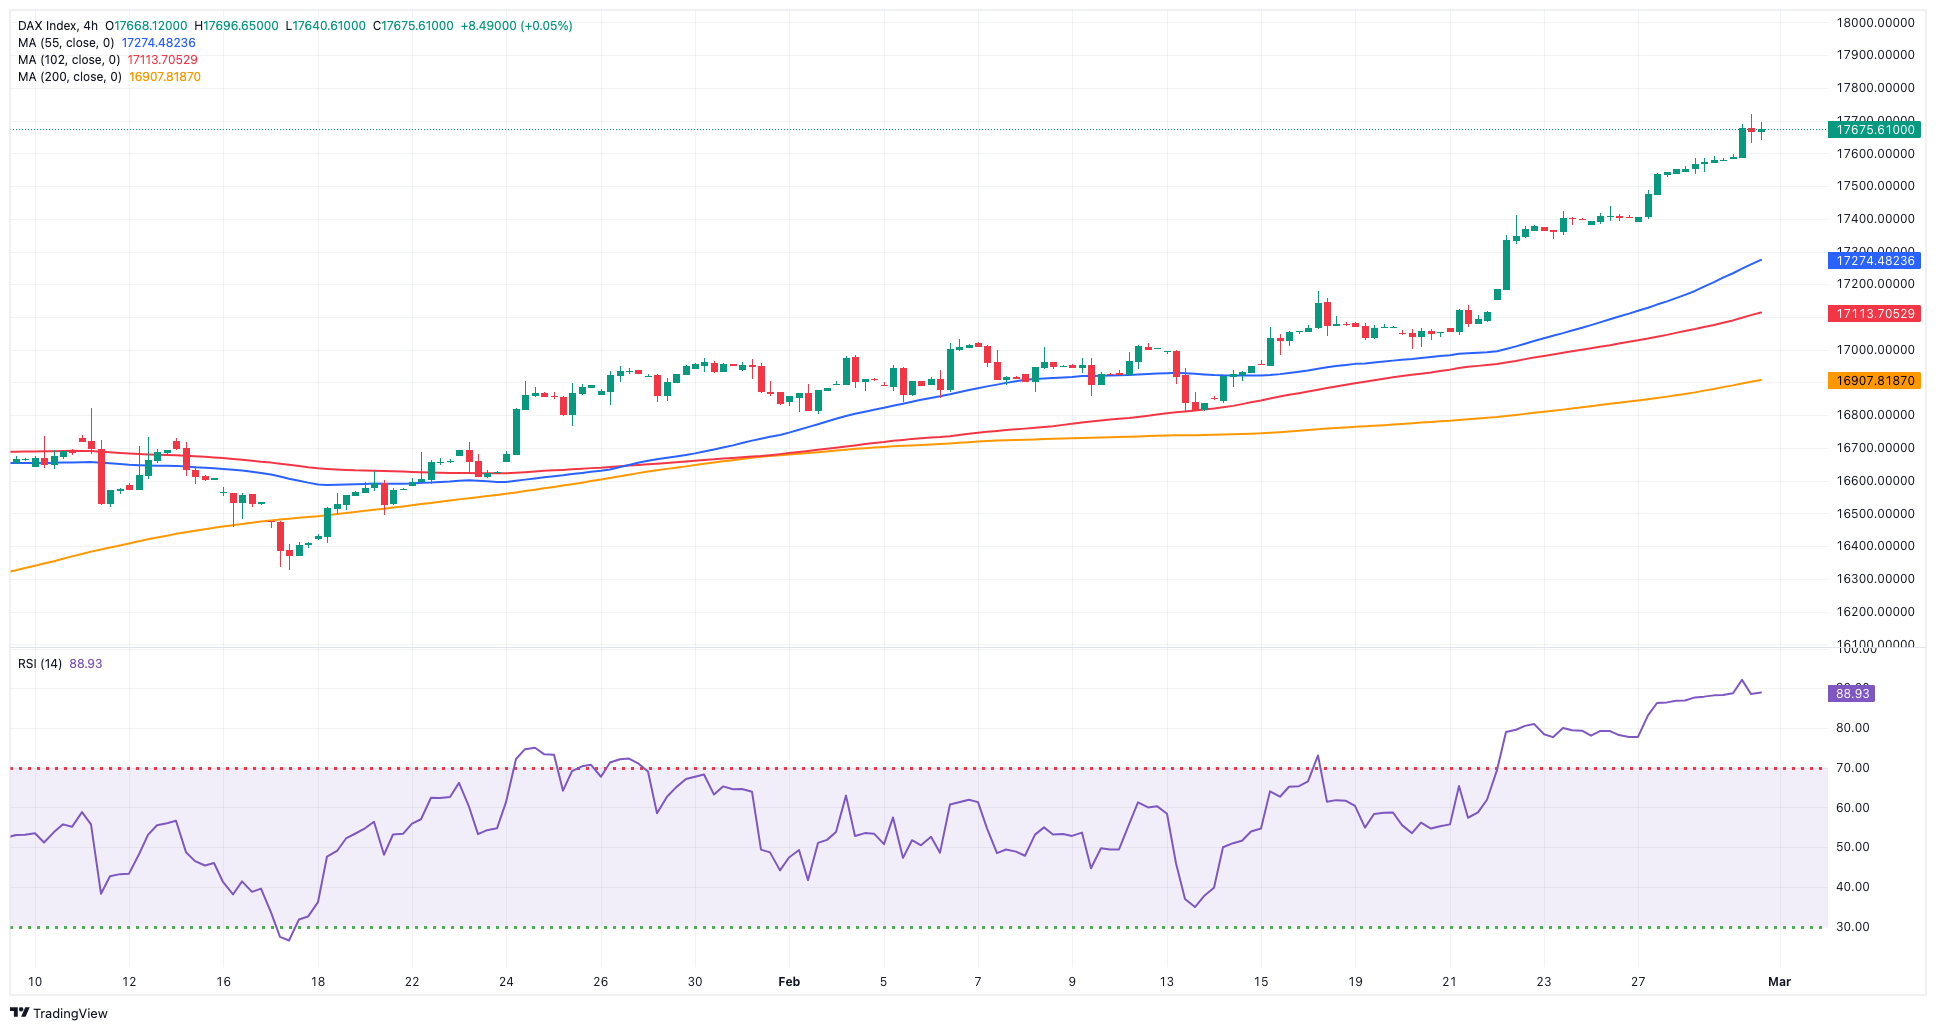
European stock markets traded in a mixed bias on Thursday, although the German reference DAX40 clinched another record high near the 17,800 level.
In fact, the DAX40 advanced further after advanced lower-than-expected inflation figures in the country for the month of February reinforced the idea that the ECB might start trimming its policy rate sooner rather than later, all ahead of Friday’s release of preliminary CPI prints in the broader Euroland.
Also collaborating with the upside momentum in German equities emerged another sign that US inflation extended its decline in January, this time following PCE figures.
Contrasting with the positive performance of the index, 10-year bund yields added to Wednesday’s drop and revisited 2.40%, the lowest level since Tuesday.
The DAX40's next upward hurdle is its all-time high at 17,742 (February 29). In the opposite direction, the 55-day SMA at 16,876 should offer interim contention just ahead of the February low of 16,821 (February 1). The failure of this zone may bring back into focus the 2024 bottom at 16,345 (January 17), which is close to the key 200-day SMA at 16,068 and the weekly bottom at 15,915 (November 28). The October 2023 low is 14,630 (October 23), followed by the March 2023 low of 14,458 (March 20). The daily RSI increased past 78, indicating that the market is still well overbought.
Best Performers: Allianz, Siemens Energy AG, Covestro
Worst Performers: Beiersdorf, Bayer, Commerzbank
Resistance levels: 17,742 (4H chart)
Support levels: 17,039 16,831 16,732 (4H chart)
GBPJPY
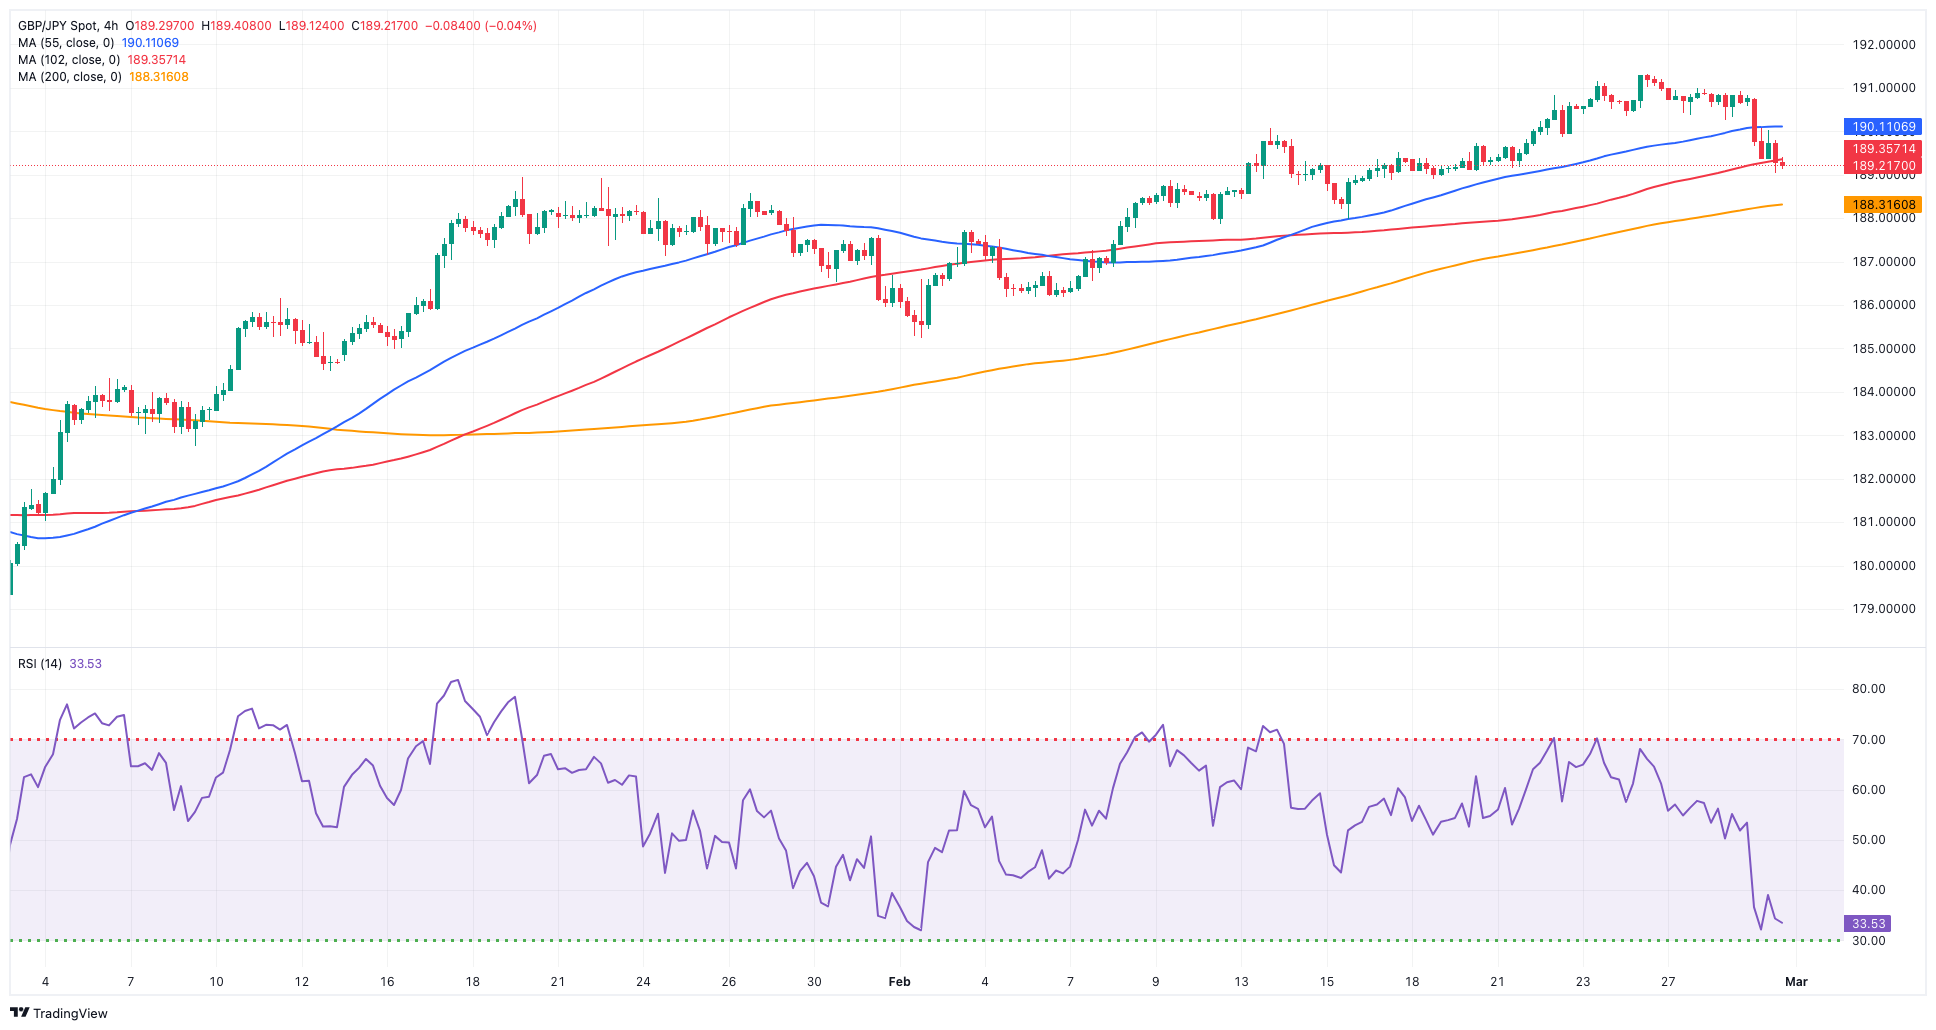
GBP/JPY traded on the back foot for the third session in a row and flirted with the area of two-week lows near the 189.00 neighbourhood on Thursday.
The strong appreciation of the Japanese currency was behind the move lower in the cross, although the persistent march north in the greenback also weighed on the quid, eventually morphing into extra legs for the daily retracement.
The continuation of the downward bias could see GBP/JPY revisit the temporary 55-day and 100-day SMAs at 185.97 and 185.34, respectively, ahead of the February low of 185.22 (February 1). If the cross breaks below the latter, a potential test of the more important 200-day SMA at 183.36 could start emerging on the horizon prior to the December 2023 low of 178.33 (December 14), the October 2023 low of 178.03 (October 3) and the July 2023 low of 176.30. The other way around, there is immediate resistance at the 2024 top of 191.32 (February 26), which comes ahead of the August 2015 peak of 195.28 (August 18) and the record high of 195.88 (June 24, 2015). On the daily chart, the RSI fell to about 53.
Resistance levels: 191.32 195.28 195.88 (4H chart)
Support levels: 189.04 187.99 185.22 (4H chart)
NASDAQ
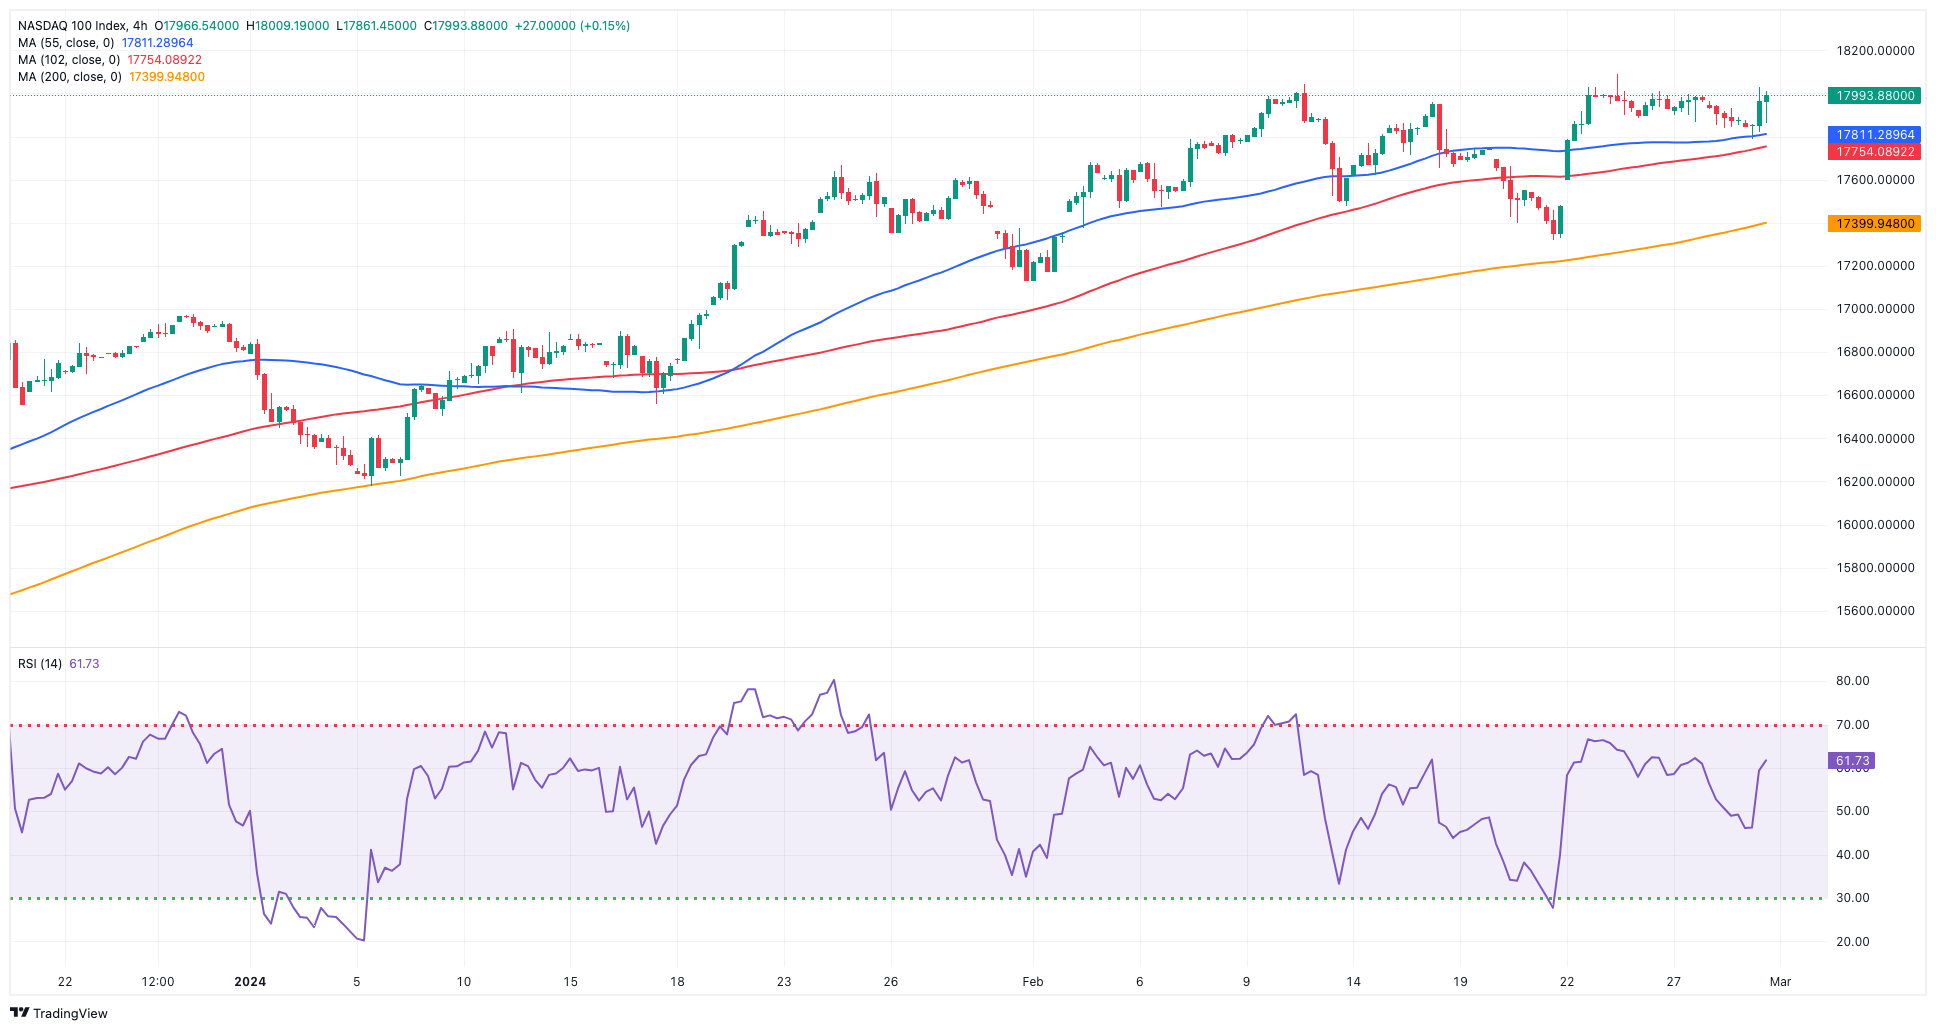
The US tech benchmark Nasdaq 100 resumed the upside and reclaimed the area above the 18,000 mark on Thursday.
The resumption of the upside bias in the index came despite the strong note in the greenback, although further retracement in US yields across the curve seems to have encouraged bulls to return to the market.
In the meantime, further disinflationary pressure in the US (as per the PCE results) maintained the prospects of the start of the Fed’s easing cycle at some point in the summer.
Further gains in the Nasdaq 100 may revisit the all-time high of 18,091 (February 23). On the other hand, the index may retest the weekly lows of 17,319 (February 21) and 17,128 (January 31), which are slightly ahead of the transitory 55-day SMA at 17,150. A breach of the latter might put a potential test of the 2024 low of 16,249 (January 5) back on the radar, ahead of the December 2023 low of 15,695 (December 4) and the critical 200-day SMA of 15,623. Extra losses from here might dispute the October 2023 low of 14,058 (October 26), seconded by the April 2023 low of 12,724 (April 25), the March 2023 low of 11,695 (March 13), and the 2023 low of 10,696 (January 3). The daily RSI advanced past the 61 yardstick.
Top Gainers: AMD, Monster Beverage, Marvell
Top Losers: Xcel Energy, GE HealthCare, Moderna
Resistance levels: 18,091 (4H chart)
Support levels: 17,319 17,128 16,561 (4H chart)
DOW JONES
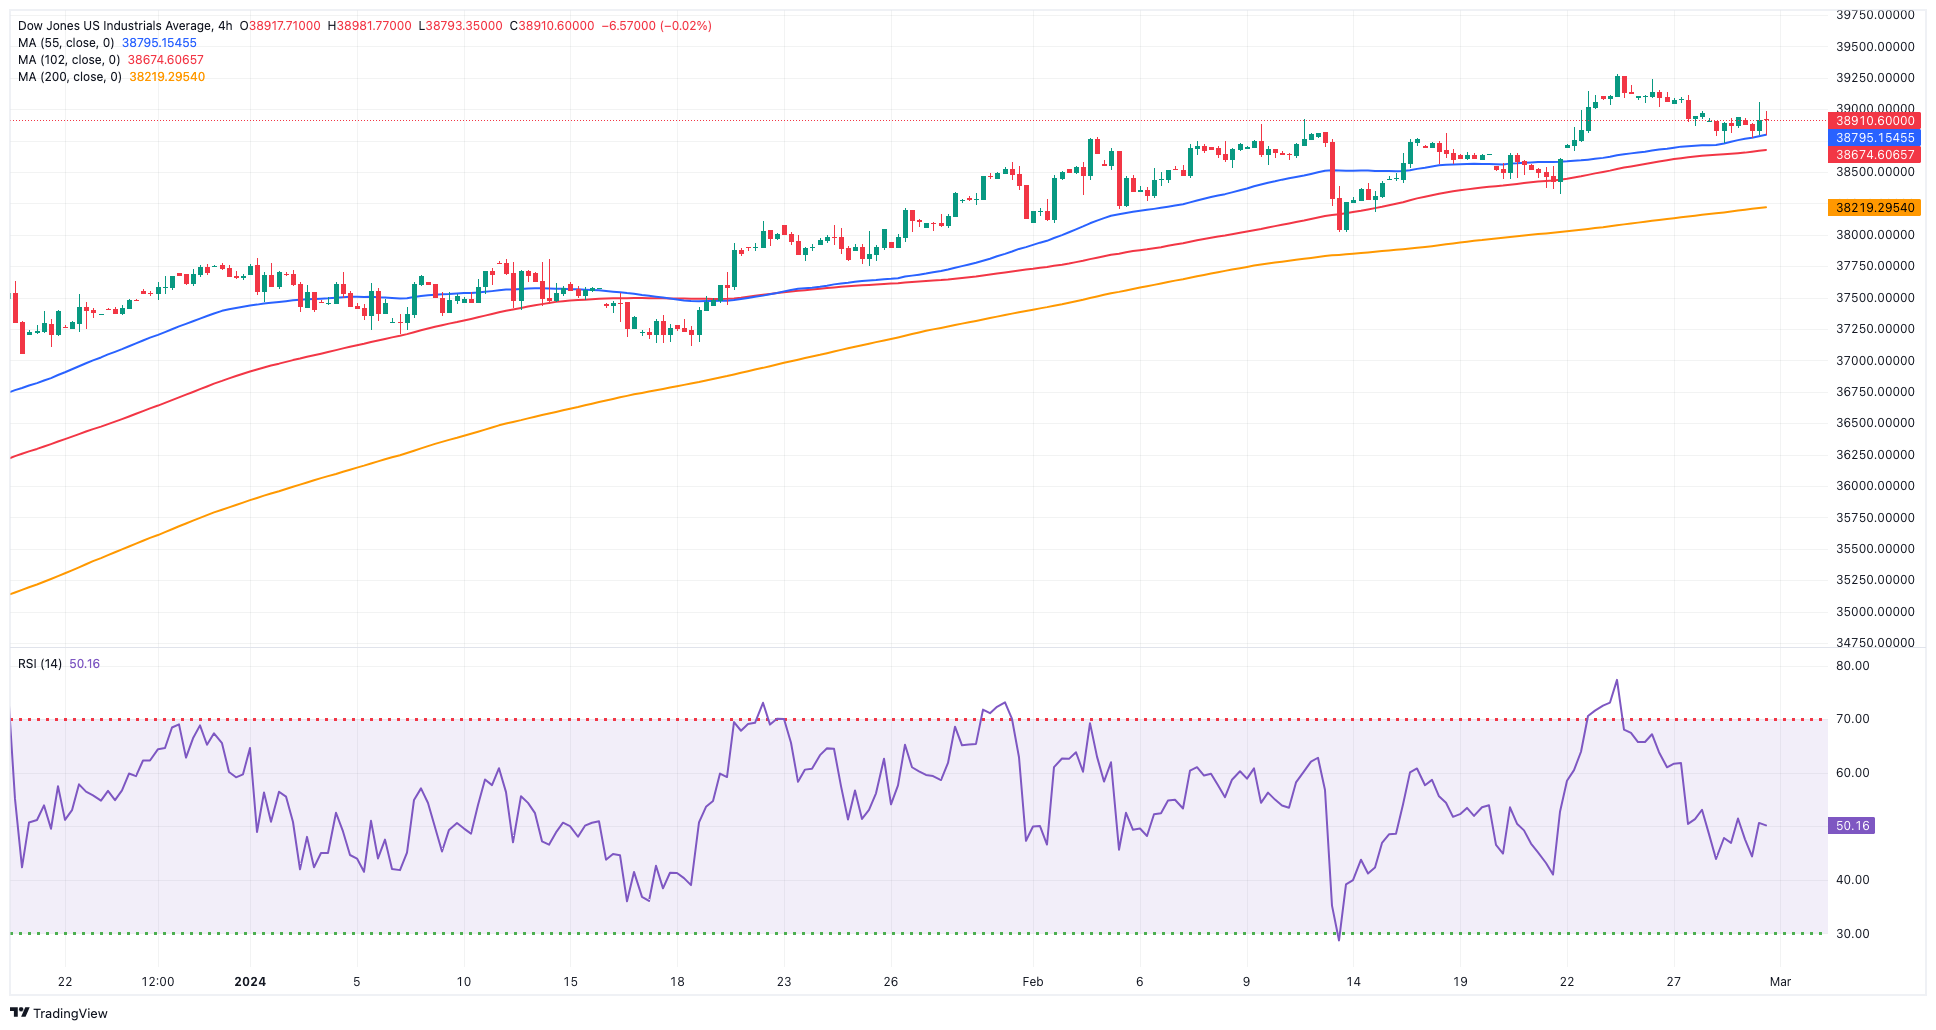
US equities measured by the Dow Jones eased marginally in choppy trade on Thursday.
In fact, the index added to the ongoing corrective decline as investors continued to digest the latest US PCE readings, while further comments from Fed officials further bolstered the first interest rate cut by the Fed to come in June.
On the latter, R. Bostic (Atlanta) emphasized the importance of a data-driven approach to monetary policy, acknowledging that the journey towards the Federal Reserve's 2% inflation target would be challenging. In addition, A. Goolsbee (Chicago) expressed his belief that there is still potential for an increase in labour supply, which could further contribute to reducing inflationary pressures.
All in all, the Dow Jones deflated 0.06% to 38,926, the S&P 500 gained 0.31% to 5,086, and the tech-heavy Nasdaq Composite advanced 0.58% to 16,040.
In case buyers regain the upper hand, the Dow Jones could challenge its record high of 39,282 (February 23). However, the 55-day SMA at 37,939 provides temporary support, followed by the 2024 low of 37,122 (January 18) and the weekly low of 37,073 (December 20, 2023). A decline below this level may prompt the index to meet the transitory 100-day SMA at 36,296, before the 200-day SMA at 35,282. The weekly low of 33,859 (November 7, 2023) is next, ahead of the October 2023 low of 32,327 (October 27) and the 2023 low of 31,429 (March 15). The daily RSI receded to the sub-61 zone.
Top Performers: Intel, Honeywell, Dow
Worst Performers: Boeing, Goldman Sachs, Walmart
Resistance levels: 39,282 (4H chart)
Support levels: 38,338 38,039 37,122 (4H chart)
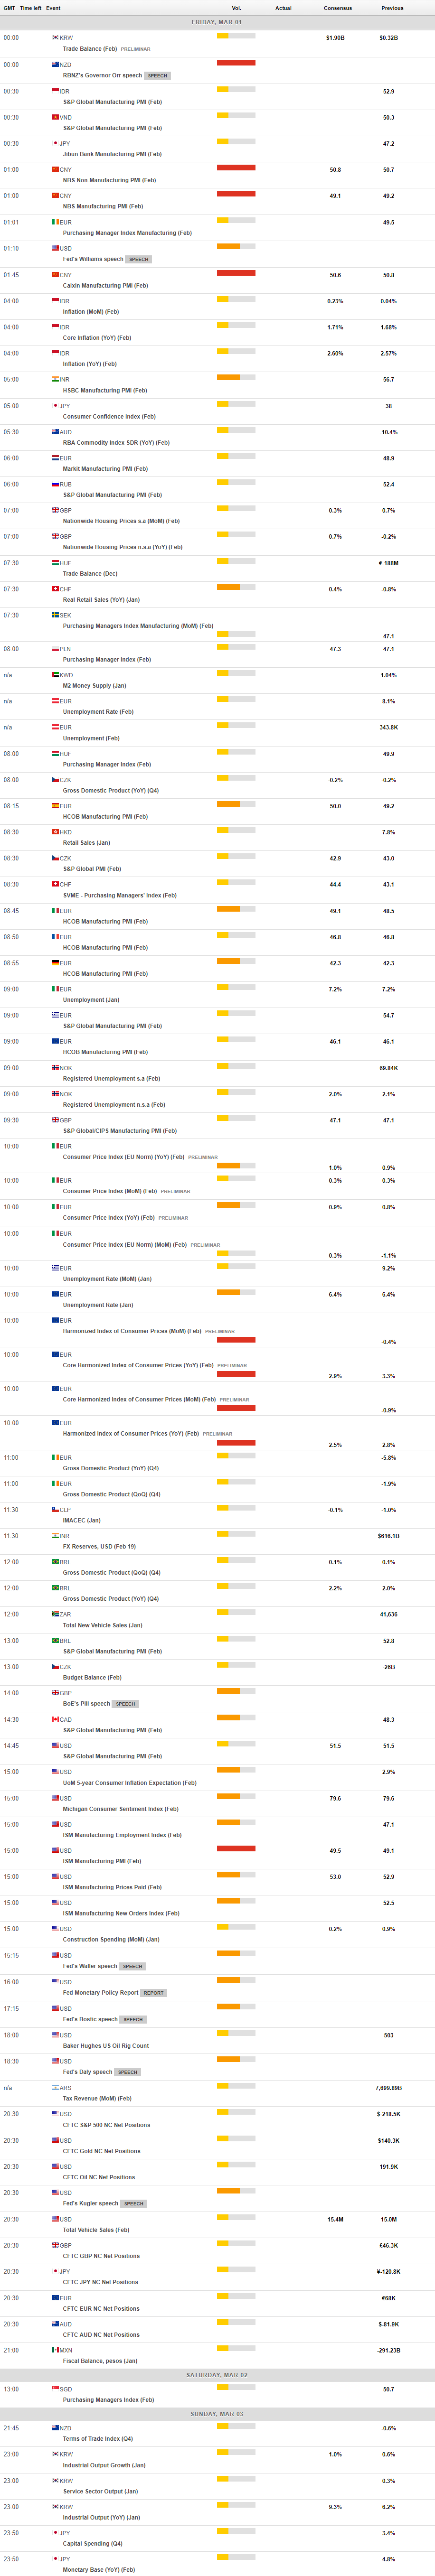
MACROECONOMIC EVENTS
All Information & Updates provided by:

All information relating to the financial markets available on this page has been prepared and issued by FXStreet (Forexstreet SL, Spain, Reg: B62498233) on the basis of publicly available information and all information believed to be reliable and does not conflict with Kuwaiti local laws, and all necessary care has been taken to before the company to ensure that the facts mentioned are correct from the source.
NCM Investment nor any of its directors or employees shall in any way be held responsible for the contents of this news, and the information contained on this page is intended only to provide clients with publicly available information and should not be construed as investment advice, report or analysis and/or constitute an offer or invitation to buy or sell financial instruments of any kind.
RISK WARNING: Forex and CFDs are highly risky leveraged products, as losses can exceed deposits. Please ensure you understand all the risks and take independent advice if necessary. NCM will segregate the clients based on the criteria of the regulator and its bylaws. NCM does not provide any advisory service; the material published does not constitute advice or a recommendation for a transaction in any financial instrument. NCM accepts no responsibility for any use of the content presented and any consequences of that use. Anyone acting on the information provided does so at their own risk.