
- Contact Us:
-

-

-

-


Daily Market Updates
04 Mar 2024
EURUSD
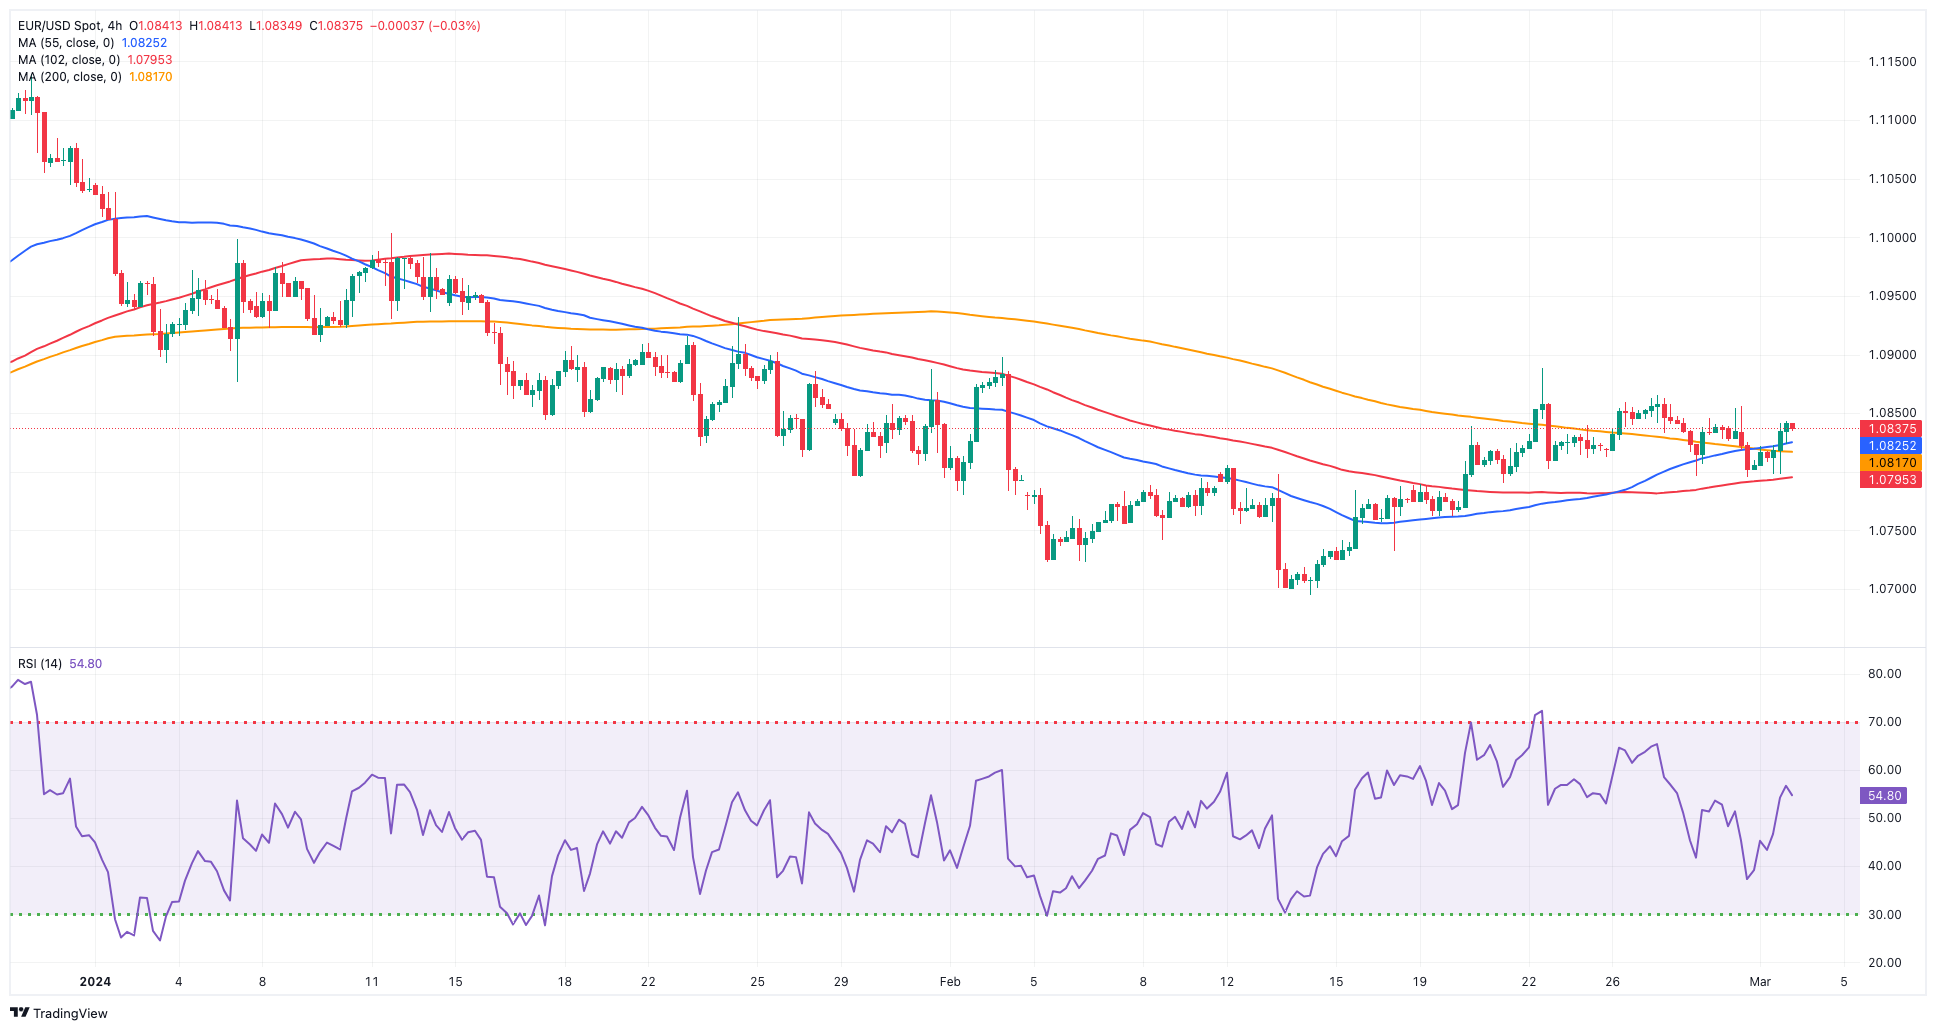
The greenback ended the week on the defensive, allowing EUR/USD to regain composure and end the session around 1.0840, reversing three negative sessions in a row and clinching at the same time its second consecutive week of gains.
In fact, the USD Index (DXY) corrected lower after three straight daily advances in response to disappointing results from ISM Manufacturing and Consumer Sentiment, all amidst the drop to two-week lows in US yields across the curve.
In the meantime, bets for interest rate cuts from both the Fed and the ECB continued to dictate the sentiment in the global markets, with both central banks now seen reducing their rates at some point in the summer.
On the domestic docket, final Manufacturing PMIs in Germany and the broader euro bloc came in at 42.5 and 46.5, respectively, for the month of February, showing the sector remains entrenched in contraction territory. Still in the euro area, flash inflation data saw the CPI rising more than expected by 2.6% YoY in February and 3.1% when it came to the Core CPI. In addition, the jobless rate in the region eased to 6.4%.
In the US, the final Manufacturing PMI rose to 52.5 in February, while the ISM Manufacturing PMI receded to 47.8 and the Michigan Consumer Sentiment dropped to 76.9 in the same month. Finally, Construction Spending contracted by 0.2% MoM in January.
The loss of the weekly low of 1.0795 (February 29) may push EUR/USD to test the 2024 low of 1.0694 (February 14), followed by the weekly low of 1.0495 (October 13, 2023), the 2023 low of 1.0448 (October 3), and the round level of 1.0400. On the contrary, first resistance appears around the weekly high of 1.0888 (February 22), which is supported by the interim 55-day SMA (1.0880). North of here are weekly tops of 1.0932 (January 24) and 1.0998 (January 5, 11), reinforcing the psychological 1.1000 threshold. The breakout of this zone could pave the way for a probable test of the December 2023 peak of 1.1139 (December 27), which is supported by the 200-week SMA of 1.1147 and occurs before the 2023 high of 1.1275. (July 18). The daily RSI rose to the vicinity of 53.
Resistance levels: 1.0865 1.0888 1.0897 (4H chart)
Support levels: 1.0795 1.0761 1.0732 (4H chart)
USDJPY
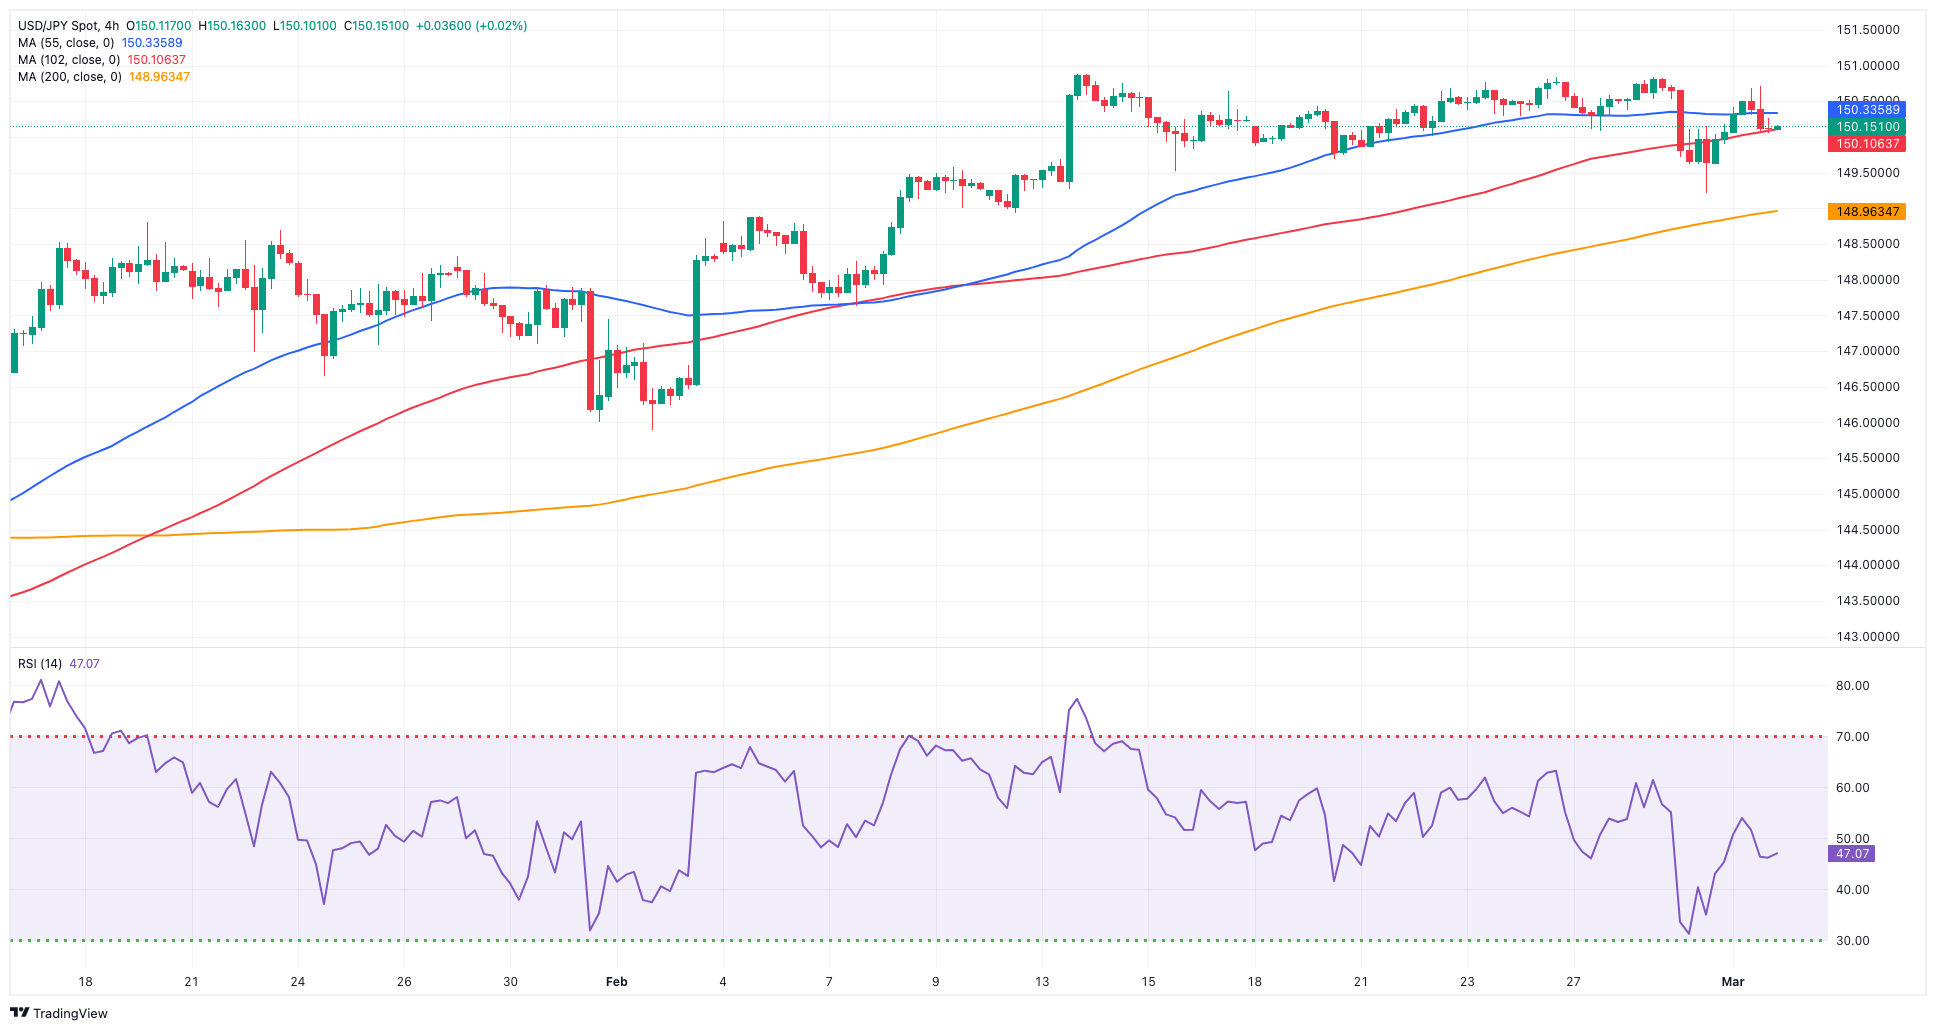
USD/JPY traded in a volatile fashion and closed with humble gains just above the key 150.00 barrier at the end of the week.
The daily decline in the pair came amidst declining US yields and the sell-off in the greenback, while JGB 10-year yields added to Thursday’s advance beyond 0.70%.
BoJ Governor K. Ueda took centre stage and poured cold water over expectations of a potential lift-off after he suggested that it is currently difficult to predict the attainment of a sustainable and stable inflation target, adding that the achievement of such a target requires careful monitoring and analysis of various economic factors. Ueda emphasized the need to continue assessing whether the virtuous cycle between wages and prices has started to take effect.
In Japan, the jobless rate remained at 2.4% in the first month of the year, while Consumer Confidence improved to 49.1 in February.
If losses accelerate, USD/JPY could revisit the weekly low of 149.20 (February 290 prior to the interim 100-day and 55-day SMAs at 147.73 and 146.82, respectively. Further south emerges the February low of 145.89 (February 1) seconded by the important 200-day SMA at 145.92 and the December 2023 bottom of 140.24 (December 28). The loss of the later exposes the round number of 140.00, ahead of the July low of 137.23 (July 14). In contrast, the 2024 high of 150.88 (February 13) aligns as the immediate upside barrier prior to the 2023 top of 151.90 (November 13). Further north, the 2022 peak of 151.94 (October 21) is closely followed by the round figure of 152.00. The daily RSI looked stable near the 58 mark.
Resistance levels: 150.88 151.43 151.90 (4H chart)
Support levels: 149.20 148.92 147.61 (4H chart)
GBPUSD
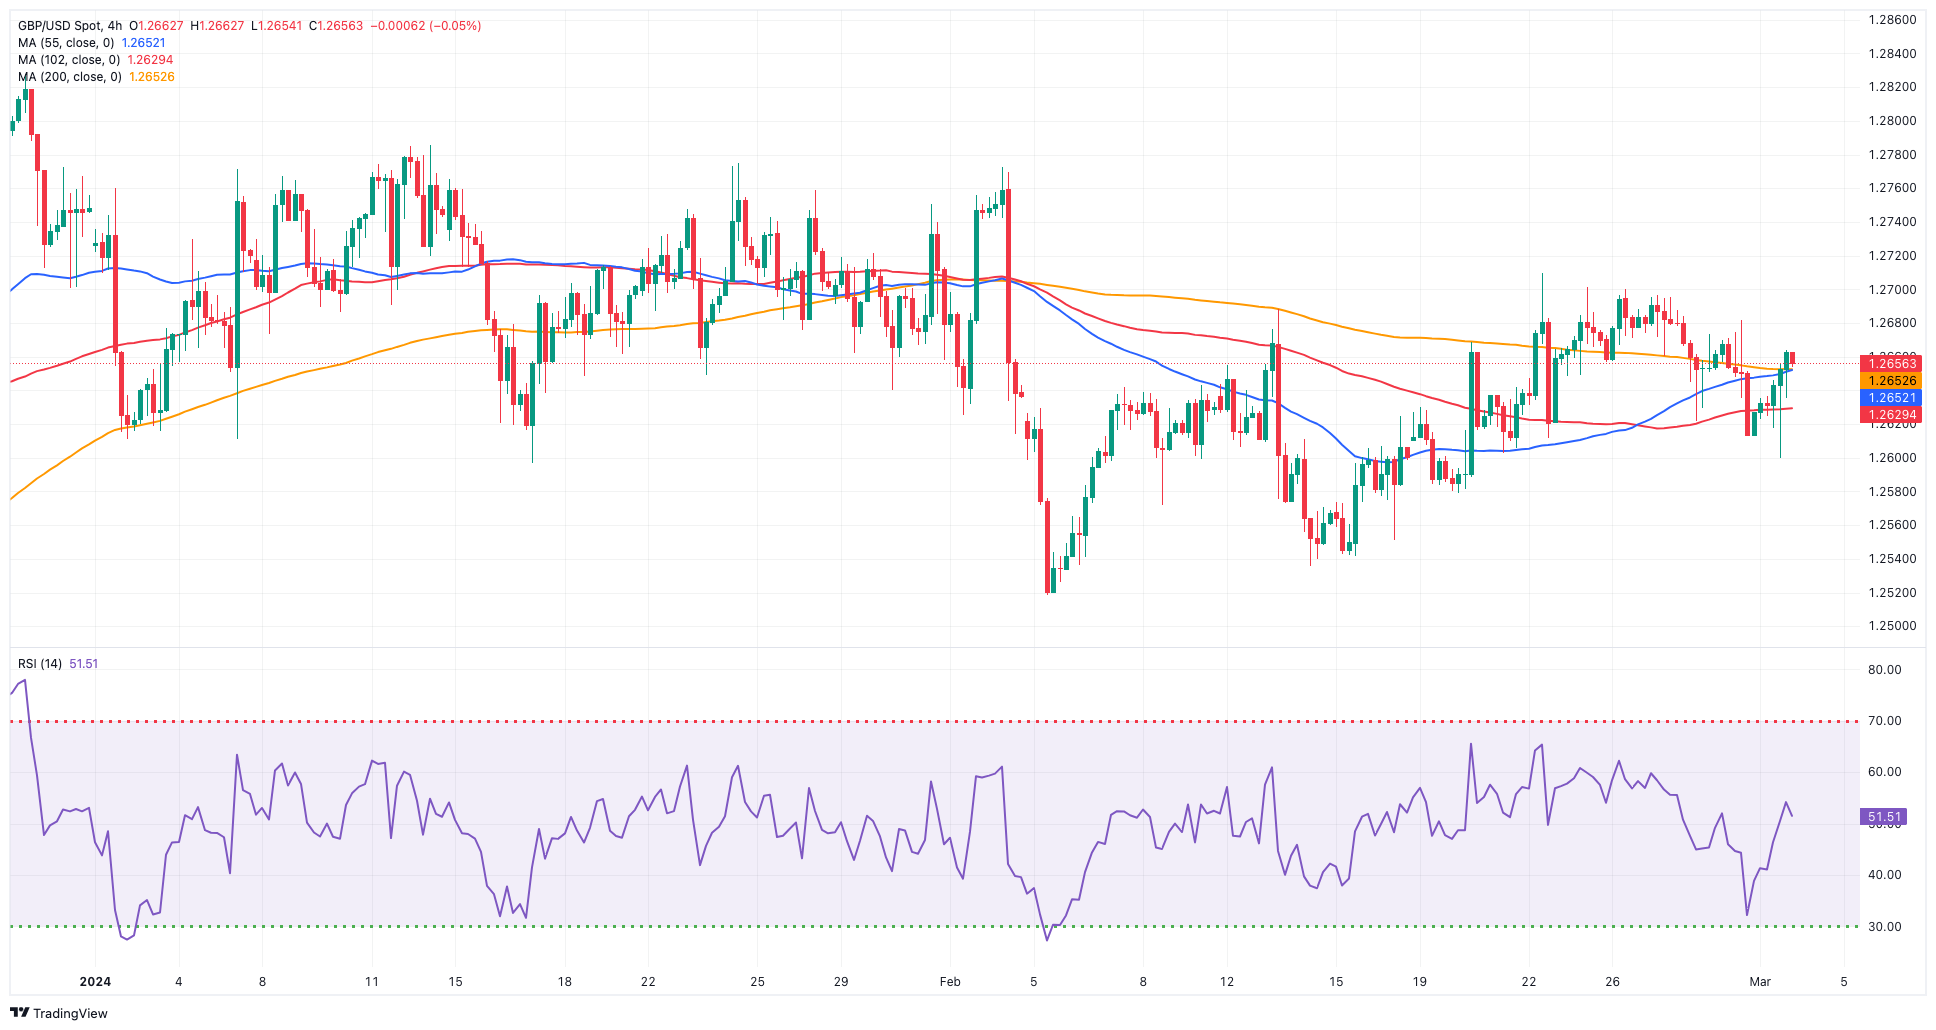
Renewed weakness in the dollar lent legs to the British pound and the rest of the risk-associated assets on Friday, encouraging GBP/USD to print decent gains for the first time after three daily pullbacks in a row.
Despite Friday’s advance, Cable ended the week with modest losses, while the 1.2700 region limited the weekly trading range.
In the UK money market, 10-year gilt yields followed their peers and retreated to multi-day lows near 4.10%.
From the BoE, MPC member H. Pill noted that, in his current outlook, the prospect of reducing the bank rate is still distant. He said he requires stronger evidence indicating that the fundamental, ongoing aspect of UK CPI inflation is being sufficiently reduced to levels aligning with the lasting and sustainable attainment of the 2% inflation target before considering a vote in favour of lowering interest rates.
In the UK, Nationwide Housing Prices rose by 1.2% in the year to February, and the final Manufacturing PMI improved to 47.5 in the same month.
A further decrease may bring GBP/USD to retest the important 200-day SMA at 1.2571, prior to the intermediate 100-day SMA at 1.2541 and the 2024 low of 1.2518 (February 5). The breakdown of this level reveals the December 2023 low of 1.2500 (December 13), ahead of the weekly low of 1.2187 (November 10, 2023), the October 2023 low of 1.2037, the key 1.2000 level, and the 2023 low of 1.1802 (March 8). On the upside, the weekly top of 1.2709 (February 22) presents an immediate challenge, followed by the February peak of 1.2772 (February 2) and the 2024 high of 1.2785 (January 12). Extra gains from here may lead to a battle for the December top of 1.2827 (December 28), which comes before the weekly top of 1.2995 (July 27, 2023) and the key 1.3000 yardstick. The everyday RSI increased past the 51 level.
Resistance levels: 1.2709 1.2772 1.2827 (4H chart)
Support levels: 1.2599 1.2579 1.2518 (4H chart)
GOLD
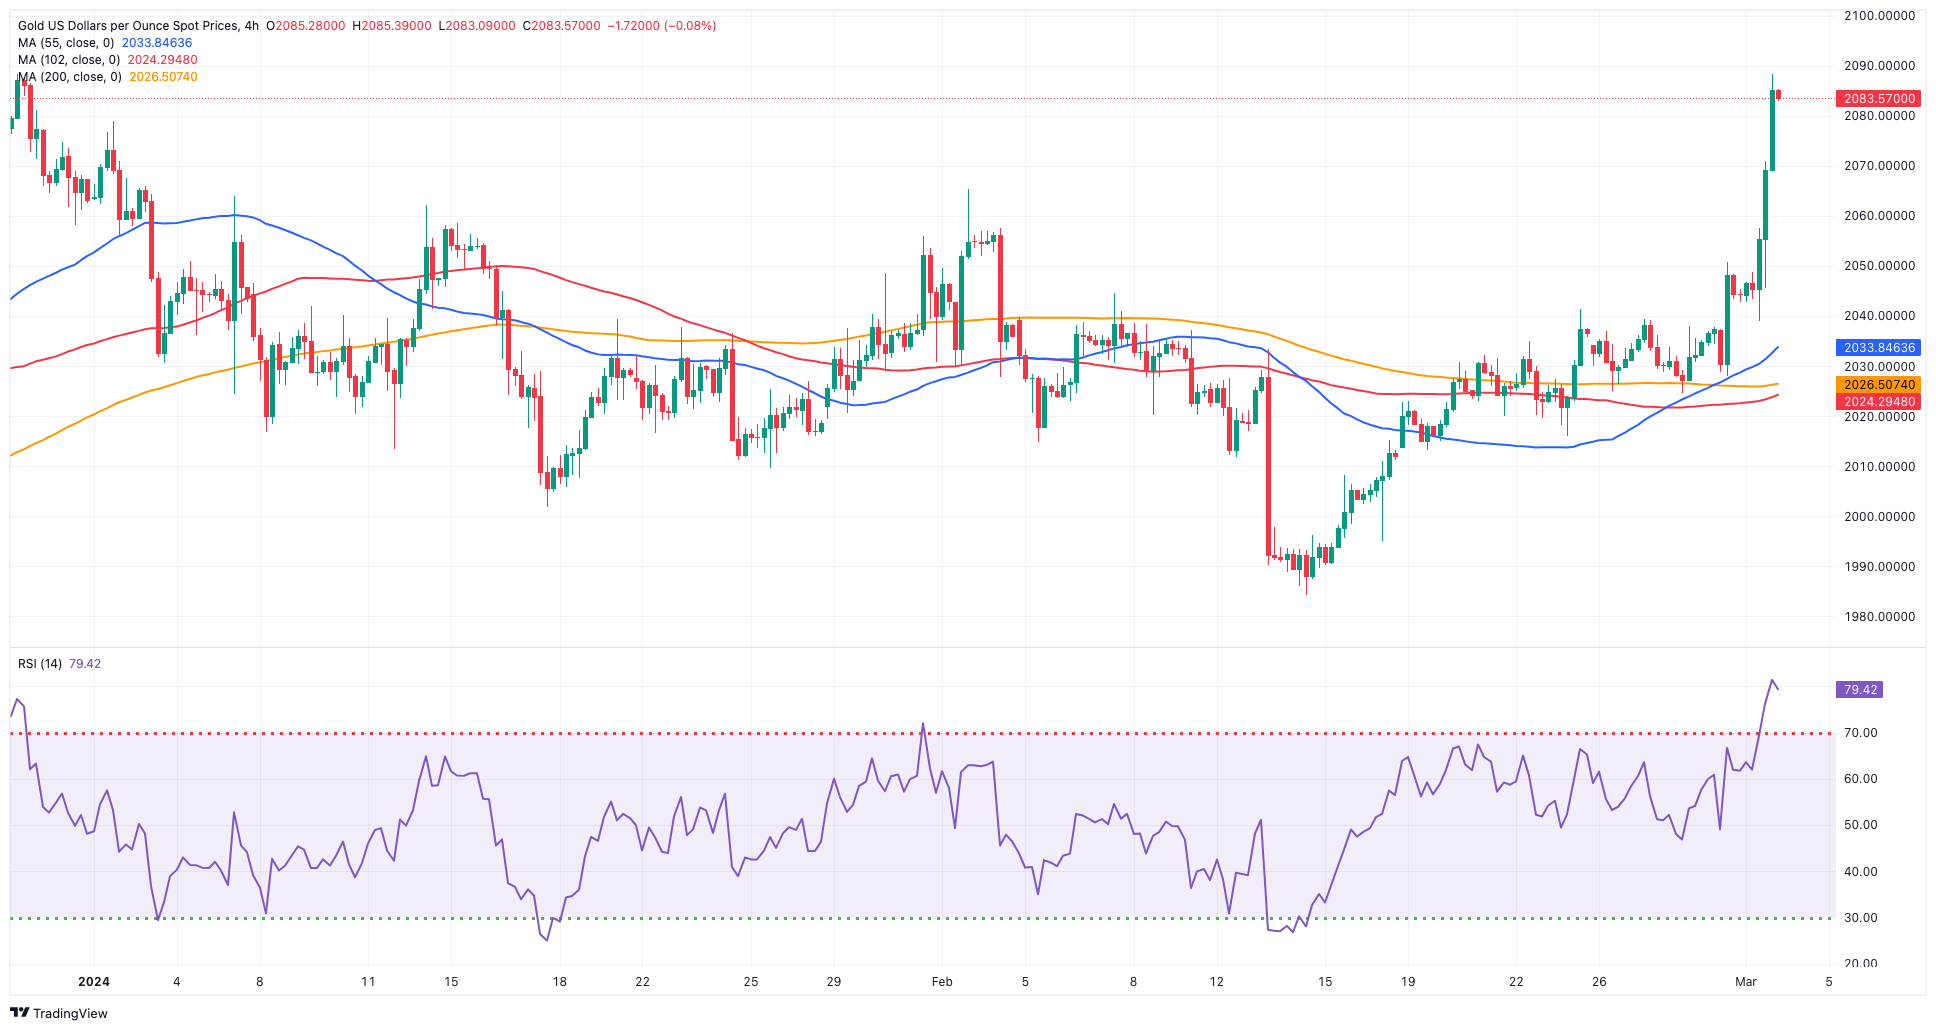
Prices of the yellow metal rallied to levels last seen in late December, nearing the $2,090 mark per troy ounce on Friday.
The sharp uptick in the precious metal was accompanied by an equally strong retracement in US yields across various maturities, while the robust selling pressure in the greenback also contributed to the strong gains.
Meanwhile, bullion kept gyrating around speculations of a potential interest rate cut by the Fed in June, at the time when traders shifted their expectations to the publication of US Non-farm Payrolls next week.
Surpassing the weekly peak of $2,088 (March 1) may propel Gold to its all-time high of $2,150 (December 4, 2023). Having said that, the 100-day SMA at $2,011 provides temporary support, followed by the 2024 low of $1,984 (February 14) and the December 2023 low of $1,973, which is supported by its proximity to the crucial 200-day SMA of $1,967 and emerges ahead of the November 2023 low of $1,931. A further slide may see the yellow metal retest its October 2023 bottom of $1,810, ahead of the 2023 low of $1,804 and the critical $1,800 conflict zone.
Resistance levels: $2,088 $2,150 (4H chart)
Support levels: $2,026 $2,016 $1,984 (4H chart)
CRUDE WTI
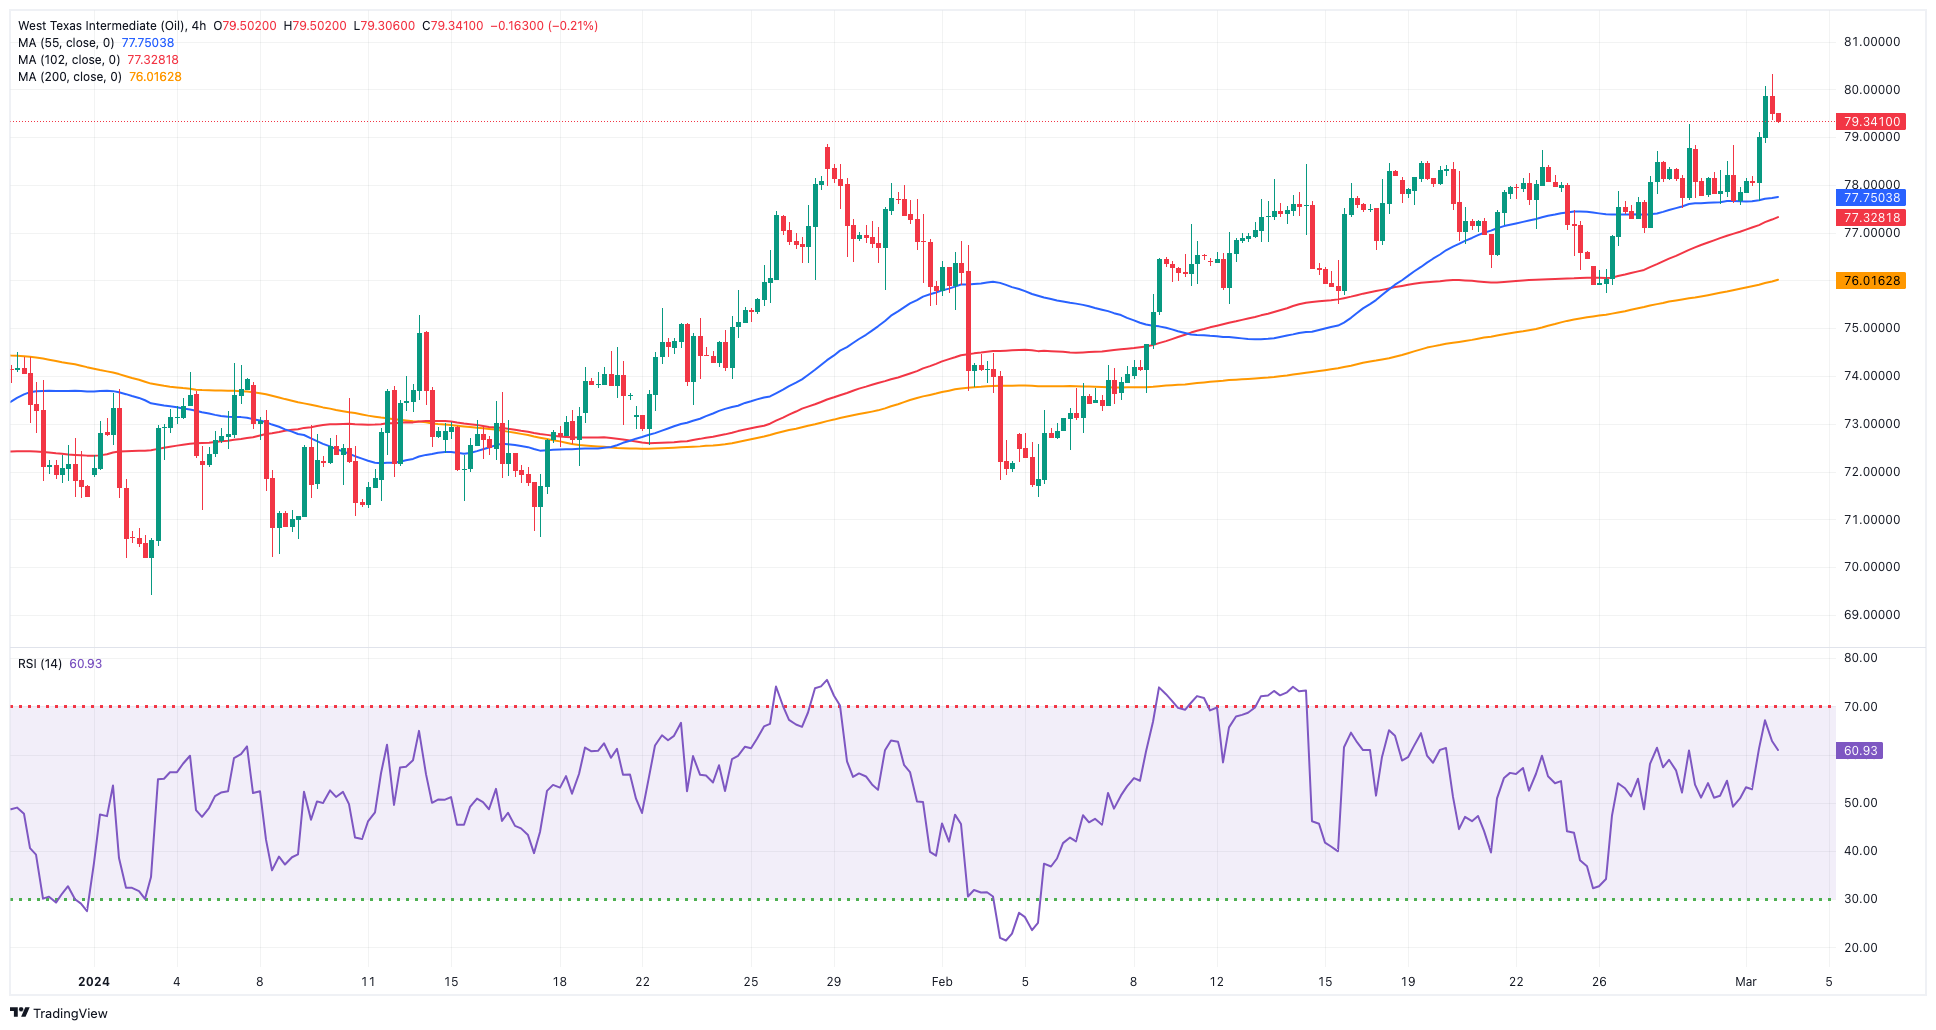
Prices of WTI rose past the key $80.00 mark per barrel for the first time since early November, printing a new yearly peak at the end of the week.
The strong advance in prices of crude oil came on the back of traders’ hopes that the OPEC+ could announce an extension of the supply cuts at its meeting later in the month, while the unabated crisis in the Red Sea also maintained the bullish bias unchanged on Friday.
Closing the weekly docket, US oil rig count increased by 3 in the week to March 1, taking the total active US oil rigs to 506, according to driller Baker Hughes.
The next upward challenge for WTI is the 2024 high of $80.82 (March 1), which comes ahead of the weekly top of $89.83 (October 18, 2023), and the 2023 peak of $94.99 (September 28, 2023). Further up emerges the August 2022 high of $97.65 (August 30) prior to the psychological $100.00 barrier. Alternatively, the 100-day and 55-day SMAs should give interim support at $76.52 and $74.79, respectively, before reaching the February low of $71.43 (February 5). Further south aligns the important $70.00 mark before the 2024 low of $69.31 (January 3).
Resistance levels: $80.82 $83.56 $85.85 (4H chart)
Support levels: $75.81 $75.49 $71.37 (4H chart)
GER40
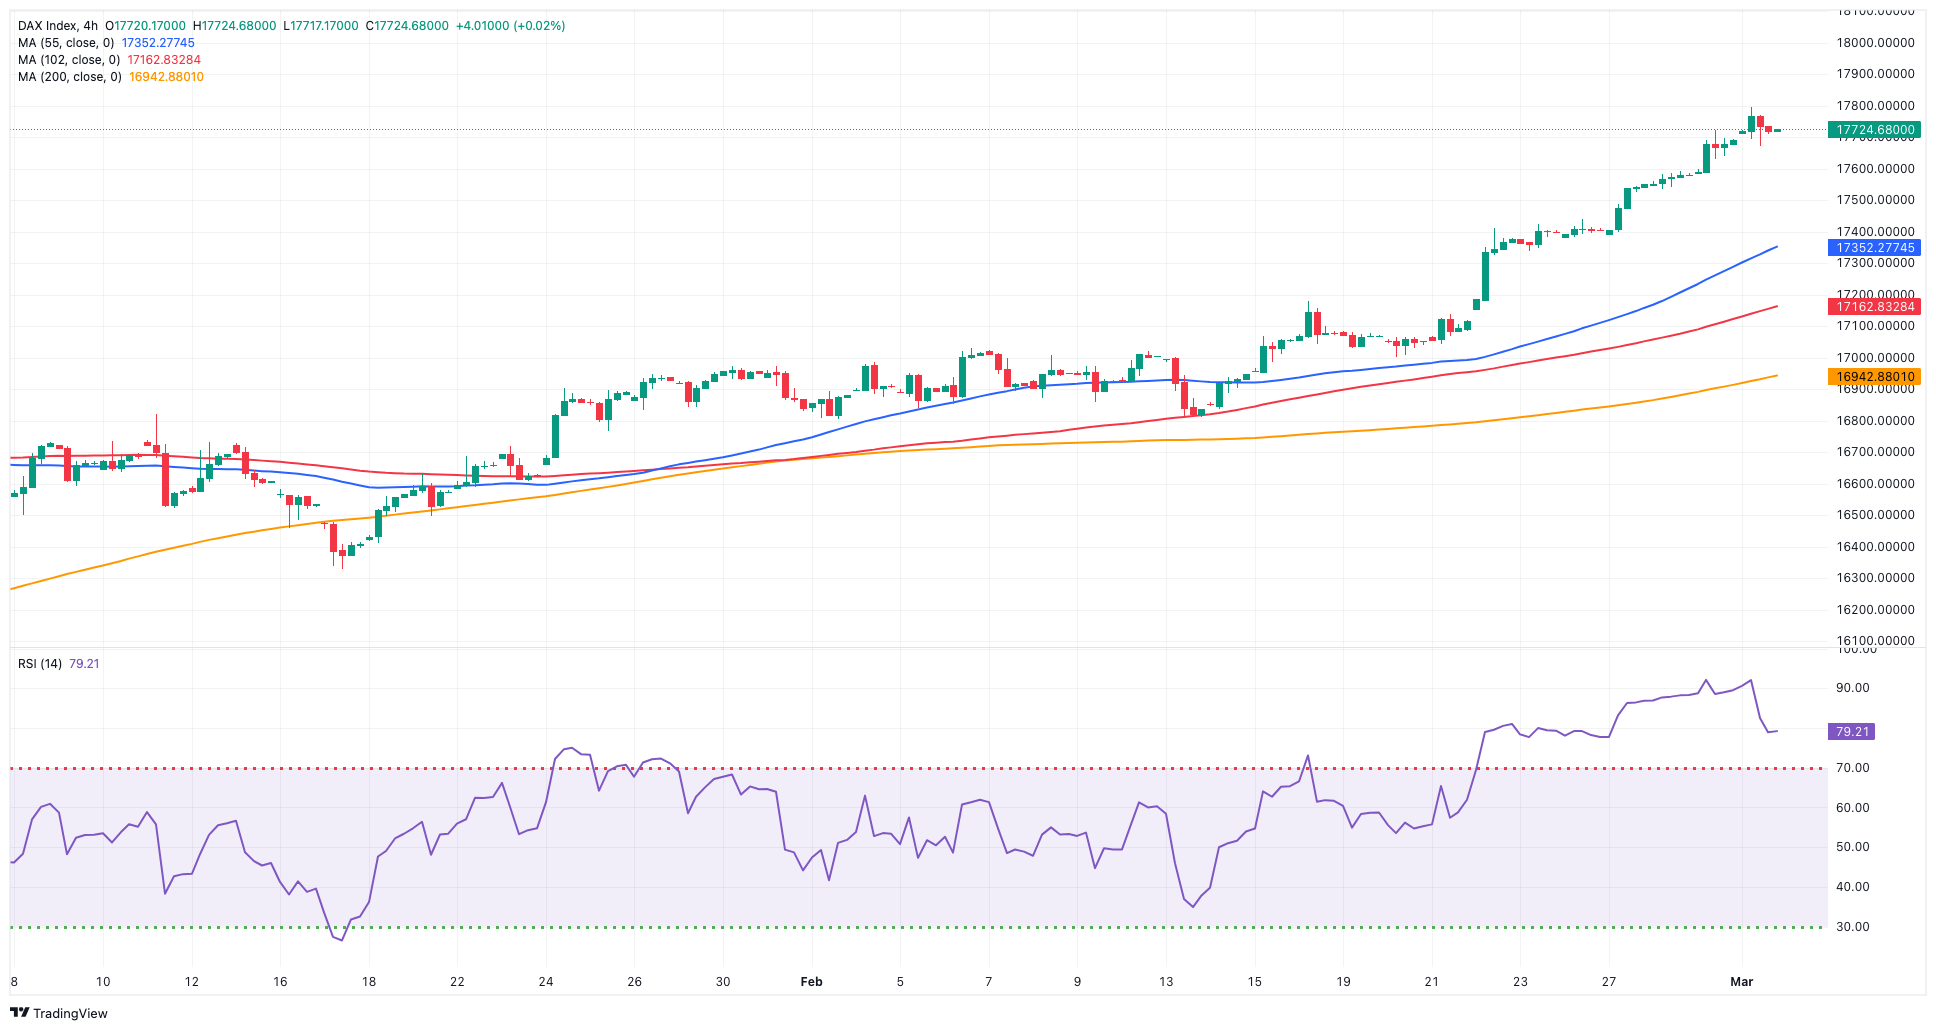
The upside momentum in Germany’s DAX40 appeared unabated once again on Friday after the index clinched an all-time high past the 17,800 level.
Auspicious corporate earnings reports collaborated with the upside momentum in the index along with the prevailing risk-on sentiment, leaving behind, at the same time, the upside surprise from advanced inflation figures in the broader euro area after the CPI rose more than expected in February.
Meanwhile, extra gains in the index came in tandem with the second daily pullback in a row from 10-year bund yields, which revisited the 2.40% region.
The DAX40's next upward barrier is its all-time high of 17,816 (March 1). The other way around, the 55-day SMA at 16,892 should provide temporary support just ahead of the February low of 16,821 (February 1). The failure of this zone might bring back into focus the 2024 bottom at 16,345 (January 17), which is near to the crucial 200-day SMA at 16,076 and the weekly bottom at 15,915 (November 28). The low for October 2023 is 14,630 (October 23), followed by the March 2023 low of 14,458 (March 20). The daily RSI rose to around 79, suggesting that the market is still significantly overbought.
Best Performers: Daimler Truck Holding, Vonovia, Infineon
Worst Performers: Volkswagen VZO, MTU Aero, Munich Re Group
Resistance levels: 17,816 (4H chart)
Support levels: 17,039 16,831 16,732 (4H chart)
GBPJPY
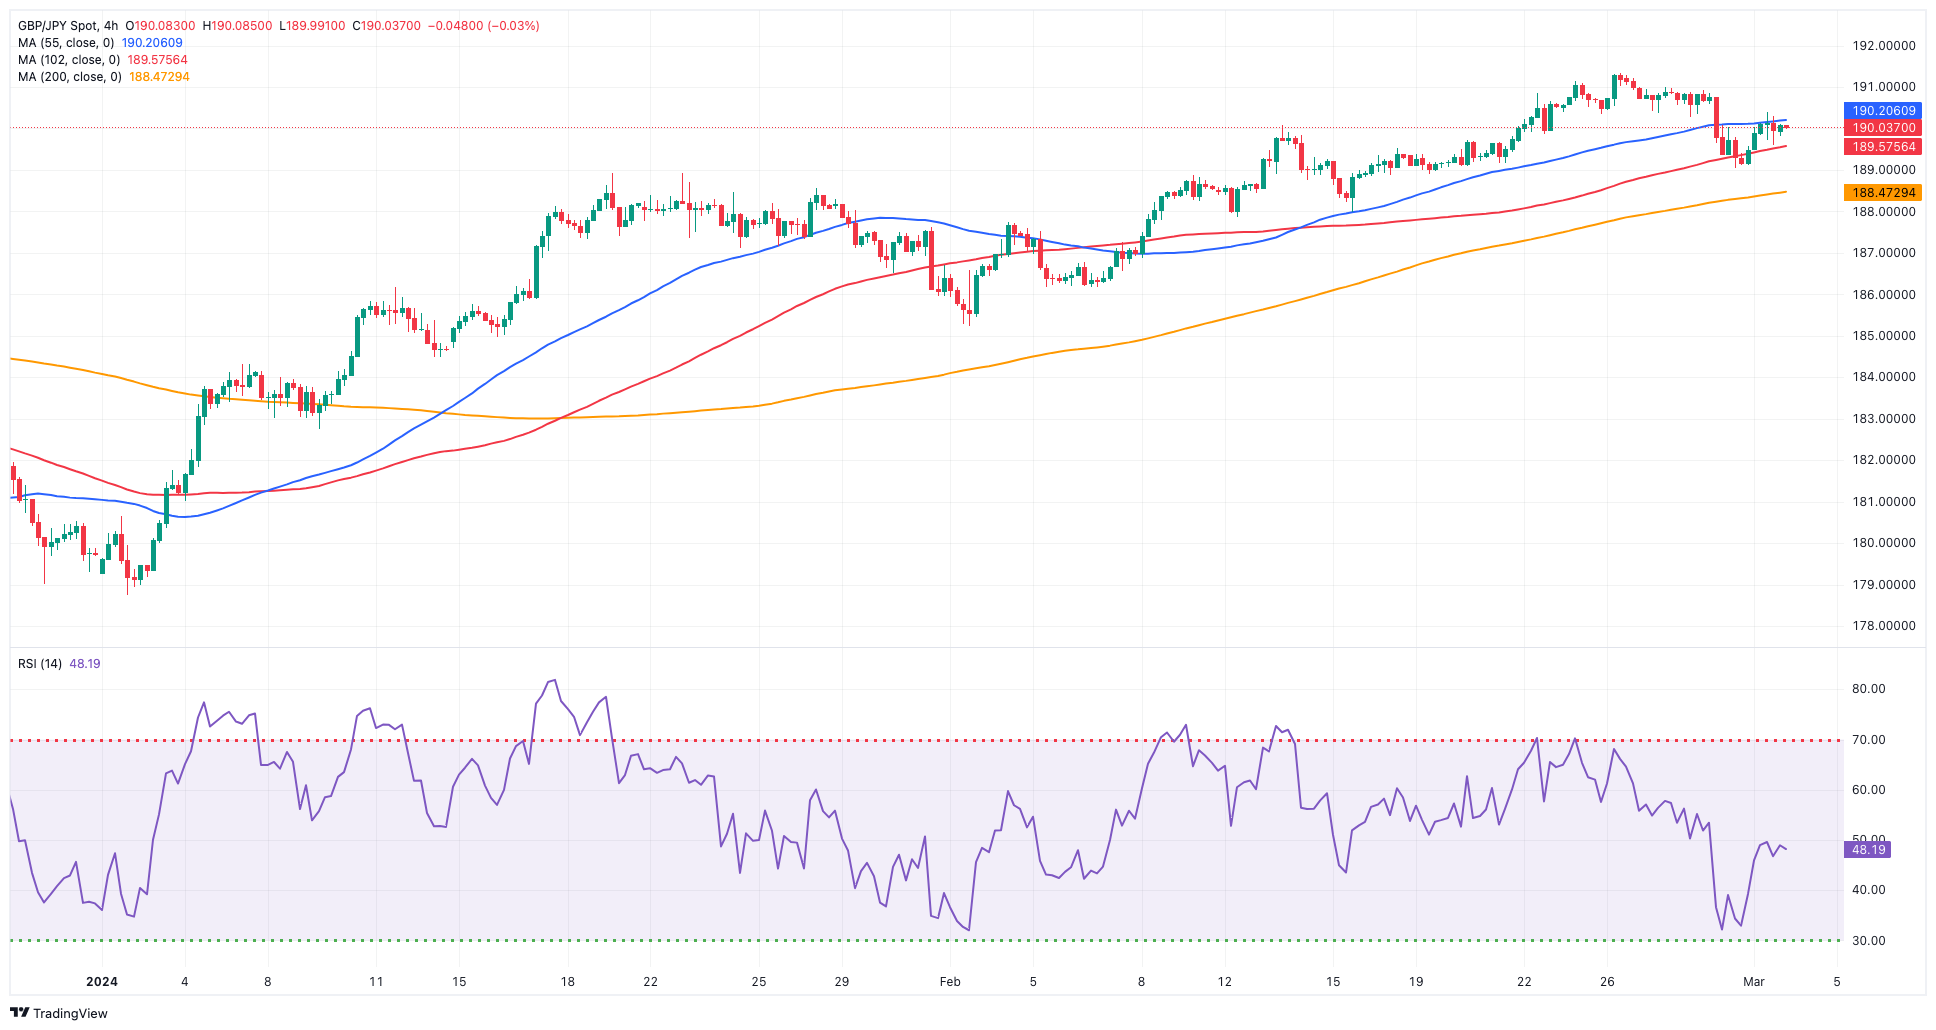
The combination of the broad-based improved sentiment in the risk complex with renewed selling pressure in the Japanese yen gave fresh impetus to GBP/JPY, which printed marked gains near the 190.00 yardstick after three straight sessions of losses.
In fact, the cross managed to regain some balance and rebound from Thursday’s multi-day lows near the 189.00 neighbourhood following decent gains in the Sterling and extra the daily depreciation of the yen.
The continued lower bias might see GBP/JPY revisit the interim 55-day and 100-day SMAs at 186.14 and 185.40, respectively, ahead of the February low of 185.22 (February 1). If the cross breaks below the latter, a test of the more critical 200-day SMA at 183.44 may be on the horizon before the December 2023 bottom of 178.33 (December 14), the October 2023 low of 178.03 (October 3), and the July 2023 low of 176.30. In the other direction, there is immediate resistance at the 2024 top of 191.32 (February 26), which comes ahead of the August 2015 peak of 195.28 (August 18) and the record high of 195.88 (June 24, 2015). On the daily chart, the RSI bounced to the proximity of 58.
Resistance levels: 191.32 195.28 195.88 (4H chart)
Support levels: 189.04 187.99 185.22 (4H chart)
NASDAQ
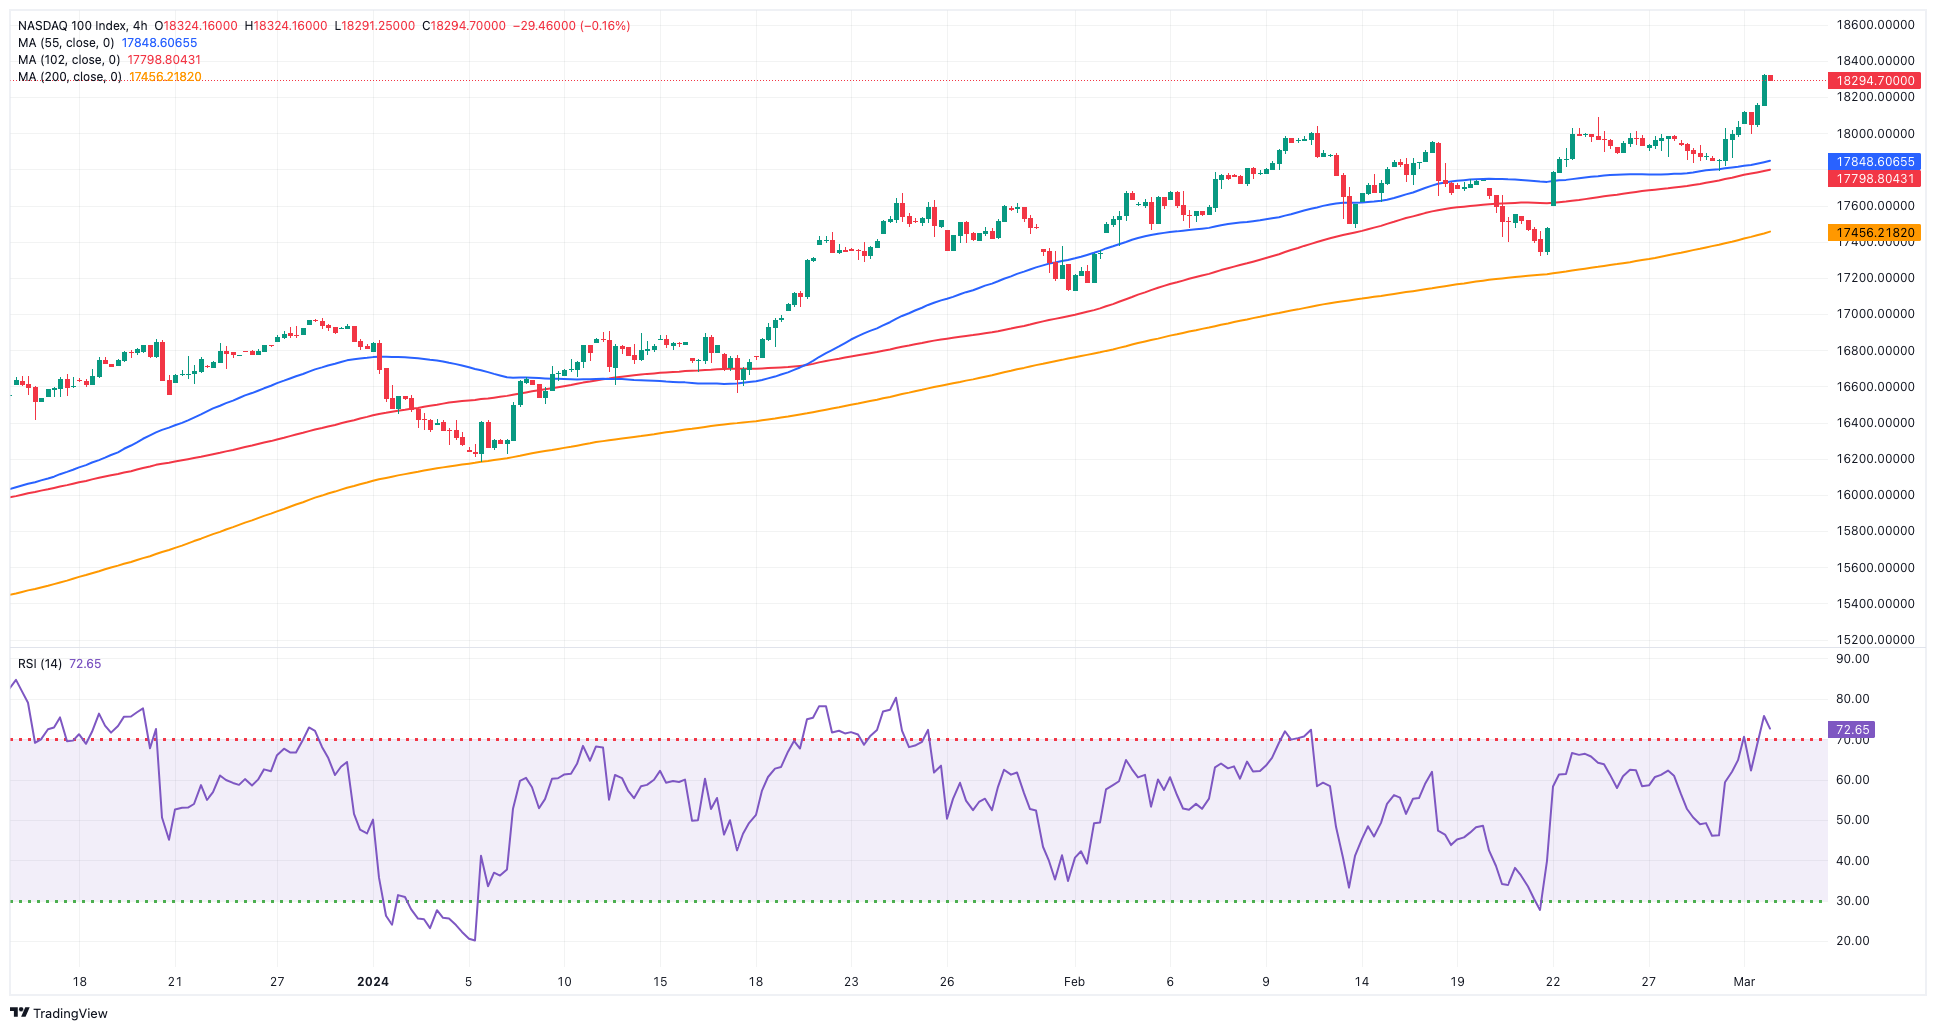
Another positive session saw the key tech index Nasdaq 100 print a new record high around the 18,300 zone on Friday.
Further buying interest around the AI sector in combination with the weaker dollar and diminishing US yields helped the index advance further, while firm speculation of a rate cut by the Fed in June also added to the upbeat mood.
Further increases in the Nasdaq 100 might revisit the all-time high of 18,333 (March 1). On the flip side, the index may retest the weekly low of 17,319 (February 21) prior to the transitory 55-day SMA of 17,224 and another weekly low of 17,128 (January 31). A breakdown of the latter may put a test of the 2024 low of 16,249 (January 5) back on the agenda, ahead of the December 2023 low of 15,695 (December 4) and the crucial 200-day SMA of 15,671. Additional losses from here may challenge the October 2023 level of 14,058 (October 26), followed by the April 2023 low of 12,724 (April 25), the March 2023 low of 11,695 (March 13), and the 2023 low of 10,696. (January 3). The daily RSI rose to the boundaries of 67.
Top Gainers: Marvell, Broadcom, DexCom
Top Losers: Zscaler, Xcel Energy, Sirius XM
Resistance levels: 18,333 (4H chart)
Support levels: 17,319 17,128 16,561 (4H chart)
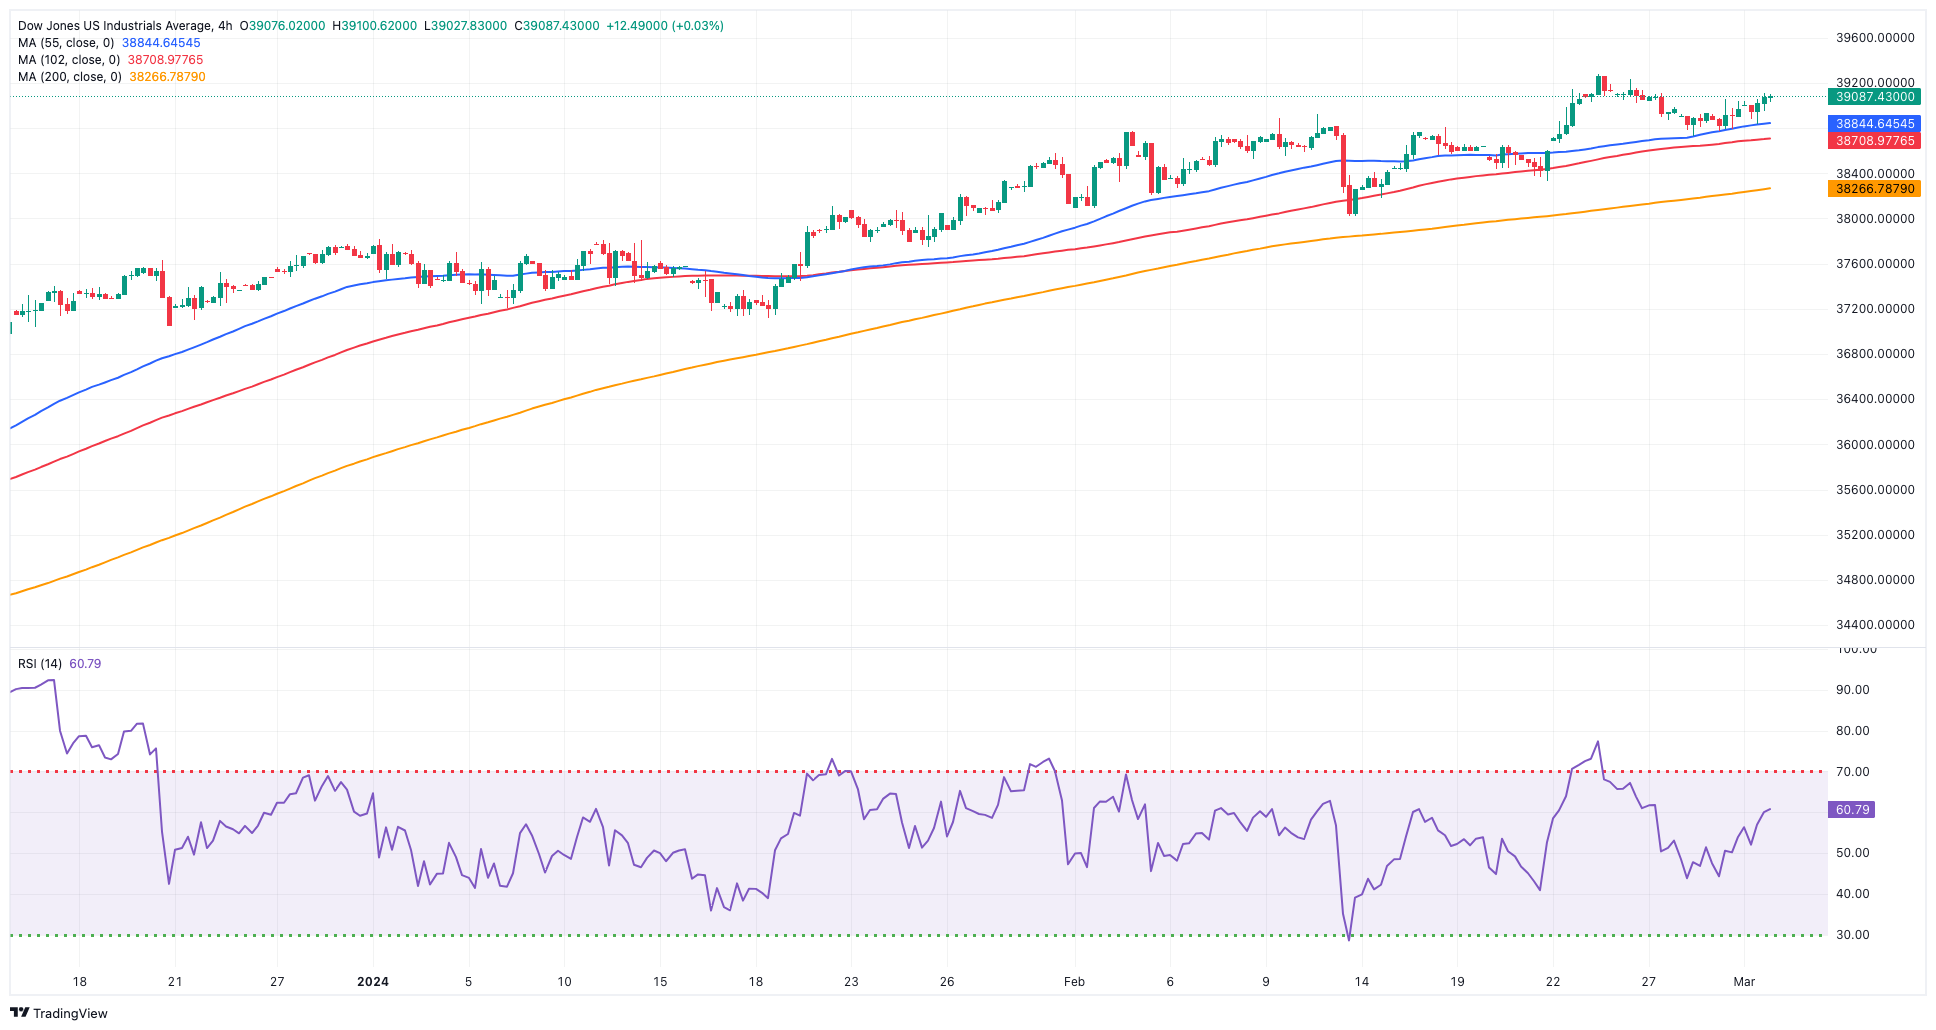
DOW JONES
The US stock reference Dow Jones added to Thursday’s gains and kept the optimism well in place in the latter part of the week, although it could not help a negative performance in the weekly chart.
In fact, investors maintained the bullish bias as they continued to digest the latest US inflation figures tracked by the PCE for the month of January and released on Thursday.
In addition, the focus of attention is now expected to shift to the publication of the US jobs report next week along with further data and testimonies by Chair J. Powell.
On Friday, the Dow Jones gained 0.23% to 39,087, the S&P 500 advanced 0.80% to 5,137, and the tech-focused Nasdaq Composite rose 1.14% to 16,274.
If buyers push harder, the Dow Jones may confront its record high of 39,282 (February 23). The other way around, the 55-day SMA at 38,038 offers temporary support, followed by the 2024 low of 37,122 (January 18) and the weekly low of 37,073 (December 20, 2023). If the index falls below this level, it may encounter the 100-day SMA at 36,412, which comes before the 200-day SMA at 35,339. The weekly low of 33,859 (November 7, 2023) comes next, ahead of the October 2023 low of 32,327 (October 27) and the 2023 low of 31,429 (March 15). The daily RSI climbed past the 63 hurdle.
Top Performers: Salesforce Inc, Amgen, Intel
Worst Performers: Boeing, Nike, Travelers
Resistance levels: 39,282 (4H chart)
Support levels: 38,338 38,039 37,122 (4H chart)
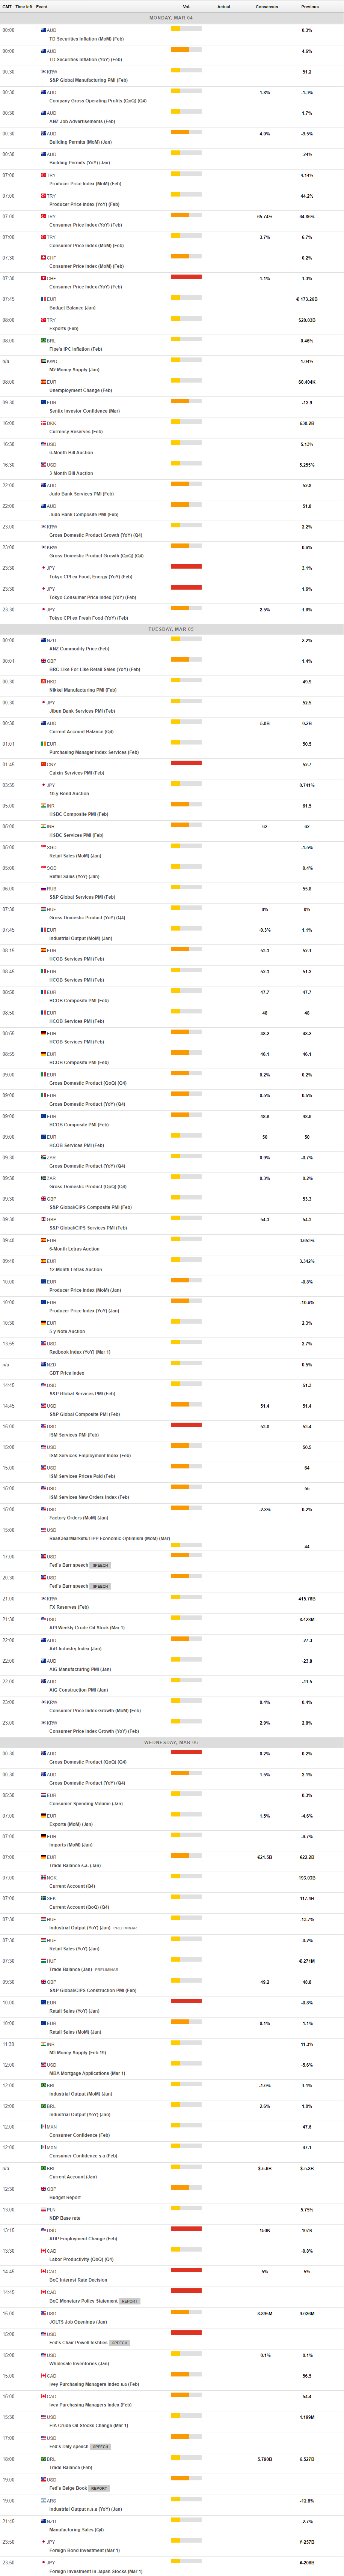
MACROECONOMIC EVENTS
All Information & Updates provided by:

All information relating to the financial markets available on this page has been prepared and issued by FXStreet (Forexstreet SL, Spain, Reg: B62498233) on the basis of publicly available information and all information believed to be reliable and does not conflict with Kuwaiti local laws, and all necessary care has been taken to before the company to ensure that the facts mentioned are correct from the source.
NCM Investment nor any of its directors or employees shall in any way be held responsible for the contents of this news, and the information contained on this page is intended only to provide clients with publicly available information and should not be construed as investment advice, report or analysis and/or constitute an offer or invitation to buy or sell financial instruments of any kind.
RISK WARNING: Forex and CFDs are highly risky leveraged products, as losses can exceed deposits. Please ensure you understand all the risks and take independent advice if necessary. NCM will segregate the clients based on the criteria of the regulator and its bylaws. NCM does not provide any advisory service; the material published does not constitute advice or a recommendation for a transaction in any financial instrument. NCM accepts no responsibility for any use of the content presented and any consequences of that use. Anyone acting on the information provided does so at their own risk.