
- Contact Us:
-

-

-

-


Daily Market Updates
06 Mar 2024
EURUSD
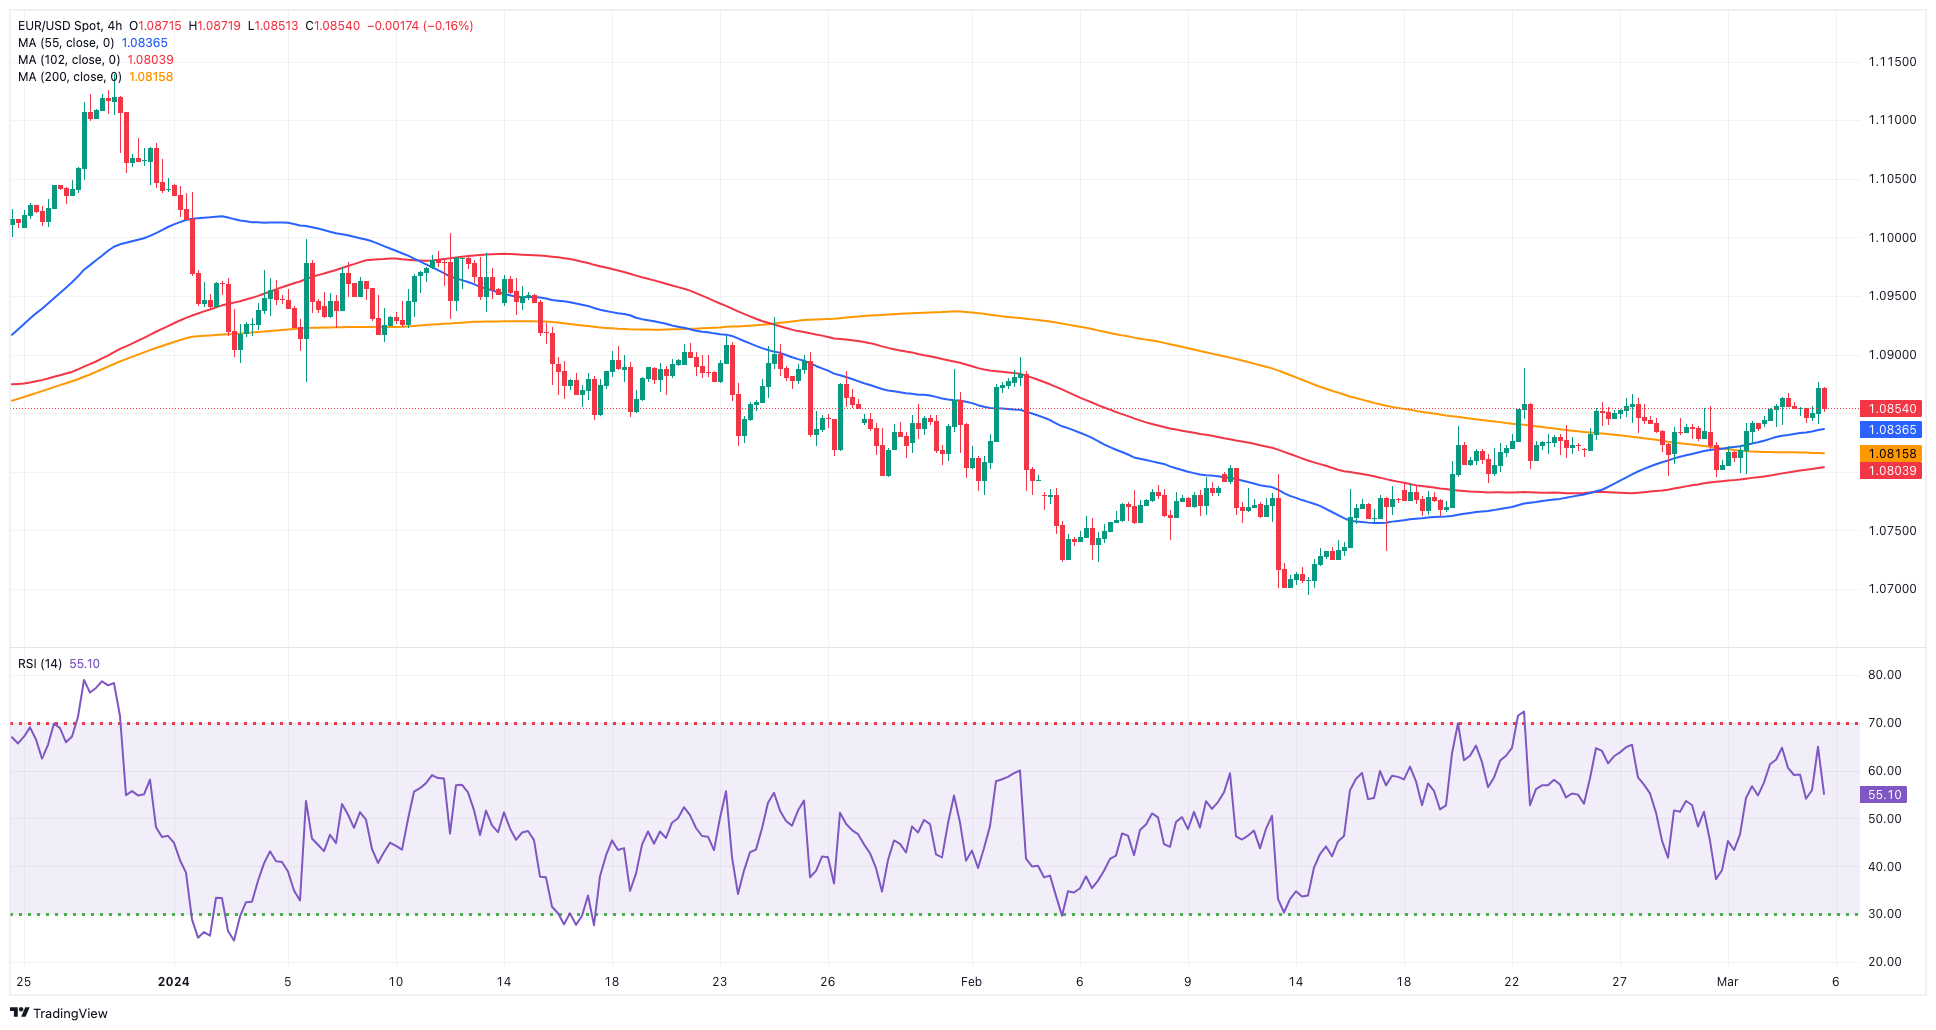
Extra downward pressure in the greenback allowed EUR/USD to recover and build upon its gains from Monday, advancing to fresh two-week highs near the 1.0880 region on Tuesday, up for the third session in a row.
On the flip side, the USD Index (DXY) retreated for the third consecutive day, amidst increased appetite for riskier assets, while market participants absorbed disappointing results from the ISM Services PMI and Factory Orders.
Furthermore, extra gains in spot coincided with further weakness in US yields across the yield curve, alongside a continued decline in Germany's 10-year bund yields.
At the same time, speculation regarding potential interest rate cuts by both the Fed and the ECB persisted, pointing to such a move to come at some point during the summer.
On the domestic calendar, the final HCOB Services PMIs in Germany and the broader euro bloc came in at 48.3 and 50.2, respectively, in February.
Across the ocean, the final S&P Global Services PMI eased a tad to 52.3, while the ISM Services PMI came in short of consensus at 52.6 and Factory Orders contracted by 3.6% MoM in January.
The first resistance for EUR/USD is found at the weekly high of 1.0888 (February 22), which is supported by the intermediate 55-day SMA (1.0876). North of here, weekly tops of 1.0932 (January 24) and 1.0998 (January 5, 11) bolster the psychological 1.1000 threshold. The breakout of this zone may pave the way for a potential challenge of the December 2023 peak of 1.1139 (December 27), which is reinforced by the 200-week SMA of 1.1147 and comes before the 2023 high of 1.1275 (July 18). On the contrary, the loss of the weekly low of 1.0795 (February 29) may prompt EUR/USD to test the 2024 low of 1.0694 (February 14). A deeper pullback could revisit the weekly low of 1.0495 (October 13, 2023), seconded by the 2023 low of 1.0448 (October 3), and the round level of 1.0400. The daily RSI rose above 56.
Resistance levels: 1.0876 1.0888 1.0897 (4H chart)
Support levels: 1.0795 1.0761 1.0732 (4H chart)
USDJPY
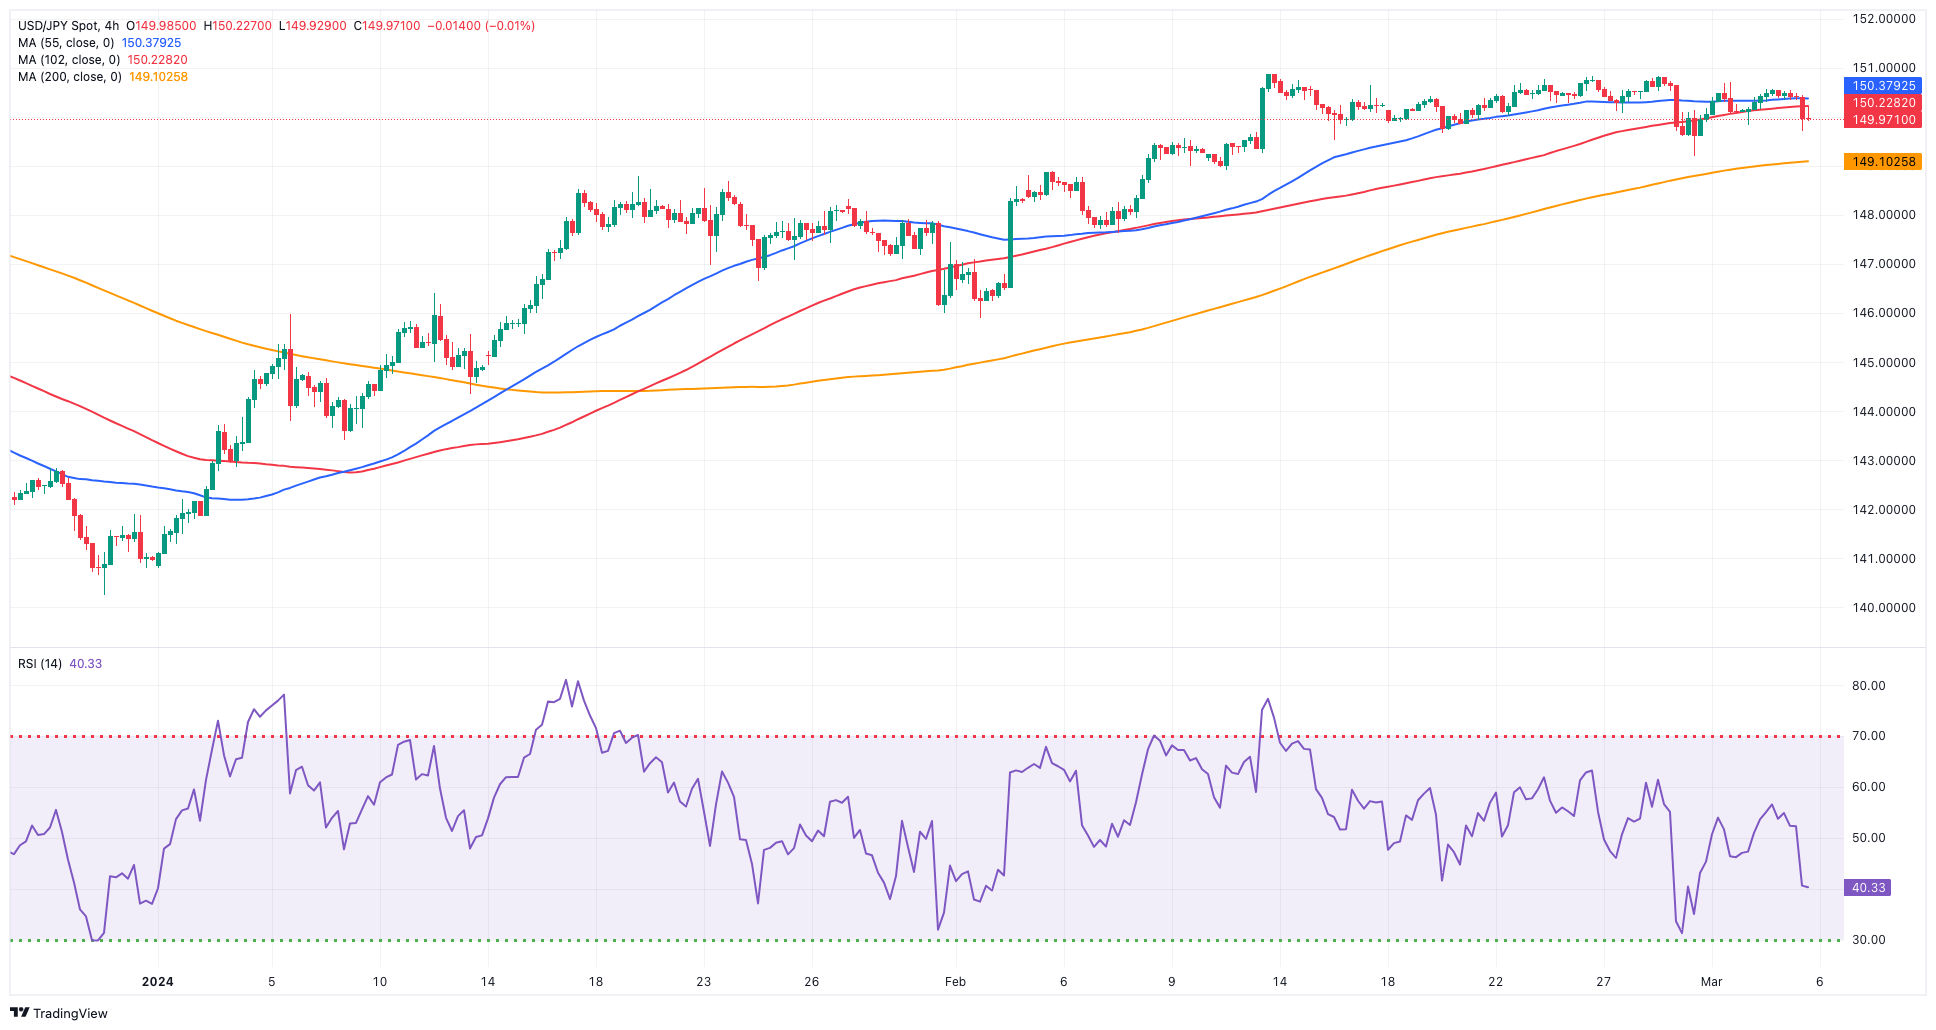
USD/JPY corrected lower after two daily advances in a row on Tuesday.
That said, the pair sank to three-day lows around 149.70, although it later managed to regain the 150.00 zone on the back of some recovery in the greenback, while declining US yields kept the pair on the defensive nonetheless.
In the Japanese bond market, JGB 10-year yields added to Monday’s drop and broke below the key 0.70% mark.
On the docket, higher-than-expected inflation figures in Tokyo have heightened the possibility of an earlier start to the BoJ’s lift-off than what is currently reflected in the market's expectation of June. In fact, the market now assigns a 40% probability of lift-off in March, compared to 30% at the beginning of this week. However, Japan's inflationary environment and sluggish economic activity indicate that the central bank’s normalization process will be slow and gradual, which continues to pose a challenge for the Japanese yen.
Additional data saw the Jibun Bank Services PMI at 52.9 in February (from 53.1).
If bears push harder, USD/JPY may revisit the weekly low of 149.20 (February 29) before reaching the intermediate 100-day and 55-day SMAs at 147.75 and 147.11, respectively. Further south, the February low of 145.89 (February 1) is followed by the crucial 200-day SMA at 146.02 and the December 2023 low of 140.24 (December 28). The loss of the latter reveals the round figure of 140.00, which is higher than the July low of 137.23 (July 14). In contrast, the 2024 high of 150.88 (February 13) serves as the immediate upside hurdle ahead of the 2023 high of 151.90 (November 13). Further north, the 2022 high of 151.94 (October 21) is closely followed by the round figure of 152.00. The daily RSI decreased to the proximity of 56.
Resistance levels: 150.88 151.43 151.90 (4H chart)
Support levels: 149.20 148.92 147.61 (4H chart)
GBPUSD
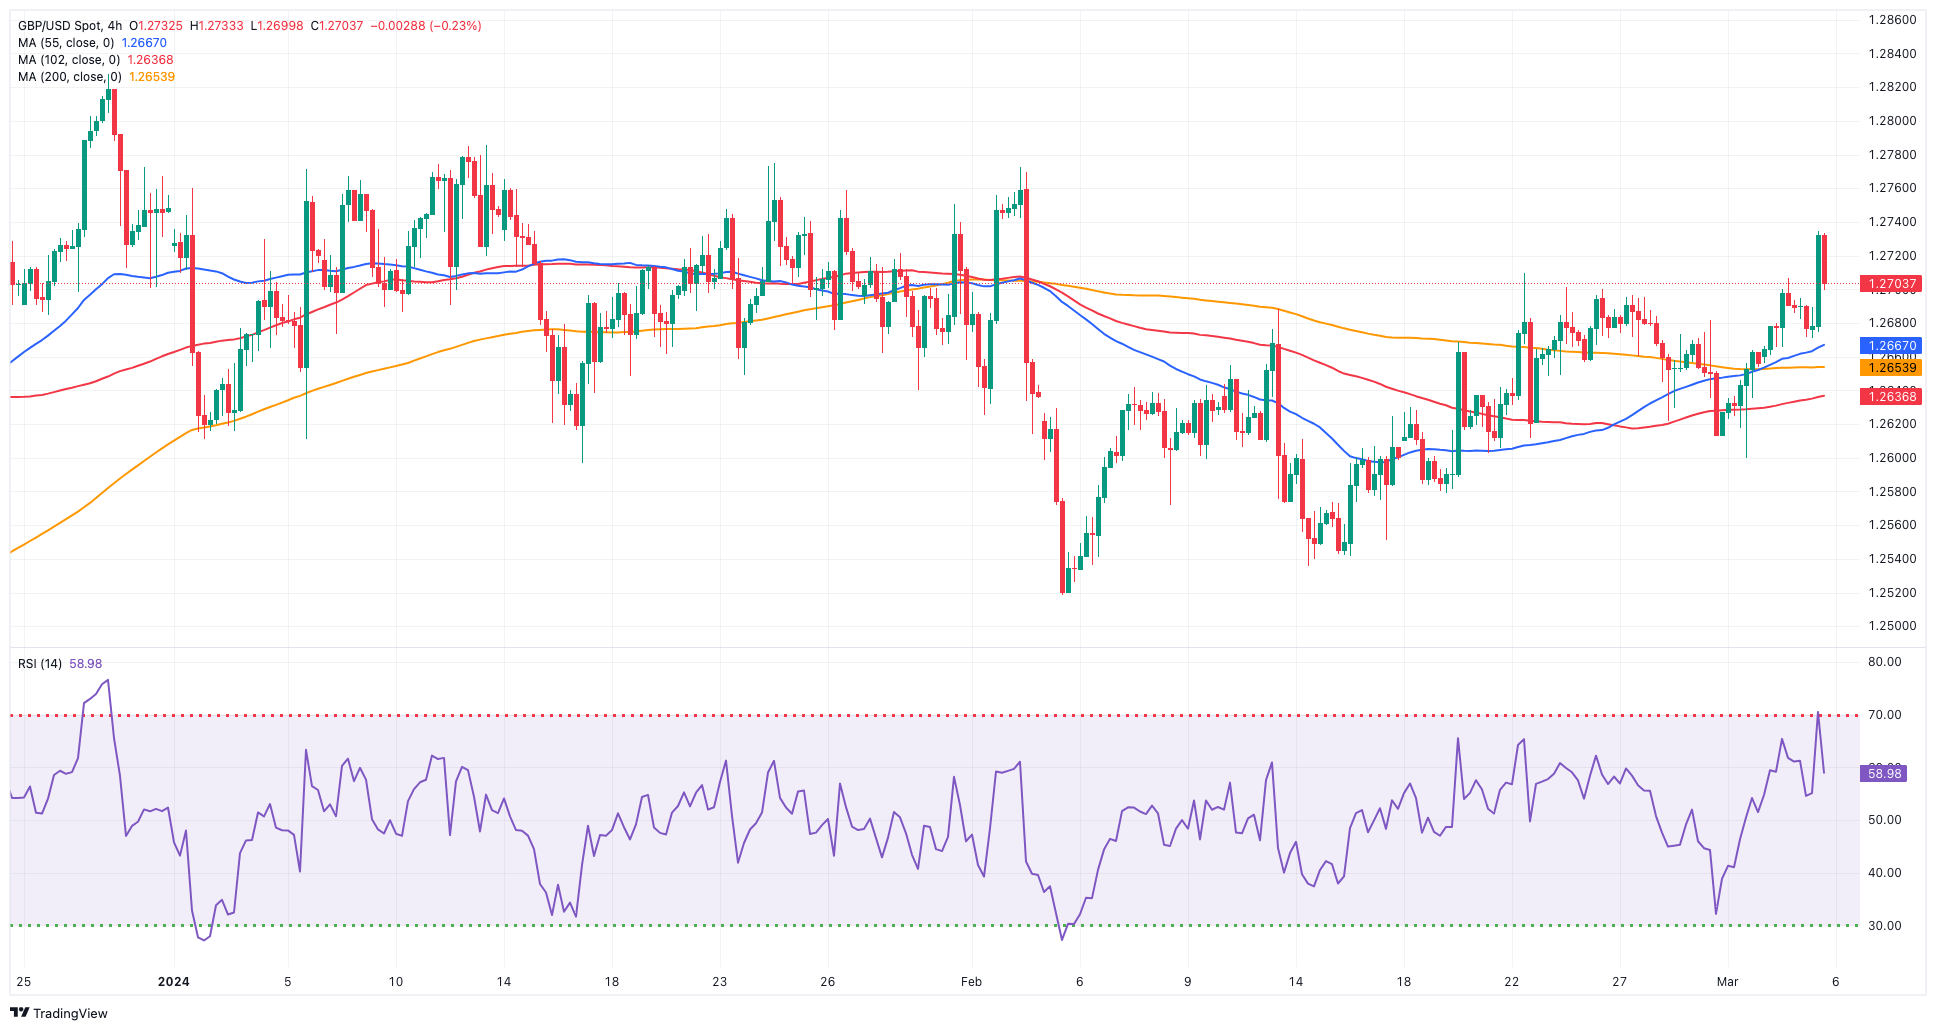
Further weakening of the greenback provided extra support for the British pound, leading GBP/USD to print new five-week highs around 1.2730 on Tuesday.
The continuation of the leg lower in the dollar came in tandem with disappointing prints from the US docket, while the intense downward bias in US yields also added to the sour mood around the USD Index (DXY).
Speaking about yields, UK 10-year gilt yields extended their pullback and challenged the key 4.00% threshold.
In the UK docket, the BRC Retail Sales Monitor rose by 1.0% in the year to February, and the final S&P Global Services PMI came in at 53.8 in the last month.
Next on the upward for GBP/USD is the weekly high of 1.2734 (March 5), followed by the February top of 1.2772 (February 2) and the 2024 peak of 1.2785 (January 12). Extra gains from here may confront the December high of 1.2827 (December 28), which comes before the weekly top of 1.2995 (July 27, 2023) and the critical 1.3000 yardstick. Just the opposite, bearish developments could drag Cable to the critical 200-day SMA at 1.2575, before the intermediate 100-day SMA at 1.2552 and the 2024 low of 1.2518 (February 5). The breakdown of this level reveals the December 2023 low of 1.2500 (December 13), which precedes the weekly low of 1.2187 (November 10, 2023), ahead of the October 2023 low of 1.2037, the crucial 1.2000 milestone, and the 2023 low of 1.1802 (March 8). On the daily chart, the RSI improved past the 58 level.
Resistance levels: 1.2734 1.2772 1.2827 (4H chart)
Support levels: 1.2599 1.2579 1.2518 (4H chart)
GOLD
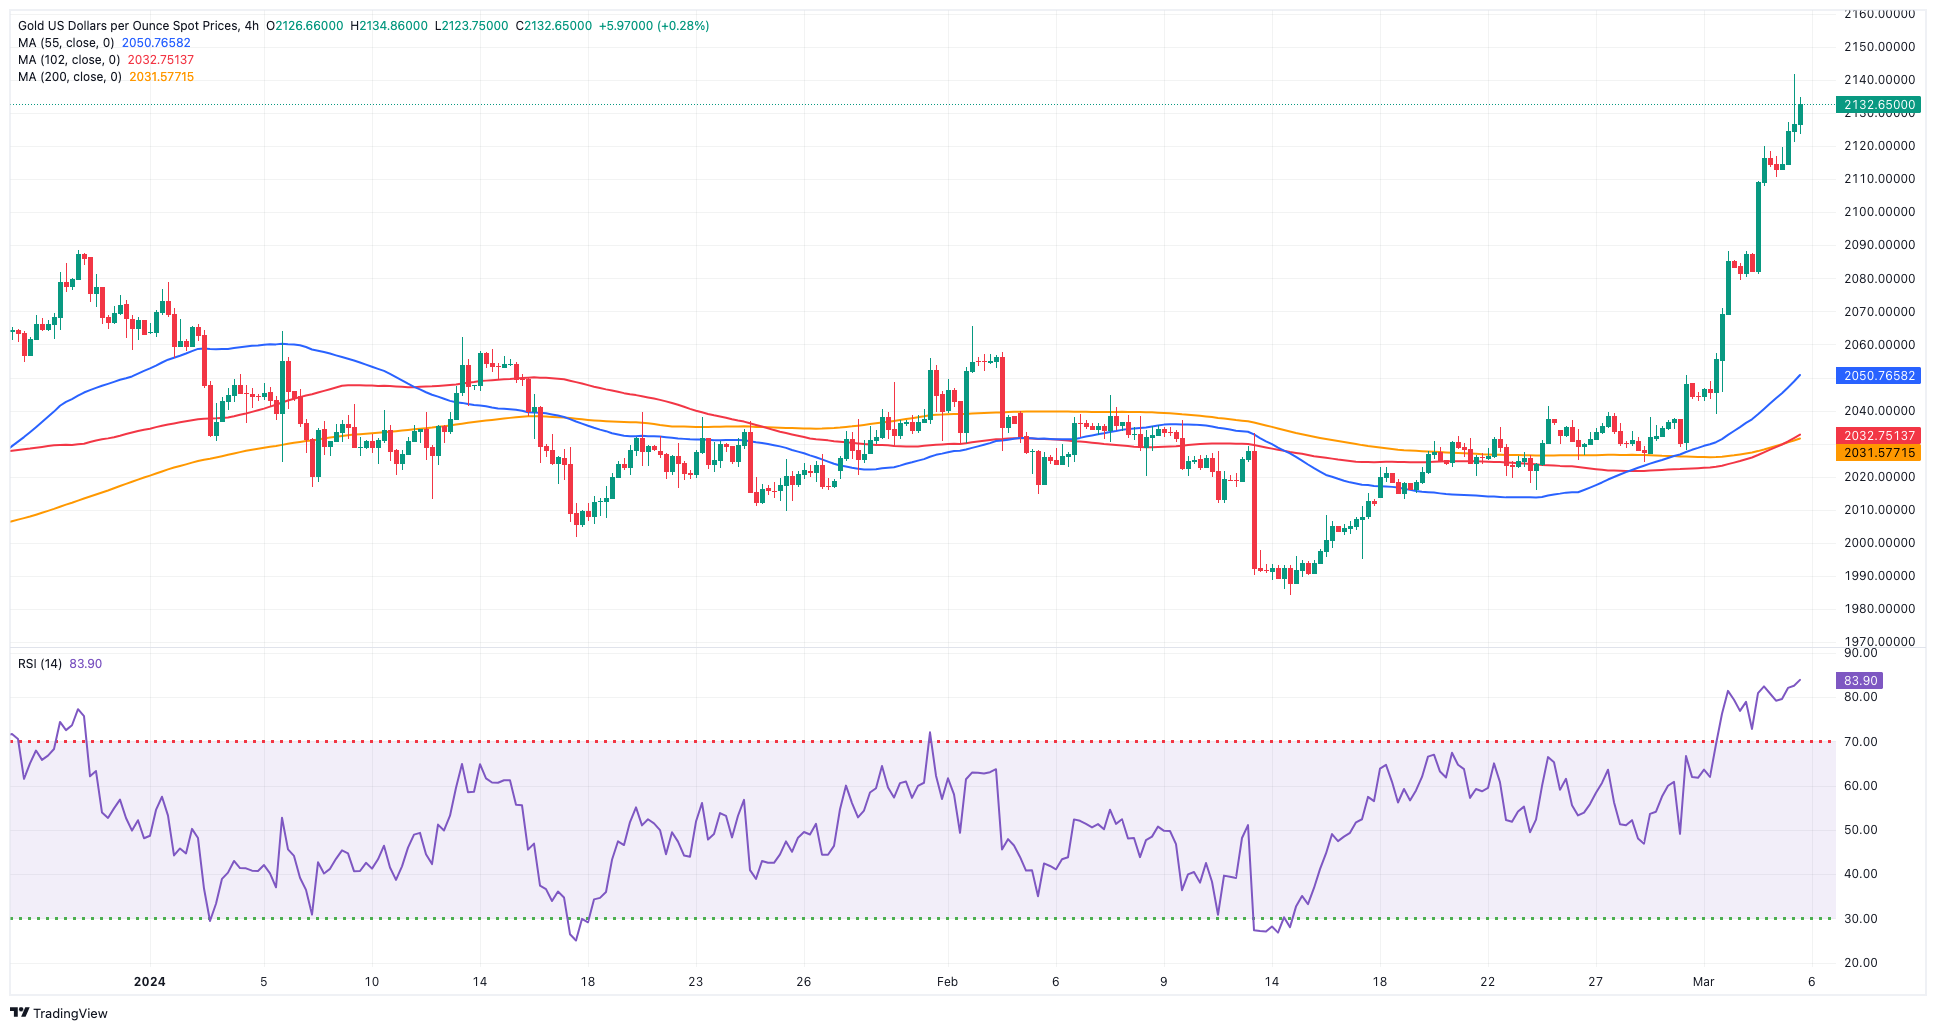
The price of gold surged to record levels beyond the $2,140 mark per troy ounce on Tuesday.
This notable rise in the value of the precious metal occurred on the back of further weakness in US yields across various timeframes, as well as additional selling pressure on the greenback, all amidst increasing bets for a rate reduction by the Fed at its June 12 event.
Also bolstering the demand for gold emerged unabated geopolitical concerns in the Middle East and the Russia-Ukraine war.
Later in the week, the robust recovery in the price of the yellow metal is anticipated to face challenges with the forthcoming testimonies by Chair Powell and the release of US Non-farm Payrolls data for the month of February.
Next on the upside for gold emerges its all-time high of $2,141 (March 5). Having said that, the 55-day and 100-day SMAs at $2,037 and $2,015 should provide temporary support, followed by the 2024 low of $1,984 (February 14) and the December 2023 low of $1,973, which is supported by its proximity to the crucial 200-day SMA of $1,969 and seems ahead of the November 2023 low of $1,931. A further decrease may see the yellow metal retest its October 2023 bottom of $1,810, which is ahead of the 2023 low of $1,804 and the critical $1,800 conflict zone.
Resistance levels: $2,141 (4H chart)
Support levels: $2,028 $2,016 $1,984 (4H chart)
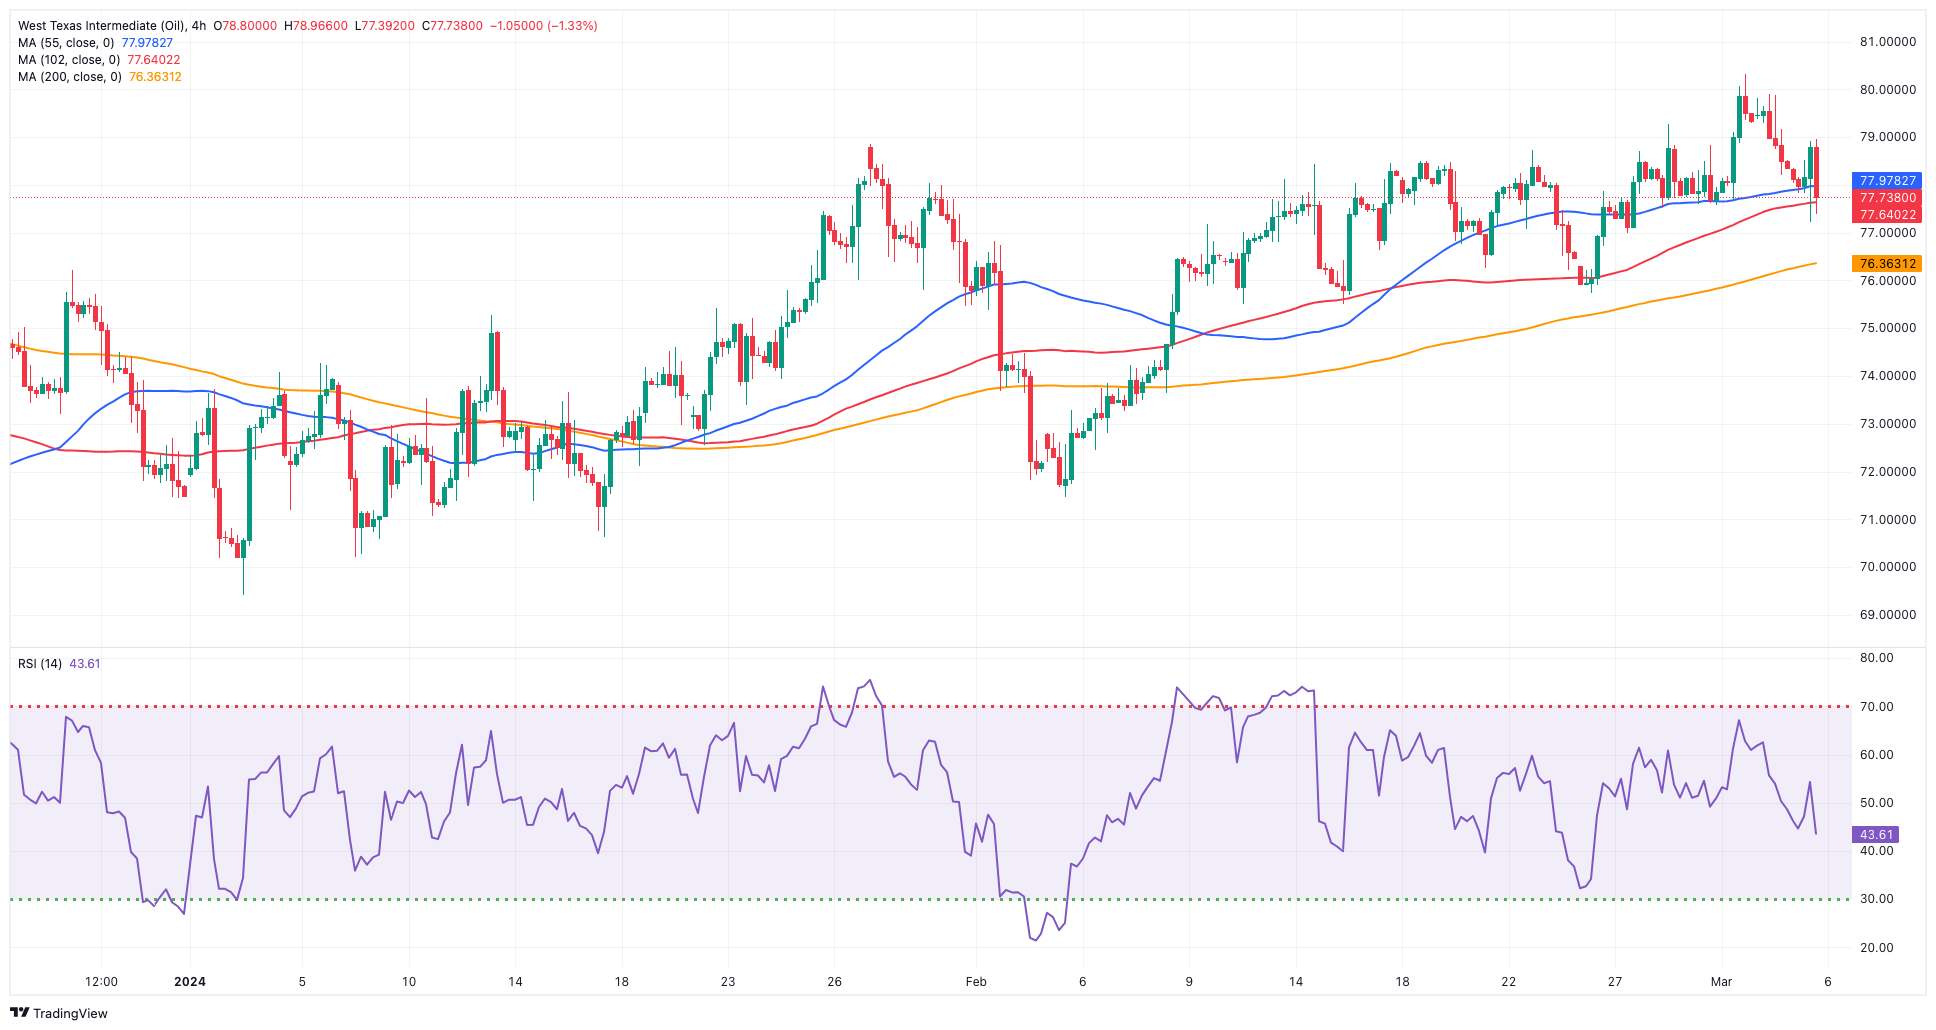
CRUDE WTI
WTI prices extended the pessimism seen on Monday and retreated sharply below the $78.00 mark per barrel on Tuesday, putting the key 200-day SMA ($77.92) to the test at the same time.
The move lower in crude oil prices came in response to traders’ scepticism surrounding the still-absent economic bounce in China, while the government’s GDP target of “around 5%” appeared somewhat unachievable, as per the announcement at the National People’s Congress.
Those headlines managed to set aside the extension of voluntary oil production cuts by the OPEC+ into Q2 as well as unabated geopolitical jitters from the Israel-Hamas conflict and the Red Sea crisis.
The next upward challenge for WTI is the 2024 high of $80.82 (March 1), which precedes the weekly top of $89.83 (October 18, 2023) and the 2023 peak of $94.99 (September 28, 2023). Further up, the August 2022 high of $97.65 (August 30) emerges before the psychological $100.00 milestone. Conversely, the 100-day and 55-day moving averages should give interim support at $76.38 and $75.03, respectively, before sliding to the February low of $71.43 (February 5). A further decline reveals the critical $70.00 threshold prior to the 2024 bottom of $69.31 (January 3).
Resistance levels: $80.82 $83.56 $85.85 (4H chart)
Support levels: $75.81 $75.49 $71.37 (4H chart)
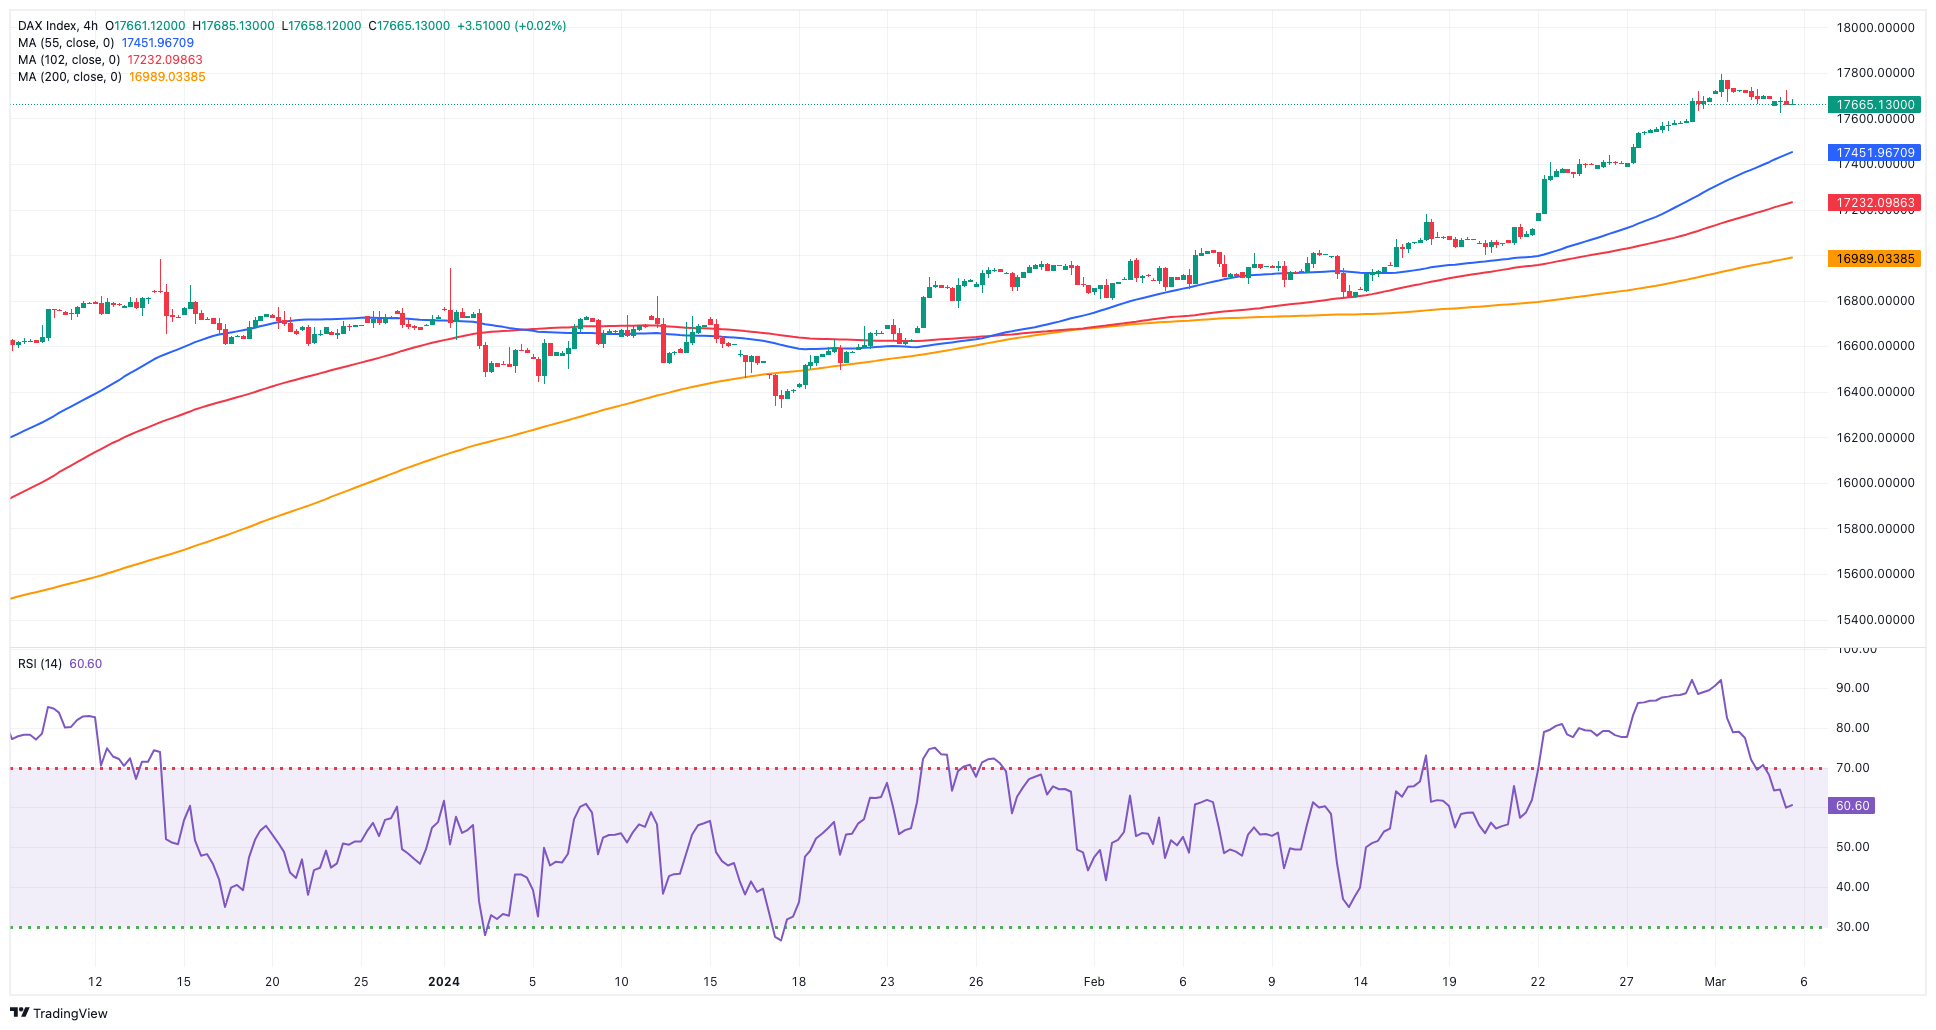
GER40
Germany's benchmark index DAX40 extended Monday’s weakness and receded marginally to three-day lows near the 17,600 zone on turnaround Tuesday.
The index's extra decline appeared to be backed by increased caution ahead of the ECB's interest rate decision, Powell's testimony, and the US employment data, all of which are planned for later this week.
Adding to the sour mood, uncertainty around the Chinese economy also remained on the rise, as investors remained sceptical after the government’s announcement of extra reforms and a GDP target of “around 5%”.
On another front, additional losses in the index corresponded with a deeper decline in 10-year bund yields, which fell to roughly 2.30%.
The DAX40's next upward barrier is its all-time high of 17,816 (March 1). Alternatively, the 55-day SMA around 16,927 should provide transitory support shortly before the February low of 16,821 (February 1). The collapse of this zone may bring back into focus the 2024 bottom at 16,345 (January 17), which is near to the crucial 200-day SMA at 16,095 and the weekly low at 15,915 (November 28). The low for October 2023 is 14,630 (October 23), followed by 14,458 (March 20). The daily RSI fell to around 76, indicating that the market remained significantly overbought.
Best Performers: Fresenius SE, RWE AG ST, E.ON SE
Worst Performers: Bayer, Siemens Energy AG, Deutsche Post
Resistance levels: 17,816 (4H chart)
Support levels: 17,039 16,834 16,732 (4H chart)
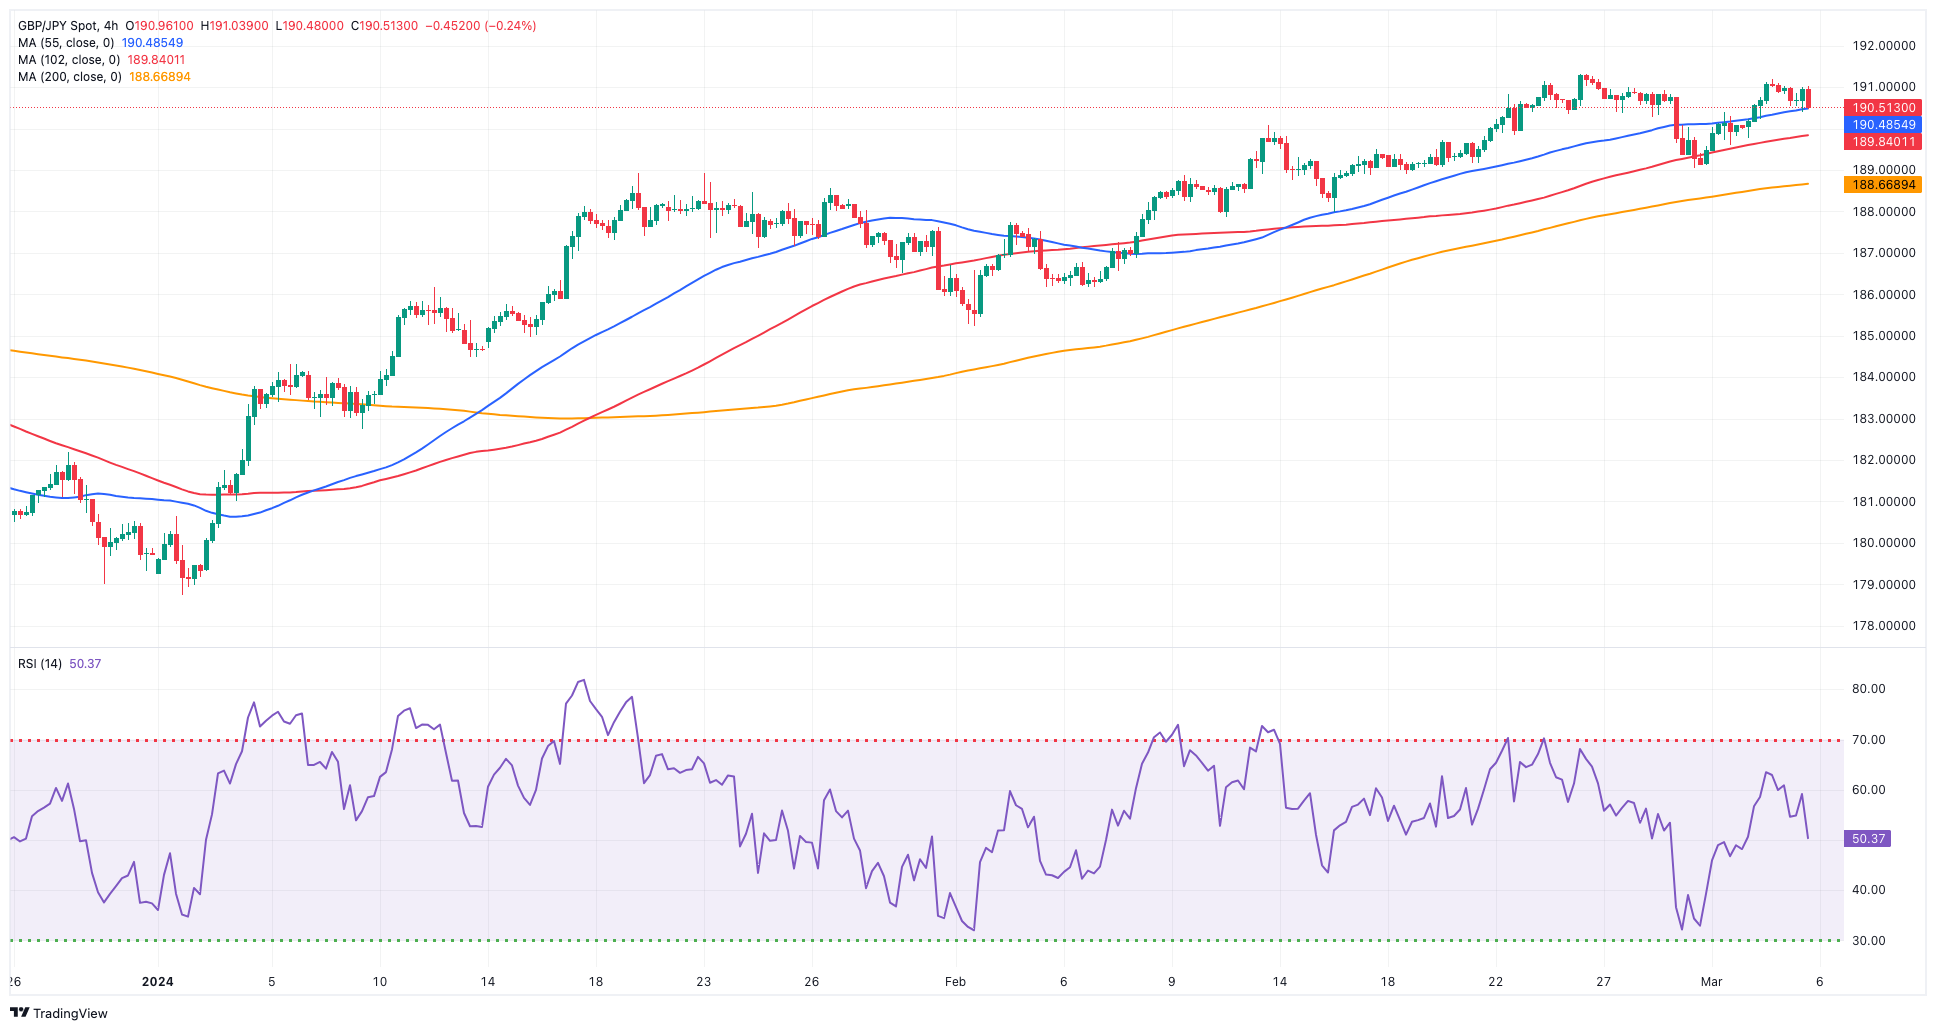
GBPJPY
The late recovery in the dollar put the risk complex under some pressure towards the end of the NA session on Tuesday.
Against that and coupled with the increased buying interest in the Japanese yen, GBP/JPY left behind two straight sessions of gains and retreated modestly to the 190.40 region, where some initial support turned up.
Immediately to the upside for GBP/JPY comes the 2024 high of 191.32 (February 26), which is ahead of the August 2015 top of 195.28 (August 18) and the record peak of 195.88 (June 24, 2015). In the opposite direction, a break below the weekly low of 189.04 (February 29) might lead to a slide to the intermediate 55-day and 100-day SMAs of 186.51 and 185.58, respectively, ahead of the February low of 185.22 (February 1). If the cross breaches the latter, the more significant 200-day SMA at 183.62 may be tested before the December 2023 low of 178.33 (December 14), the October 2023 low of 178.03 (October 3), and the July 2023 low of 176.30. The daily RSI deflated to the sub-61 area.
Resistance levels: 191.19 191.32 195.28 (4H chart)
Support levels: 189.04 187.99 185.22 (4H chart)
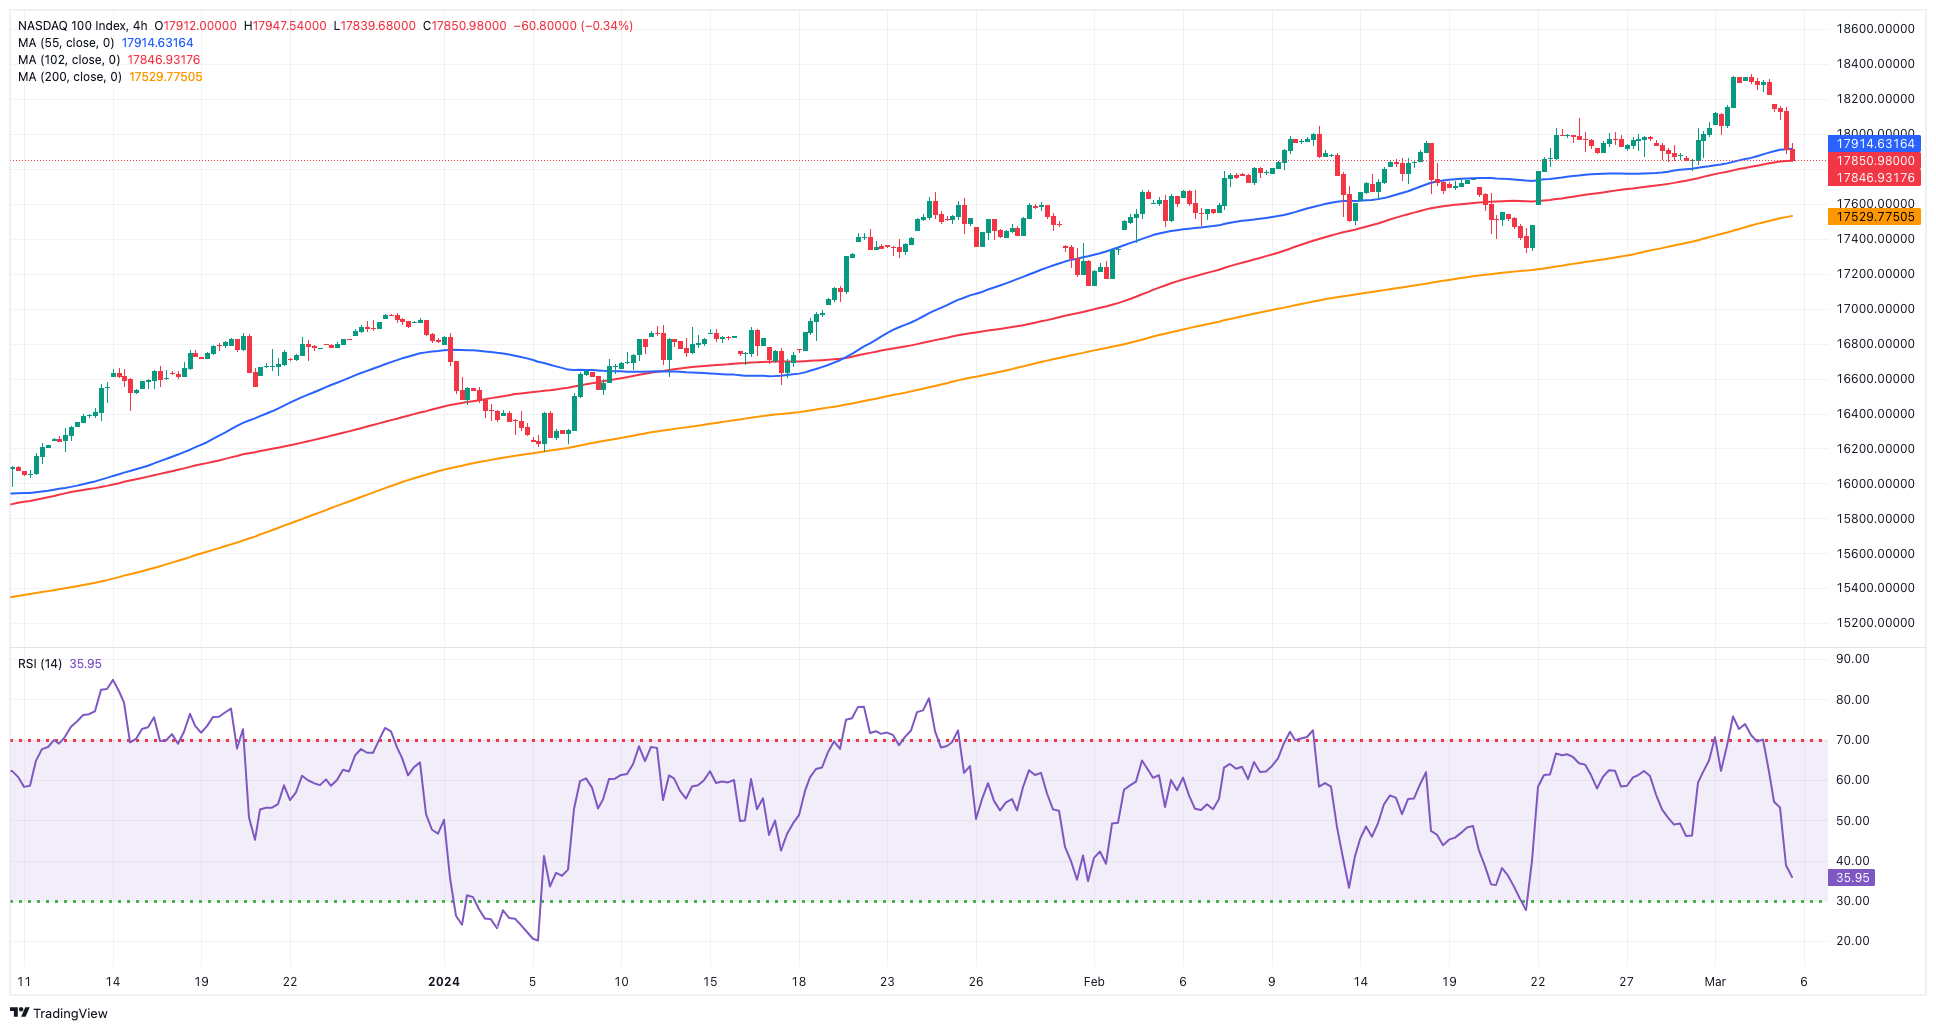
NASDAQ
The Nasdaq 100, the technology benchmark, added to Monday’s retracement and extended further its rejection from last week’s record tops around the 18,300 zone on Tuesday.
Indeed, prudent trade prevailed over an alternating risk-on attitude as market players began to factor in Chief Powell's congressional testimony and the February US employment market report, both of which are scheduled for later this week.
Further rises in the Nasdaq 100 may take it back to its all-time top of 18,333 (March 1). On the other side, the index might retest the weekly low of 17,319 (February 21), which preceded the transitory 55-day SMA of 17,281 and another weekly low of 17,128 (January 31). A breakdown of the latter may put a test of the 2024 bottom of 16,249 (January 5) back on the table, ahead of the December 2023 low of 15,695 (December 4) and the key 200-day SMA of 15,717. Additional losses from here may test the October 2023 level of 14,058 (October 26), followed by the April 2023 low of 12,724 (April 25), the March 2023 low of 11,695 (March 13), and the 2023 low of 10,696 (January 3). The RSI on the daily chart sank to the vicinity of 53.
Top Gainers: Dollar Tree, PACCAR, Baker Hughes
Top Losers: MongoDB, CrowdStrike Holdings, Datadog
Resistance levels: 18,333 (4H chart)
Support levels: 17,319 17,128 16,561 (4H chart)
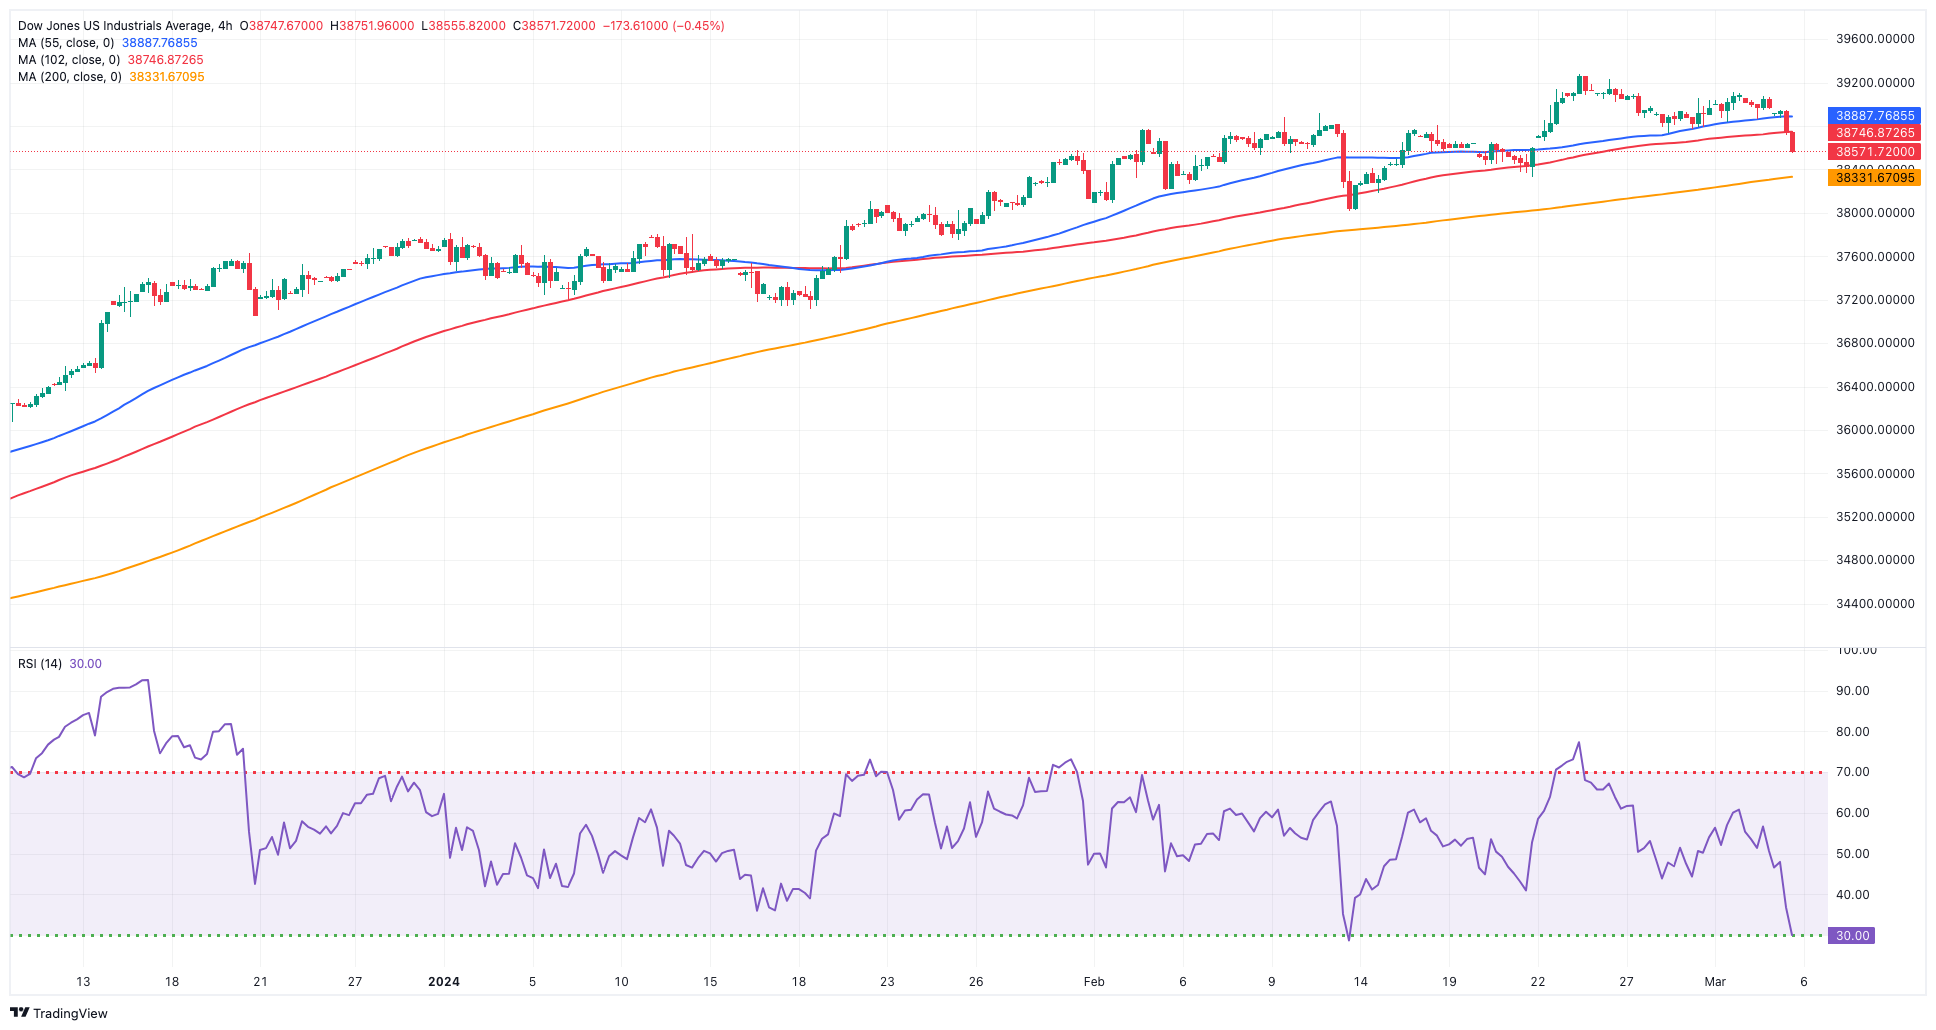
DOW JONES
The Dow Jones index of US stocks fell markedly to new multi-session lows on Tuesday, adding to the sour mood seen at the beginning of the week.
In fact, broad-based cautiousness remained in place on Tuesday as market investors anxiously anticipated Fed Chair Powell's statement and the publication of the US labour market report for the month of February, which should shed further light on the potential timing and extent of any cuts to the Fed's main policy rate this year.
On the whole, the Dow Jones sank 0.94% to 38,627, the S&P 500 fell 1.00% to 5,079, and the tech-centric Nasdaq Composite deflated 1.80% to 15,915.
If buyers push harder, the Dow Jones might break its record high of 39,282 (February 23). On the downside, the 55-day SMA at 38,109 serves as temporary support, followed by the 2024 low of 37,122 (January 18) and the weekly low of 37,073 (December 20, 2023). If the index falls below this level, it may confront the 100-day SMA at 36,515, which is prior to the 200-day SMA at 35,395. The weekly low of 33,859 (November 7, 2023) comes next, followed by the October 2023 low of 32,327 (October 27) and the 2023 low of 31,429 (March 15). The daily RSI tumbled to the 50 region.
Top Performers: 3M, Walmart, JPMorgan
Worst Performers: Intel, Salesforce Inc, Microsoft
Resistance levels: 39,282 (4H chart)
Support levels: 38,338 38,039 37,122 (4H chart)
MACROECONOMIC EVENTS

All Information & Updates provided by:

All information relating to the financial markets available on this page has been prepared and issued by FXStreet (Forexstreet SL, Spain, Reg: B62498233) on the basis of publicly available information and all information believed to be reliable and does not conflict with Kuwaiti local laws, and all necessary care has been taken to before the company to ensure that the facts mentioned are correct from the source.
NCM Investment nor any of its directors or employees shall in any way be held responsible for the contents of this news, and the information contained on this page is intended only to provide clients with publicly available information and should not be construed as investment advice, report or analysis and/or constitute an offer or invitation to buy or sell financial instruments of any kind.
RISK WARNING: Forex and CFDs are highly risky leveraged products, as losses can exceed deposits. Please ensure you understand all the risks and take independent advice if necessary. NCM will segregate the clients based on the criteria of the regulator and its bylaws. NCM does not provide any advisory service; the material published does not constitute advice or a recommendation for a transaction in any financial instrument. NCM accepts no responsibility for any use of the content presented and any consequences of that use. Anyone acting on the information provided does so at their own risk.