
- Contact Us:
-

-

-

-


Daily Market Updates
08 Mar 2024
EURUSD
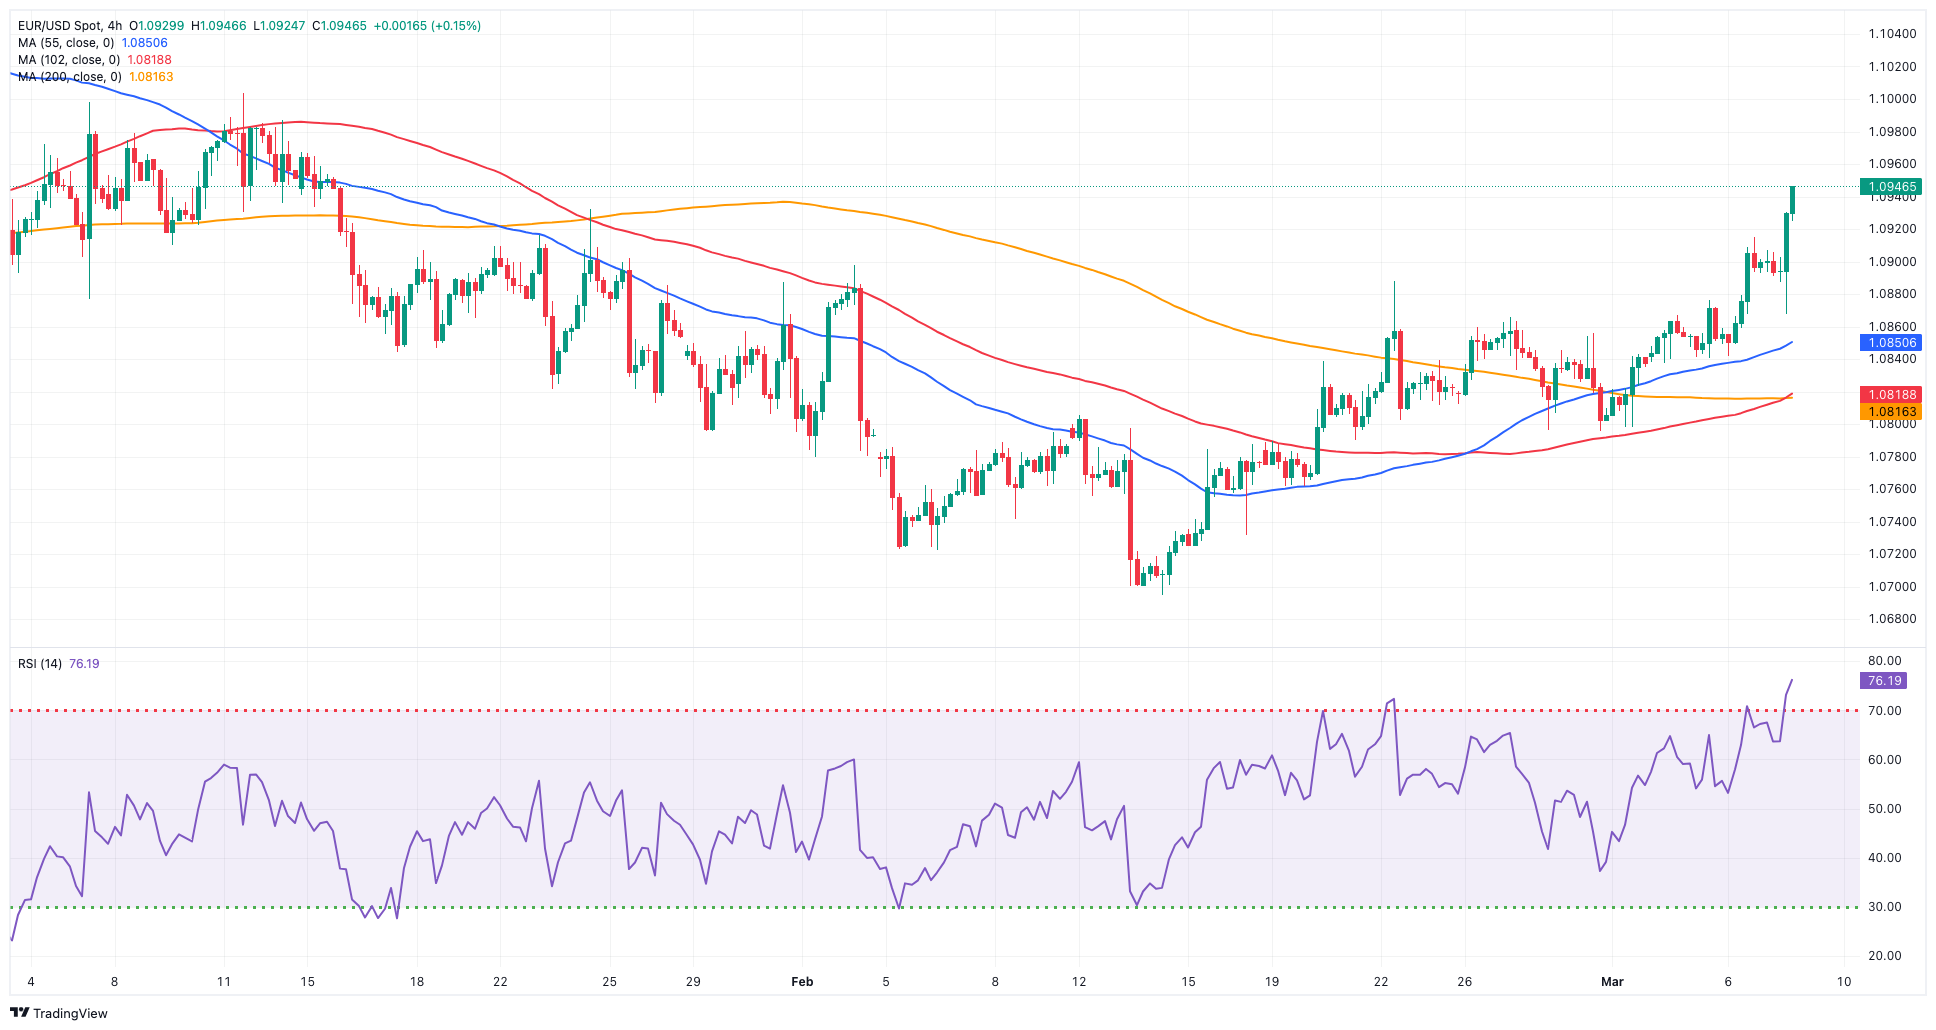
The intense and still unabated sell-off in the greenback propelled EUR/USD to fresh multi-week highs in the 1.0940/45 band on Thursday, in a context dominated by further appetite for the risk-linked galaxy and auspicious results from the Chinese trade balance.
Indeed, the USD Index (DXY) slipped back to the sub-103.00 region for the first time since early February, accompanied by an equally persistent leg lower in US yields across the curve at a time when investors kept factoring in a potential rate cut by the Fed at its June event.
Still around central banks, the ECB kept its monetary status quo unchanged on Thursday, although President Lagarde failed to surprise market participants at her press conference. On this, she clarified that the council did not deliberate on an immediate rate cut during this week's meeting. In the statement, the bank revised its projections for inflation and reiterated that risks to the economic outlook remain tilted to the downside.
From the Fed’s backyard, Chair Powell indicated that the central bank was nearing the level of confidence required in declining inflation to commence interest rate cuts.
In addition, L. Mester (Cleveland) restated her belief that the Fed will have the capacity to reduce interest rates this year. However, she emphasized that there is currently no immediate need to take action. Finally, FOMC Governor M. Bowman remarked that the US economy has not reached a stage where the Fed should consider lowering interest rates. She emphasized that although the outlook leans towards declining inflation and eventual rate reductions, the possibility of implementing tighter monetary policy cannot be dismissed.
On the domestic calendar, Factory Orders in Germany contracted by 11.3% MoM in January. trade surplus widened to €27.5B in January, and Retail Sales in the euro area contracted by 1.0% in the year to January.
In the US, Initial Claims rose by 217K in the week to March 2 and the trade surplus widened to $67.4B in January.
EUR/USD's initial resistance level is the March high of 1.0944 (March 7). North from here emerges the weekly top of 1.0998 (January 5, 2011), which precedes the psychological 1.1000 mark. The breakout of this zone might pave the way for a challenge to the December 2023 peak of 1.1139 (December 27), which is reinforced by the 200-week SMA of 1.1147 and comes before the 2023 high of 1.1275 (July 18). On the contrary, the loss of the 200-day SMA of 1.0831 could open the door to a test of the weekly low of 1.0795 (February 29) prior to the 2024 low of 1.0694 (February 14). A subsequent loss might return to the weekly low of 1.0495 (October 13, 2023), followed by the 2023 low of 1.0448 (October 3), and the round level of 1.0400. The daily RSI climbed to the 67 zone.
Resistance levels: 1.0944 1.0998 1.1139 (4H chart)
Support levels: 1.0815 1.0795 1.0761 (4H chart)
USDJPY
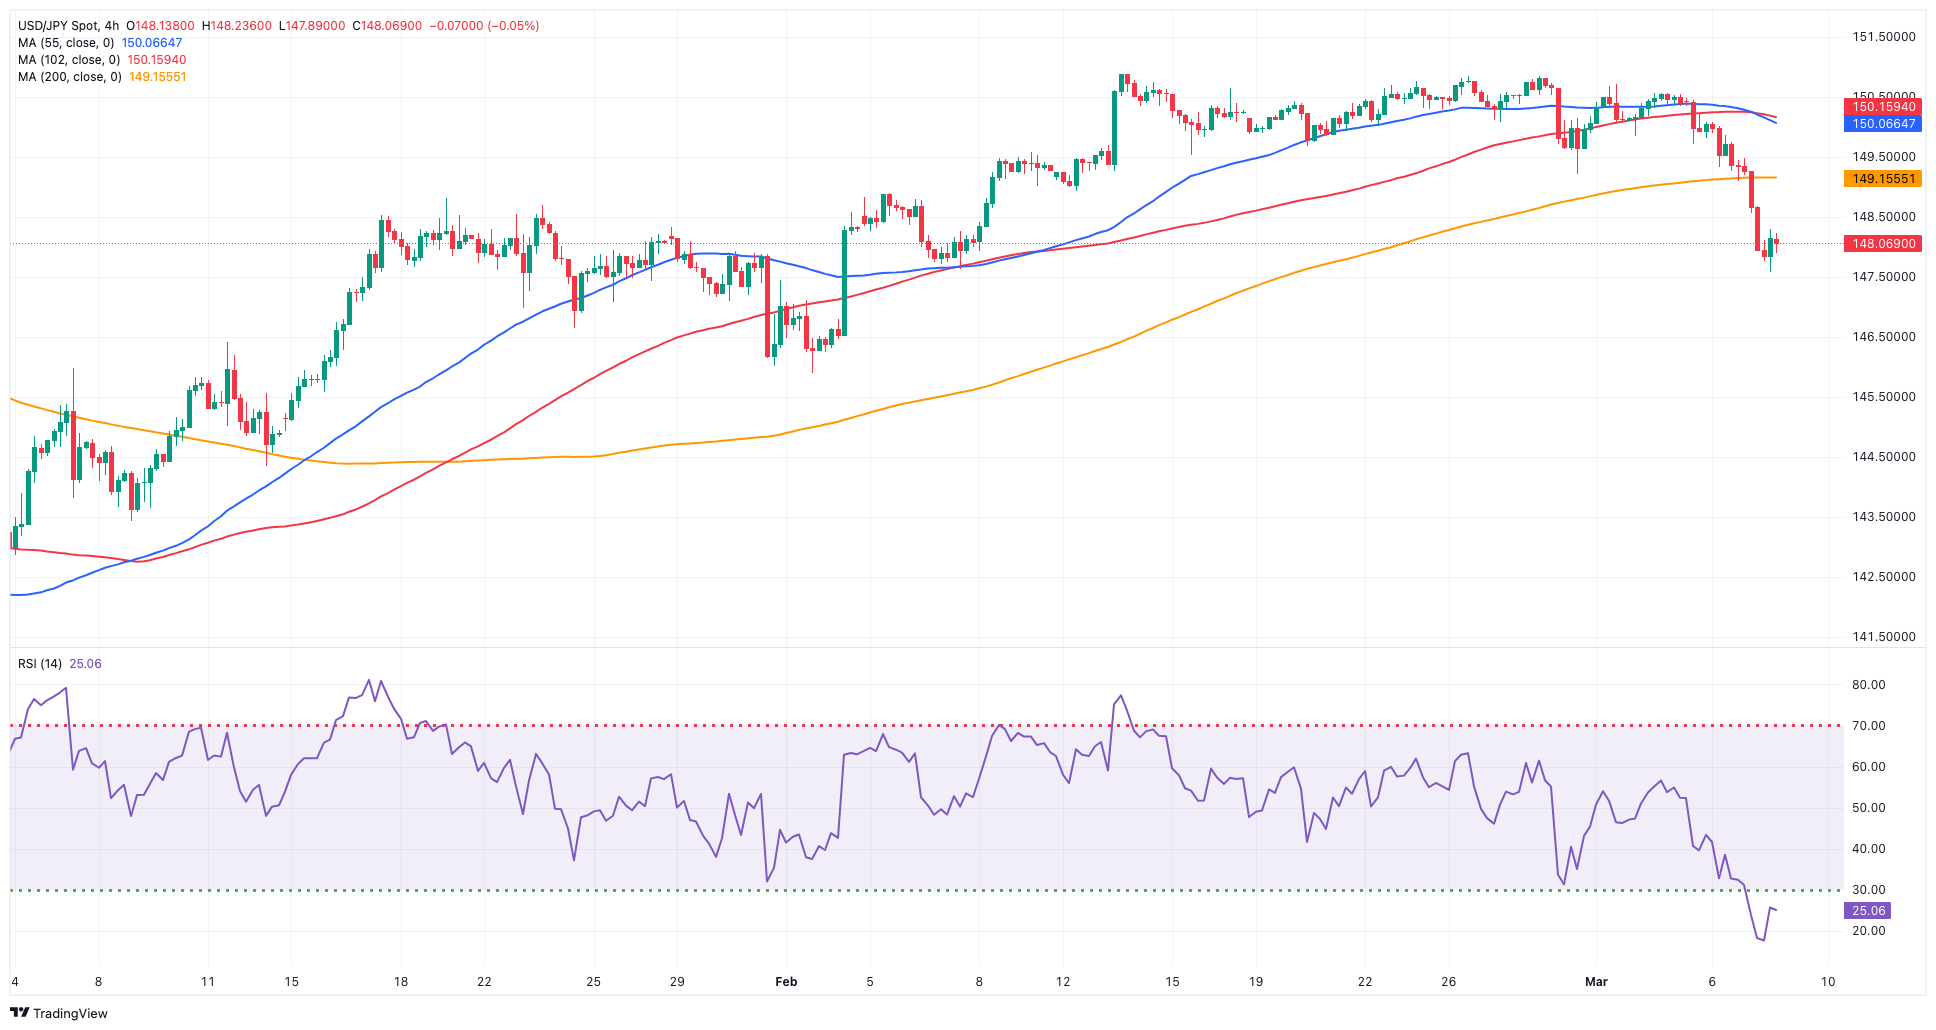
Another solid performance of the Japanese yen dragged USD/JPY to fresh five-week lows near the 147.60 region, down for the third straight session, on Thursday.
The sharp decline in the greenback and persistent weakness in US yields across the board lent extra legs to the pair’s bearish tone, while BoJ board member Nakagawa highlighted the increasing certainty of achieving the price goal and the growing likelihood of companies granting higher pay raises during the annual wage negotiations this spring.
In the meantime, recent advancements in wage and price growth have heightened expectations for the BoJ’s lift-off, which markets anticipate with nearly 80% probability at the March 18–19 meeting. These probabilities increase to 85% for the April 25–26 meeting and are fully priced in for the June 13–14 meeting.
In Japan, Foreign Bond Investment increased to ¥484.6B in the week to March 2.
If bears push harder, USD/JPY may retest its March low of 147.57 (March 7) before reaching the intermediate 55-day SMA of 147.29. Further south, the key 200-day SMA aligns at 146.11 before the February low of 145.89 (February 1). Once this zone is cleared, the pair should find support around the December 2023 low of 140.24 (December 28), before the round number 140.00, and the July low of 137.23 (July 14). The other way around, the immediate upside hurdle is the 2024 top of 150.88 (February 13), which precedes the 2023 peak of 151.90 (November 13). Up from here, the 2022 high of 151.94 (October 21) is soon followed by the round number of 152.00. The daily RSI retreated to the 40 region.
Resistance levels: 149.16 150.88 151.43 (4H chart)
Support levels: 147.57 145.89 144.34 (4H chart)
GBPUSD
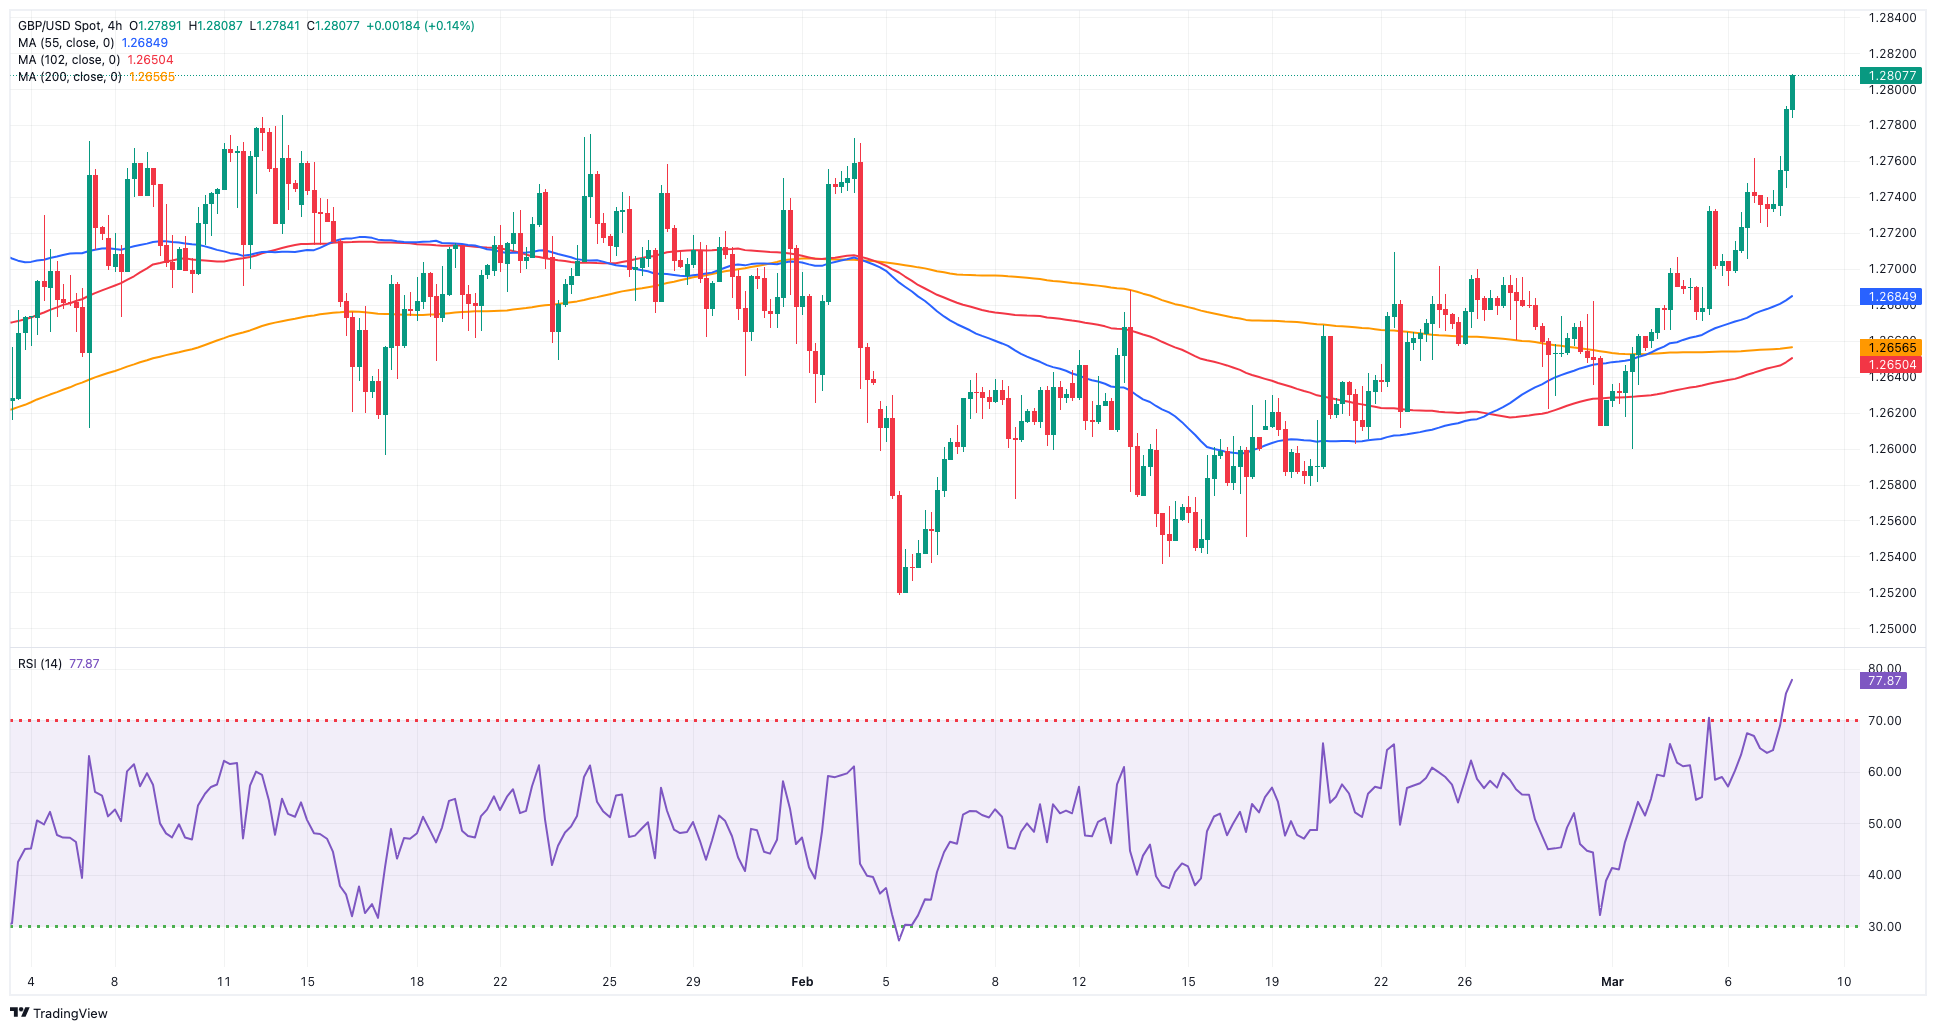
GBP/USD extended further its rally and rose to a new three-month peak just above 1.2800 the figure on Thursday.
The increasing selling interest in the greenback sponsored the fifth consecutive daily advance in Cable, which gained more than two cents since its monthly lows around the 1.2600 region (March 1).
Furthermore, extra gains in the British pound came amidst a lacklustre session in UK 10-year yields, which barely changed around the 4.10% zone.
There were no data releases in the UK docket on Thursday.
The next up-barrier for GBP/USD is the March top of 1.2808 (March 7) followed by the December peak of 1.2827 (December 28), and the weekly high of 1.2995 (July 27, 2023), all ahead of the critical 1.3000 level. In the opposite direction, bearish tendencies may initially bring the pair to the crucial 200-day SMA at 1.2579, seconded by the temporary 100-day SMA at 1.2563 and the 2024 low of 1.2518 (February 5). The failure of this level opens the door to the December 2023 low of 1.2500 (December 13), while a decline below the latter should find no significant support until the weekly low of 1.2187 (November 10, 2023). Down from here emerges the October 2023 low of 1.2037, followed by the critical 1.2000 barrier, and the 2023 low of 1.1802 (March 8). On the daily chart, the RSI rose to the proximity of the 68 level.
Resistance levels: 1.2808 1.2827 1.2995 (4H chart)
Support levels: 1.2655 1.2599 1.2579 (4H chart)
GOLD
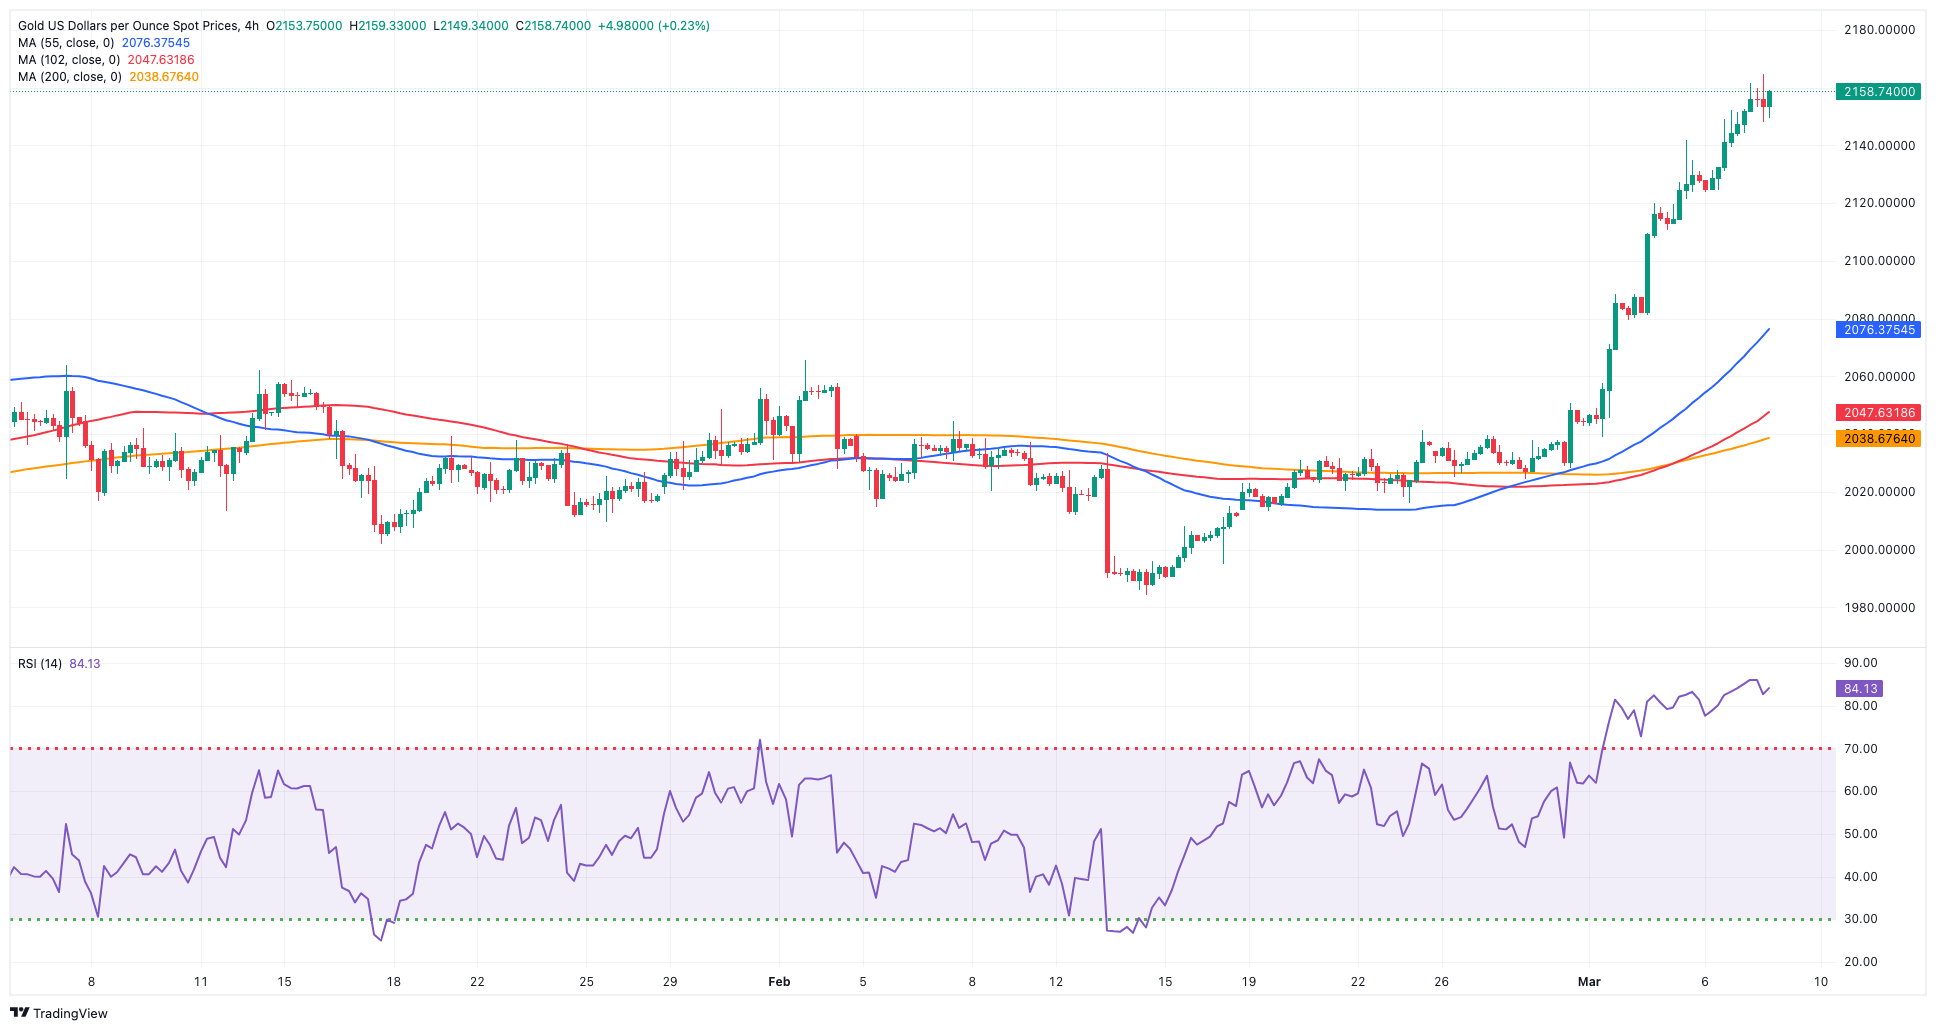
Thursday saw another remarkable surge in gold prices, reaching an all-time peak above the $2,160 mark per troy ounce.
The notable uptick in the value of the precious metal was propelled by persistent retracement in US yields across various maturity periods and intensified selling pressure on the dollar, always against a backdrop of mounting anticipations for a Fed rate cut in June.
Looking ahead, the sustained robust performance of gold is anticipated to face renewed volatility with the release of February's US Non-farm Payrolls on Friday.
Gold reached an all-time high of $2,164 on March 7. Just the opposite, the 55-day and 100-day SMAs of $2,041 and $2,020 should provide provisional support, followed by the 2024 low of $1,984 (February 14) and the December 2023 low of $1,973, which is supported by its proximity to the critical 200-day SMA of $1,971 and appears to be ahead of the November 2023 low of $1,931. A deeper drop may see bullion retest its October 2023 bottom of $1,810, which is ahead of the 2023 low of $1,804 and the critical $1,800 conflict zone.
Resistance levels: $2,164 (4H chart)
Support levels: $2,077 $2,039 $2,016 (4H chart)
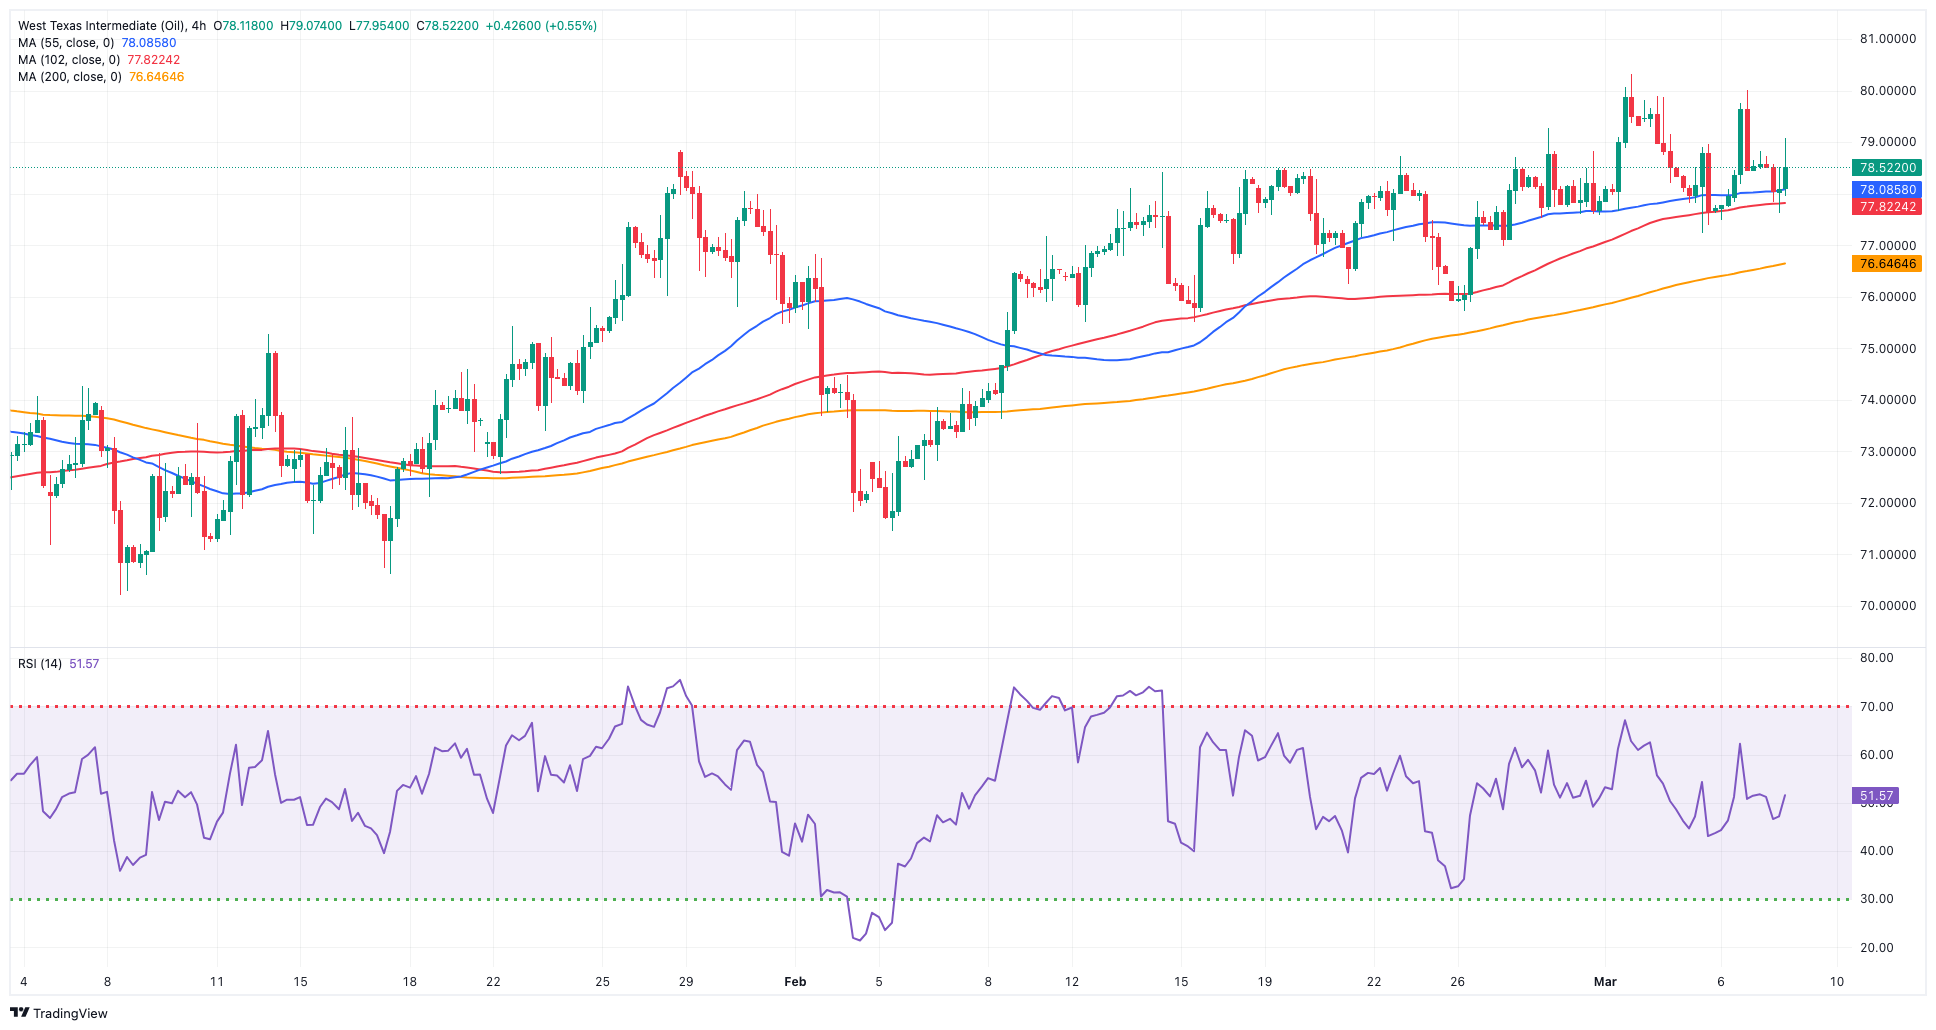
CRUDE WTI
Further consolidation left prices of the American reference for the sweet light crude oil hovering around the $79.00 mark per barrel, down slightly on Thursday.
Price action in the commodity came amidst positive results from the Chinese trade balance, increasing crude oil imports in China, and some speculation that the Fwd might delay the start of its easing cycle.
Additionally, the recent weekly decline in US weekly distillate stocks (-4.131M barrels) and gasoline inventories (-4.460M barrels) also limited the downside in prices, along with the extension of voluntary oil production cuts by the OPEC+ and omnipresent geopolitical concerns from the Middle East and the Red Sea.
The next upward challenge for WTI is the 2024 high of $80.82 (March 1), which precedes the weekly top of $89.83 (October 18, 2023) and the 2023 peak of $94.99 (September 28, 2023). Further north, the August 30 high of $97.65 looks to be ahead of the psychological $100.00 threshold. Having said that, the 100-day and 55-day SMAs should give interim support at $76.21 and $75.23, respectively, before falling to their February lows of $71.43 (February 5). Extra losses reveal the critical $70.00 milestone prior to the 2024 low of $69.31 (January 3).
Resistance levels: $80.82 $83.56 $85.85 (4H chart)
Support levels: $77.49 $75.81 $71.37 (4H chart)
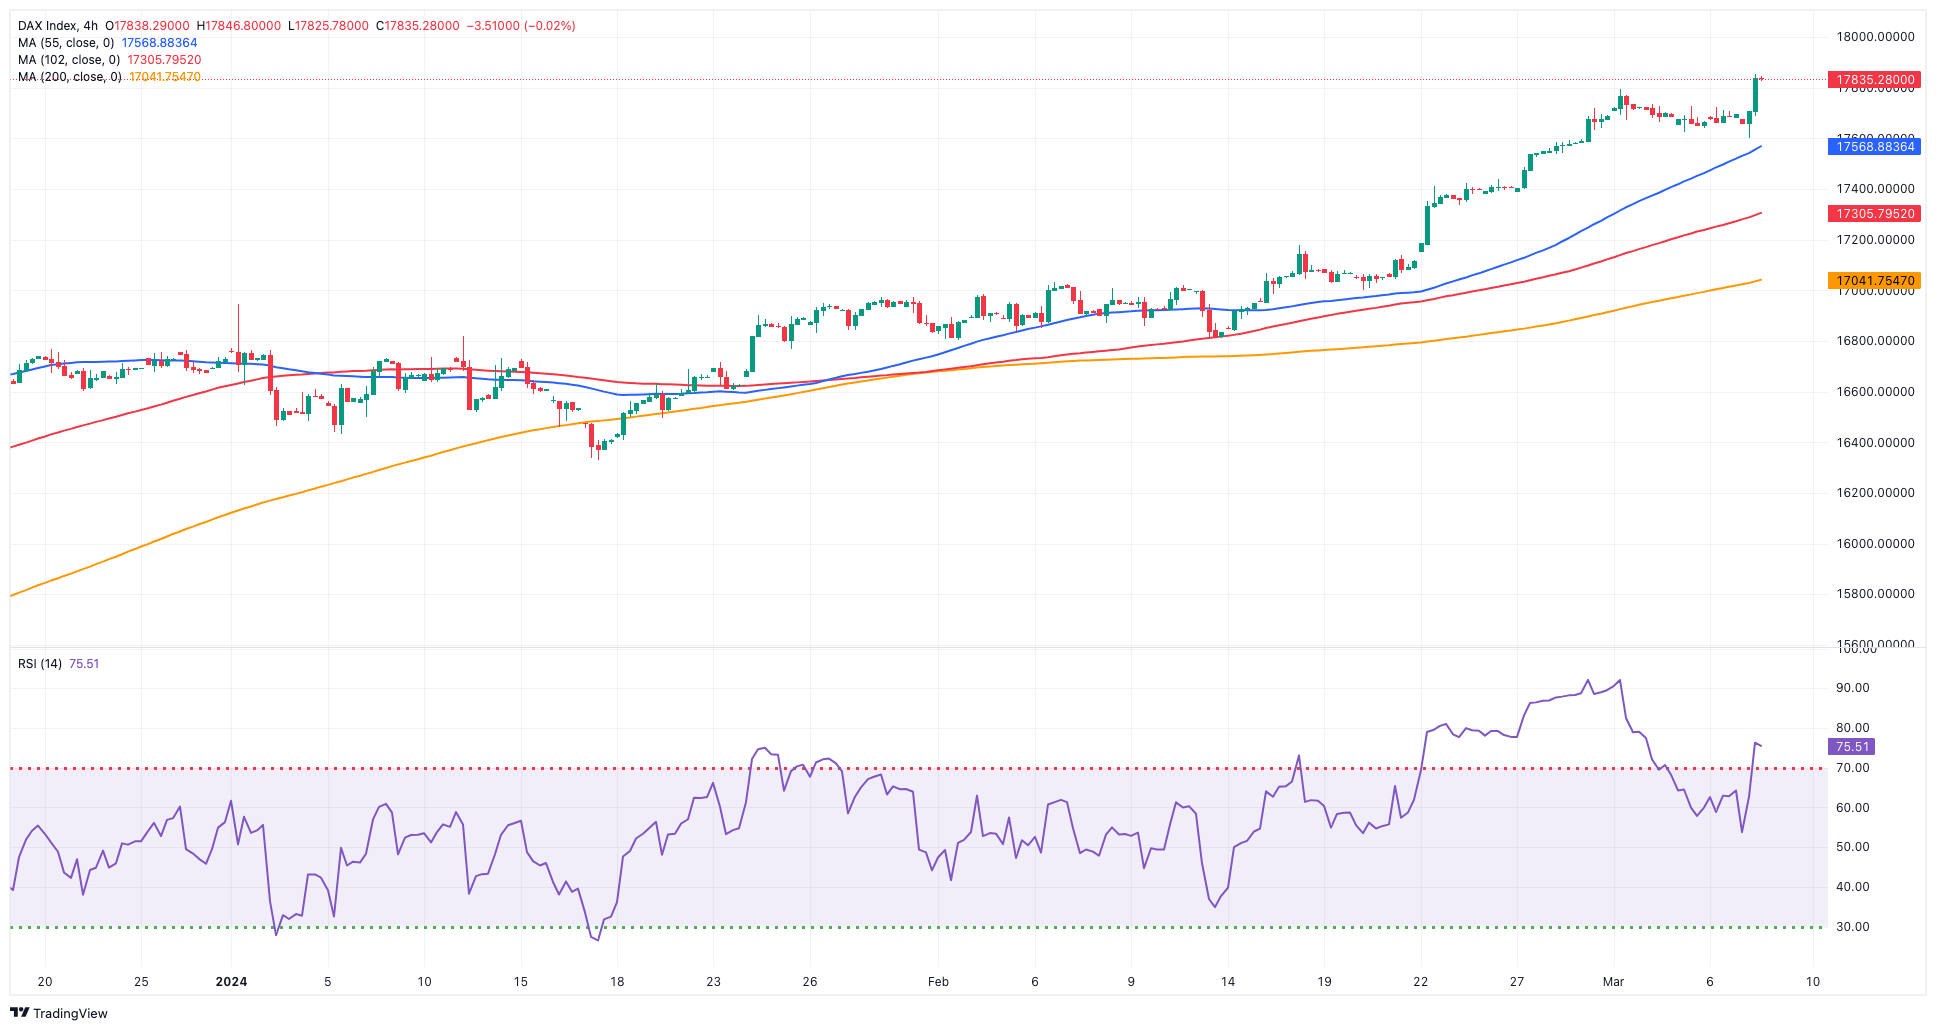
GER40
Another day, another all-time high in the DAX40.
In fact, Germany’s benchmark stock index advanced to the 17,900 level, bolstered by broad risk-on sentiment, all after the ECB left its policy rates unchanged and signalled lower inflation in the months to come while maintaining its view that risks to the economic outlook kept pointing to the downside.
Along with the move higher in European stock indices, 10-year bund yields resumed their downward bias and revisited the 2.25% zone, or multi-week lows.
The next up-barrier for the DAX40 is its record high of 17,879 (March 7). On the other hand, the 55-day SMA at 16,966 should provide temporary support just before the February low of 16,821 (February 1). The breach of this zone might bring back into focus the 2024 bottom at 16,345 (January 17), which is near the crucial 200-day SMA at 16,113 and ahead of the weekly low at 15,915 (November 28). The low for October 2023 is 14,630 (October 23), seconded by 14,458 (March 20). The daily RSI rose past 79, indicating that the market remained significantly overbought.
Best Performers: Symrise AG, Zalando SE, BASF
Worst Performers: Deutsche Post, Fresenius SE, Vonovia
Resistance levels: 17,879 (4H chart)
Support levels: 17,381 16,831 16,345 (4H chart)
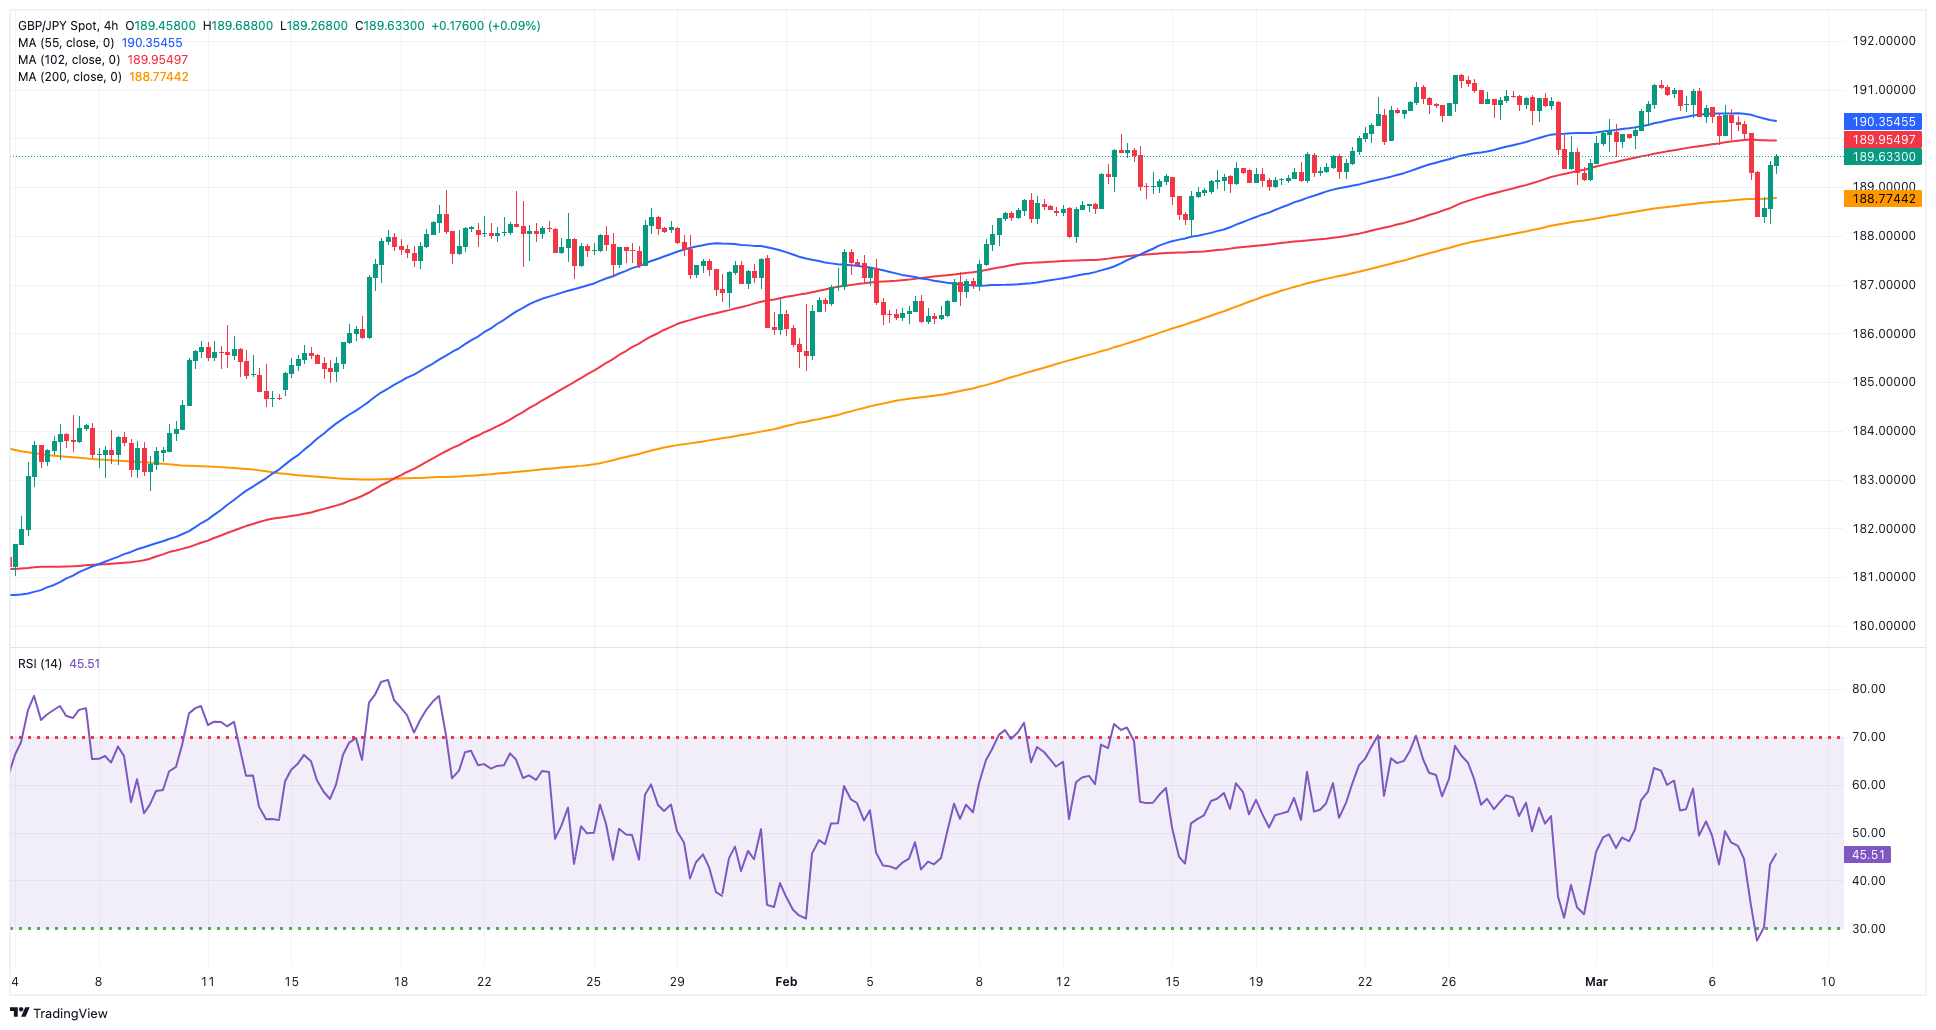
GBPJPY
GBP/JPY dropped for the third consecutive session and retested the area of three-week lows near 188.20 on Thursday.
The continuation of the leg lower in the cross came in response to the firm upside momentum in the Japanese yen, which somehow offset the equally strong march north in the British pound, always amidst the prevailing risk-on mood.
Immediately to the downside for GBP/JPY comes the March low of 188.24 (March 7) prior to the interim 55-day and 100-day SMAs of 186.80 and 185.72, respectively. The breakdown of the latter exposes the February low of 185.22 (February 1). Ahead of the more important 200-day SMA at 183.78 and the December 2023 bottom of 178.33 (December 14). Further south emerges the October 2023 low of 178.03 (October 3), seconded by the July 2023 low of 176.30. On the upside, immediate resistance aligns at the 2024 high of 191.32 (February 26), followed by the August 2015 top of 195.28 (August 18) and the record peak of 195.88 (June 24, 2015). The daily RSI dropped to the 52 area on the daily chart.
Resistance levels: 191.19 191.32 195.28 (4H chart)
Support levels: 188.24 187.99 185.22 (4H chart)
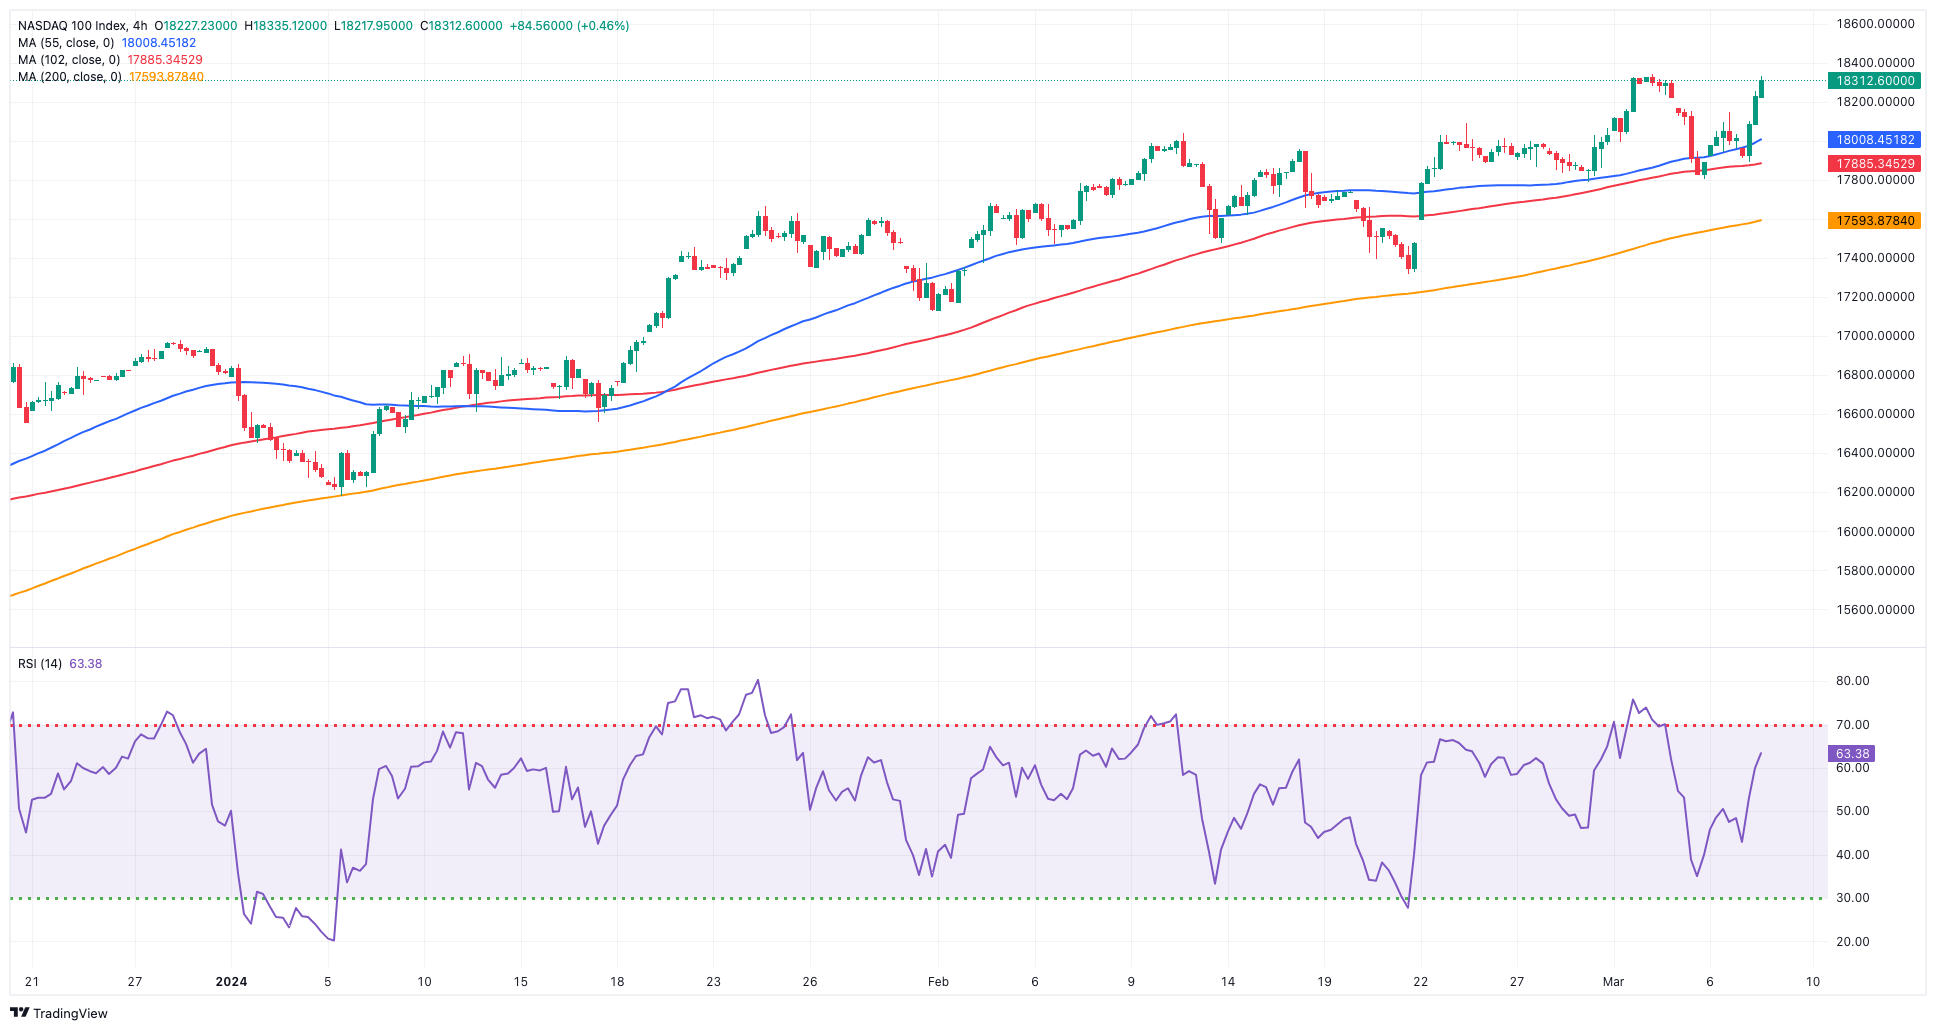
NASDAQ
The recovery in the US tech sector prompted the reference Nasdaq 100 to clock a record high past the 38,300 level on Thursday.
In fact, the index added to Wednesday’s uptick on the back of the dominating appetite for the risk-linked galaxy, while further expectation of the start of the Fed’s easing cycle in June bolstered the sentiment along with prospects of a “soft landing” of the US economy.
Further rises in the Nasdaq 100 might take it back to its all-time high of 18,337 (March 7). Just the opposite, the index may retest the transitory 55-day SMA of 17,340 prior to the weekly low of 17,319 (February 21), and another weekly low of 17,128 (January 31). A breach of the latter may lead to a test of the 2024 low of 16,249 (January 5), which is below the crucial 200-day SMA of 15,760 and the December 2023 low of 15,695 (December 4). Additional losses from here may test the October 2023 level of 14,058 (October 26), followed by the April 2023 low of 12,724 (April 25), the March 2023 low of 11,695 (March 13), and the 2023 low of 10,696 (January 3). The RSI on the daily chart advanced to the boundaries of 63.
Top Gainers: ON Semiconductor, Microchip, Qualcomm
Top Losers: CoStar, Amgen, CrowdStrike Holdings
Resistance levels: 18,337 (4H chart)
Support levels: 17,804 17,319 17,128 (4H chart)
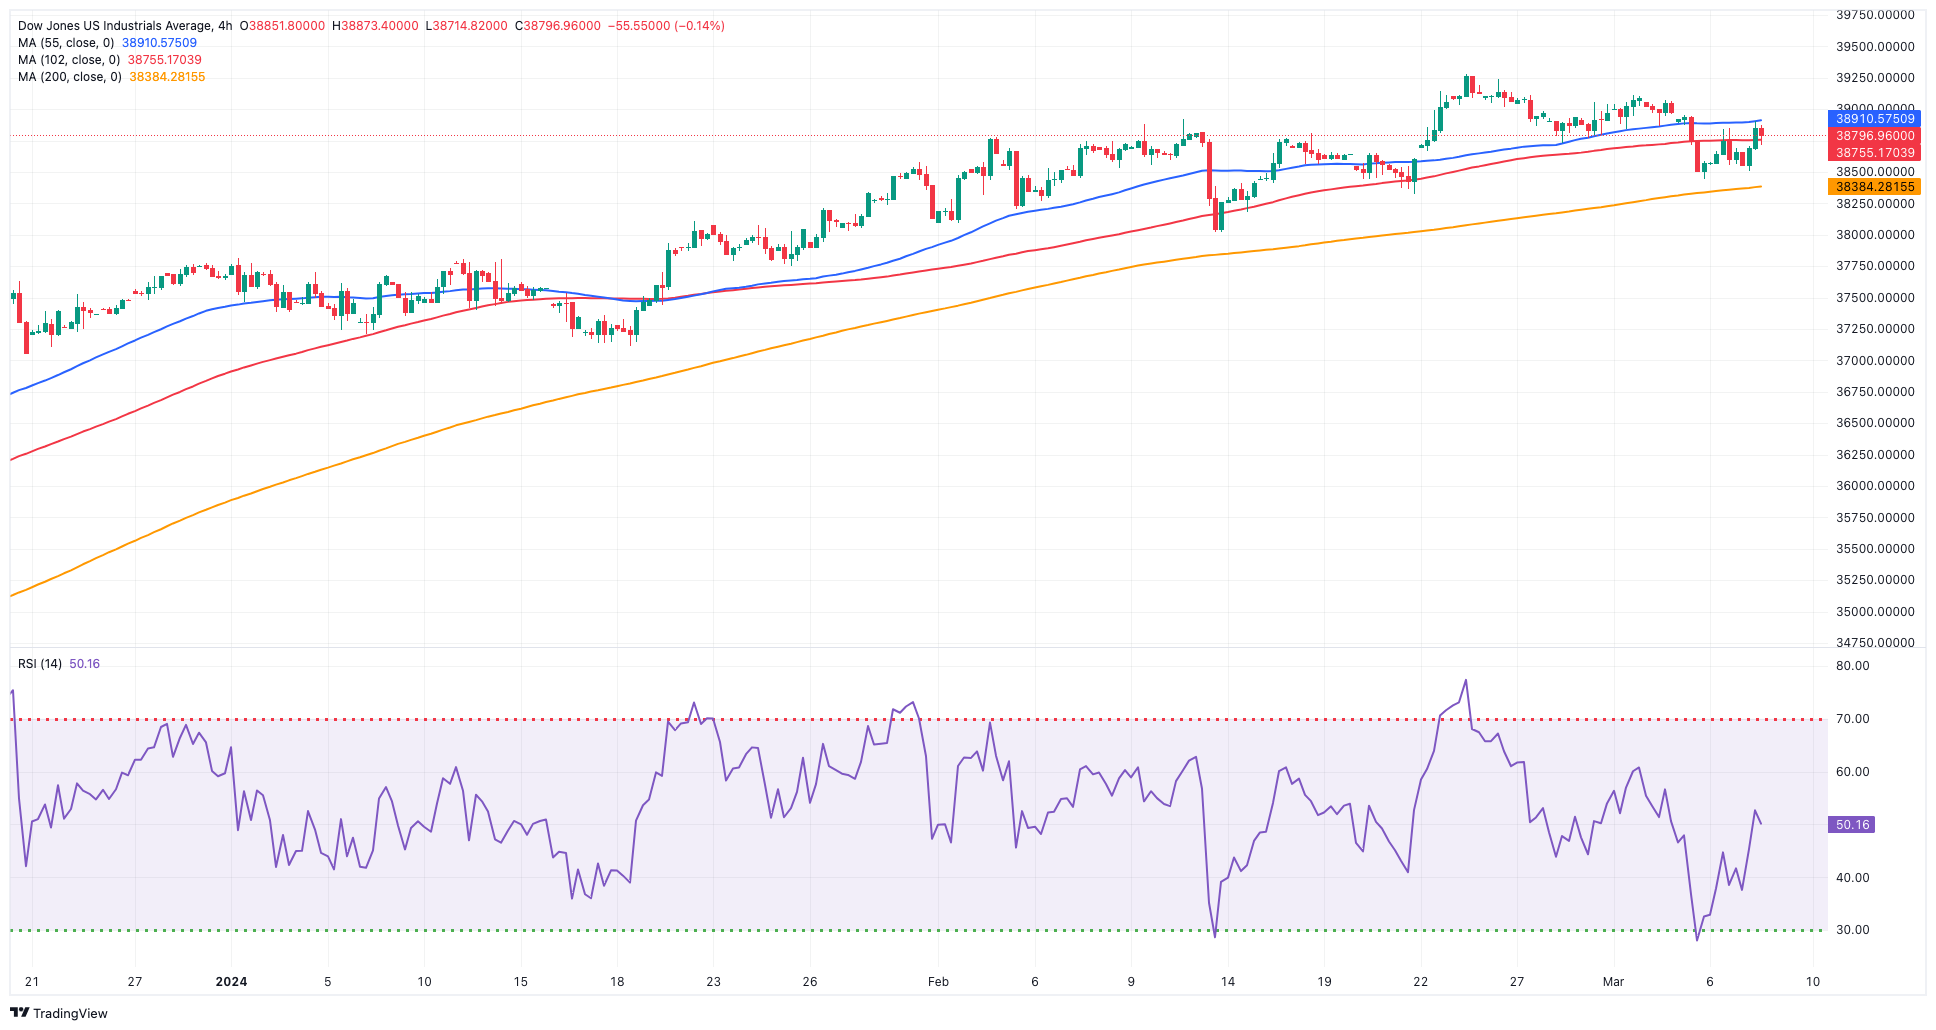
DOW JONES
US equities extended Wednesday’s rebound and lifted the benchmark Dow Jones to three-day highs just above the 38,900 level on Thursday.
The second daily advance in stocks came on the back of investors steady speculation of rate cuts by the Fed at its June gathering, while Chair Powell suggested that the Fed is approaching the necessary level of confidence in the decreasing inflation, which would pave the way for the initiation of interest rate cuts.
On Thursday, the Dow Jones gained 0.52% to 38,864, the S&P 500 rose 1.14% to 5,162, and the tech-centric Nasdaq Composite advanced 1.62% to 16,290.
If buyers push harder, the Dow Jones might confront its record high of 39,282 (February 23). On the flip side, the 55-day SMA of 38,163 serves as temporary support, followed by the 2024 low of 37,122 (January 18) and the weekly low of 37,073 (December 20, 2023). If the index falls below this level, it may encounter the 100-day SMA at 36,615, which precedes the 200-day SMA at 35,447. The weekly low of 33,859 (November 7, 2023) is followed by the lows of 32,327 (October 27) and 31,429 (March 15, 2023). The daily RSI rebounded past 56.
Top Performers: Intel, Amazon.com. American Express
Worst Performers: Amgen, Visa A, Verizon
Resistance levels: 39,282 (4H chart)
Support levels: 38,457 38,039 37,122 (4H chart)
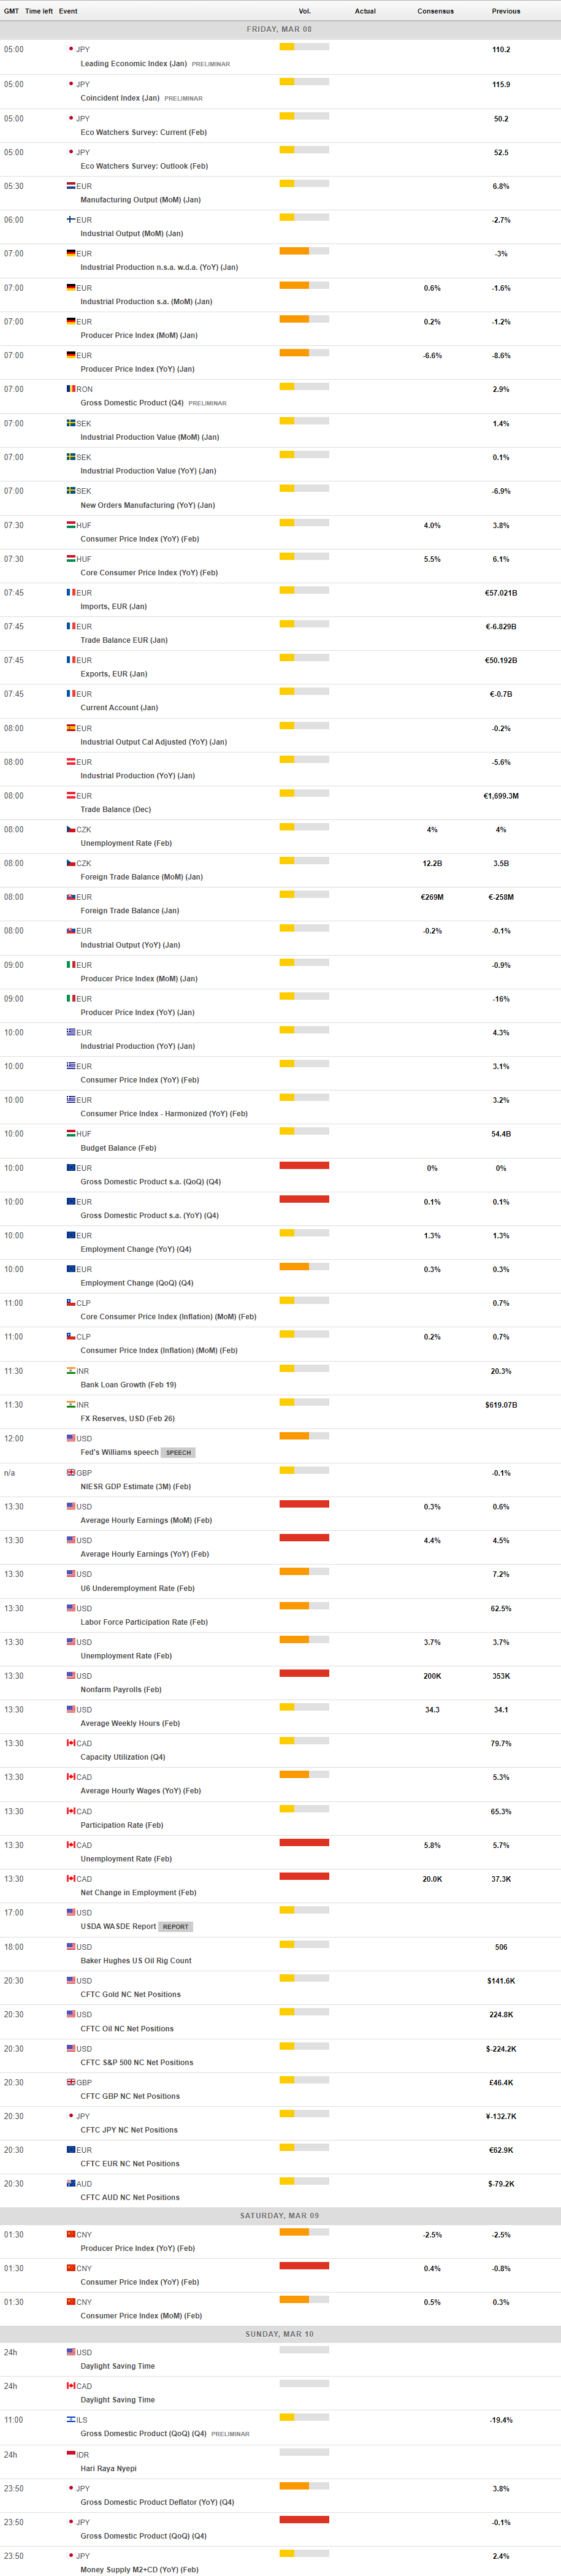
MACROECONOMIC EVENTS
All Information & Updates provided by:

All information relating to the financial markets available on this page has been prepared and issued by FXStreet (Forexstreet SL, Spain, Reg: B62498233) on the basis of publicly available information and all information believed to be reliable and does not conflict with Kuwaiti local laws, and all necessary care has been taken to before the company to ensure that the facts mentioned are correct from the source.
NCM Investment nor any of its directors or employees shall in any way be held responsible for the contents of this news, and the information contained on this page is intended only to provide clients with publicly available information and should not be construed as investment advice, report or analysis and/or constitute an offer or invitation to buy or sell financial instruments of any kind.
RISK WARNING: Forex and CFDs are highly risky leveraged products, as losses can exceed deposits. Please ensure you understand all the risks and take independent advice if necessary. NCM will segregate the clients based on the criteria of the regulator and its bylaws. NCM does not provide any advisory service; the material published does not constitute advice or a recommendation for a transaction in any financial instrument. NCM accepts no responsibility for any use of the content presented and any consequences of that use. Anyone acting on the information provided does so at their own risk.