
- Contact Us:
-

-

-

-


Daily Market Updates
11 Mar 2024
EURUSD
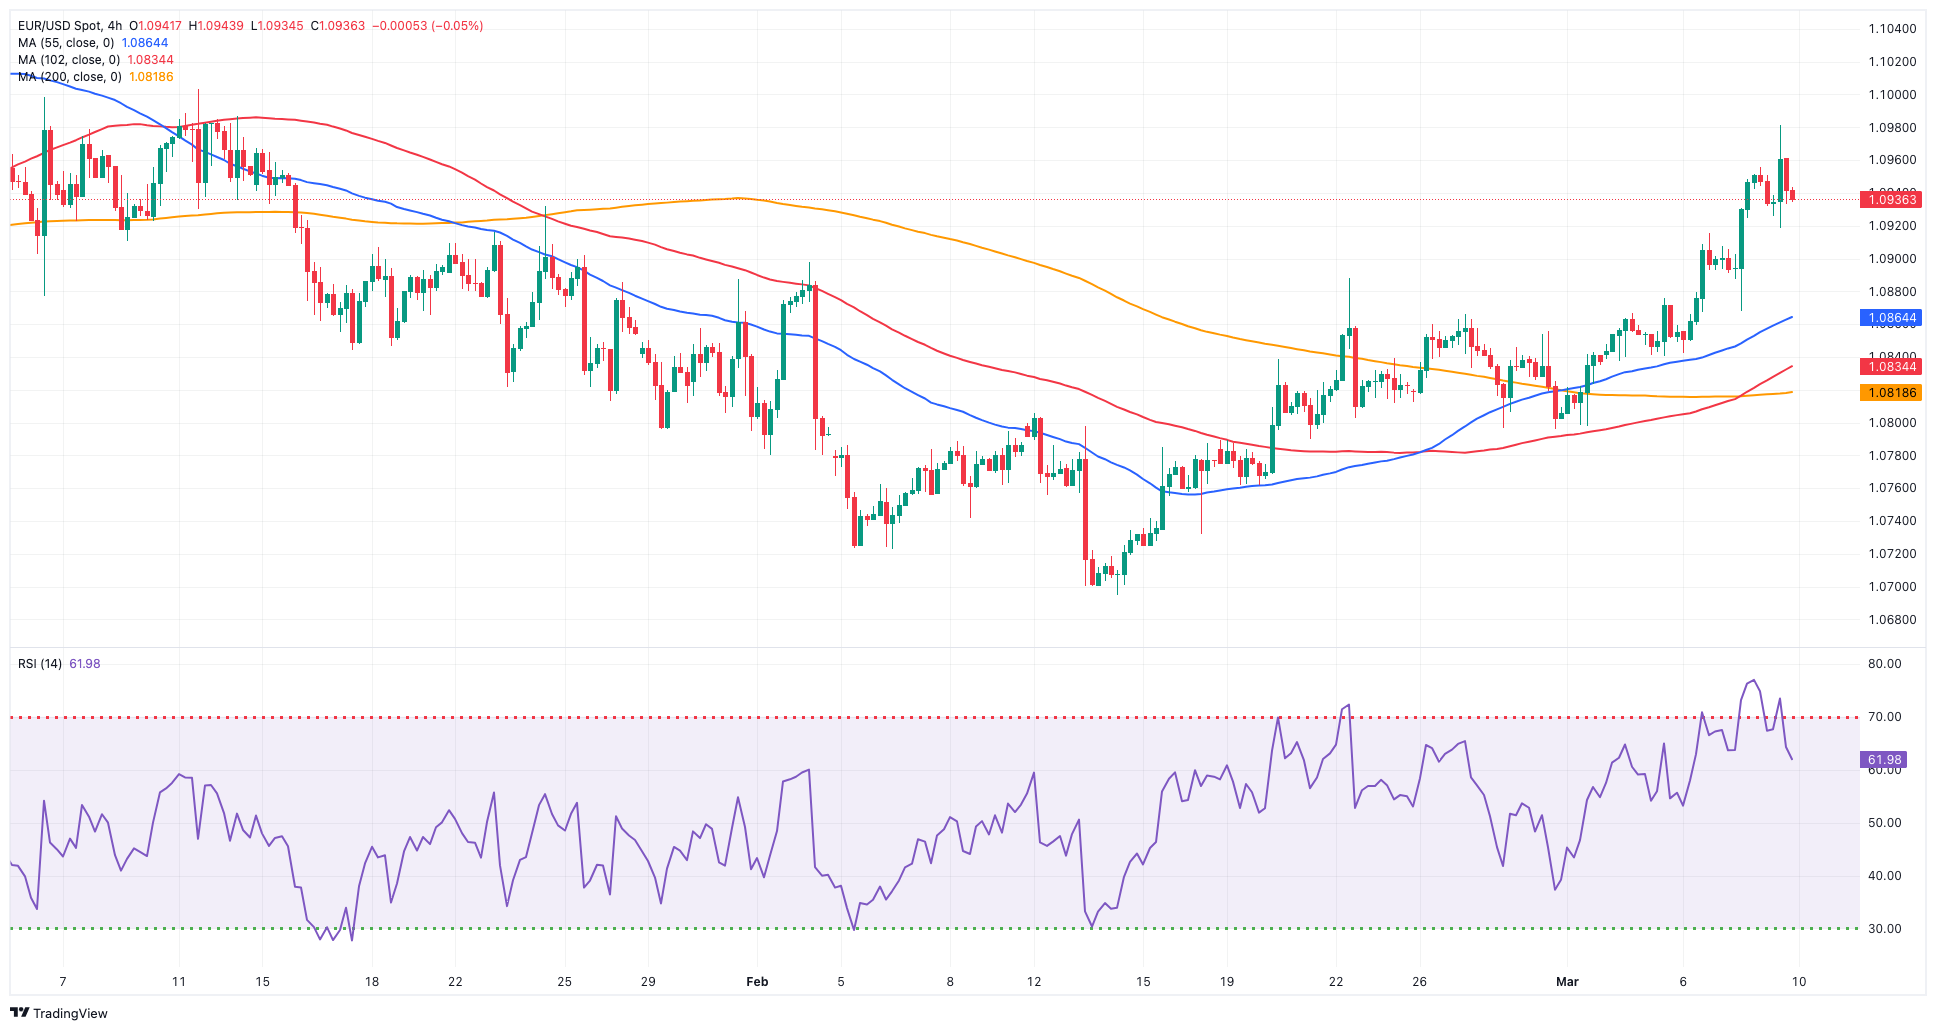
In quite a volatile end of the week, EUR/USD finished Friday’s session with marginal losses around the 1.0940 region. Despite the first daily pullback after five consecutive sessions of gains, the pair closed its third straight week in positive territory, opening the door at the same time to a potential visit to the 1.1000 hurdle sooner rather than later.
The strong weekly uptick in the pair came on the back of a deep corrective move in the greenback and US yields across the curve, all amidst firmer expectations of the start of the Fed’s easing cycle in June. This view is also shared by the ECB, and it gained traction following the bank’s event on Thursday, when it left the policy rates unchanged, as broadly anticipated.
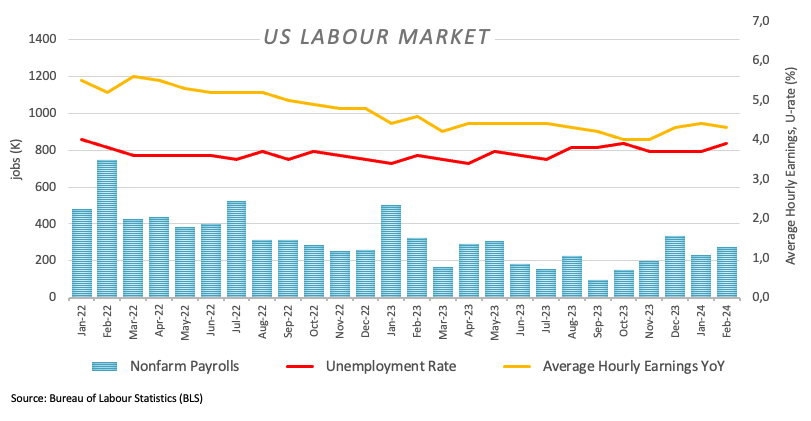
In addition, a mixed US labour market report contributed to the persistent sour mood in the buck after another solid print from Non-farm Payrolls showed the economy added 275K jobs in February, while the jobless rate rose to 3.9% and Average Hourly Earnings expanded by 4.3% from a year earlier.
Back to the domestic calendar, another revision saw the GDP Growth Rate in the euro bloc come in flat QoQ in Q4 and expand by 0.1% on a yearly basis. In Germany, Industrial Production expanded more than expected by 1.0% in January vs. the previous month.
The initial resistance level for EUR/USD is the March high of 1.0981 (March 7). North of here is the weekly top of 1.0998 (January 5, 2011), which comes before the psychological 1.1000 threshold. The breakout of this zone may pave the way for a challenge to the December 2023 peak of 1.1139 (December 27), which is supported by the 200-week SMA of 1.1147 and occurs before the 2023 high of 1.1275 (July 18). On the contrary, the loss of the 200-day SMA of 1.0833 might lead to a test of the weekly low of 1.0795 (February 29), which precedes the 2024 low of 1.0694 (February 14). A deeper decline might pave the way to a test of the weekly low of 1.0495 (October 13, 2023), then the 2023 low of 1.0448 (October 3), and the round level of 1.0400. The daily RSI deflated below the 65 level.
Resistance levels: 1.0981 1.0998 1.1139 (4H chart)
Support levels: 1.0867 1.0817 1.0795 (4H chart)
USDJPY
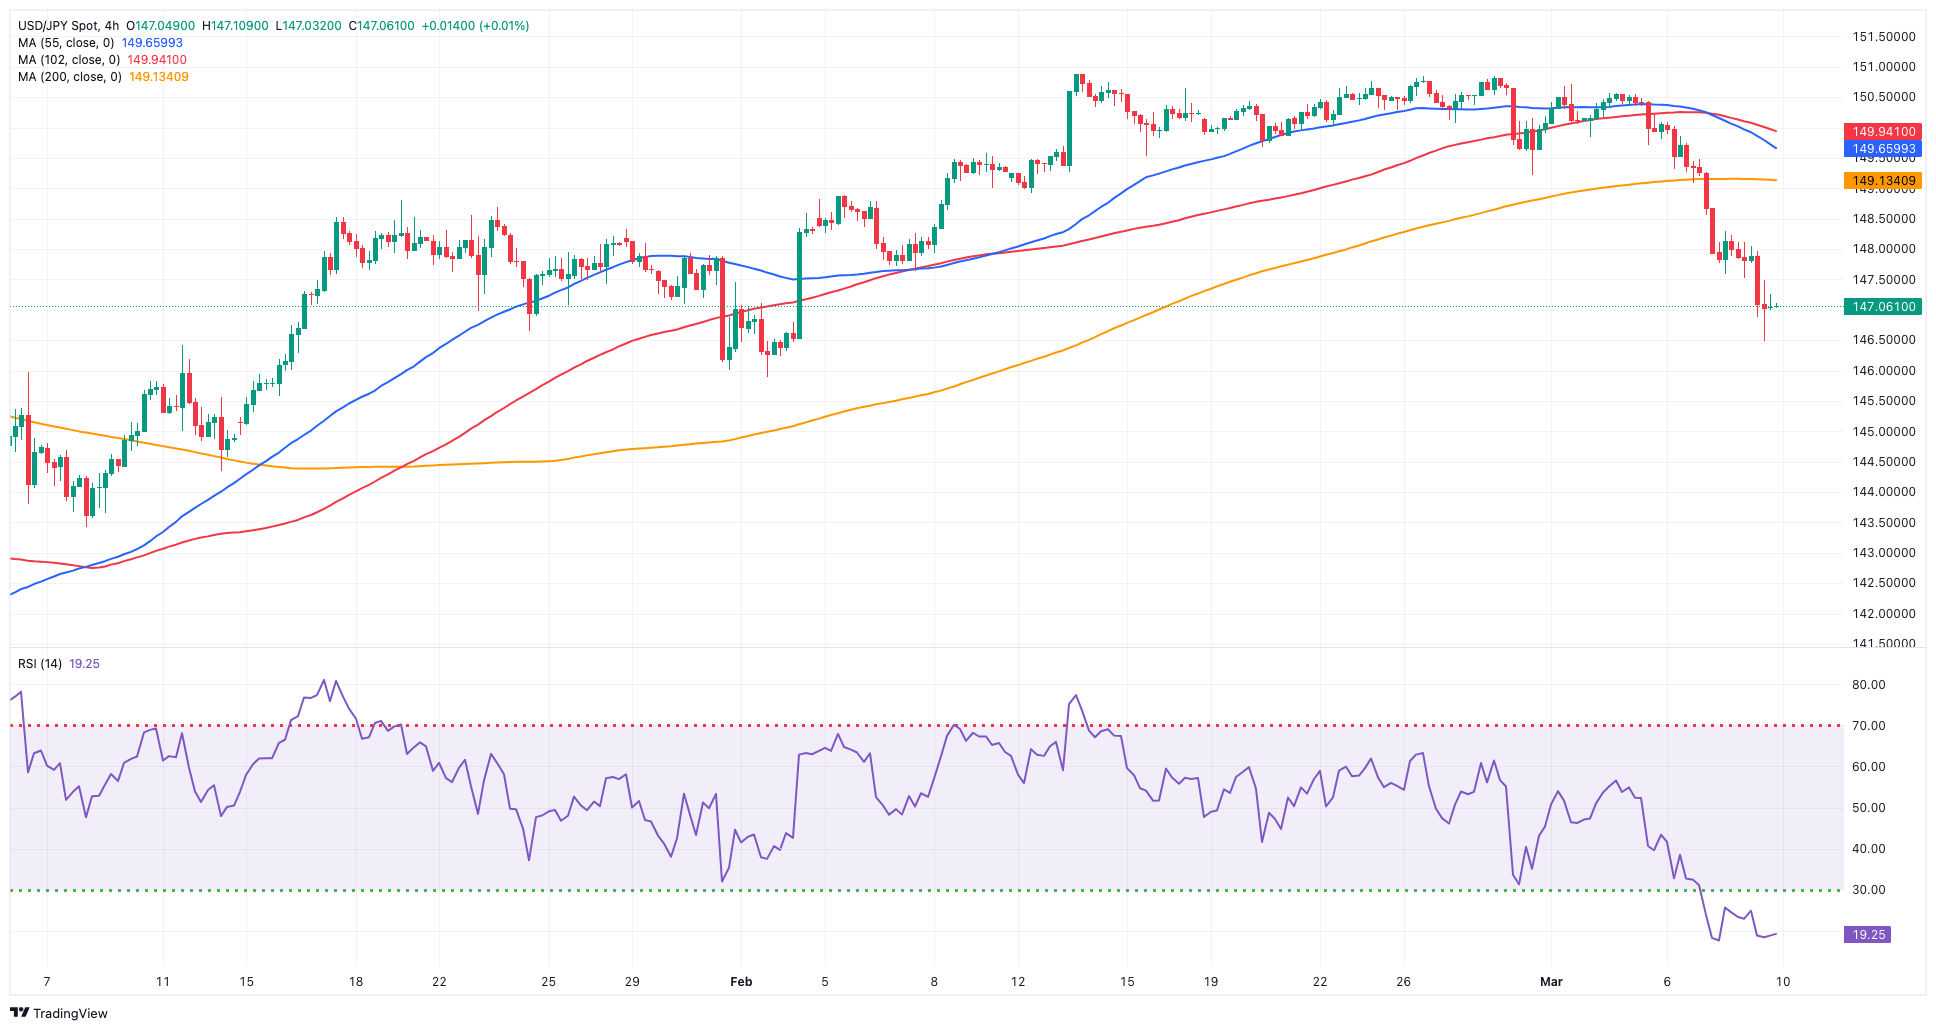
USD/JPY dropped for the fourth straight session, this time revisiting the area of five-week lows in the mid-146.00s while closing its second week in a row of losses.
The continuation of the upside momentum in the Japanese currency followed investors’ perception of a potential BoJ lift-off at the bank’s meeting later in the month. On this, the market now anticipates an exit of the current ultra-accommodative stance probability of over 66% at the March 18–19 meeting. These odds climb to nearly 80% by April 25–26 and are fully priced in by June 13–14. Despite mounting wage and price pressures, it appears premature for the bank to consider raising rates before the results of the spring wage negotiations are revealed.
Also collaborating with the buying pressure in the yen appeared Thursday’s comments from BoJ’s Nakagawa, who emphasized the mounting confidence in reaching the inflation target and the increasing probability of companies granting more significant wage increases during the upcoming annual wage negotiations in the spring.
Additionally, the substantial drop in the dollar and the ongoing weakness in US yields further reinforced the bearish sentiment of the pair.
In the domestic docket, Household Spending shrank by 6.3% in the year to January, Bank Lending increased by 3% YoY in February, the preliminary prints of the Coincident Index and the Leading Economic Index came in at 110.2 and 109.9, respectively, and finally, the release of the Eco Watchers Survey Current improved to 51.3 and the Eco Watchers Survey Outlook ticked higher to 53, both prints for the month of February.
If bears apply further pressure, USD/JPY may retest the key 200-day SMA at 146.15, prior to the February low of 145.89 (February 1). Once this zone is cleared, the pair should find support at the December 2023 low of 140.24 (December 28), which precedes the round number 140.00, and the July low of 137.23 (July 14). In the other direction, the immediate upside obstacle is the 2024 high of 150.88 (February 13), which comes before the 2023 high of 151.90 (November 13). Up from here, the 2022 high of 151.94 (October 21) is quickly followed by the round number 152.00. The daily RSI plummeted to the sub-35 area.
Resistance levels: 149.14 150.88 151.43 (4H chart)
Support levels: 146.47 145.89 144.34 (4H chart)
GBPUSD
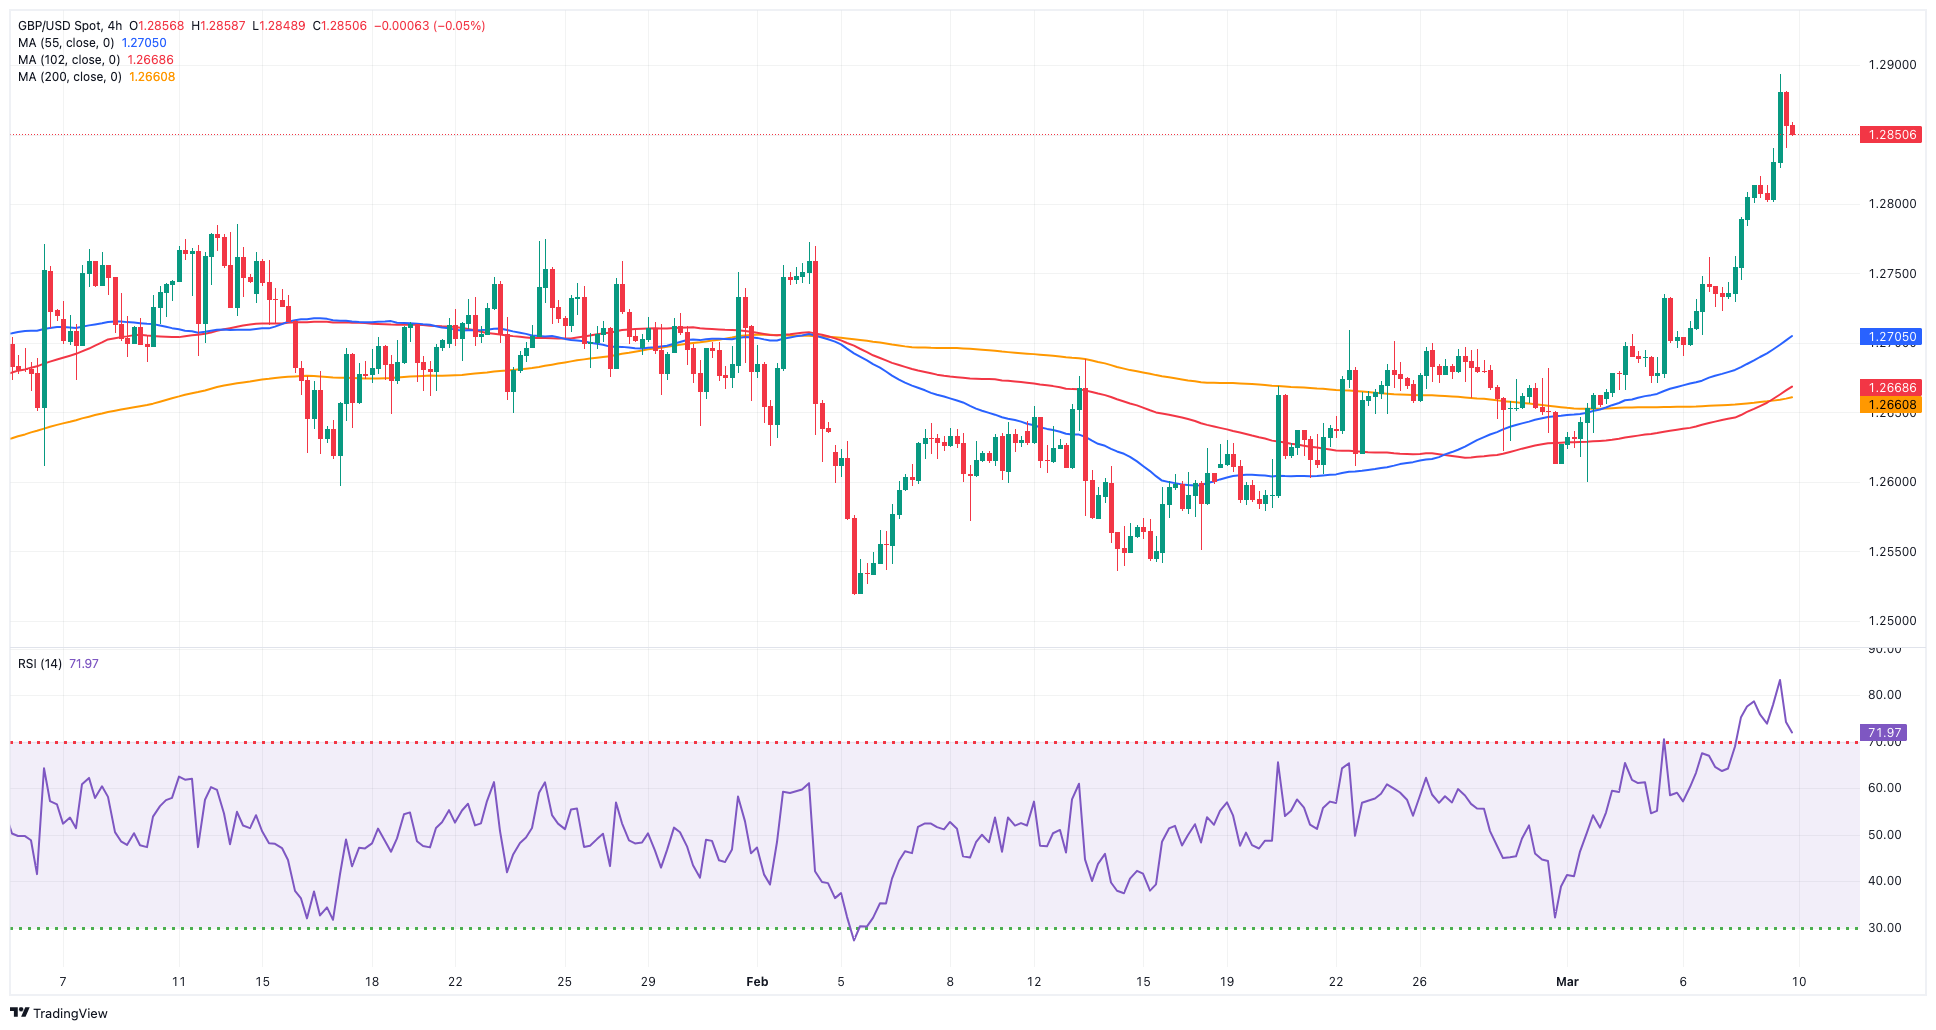
The British pound extended further its monthly rally, prompting GBP/USD to advance to fresh eight-month highs in the boundaries of 1.2900 the figure on Friday. It is worth noting that Cable closed with gains in every session of the month so far.
The still-unabated march north in the pair came on the back of the persevering selling pressure in the greenback, while investors appear to have already fully priced in a rate cut at the Fed’s June 12 event.
The daily uptick in spot also came in tandem with further consolidation of 10-year gilt yields just below the key 4.00% level.
The UK calendar was empty at the end of the week.
The next upward hurdle for GBP/USD is the 2024 high of 1.2893 (March 8), followed by the weekly top of 1.2995 (July 27, 2023), and the important 1.3000 threshold. In the opposite direction, bearish trends may initially drive the pair to the provisional 55-day SMA at 1.2680 prior to the March low of 1.2599 (March 1) and the significant 200-day SMA at 1.2581. The loss of this region could put the 2024 low of 1.2518 (February 5) back on the radar prior to the December 2023 low of 1.2500 (December 13). Down from here comes the weekly low of 1.2187 (November 10, 2023) ahead of the October 2023 bottom of 1.2037, the crucial 1.2000 barrier and the 2023 low of 1.1802 (March 8). On the daily chart, the RSI entered the overbought zone past 71.
Resistance levels: 1.2893 1.2995 1.3142 (4H chart)
Support levels: 1.2659 1.2599 1.2579 (4H chart)
GOLD
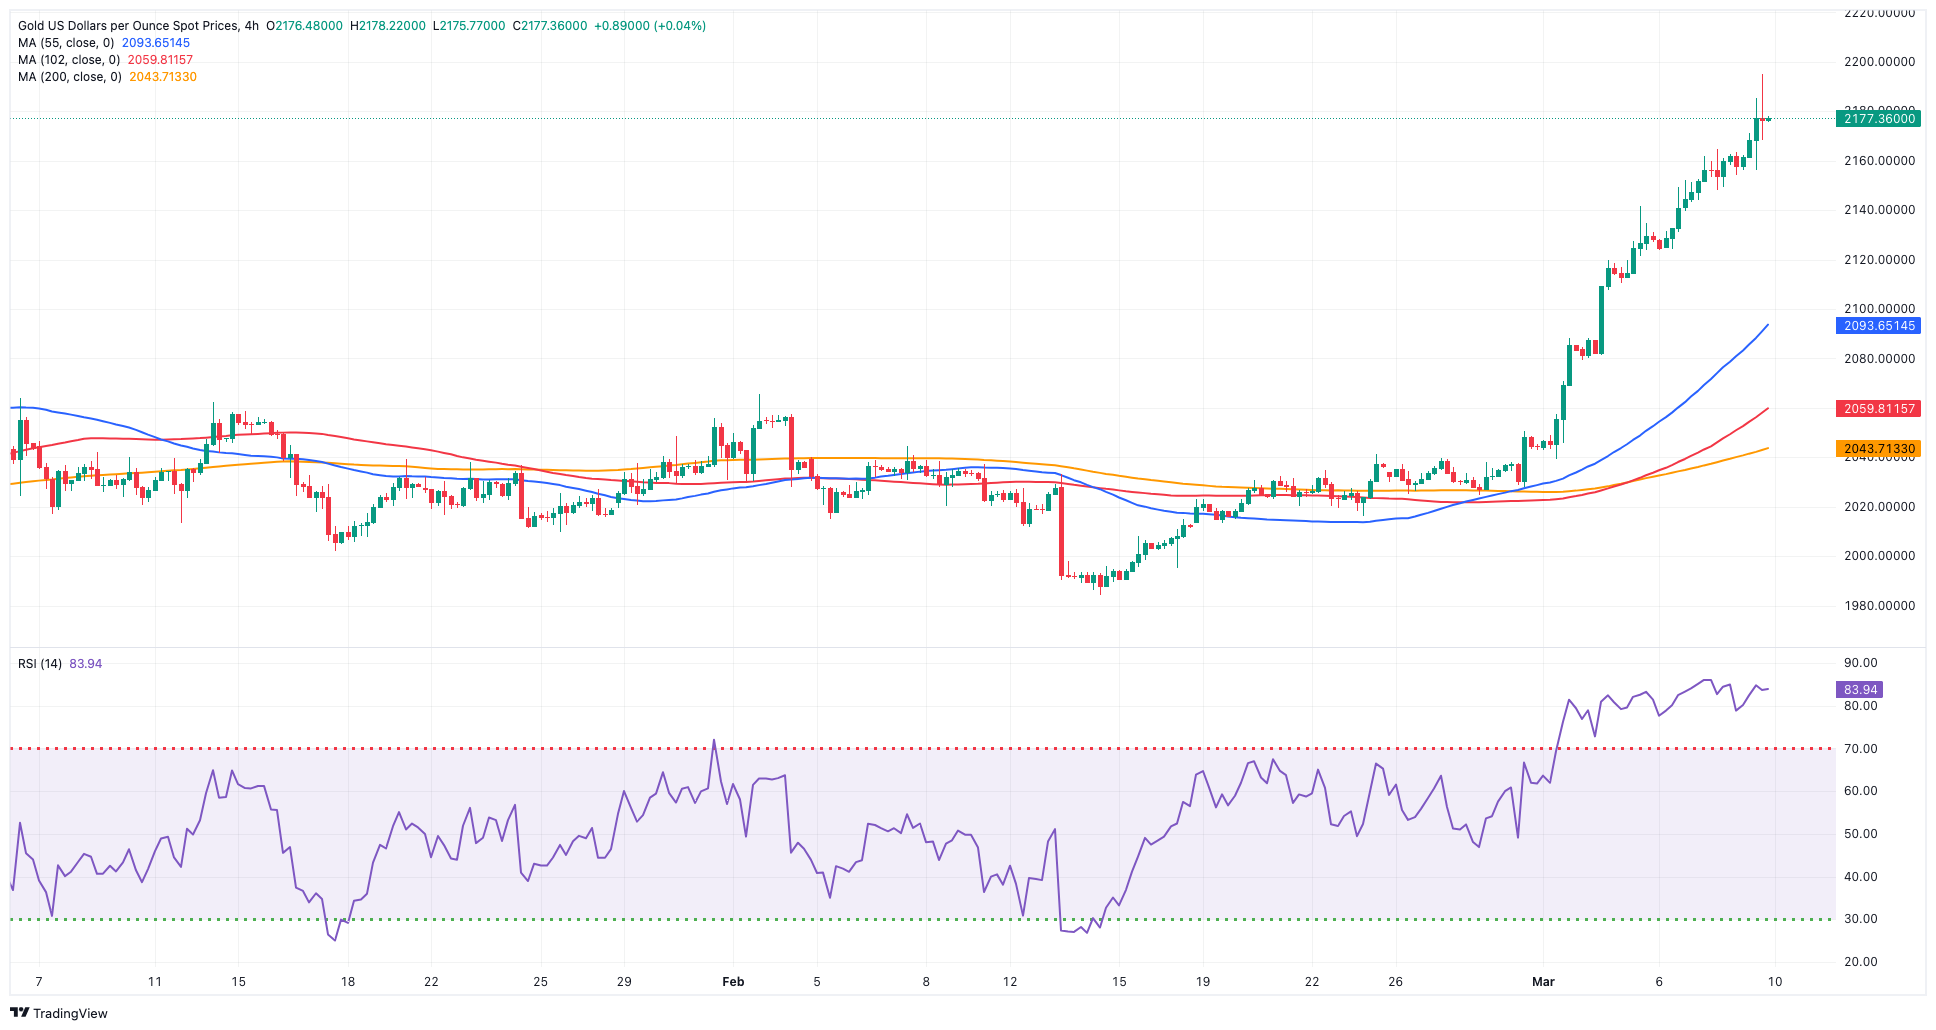
Another day, another record high in gold prices.
In fact, the yellow metal this time advanced past the $2,190 mark per troy ounce, approaching the $2,200 level against the backdrop of unabated weakness in both the dollar and US yields across different timeframes.
The sharp improvement in the precious metal, which closed with gains in all of the sessions so far this month, came amidst broader expectations of the Fed’s interest rate cut early in the summer, a view that remained propped up by the Fed’s rate setters as well as Chair Powell.
Gold hit an all-time high of $2,193 on March 8. On the contrary, the 55-day and 100-day SMAs of $2,044 and $2,022 should provide interim support, seconded by the 2024 low of $1,984 (February 14) and the December 2023 low of $1,973, which is supported by its proximity to the critical 200-day SMA of $1,972 and comes ahead of the November 2023 low of $1,931. The breach of the latter may see bullion retest its October 2023 low of $1,810, which is above the 2023 low of $1,804 and the important $1,800 conflict zone.
Resistance levels: $2,195 (4H chart)
Support levels: $2,092 $2,043 $2,016 (4H chart)
CRUDE WTI
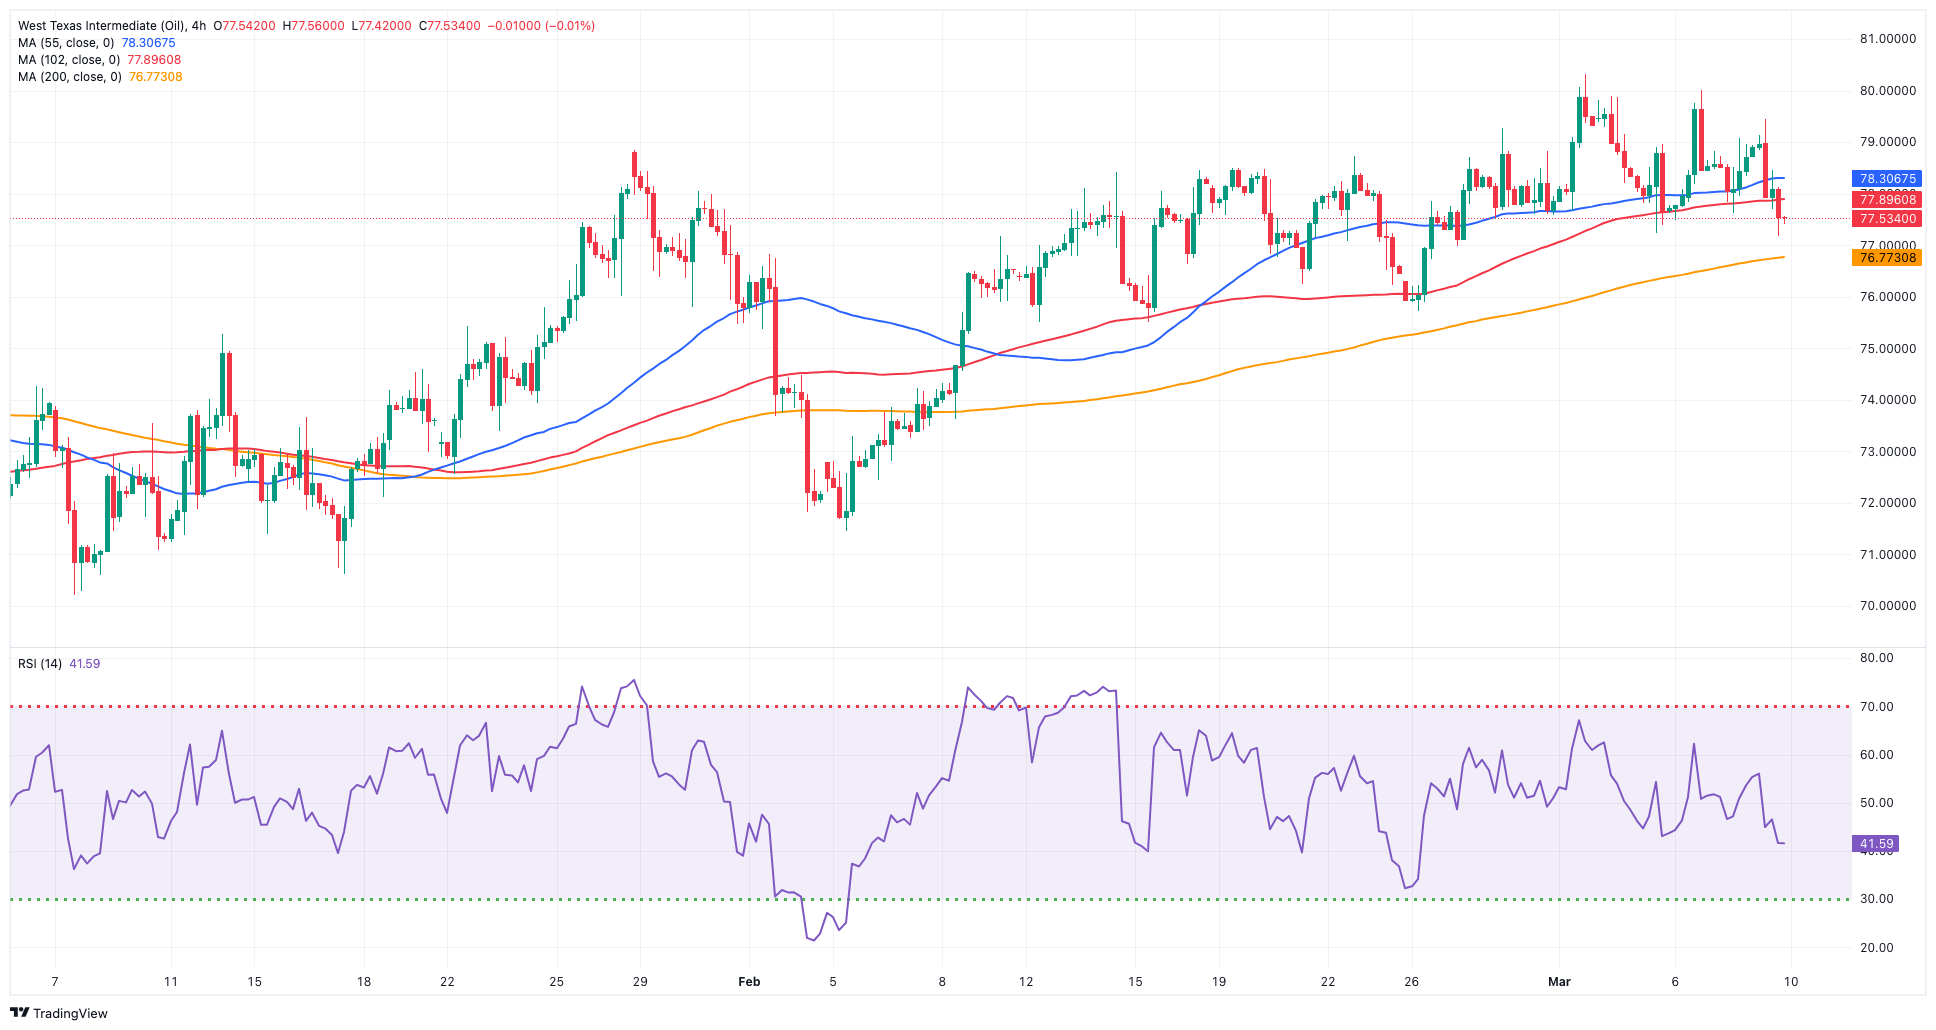
WTI prices faded after two consecutive sessions of gains and retreated to the $78.00 region per barrel at the end of the week. On the weekly chart, crude oil reversed the previous advance and ended the week with marked losses.
Despite the relatively constrained supply of oil due to OPEC's production cuts and Russian export sanctions, crude oil prices retreated markedly at the end of the week in response to ongoing worries about sluggish demand from China and the awaited surge in demand during the US driving season.
Closing the weekly calendar, driller Baker Hughes said the US total active oil rigs dropped by 2 to 504 in the week ended on March 8.
The next upward challenge for WTI is the 2024 high of $80.82 (March 1), which comes before the weekly top of $89.83 (October 18, 2023) and the 2023 peak of $94.99 (September 28, 2023). Further north, the August 30 high of $97.65 appears to be over the psychological $100.00 mark. Having said that, the 100-day and 55-day SMAs should provide transitory contention at $76.11 and $75.32, respectively, before sliding to February lows of $71.43 (February 5). Extra losses highlight the important $70.00 milestone before the 2024 bottom of $69.31 (January 3).
Resistance levels: $80.82 $83.56 $85.85 (4H chart)
Support levels: $77.49 $75.81 $71.37 (4H chart)
GER40
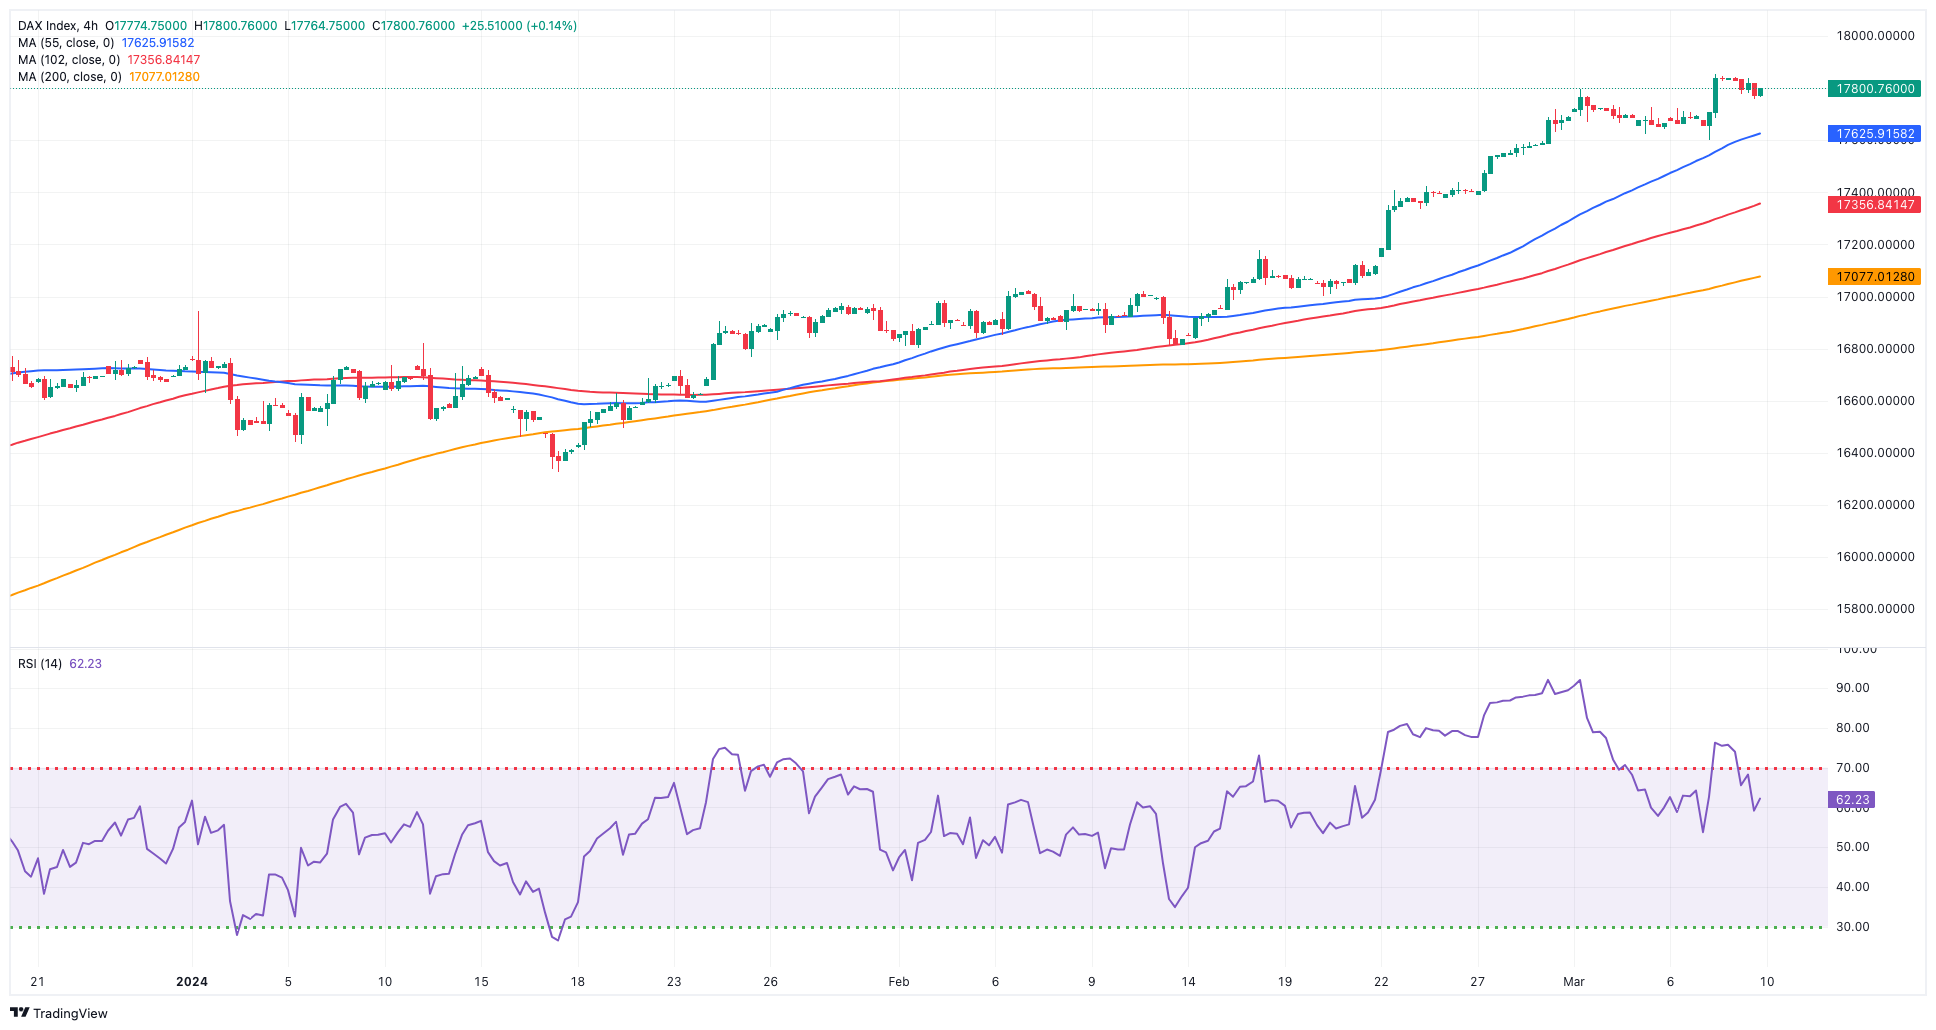
Germany’s stock benchmark DAX40 took a breather on Friday and eased modestly after hitting an all-time high in the previous session.
The small knee-jerk in the index came amidst increasing bets that the ECB could reduce its policy rates in June, while some rate setters were even hinting at the likelihood of an extra rate cut in July.
The above remained underpinned following the ECB event on Thursday and the press conference by President Lagarde.
It is worth recalling that the ECB reduced its short-term inflation and growth projections, indicating a shift towards more accommodative policy measures. This move was anticipated, given the economy's stagnation in Q4 and the consistent shortfall of inflation figures compared to the ECB's forecasts.
The slight downtick in the DAX40 was accompanied by further weakness in 10-year bund yields, which broke below the 2.30% level.
The next resistance for the DAX40 is its record high of 17,879 (March 7). The other way around, the 55-day SMA at 16,985 should offer temporary support before the February low of 16,821 (February 1). The breakdown of this zone may bring back into focus the 2024 bottom at 16,345 (January 17), which is close to the important 200-day SMA at 16,122 and ahead of the weekly low at 15,915 (November 28). The low for October 2023 is 14,630 (October 23), followed by the 2023 low of 14,458 (March 20). The daily RSI eased a tad to 77, still indicating that the market remained severely overbought.
Best Performers: Covestro, Symrise AG, Beiersdorf AG
Worst Performers: Rheinmetall AG, Continental AG, Deutsche Post
Resistance levels: 17,879 (4H chart)
Support levels: 17,619 16,831 16,345 (4H chart)
GBPJPY
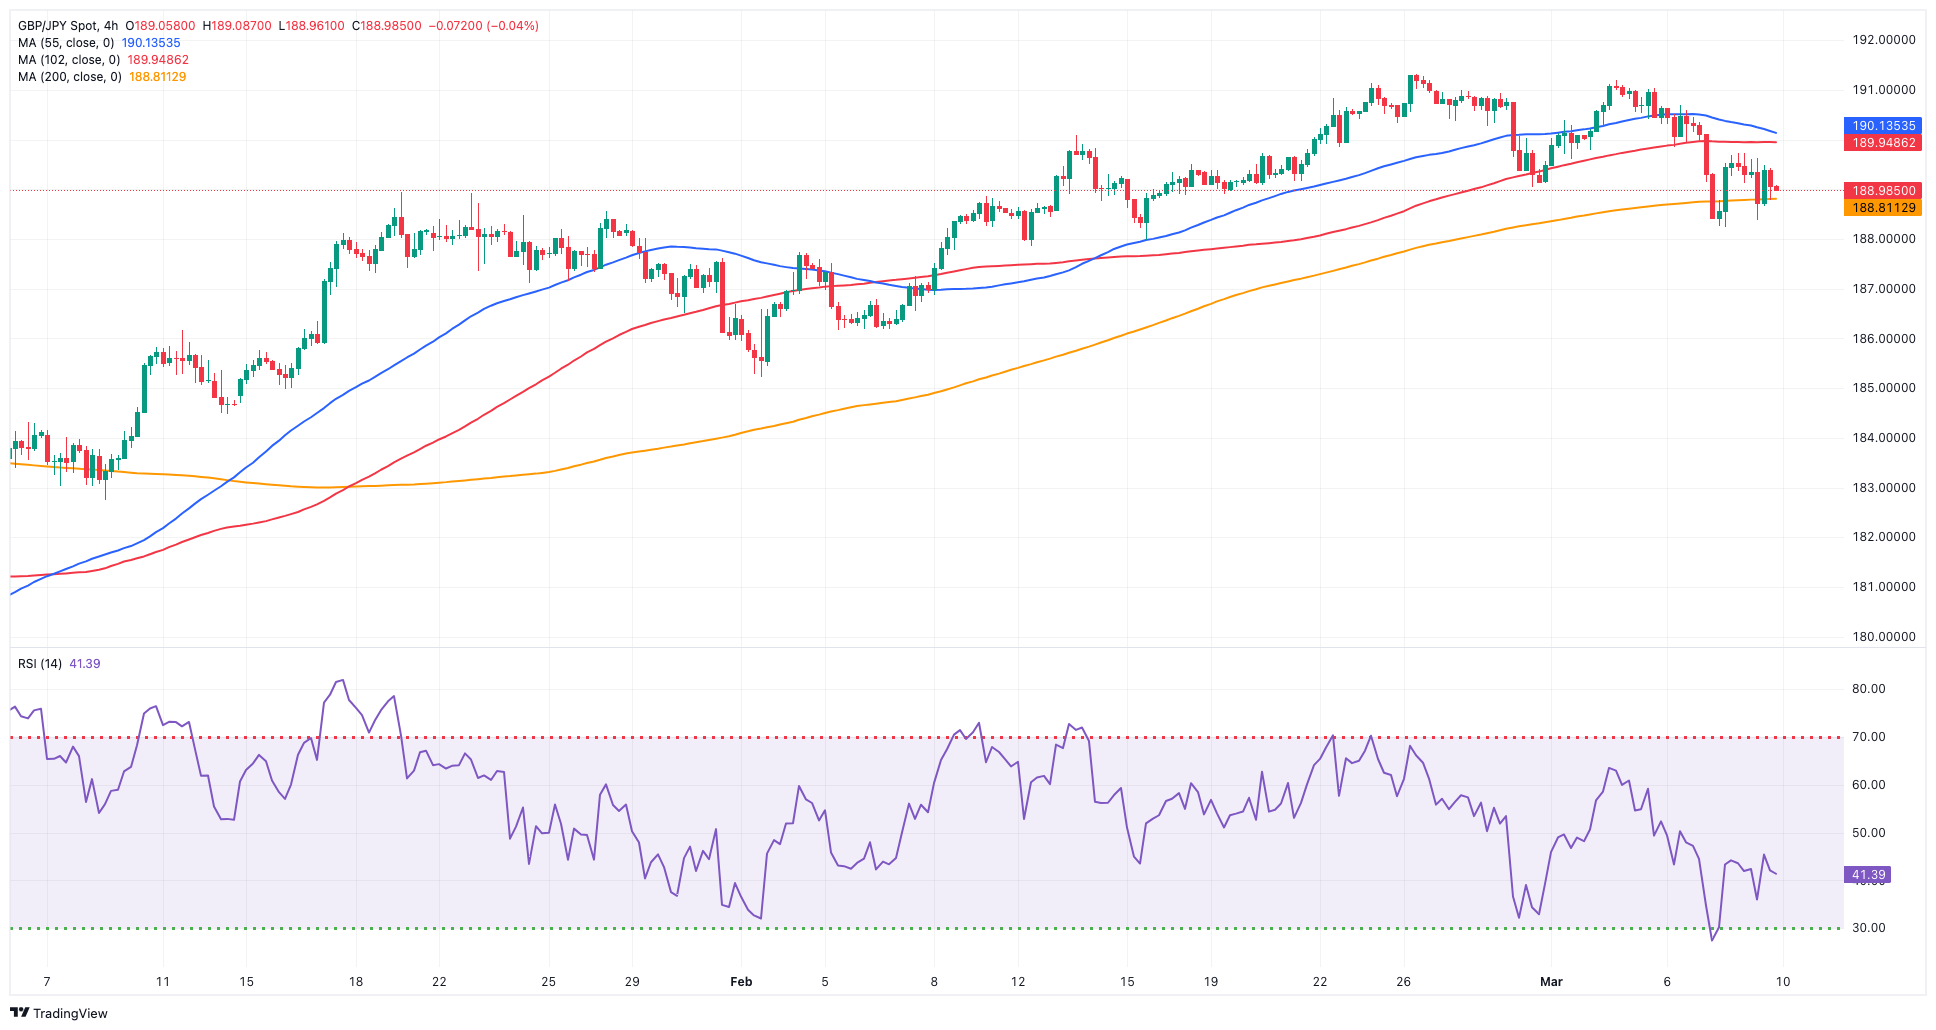
The fourth consecutive daily drop in GBP/JPY was accompanied by extra gains in the Japanese currency despite the persistent rally in sterling.
In the meantime, the weekly leg lower in the cross came in the context of a renewed and intense sell-off in the greenback against the backdrop of steady bets on the start of the Fed’s easing cycle in June.
The increased interest around the Japanese yen remained once again bolstered by traders’ expectations of a potential BoJ’s lift-off at its March meeting.
Immediately to the downside for GBP/JPY comes the March low of 188.24 (March 7) prior to the intermediate 55-day and 100-day SMAs of 186.94 and 185.79, respectively. The breakdown of the latter could pave the way for a probable move to the February low of 185.22 (February 1) ahead of the more important 200-day SMA at 183.86 and the December 2023 low of 178.33 (December 14). Further south, the October 2023 low of 178.03 (October 3) is followed by the July 2023 low of 176.30. Just the opposite, initial resistance is located at the 2024 high of 191.32 (February 26), before the August 2015 top of 195.28 (August 18) and the record peak of 195.88 (June 24, 2015). The daily RSI deflated to the area below the 50 yardstick.
Resistance levels: 191.19 191.32 195.28 (4H chart)
Support levels: 188.24 187.99 185.22 (4H chart)
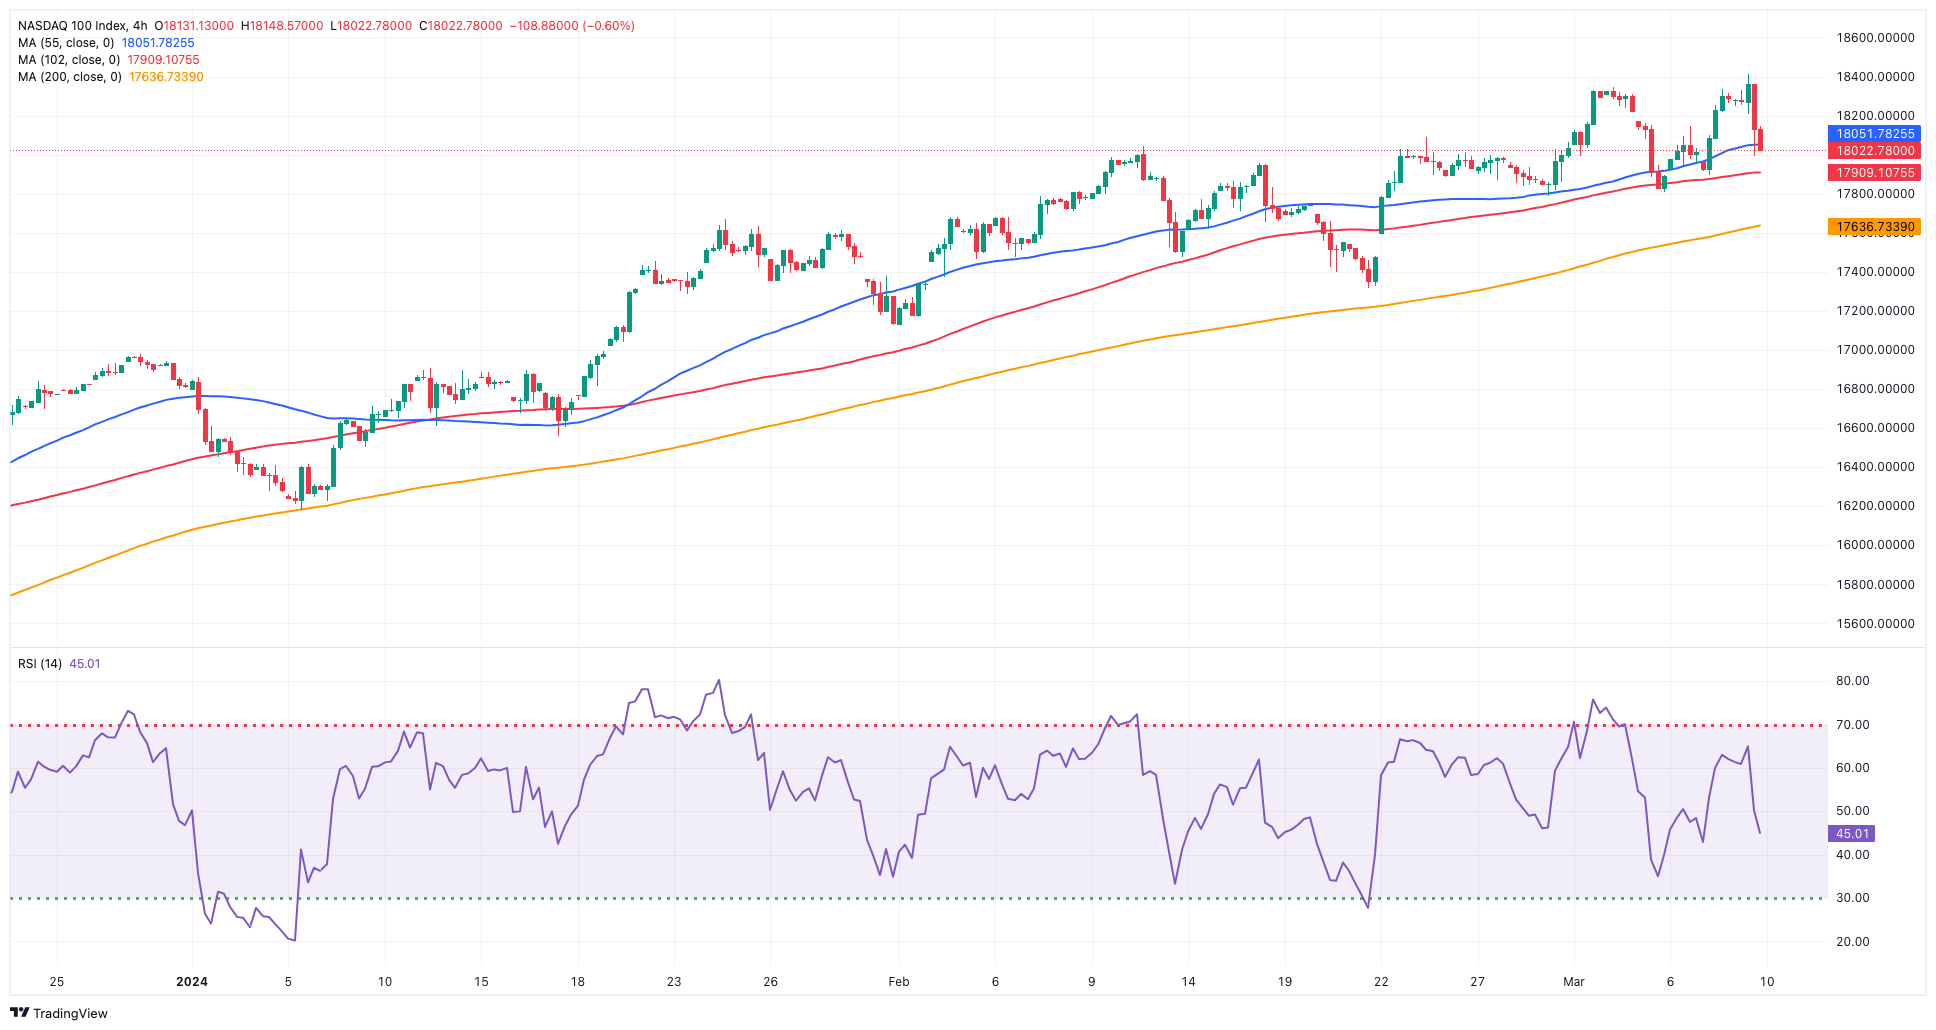
NASDAQ
The tech reference Nasdaq 100 rapidly left behind two consecutive daily advances and flirted with the area of three-day lows just below the 18,000 mark on Friday.
The move lower in the index came against the backdrop of a late bounce in the greenback and mixed US yields, all amidst further investors’ repricing of a reduction of interest rates by the Fed at its June 12 meeting.
Collaborating with the bearish tone in the tech sector also came the marked retracement in megacap Nvidia.
Further gains in the Nasdaq 100 might return it to its all-time high of 18,416 (March 8). Conversely, the index may retest the transitory 55-day SMA of 17,363 prior to the weekly lows of 17,319 (February 21) and 17,128 (January 31). A breach of the latter might lead to a test of the 2024 low of 16,249 (January 5), before the critical 200-day SMA of 15,781 and the December 2023 low of 15,695 (December 4). Additional losses from here may test the October 2023 bottom of 14,058 (October 26), prior to the April 2023 low of 12,724 (April 25), the March 2023 low of 11,695 (March 13), and the 2023 low of 10,696 (January 3). The everyday RSI dropped to around 55.
Top Gainers: Moderna, Atlassian Corp Plc, Comcast
Top Losers: Marvell, Costco, Broadcom
Resistance levels: 18,416 (4H chart)
Support levels: 17,804 17,319 17,128 (4H chart)
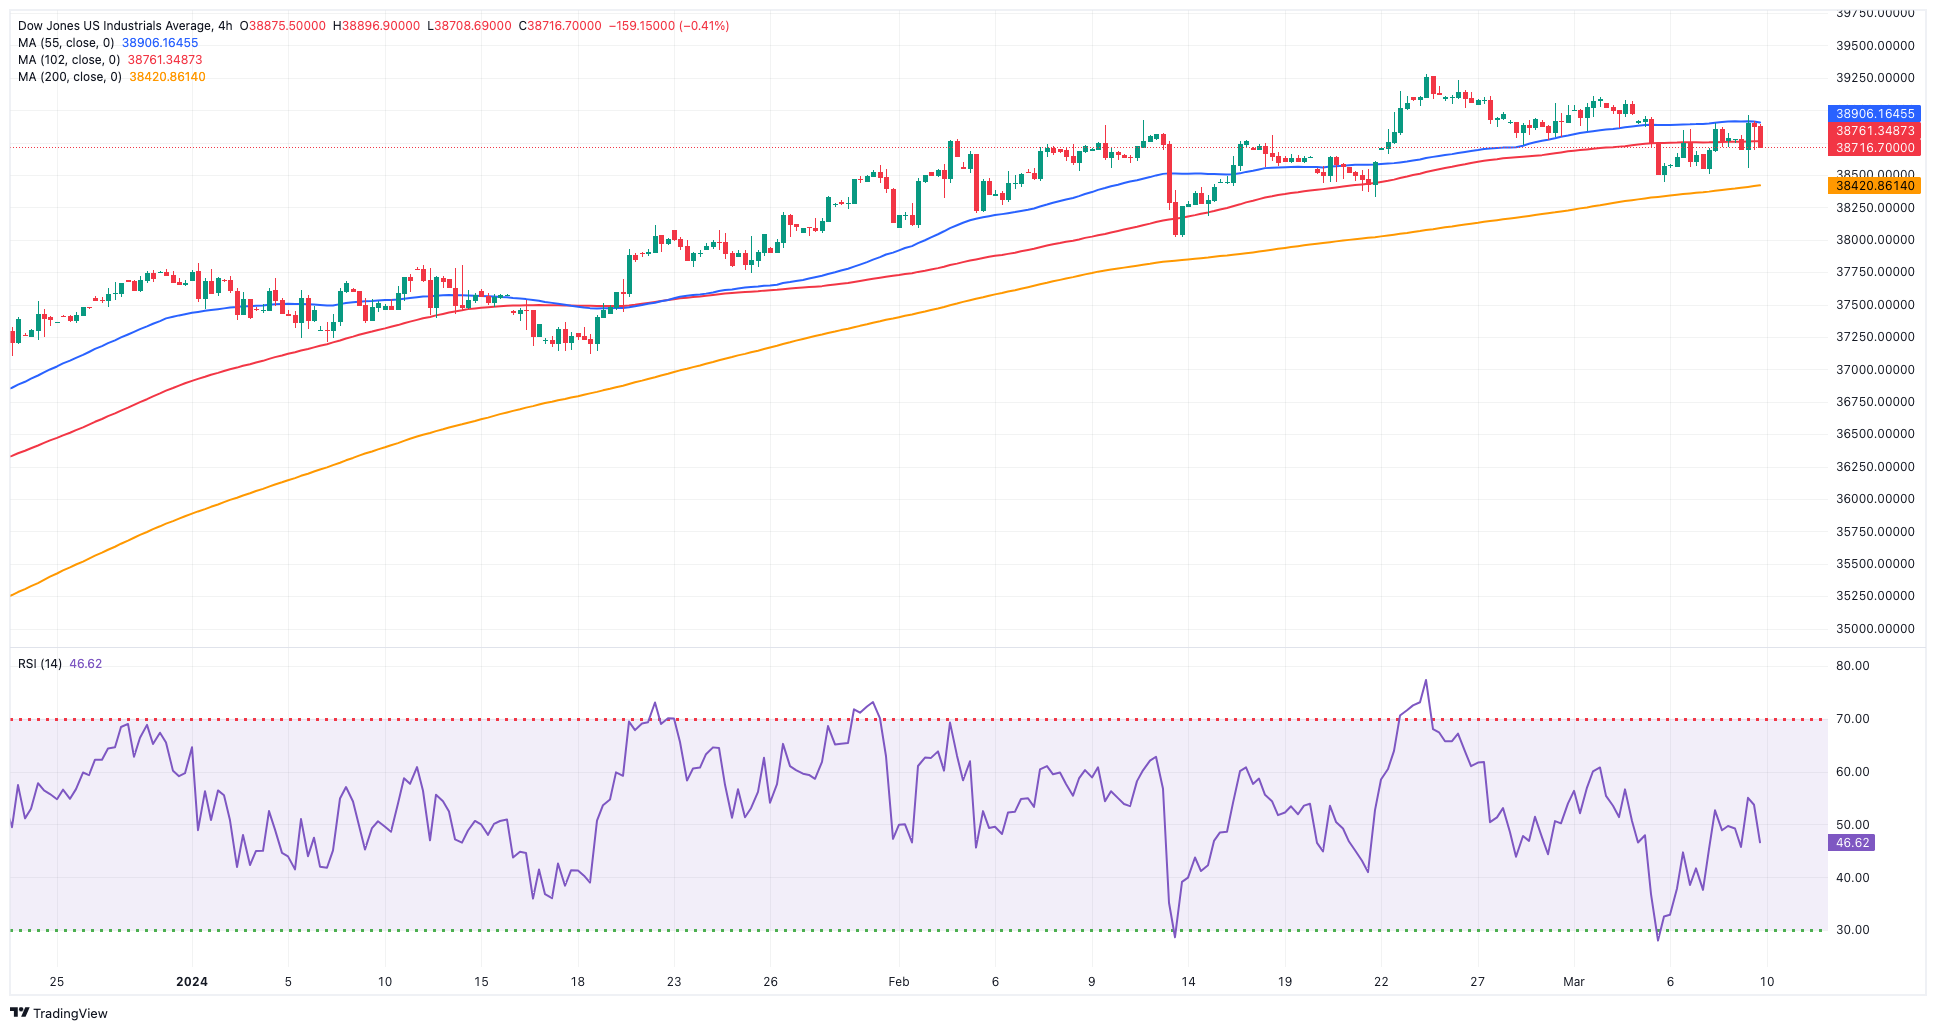
DOW JONES
US equities gave away part of the recent gains and retreated marginally to the 38,700 region when gauged by the Down Jones on Friday.
Price action around the benchmark index came amidst further conviction of an interest rate cut by the Fed, most likely in June. This idea was especially exacerbated following the release of US job data that was neither excessively strong nor weak during February (+275K jobs).
Further bolstering the idea of the start of the easing cycle early in the summer was also somehow anticipated by Chair Powell at his semiannual testimonies, after he suggested that the Fed is approaching the necessary level of confidence in decreasing inflation, which would pave the way for the initiation of interest rate cuts.
At the end of the week, the Dow Jones retreated 0.18% to 38,722, the S&P 500 dropped 0.65% to 5,123, and the tech-benchmark Nasdaq Composite lost 1.16% to 16,085.
If buyers push harder, the Dow Jones might reach its record top of 39,282 (February 23). On the flip side, the 55-day SMA of 38,187 provides provisional support, followed by the 2024 low of 37,122 (January 18) and the weekly low of 37,073 (December 20, 2023). If the index goes below this level, it may cross the 100-day SMA at 36,666, which comes before the 200-day SMA at 35,474. The weekly low of 33,859 (November 7, 2023) comes next ahead of the October 2023 low of 32,327 (October 27) and the 2023 bottom of 31,429 (March 15). The daily RSI eased to the sub-53 area.
Top Performers: 3M, Cisco, Apple
Worst Performers: Intel, Boeing, Honeywell
Resistance levels: 39,282 (4H chart)
Support levels: 38,457 38,039 37,122 (4H chart)
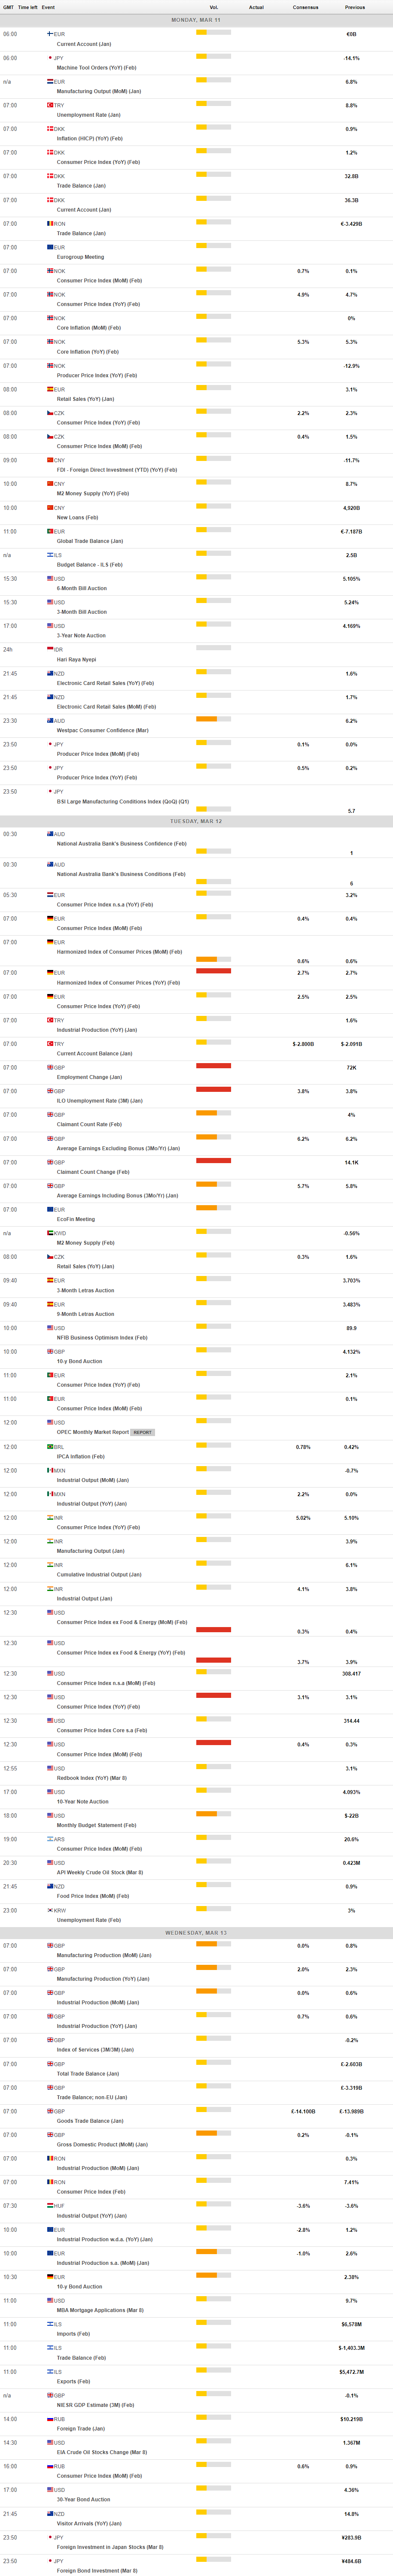
MACROECONOMIC EVENTS
All Information & Updates provided by:

All information relating to the financial markets available on this page has been prepared and issued by FXStreet (Forexstreet SL, Spain, Reg: B62498233) on the basis of publicly available information and all information believed to be reliable and does not conflict with Kuwaiti local laws, and all necessary care has been taken to before the company to ensure that the facts mentioned are correct from the source.
NCM Investment nor any of its directors or employees shall in any way be held responsible for the contents of this news, and the information contained on this page is intended only to provide clients with publicly available information and should not be construed as investment advice, report or analysis and/or constitute an offer or invitation to buy or sell financial instruments of any kind.
RISK WARNING: Forex and CFDs are highly risky leveraged products, as losses can exceed deposits. Please ensure you understand all the risks and take independent advice if necessary. NCM will segregate the clients based on the criteria of the regulator and its bylaws. NCM does not provide any advisory service; the material published does not constitute advice or a recommendation for a transaction in any financial instrument. NCM accepts no responsibility for any use of the content presented and any consequences of that use. Anyone acting on the information provided does so at their own risk.