
- Contact Us:
-

-

-

-


Daily Market Updates
12 Mar 2024
EURUSD
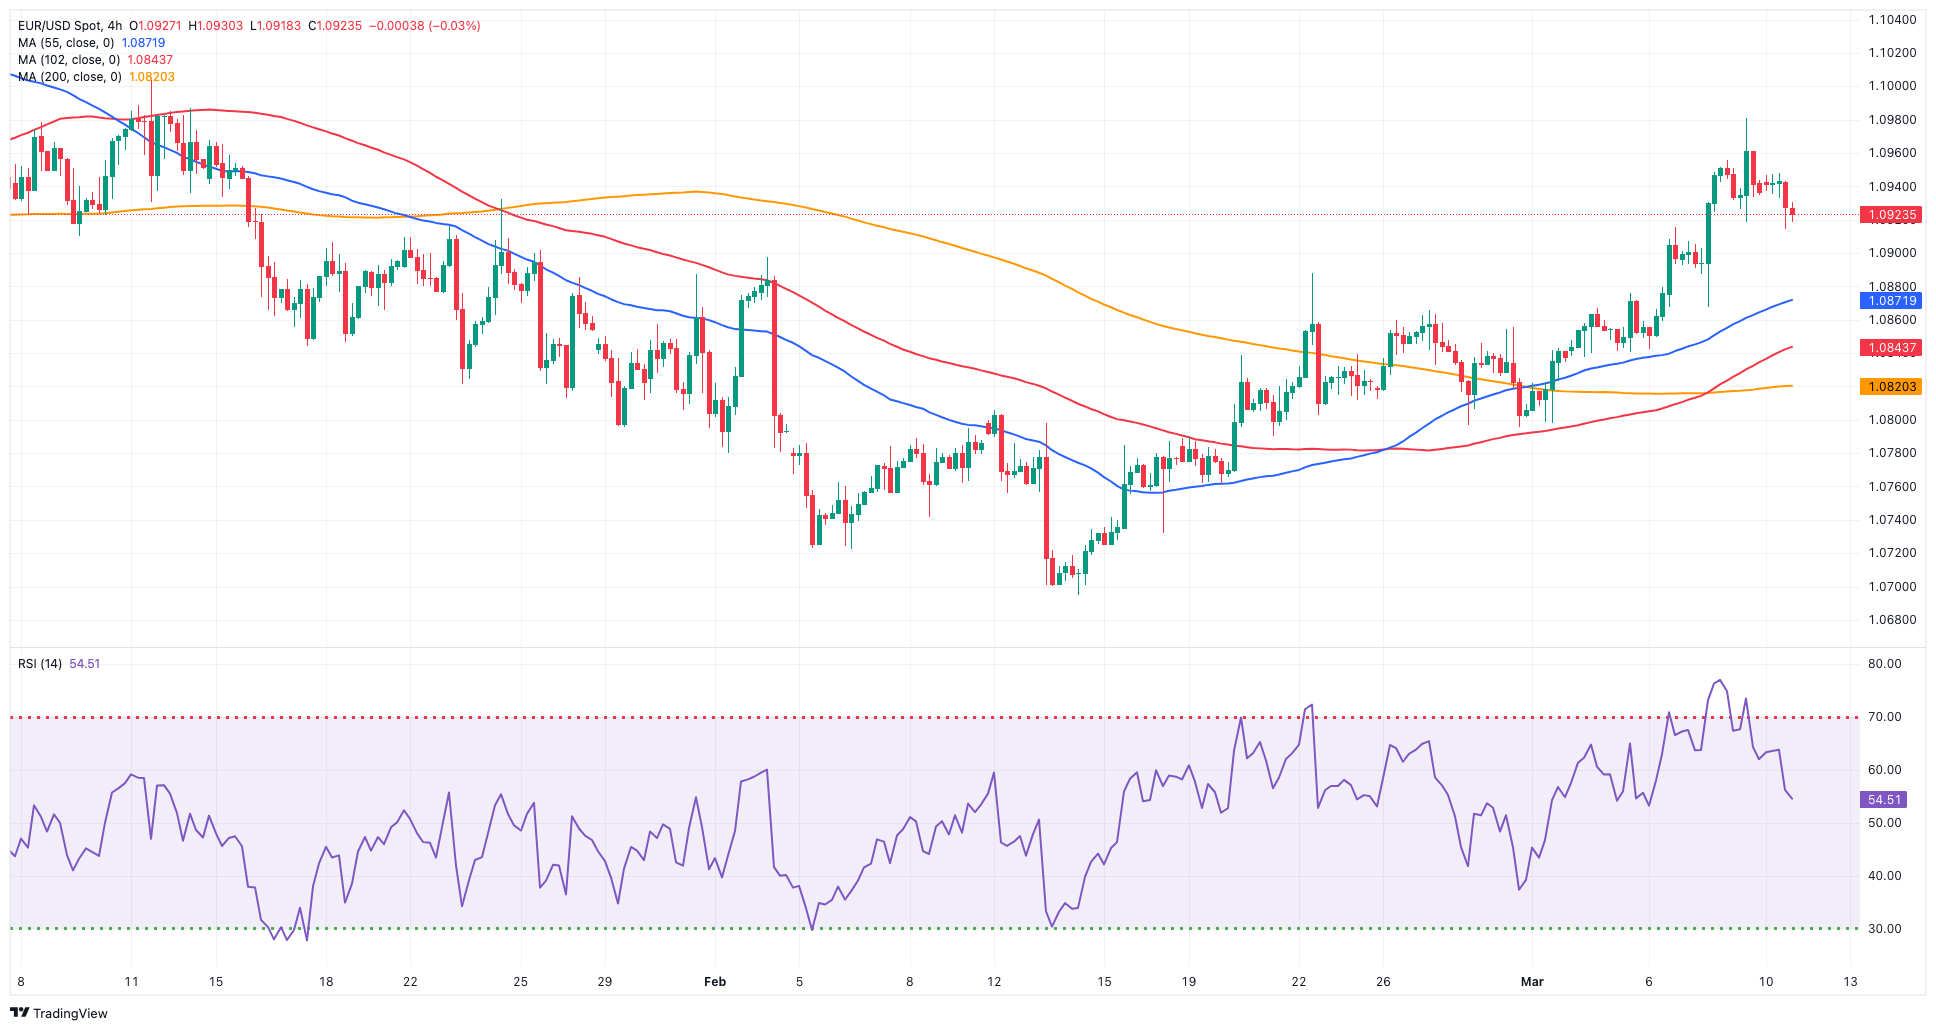
During a negative start to the week, EUR/USD added to Friday's losses around the 1.0930 region, extending the rejection from recent monthly peaks in the 1.0965/70 band (March 8).
Monday’s modest retracement in the pair was fueled by an equally acceptable rebound in the greenback, which was also accompanied by a slight recovery in US yields across various maturities, always amidst growing expectations of the Fed commencing its easing cycle in June.
Meanwhile, investors continued to evaluate February’s mixed US labour market report (published last Friday), which seems to have strengthened further the idea of an interest rate cut by the Fed in the summer.
Around the ECB, Board member P. Kazimir mentioned that while inflation is decreasing, we haven't reached our desired point yet. He favours a policy-easing approach characterized by a "smooth and steady" cycle. He believes that confidence to reduce rates will only emerge by June.
Reinforcing the dollar’s upward bias, the New York Fed now sees US 1-year inflation expectations unchanged at 3.0%, while 3-year and 5-year inflation expectations ticked higher to 2.7% and 2.9%, respectively.
EUR/USD's initial resistance level is the March high of 1.0981 (March 7). North of here is the weekly top of 1.0998 (January 5, 2011), which precedes the psychological 1.1000 threshold. The breakout of this zone might pave the way for a challenge to the December 2023 peak of 1.1139 (December 27), which is supported by the 200-week SMA of 1.1147 and comes before the 2023 high of 1.1275 (July 18). In contrast, the loss of the 200-day SMA of 1.0834 may result in a challenge of the weekly low of 1.0795 (February 29), which precedes the 2024 low of 1.0694 (February 14). A further slide might lead to a test of the weekly low of 1.0495 (October 13, 2023) ahead of the 2023 low of 1.0448 (October 3), and the round level of 1.0400. The daily RSI dropped to the sub-63 region.
Resistance levels: 1.0981 1.0998 1.1139 (4H chart)
Support levels: 1.0867 1.0819 1.0795 (4H chart)
USDJPY
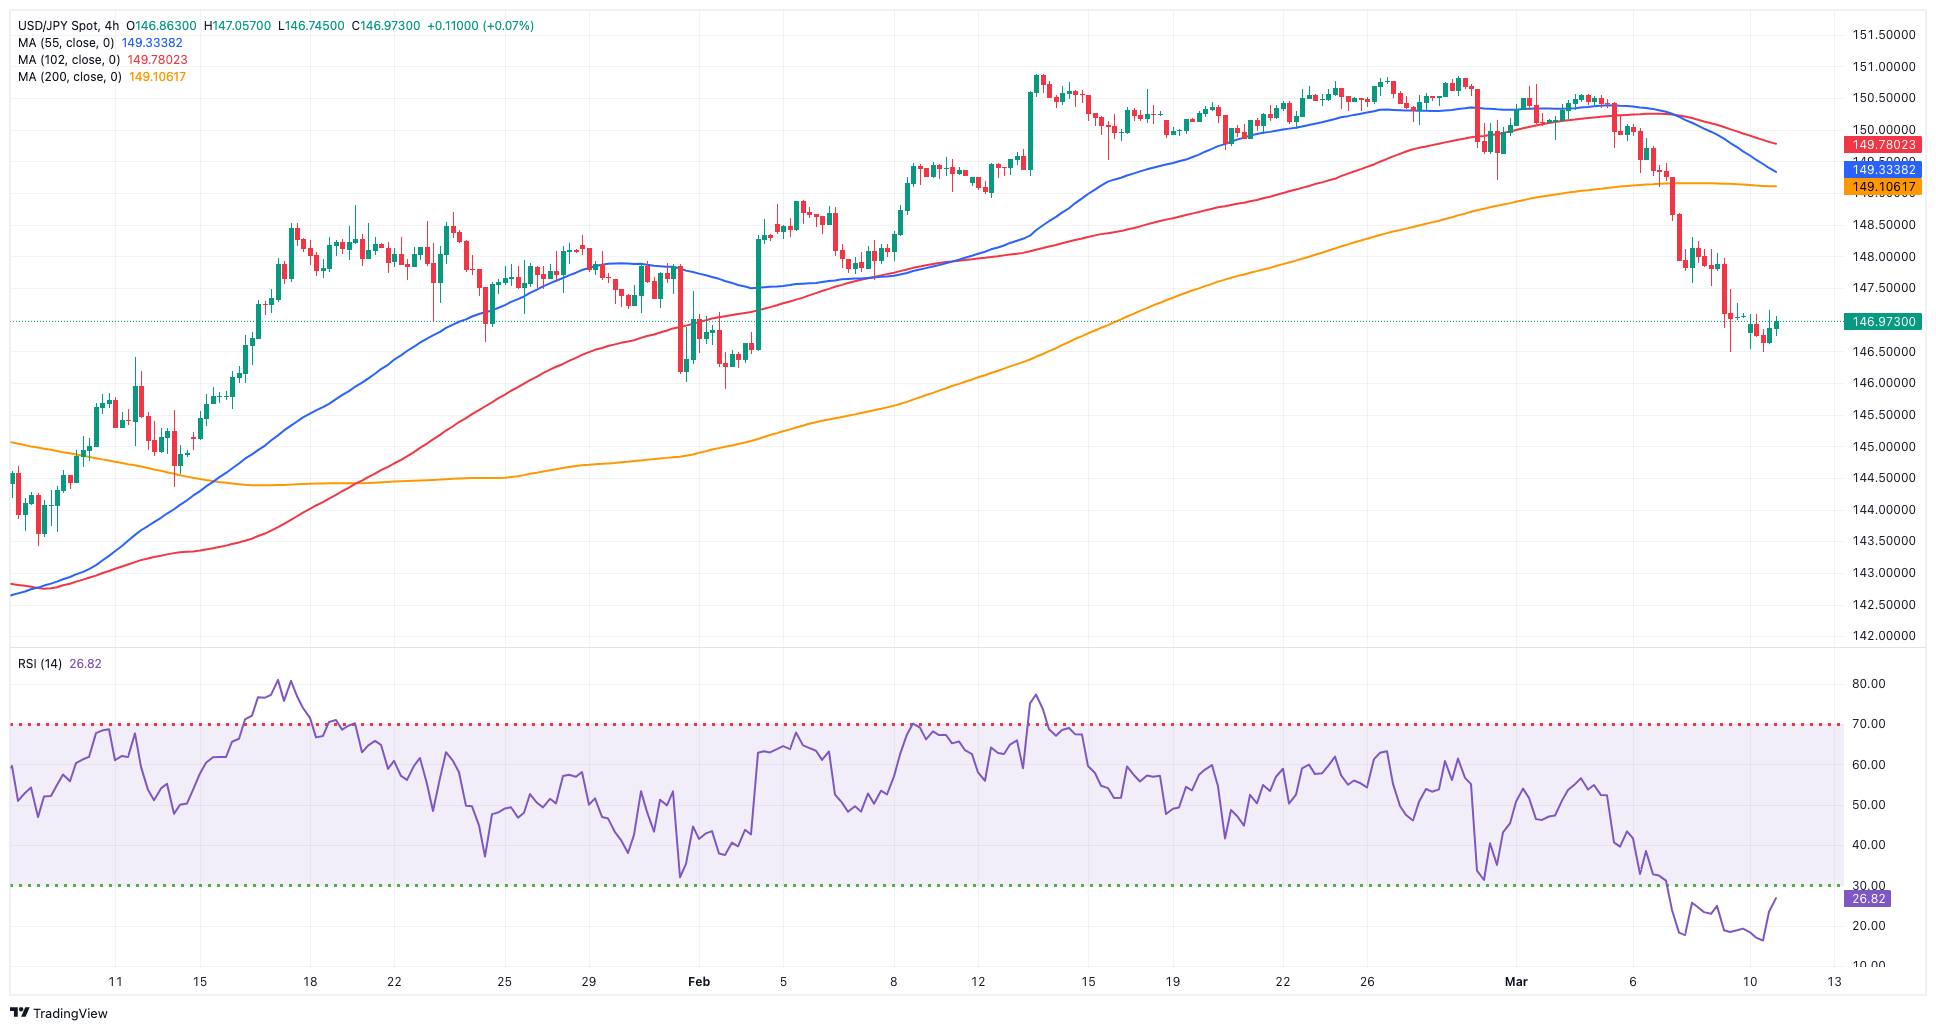
There was no respite for the selling pressure in USD/JPY, which kicked off its third consecutive week of losses on Monday.
The persistent leg lower in spot remained propped up by the change of heart in the Japanese yen, underpinned at the same time by rising speculation that the BoJ could announce an exit to its ultra-accommodative monetary stance at its March 18–19 event.
The likelihood of this scenario increases to approximately 80% by April 25–26 and is fully factored in by June 13–14. However, despite the growing wage and price pressures, it seems premature for the bank to contemplate raising rates before the outcomes of the spring wage negotiations are disclosed.
In the Japanese calendar, the final GDP figures showed the economy expanded by 0.1% QoQ in the October–December period and by 0.4% over the last twelve months.
If bears exert more pressure, USD/JPY may retest the important 200-day SMA at 146.19, which precedes the February low of 145.89 (February 1). Once this zone is cleared, the pair should find support around the December 2023 low of 140.24 (December 28), which comes before the round number 140.00, and the July low of 137.23 (July 14). Just the opposite, the nearest upside barrier is the 2024 peak of 150.88 (February 13), which comes before the 2023 high of 151.90 (November 13). From here, the 2022 top of 151.94 (October 21) is immediately followed by the round figure 152.00. The daily RSI eased to the proximity of 34.
Resistance levels: 149.11 150.88 151.43 (4H chart)
Support levels: 146.47 145.89 144.34 (4H chart)
GBPUSD
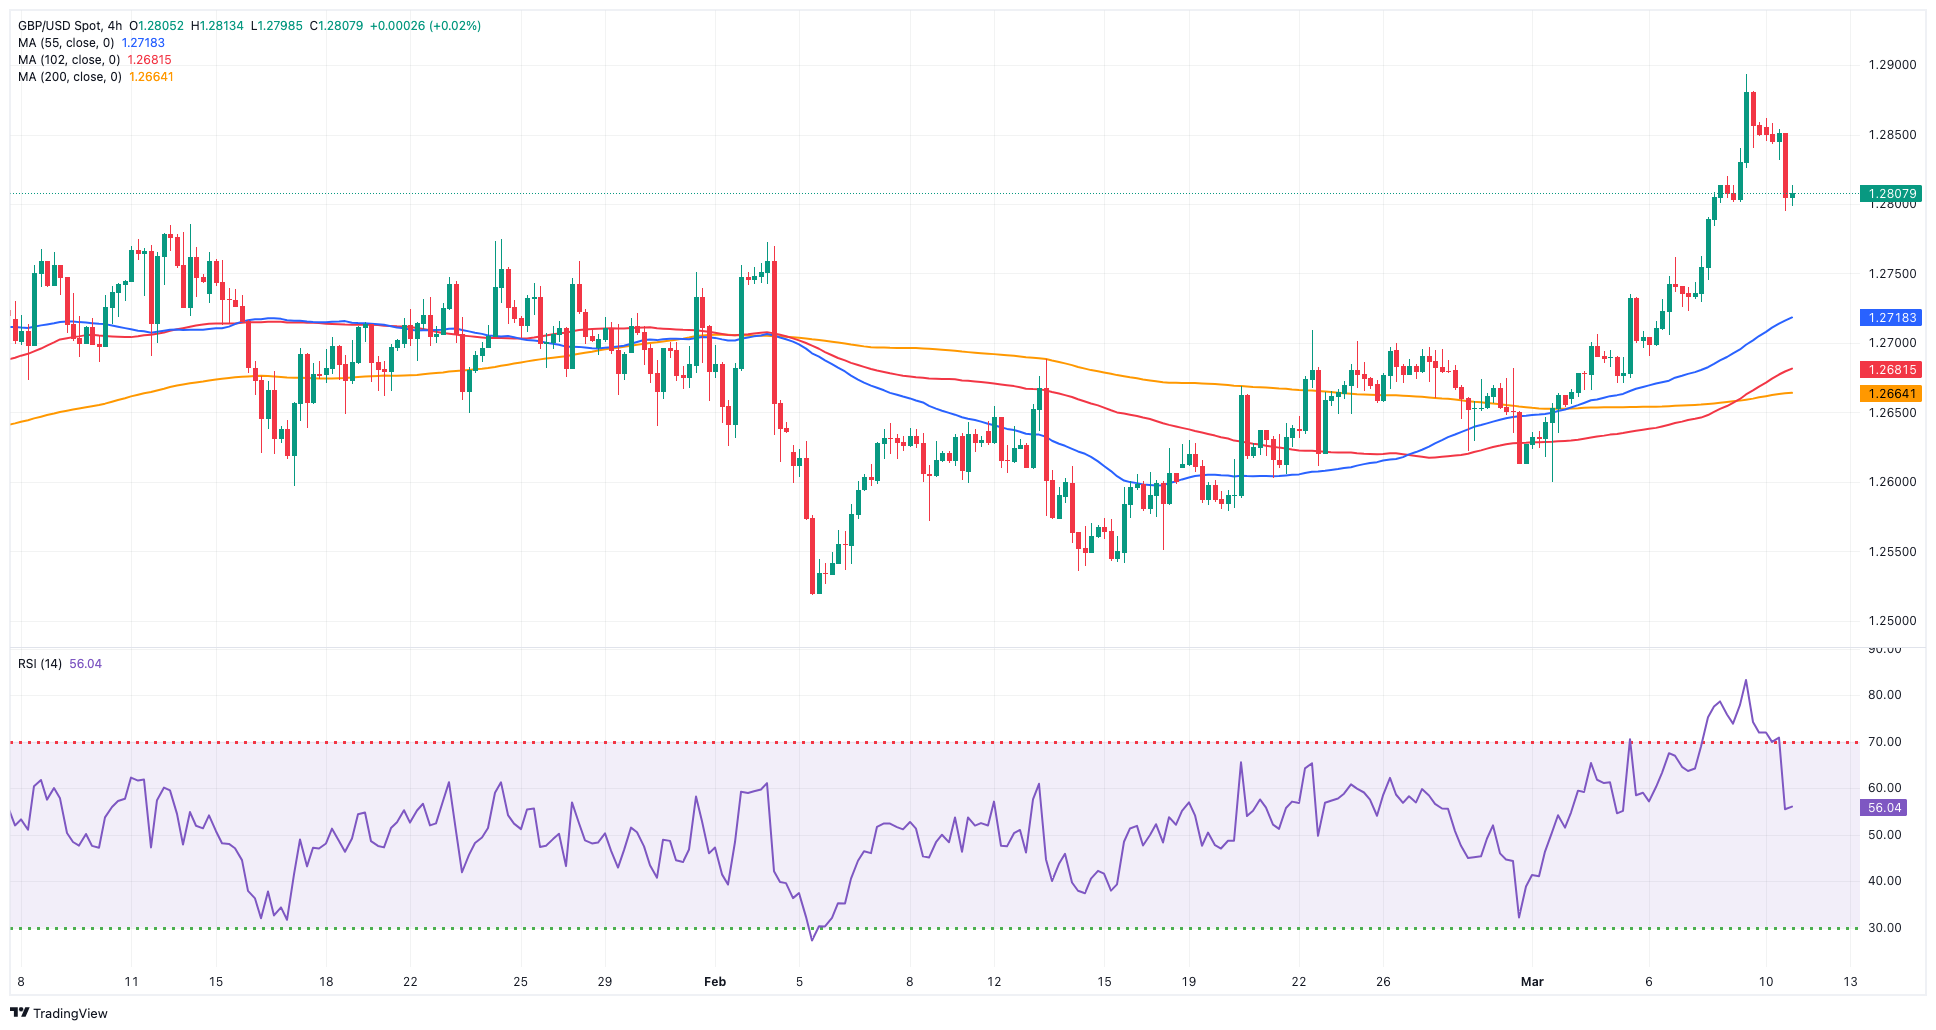
GBP/USD met some fresh selling pressure on the back of the resurgence of some buying interest around the greenback, prompting it to slip back to the 1.2800 neighbourhood at the beginning of the week.
Cable reached fresh several-month peaks in the boundaries of 1.2900 the figure on Friday, a multi-day uptick that was almost exclusively in response to dynamics around the greenback and some repricing of the BoE’s start of its easing programme.
The daily losses in the pair came in contrast to a small bounce in 10-year gilt yields ahead of the release of a key UK labour market report on Tuesday.
The next upward hurdle for GBP/USD is the 2024 high of 1.2893 (March 8), seconded by the weekly top of 1.2995 (July 27, 2023) and the significant 1.3000 yardstick. In the other direction, bearish tendencies may initially take the pair to the preliminary 55-day SMA at 1.2682 before reaching the March low of 1.2599 (March 1) and the key 200-day SMA at 1.2582. The loss of this zone might bring the 2024 low of 1.2518 (February 5) back into focus ahead of the December 2023 low of 1.2500 (December 13). Down from here is the weekly low of 1.2187 (November 10, 2023), followed by the October 2023 bottom of 1.2037, the critical 1.2000 barrier, and the 2023 low of 1.1802 (March 8). On the daily chart, the RSI retreated to the area below the 64 level.
Resistance levels: 1.2893 1.2995 1.3142 (4H chart)
Support levels: 1.2795 1.2662 1.2599 (4H chart)
GOLD
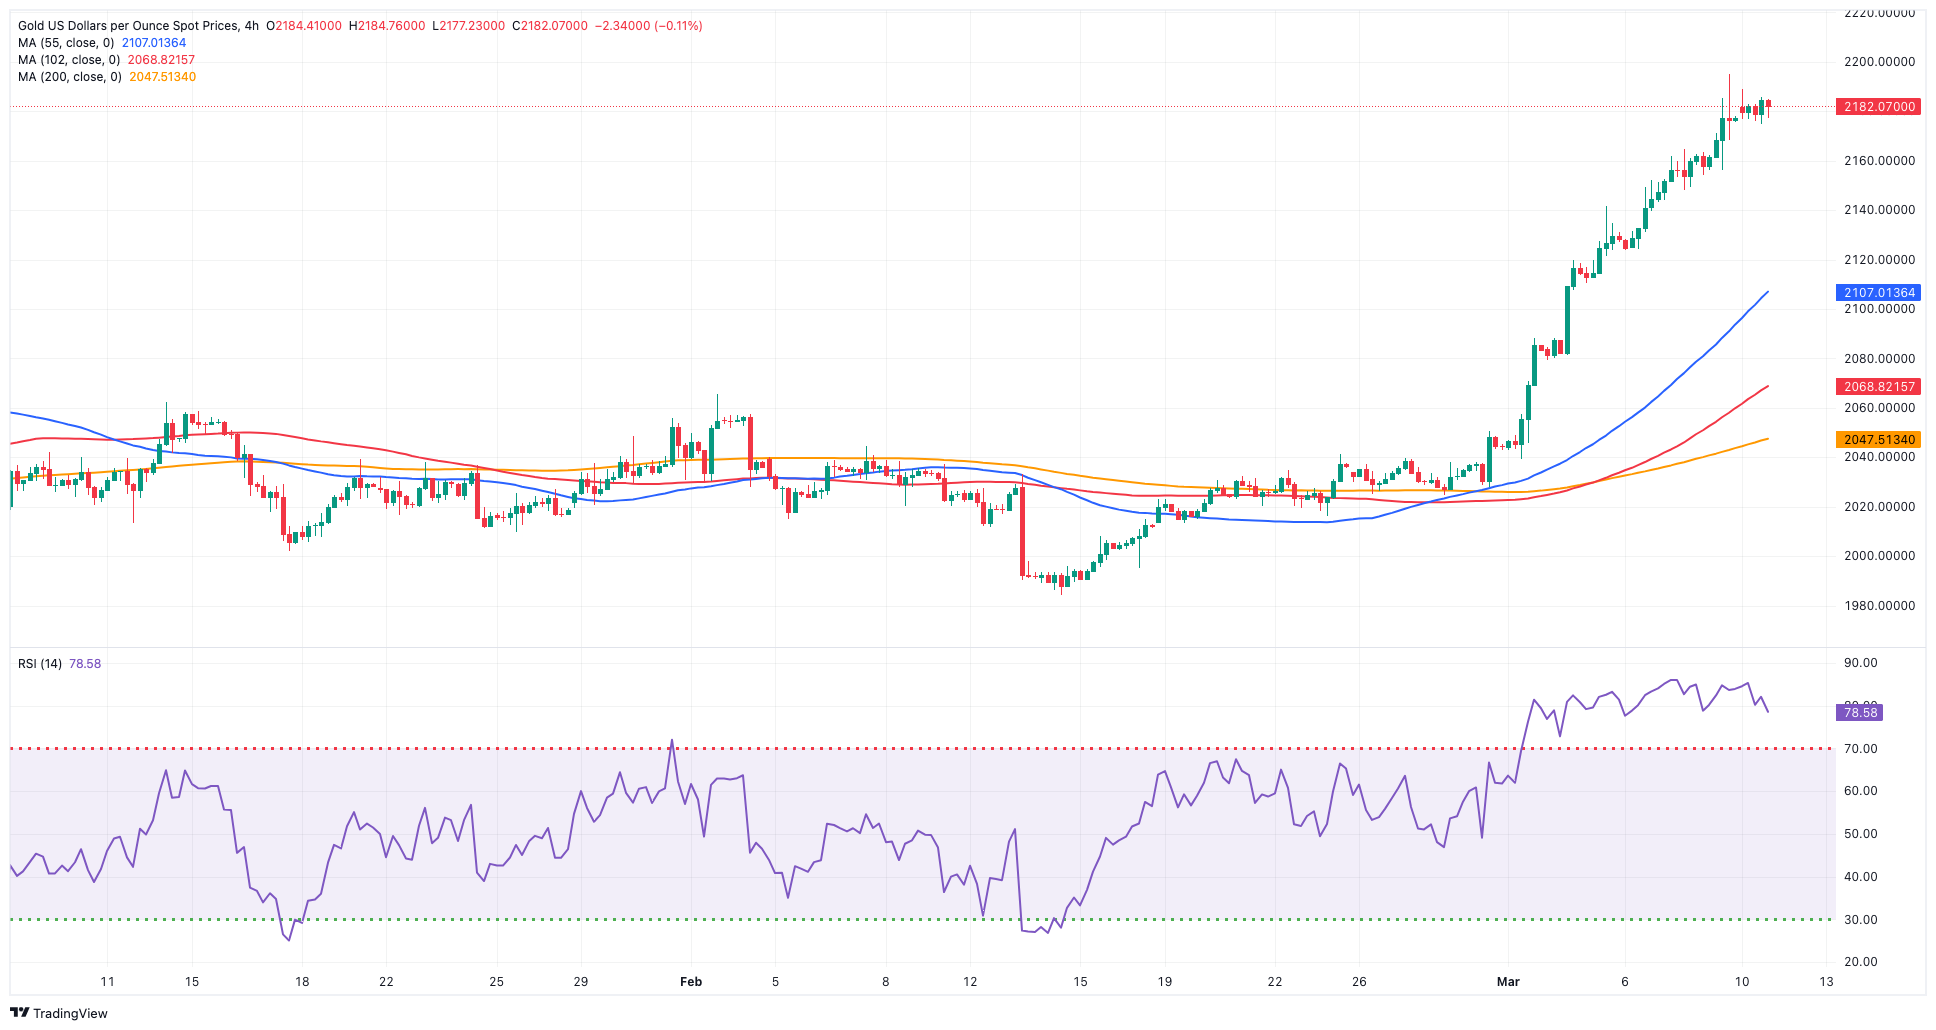
The current needle-like rally in Gold appears to have met quite a decent hurdle near the $2,200 mark per troy ounce so far.
In fact, traders appear to have taken a breather at the beginning of the week, prompting a small knee-jerk in the precious metal amidst a decent bounce in demand for the greenback and a decent recovery in US yields.
Moving forward, the upward trend in the yellow metal is expected to be put to the test ahead of the publication of US inflation figures gauged by the CPI for the month of February, which is due on Tuesday.
Gold reached an all-time high of $2,195 on March 8. On the flip side, the 55-day and 100-day SMAs of $2,046 and $2,024 should provide interim support, followed by the 2024 low of $1,984 (February 14) and the December 2023 low of $1,973, which is supported by its proximity to the critical 200-day SMA of $1,973 and comes ahead of the November 2023 low of $1,931. The breach of the latter may cause bullion to retest its October 2023 bottom of $1,810, prior to the 2023 low of $1,804 and the critical $1,800 conflict zone.
Resistance levels: $2,195 (4H chart)
Support levels: $2,108 $2,048 $2,016 (4H chart)
CRUDE WTI
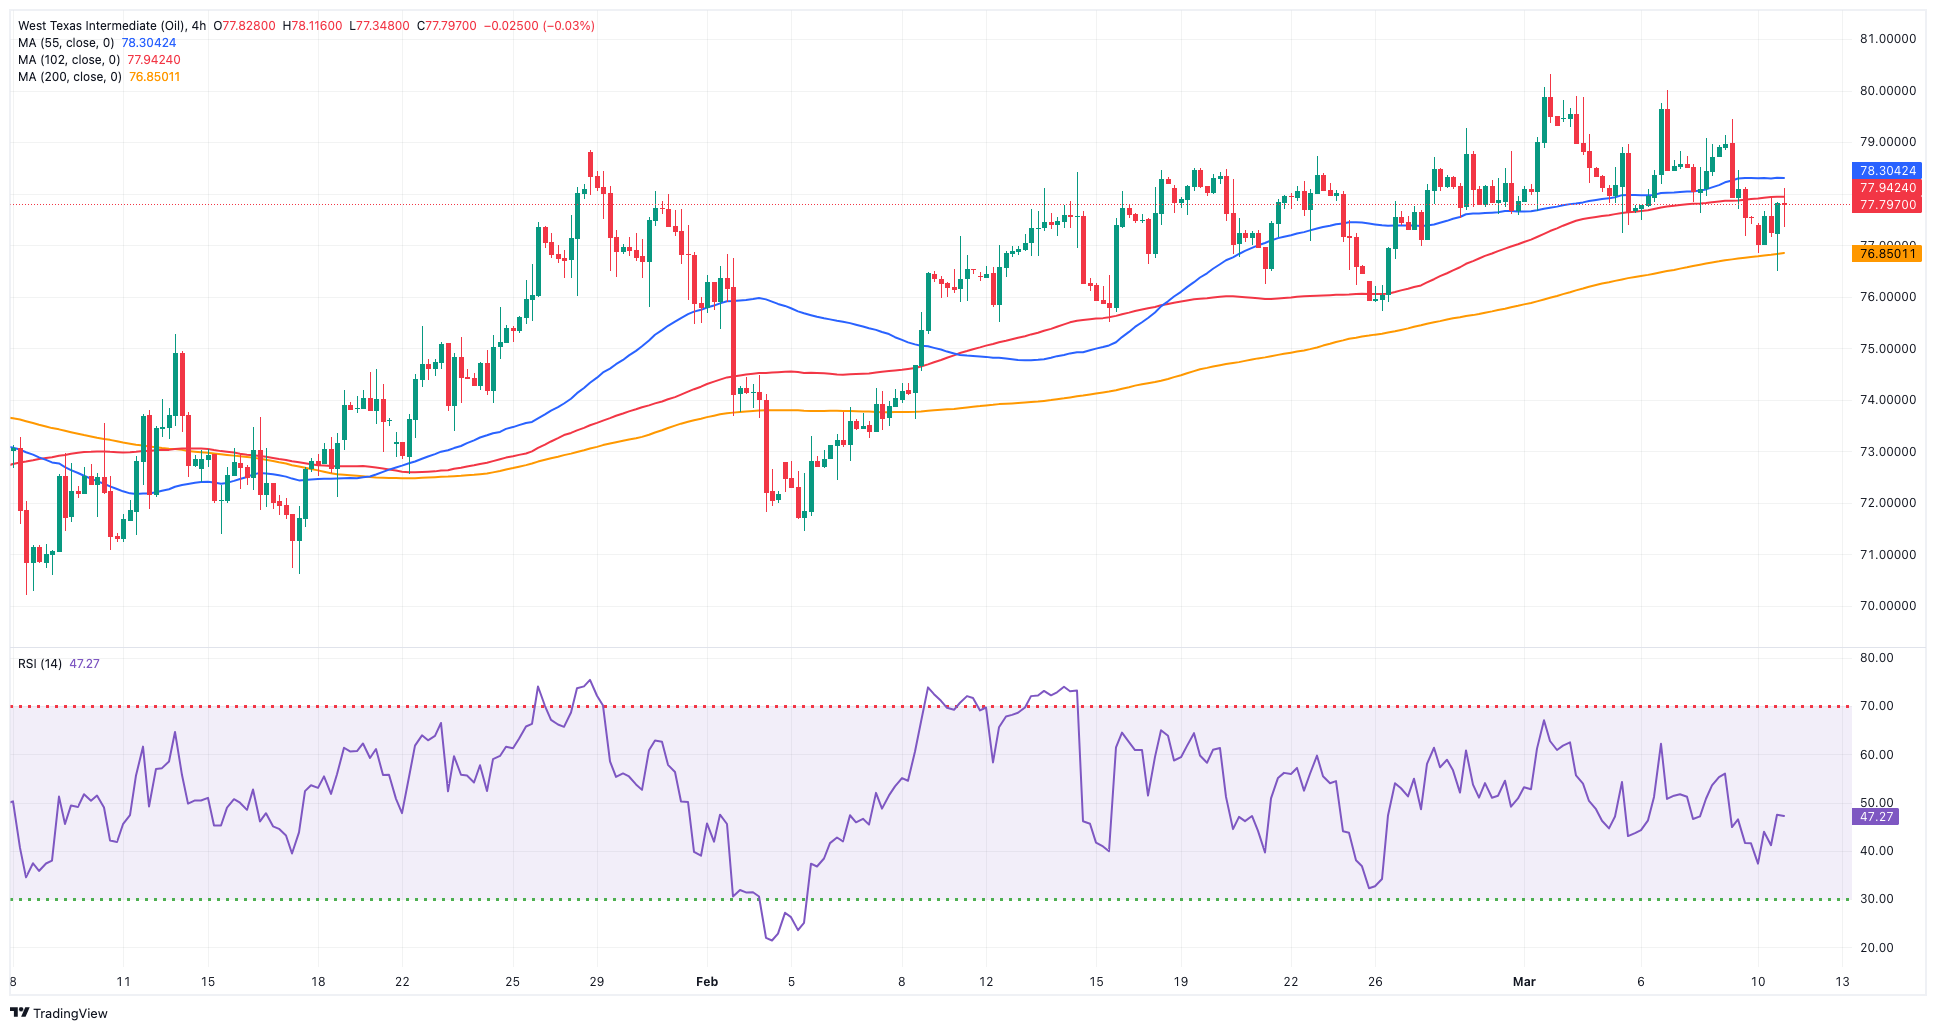
Prices of the American benchmark for sweet light crude oil started the week in a positive fashion, reclaiming the area beyond the $78.00 mark per barrel and leaving behind Friday’s pullback. The commodity, however, has remained trapped within the consolidative range in place since early February.
Concerns around China and increasing cautiousness ahead of the release of the US CPI on Tuesday kept crude oil prices under scrutiny, while the rise in refining activity within the US, which has the potential to restrict global crude supplies, mitigated any significant decline in oil prices.
Later in the week, the API and the EIA will release their weekly reports on US crude oil supplies on Tuesday and Wednesday, respectively.
The next upward challenge for WTI is the 2024 peak of $80.82 (March 1), which precedes the weekly high of $89.83 (October 18, 2023) and the 2023 top of $94.99 (September 28, 2023). Further north, the weekly peak of $97.65 (August 30) comes before the psychological $100.00 threshold. Having said that, the 100-day and 55-day SMAs should give provisional contention around $76.00 and $75.39, respectively, before falling to the February low of $71.43 (February 5). Extra losses emphasise the critical $70.00 milestone ahead of the 2024 low of $69.31 (January 3).
Resistance levels: $80.82 $83.56 $85.85 (4H chart)
Support levels: $76.76 $75.81 $71.37 (4H chart)
GER40
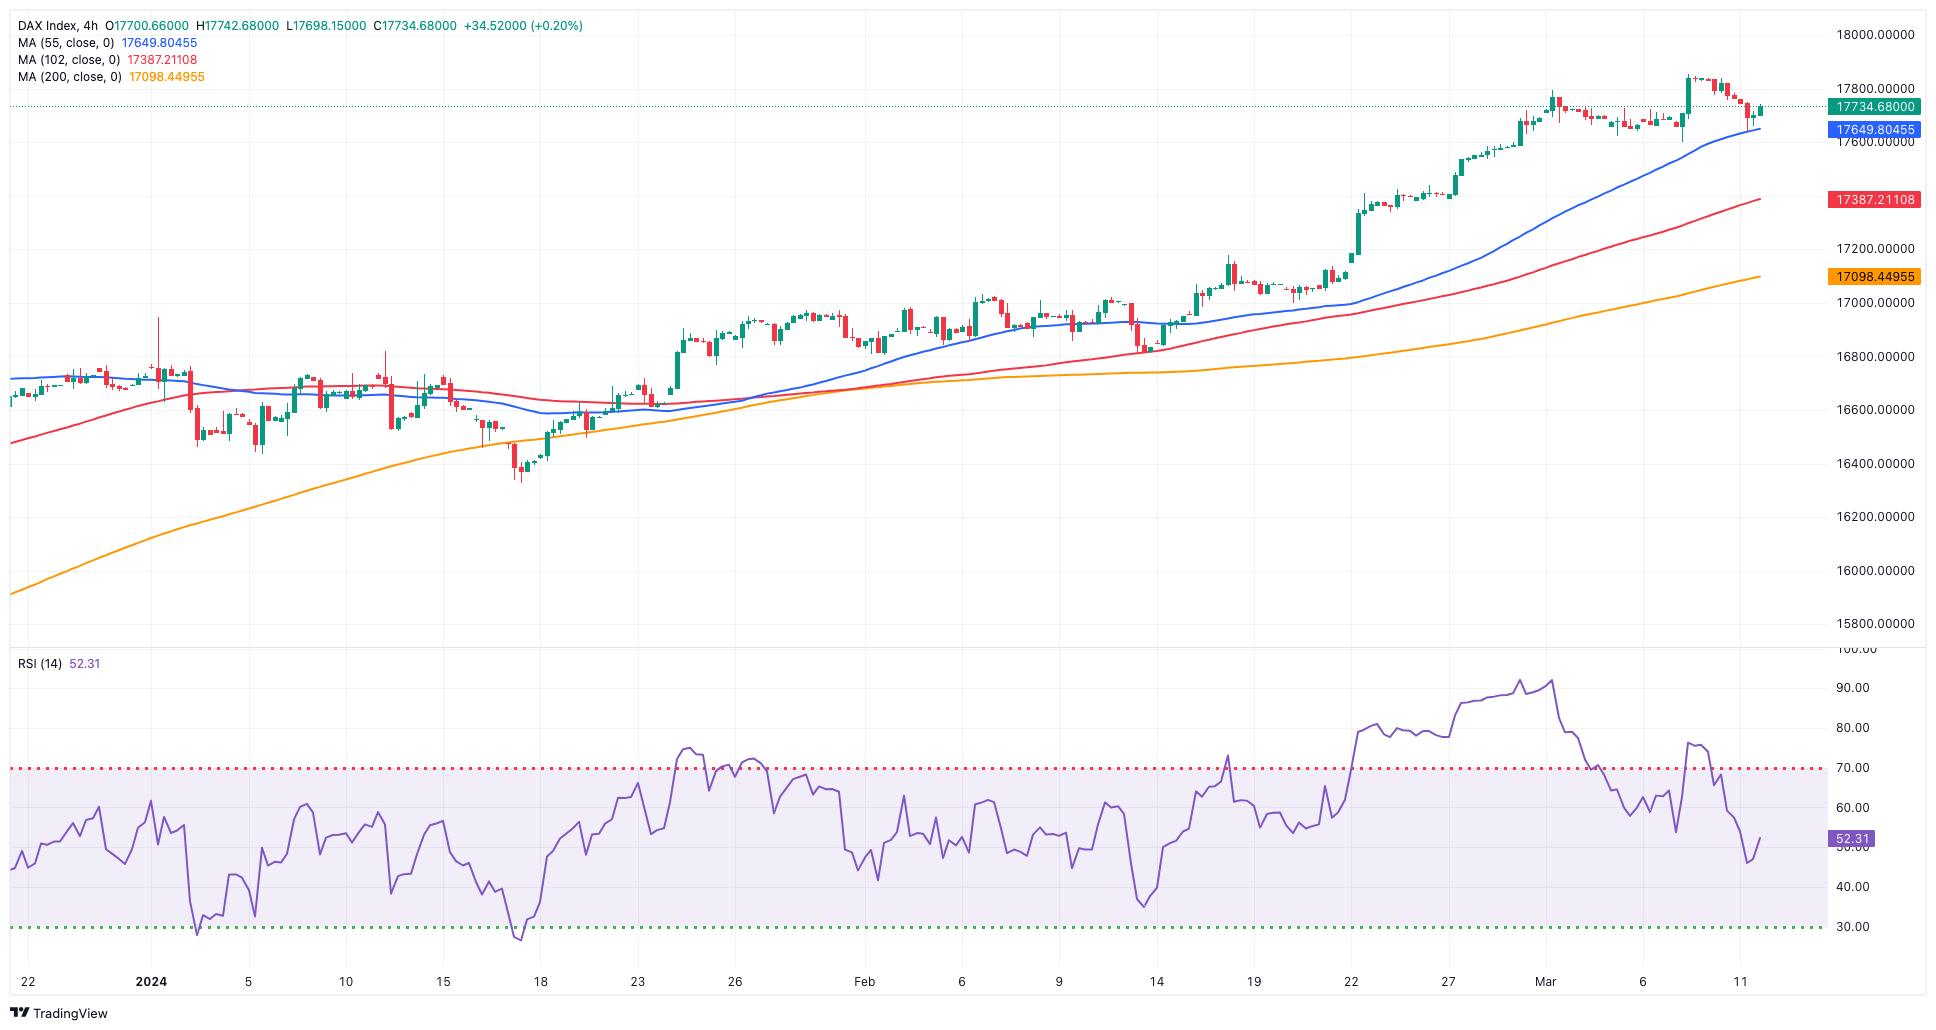
European equities started the week in a mixed fashion, with the German reference DAX40 closing with modest losses around the 17,700 area and adding to Friday’s small decline.
The lack of traction in the index came in response to the intense cautious trade ahead of the publication of US CPI on Tuesday, while investors were also digesting the recent US Non-farm Payrolls (+275K jobs) and the latest ECB gathering.
On the latter, speculations about the possibility of the ECB lowering its policy rates in June remained on the rise, while some officials even suggested the idea of an additional rate cut taking place in July.
Meanwhile, German 10-year bund yields regained the 2.30% zone following two daily retracements in a row.
The DAX40's next resistance is its record high of 17,879 (March 7). Conversely, the 55-day SMA at 17,004 should provide brief support before the February low of 16,821 (February 1). The breach of this zone may bring back into focus the 2024 bottom at 16,345 (January 17), which is near the significant 200-day SMA at 16,133. Down from here emerges the weekly low at 15,915 (November 28) followed by the October 2023 low of 14,630 (October 23) and the 2023 low of 14,458 (March 20). The daily RSI fell slightly to 71, suggesting that the market remained slightly overbought.
Best Performers: Vonovia, Bayer, Deutsche Bank AG
Worst Performers: Continental AG, Brenntag AG, Zalando SE
Resistance levels: 17,879 (4H chart)
Support levels: 17,619 16,831 16,345 (4H chart)
GBPJPY
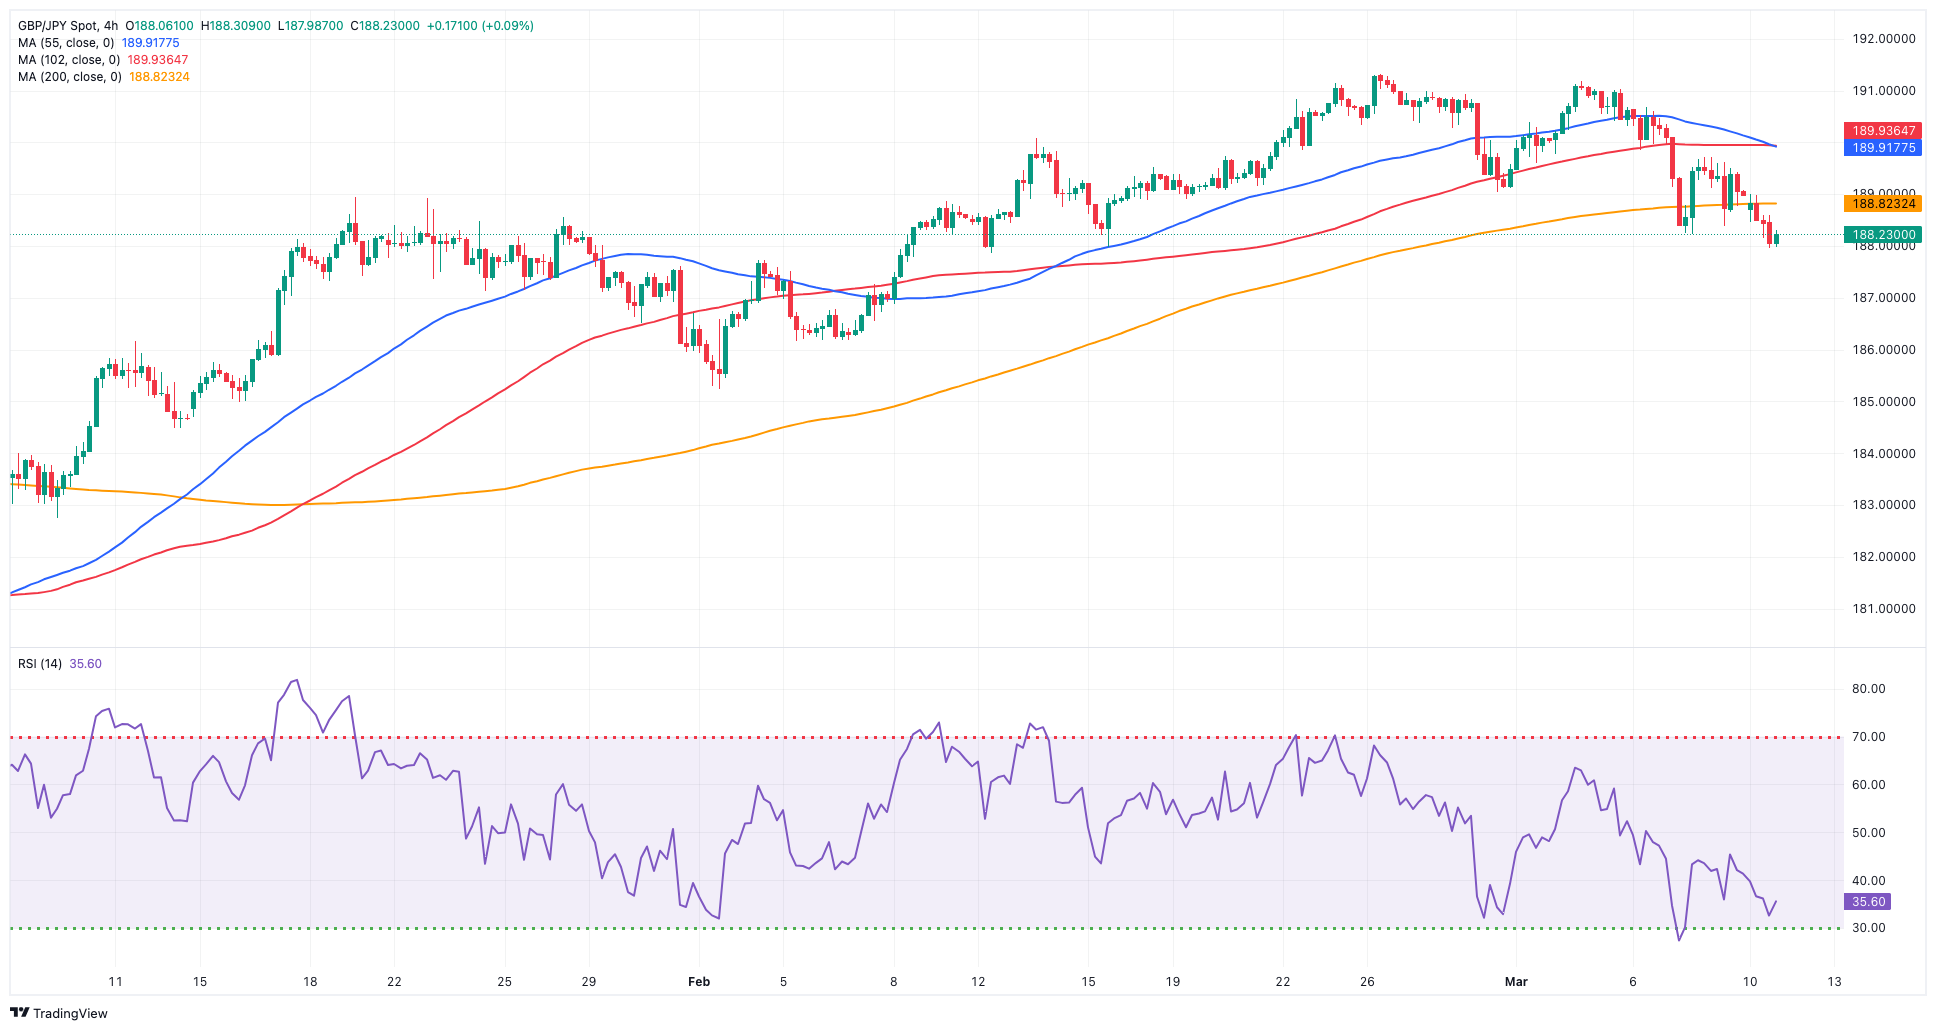
Once again, the continuation of the buying interest in the Japanese yen kept the downside pressure well in place around GBP/JPY, sponsoring its fifth consecutive session of losses and retesting four-week lows near 188.00.
In addition, the improvement in sentiment surrounding the dollar prompted a corrective move in the risk-linked galaxy, which encouraged GBP-sellers to return to the market.
It is worth reiterating that the ongoing strength in the Japanese currency remained supported by prospects of a BoJ’s lift-off as soon as at its next week’s event.
The March low of 187.96 (March 11) is immediately to the downside for GBP/JPY, as are the intermediate 55-day and 100-day SMAs of 187.08 and 185.86, respectively. The breach of the latter might pave the way for a likely move to the February low of 185.22 (February 1), ahead of the more significant 200-day SMA at 183.93 and the December 2023 low of 178.33 (December 14). Further south, the October 2023 low of 178.03 is followed by the July 2023 low of 176.30. On the contrary, first resistance is placed around the 2024 top of 191.32 (February 26), before the August 2015 peak of 195.28 (August 18) and the record high of 195.88 (June 24, 2015). The daily RSI dropped below the 44 level.
Resistance levels: 189.72 191.19 191.32 (4H chart)
Support levels: 187.96 186.44 185.22 (4H chart)
NASDAQ
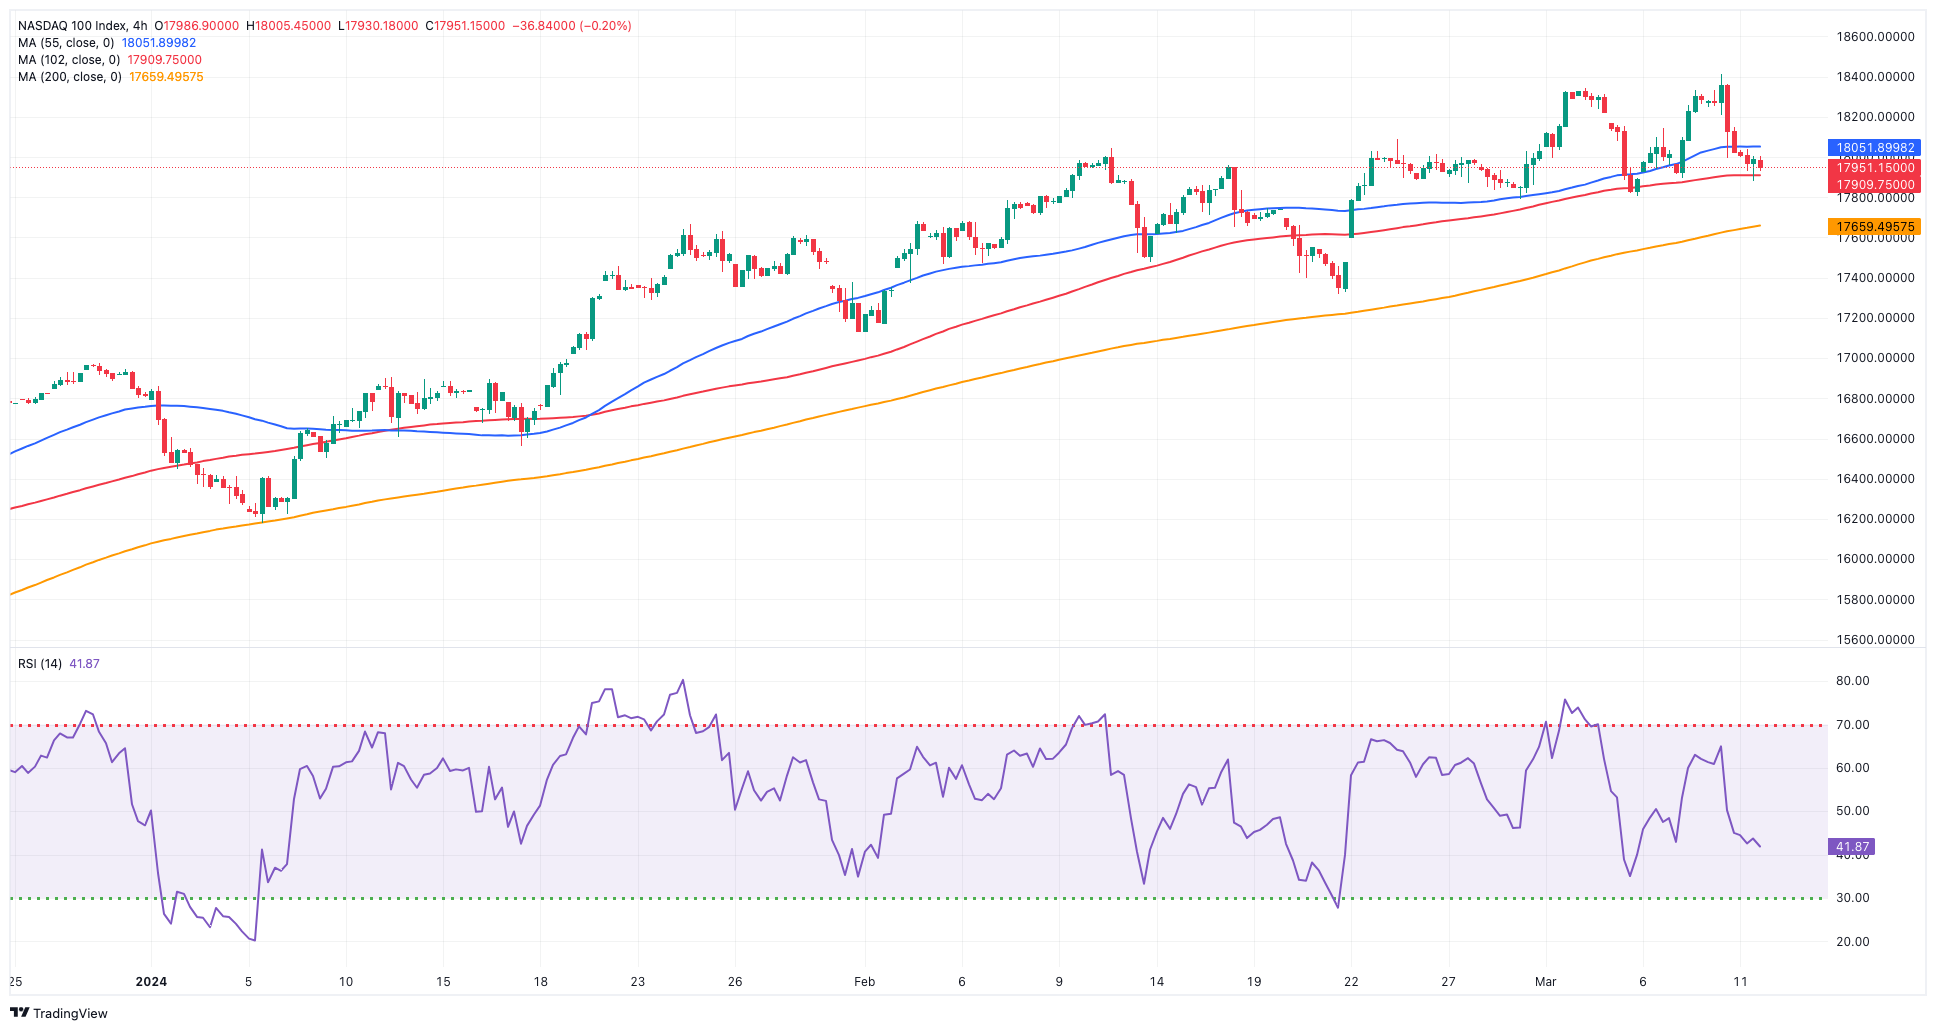
The US tech sector started the week on the back foot, extending Friday’s negative performance and dragging the reference index Nasdaq 100 back below the 18,800 zone.
Further weakness in the Nasdaq 100 followed the modest rebound in the greenback, while the decent bounce in US yields also contributed to Monday’s losses, all amidst the prevailing cautiousness pre-US CPI.
Further rises in the Nasdaq 100 may restore it to its all-time high of 18,416 (March 8). The other way around, the index may retest the transitory 55-day SMA of 17,384 prior to the weekly lows of 17,319 (February 21) and 17,128 (January 31). A breakdown of the latter may lead to a test of the 2024 low of 16,249 (January 5), which comes before the crucial 200-day SMA of 15,803 and the December 2023 low of 15,695 (December 4). Additional losses from here may challenge the October 2023 low of 14,058 (October 26), which comes ahead of the April 2023 level of 12,724 (April 25), the March 2023 low of 11,695 (March 13), and the 2023 low of 10,696 (January 3). The daily RSI declined to about 54.
Top Gainers: Moderna, Charter Communications, Warner Bros Discovery
Top Losers: Marvell, AMD, Meta Platforms
Resistance levels: 18,416 (4H chart)
Support levels: 17,804 17,319 17,128 (4H chart)
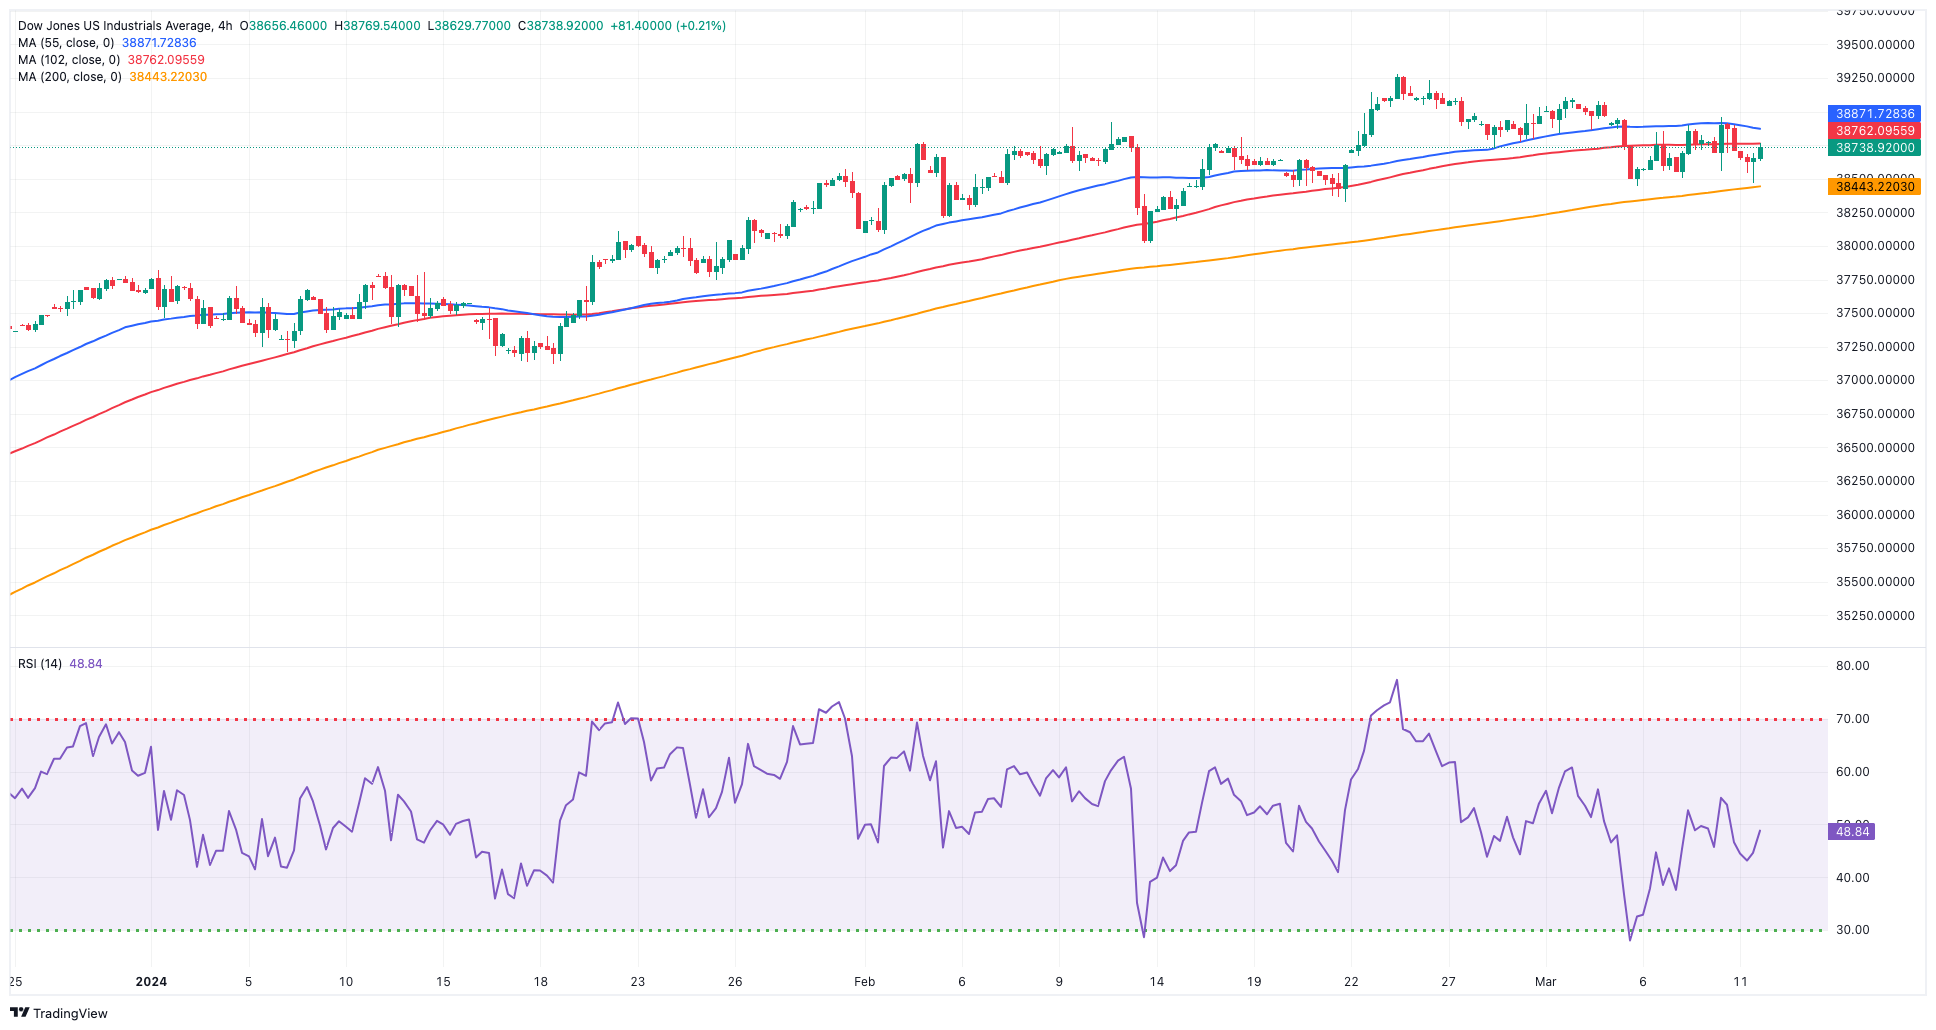
DOW JONES
US stocks tracked by the Dow Jones alternated gains with losses near the 38,800 region at the beginning of the week.
The vacillating price action around the benchmark index came in tandem with increasing prudence ahead of the release of US inflation figures measured by the CPI on Tuesday and the publication of Producer Prices later in the week.
In the meantime, investors continued to factor in the firm likelihood of an interest rate cut by the Fed at its June gathering, seconded by two more rate cuts.
On the latter, and during Chair Powell's semiannual testimonies, he provided insights that further supported the idea of an early start to the easing cycle, likely in the summer. Powell indicated that the Fed is approaching the necessary level of confidence in decreasing inflation, which would lay the groundwork for the initiation of interest rate reductions.
On Monday, the Dow Jones advanced by 0.13% to 38,774, the S&P 500 deflated by 0.05% to 5,121, and the tech-focused Nasdaq Composite retreated by 0.16% to 16,058.
If buyers push harder, the Dow Jones might break its record high of 39,282 (February 23). On the other hand, the 55-day SMA of 38,209 offers interim support, followed by the 2024 low of 37,122 (January 18) and the weekly low of 37,073 (December 20, 2023). If the index falls below this level, it may cross the 100-day SMA at 36,713, which is prior to the 200-day SMA at 35,503. The weekly low of 33,859 (November 7, 2023) follows next, seconded by the October 2023 low of 32,327 (October 27) and the 2023 bottom of 31,429 (March 15). The daily RSI looked stable around 54.
Top Performers: Nike, UnitedHealth, Walt Disney
Worst Performers: Boeing, IBM, Amazon.com
Resistance levels: 39,282 (4H chart)
Support levels: 38,457 38,039 37,122 (4H chart)
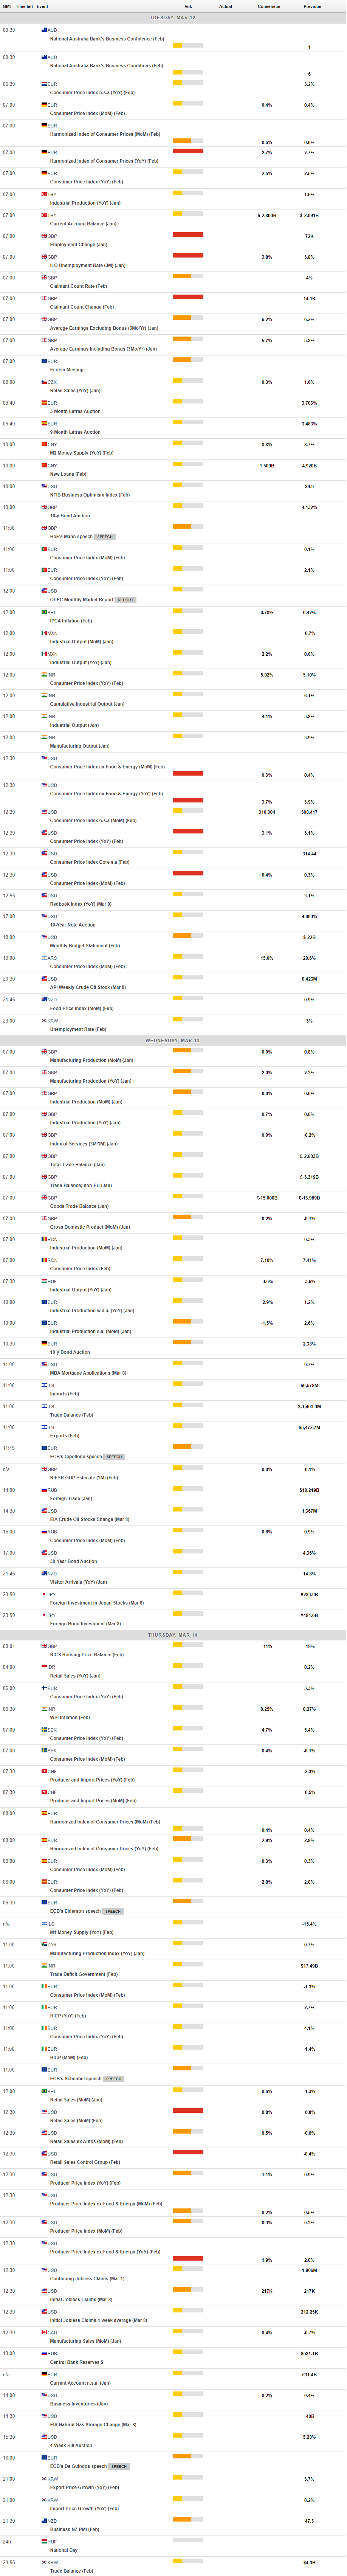
MACROECONOMIC EVENTS
All Information & Updates provided by:

All information relating to the financial markets available on this page has been prepared and issued by FXStreet (Forexstreet SL, Spain, Reg: B62498233) on the basis of publicly available information and all information believed to be reliable and does not conflict with Kuwaiti local laws, and all necessary care has been taken to before the company to ensure that the facts mentioned are correct from the source.
NCM Investment nor any of its directors or employees shall in any way be held responsible for the contents of this news, and the information contained on this page is intended only to provide clients with publicly available information and should not be construed as investment advice, report or analysis and/or constitute an offer or invitation to buy or sell financial instruments of any kind.
RISK WARNING: Forex and CFDs are highly risky leveraged products, as losses can exceed deposits. Please ensure you understand all the risks and take independent advice if necessary. NCM will segregate the clients based on the criteria of the regulator and its bylaws. NCM does not provide any advisory service; the material published does not constitute advice or a recommendation for a transaction in any financial instrument. NCM accepts no responsibility for any use of the content presented and any consequences of that use. Anyone acting on the information provided does so at their own risk.