
- Contact Us:
-

-

-

-


Daily Market Updates
13 Mar 2024
EURUSD
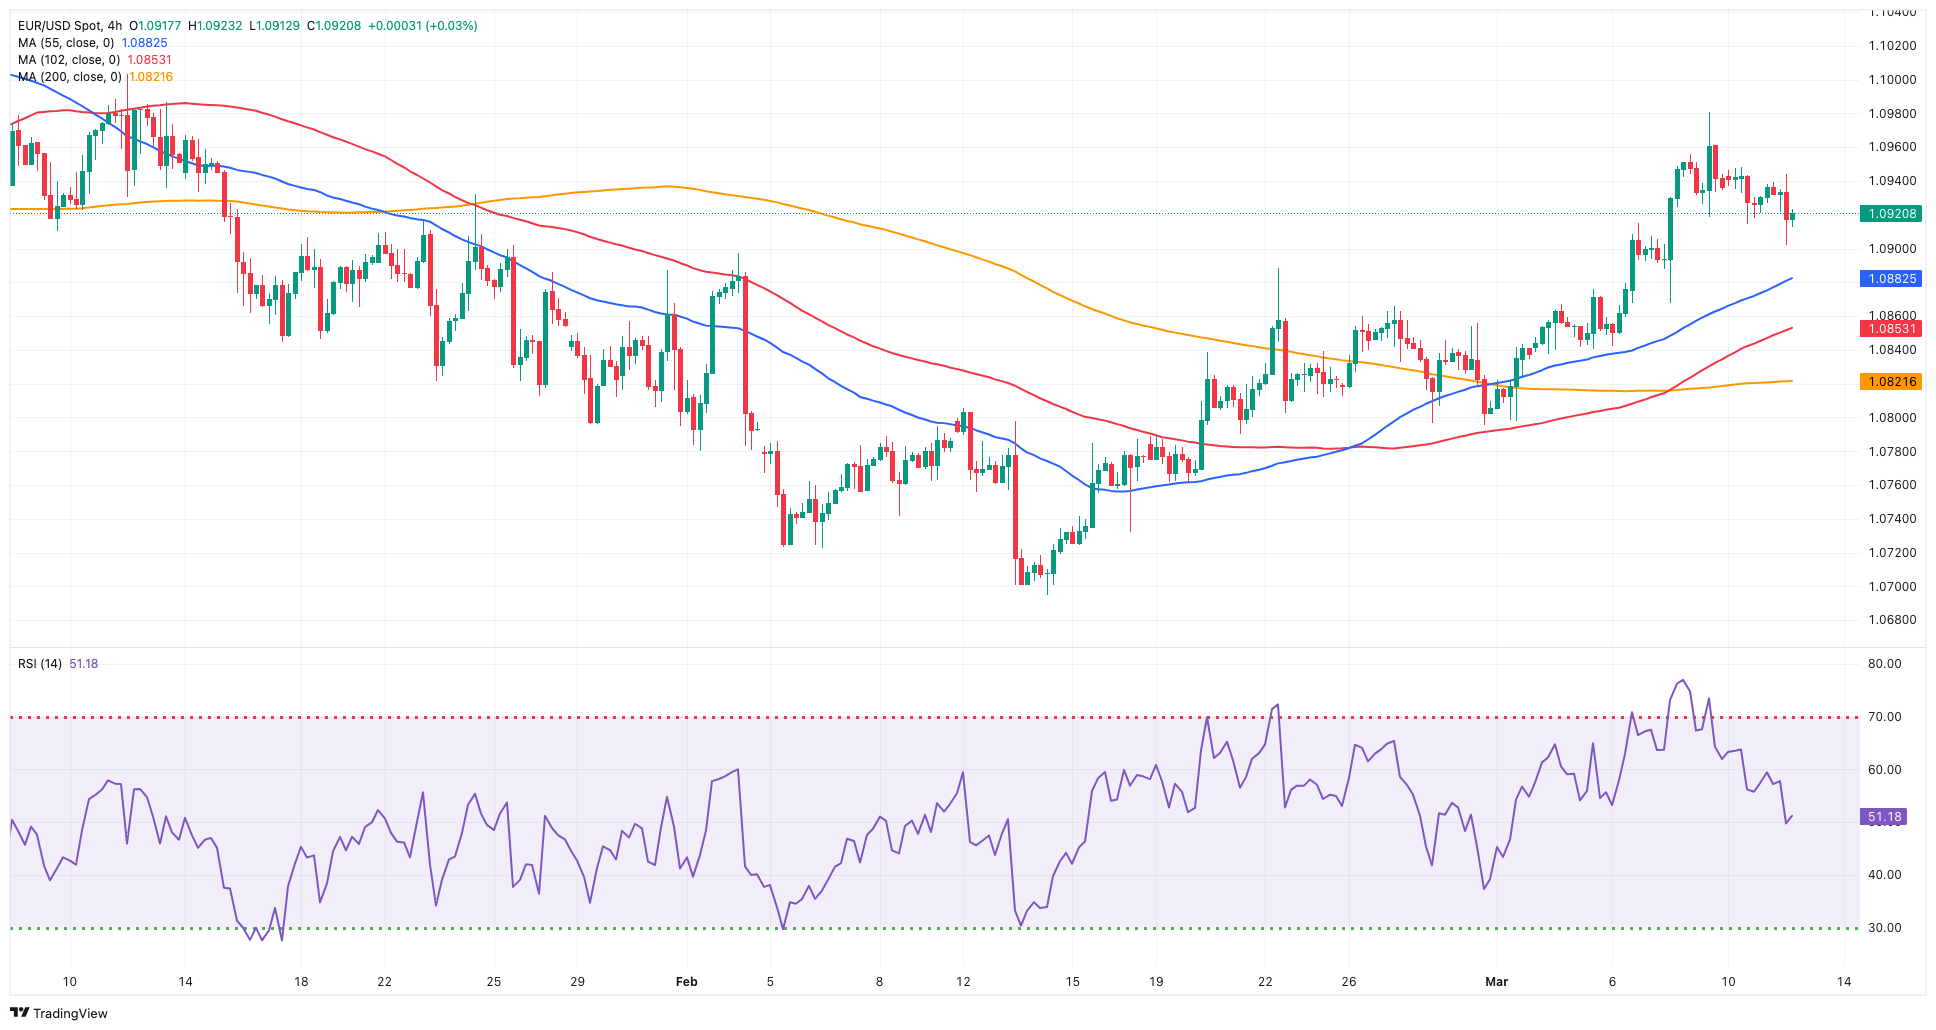
EUR/USD extended its weekly leg lower and put the 1.0900 support to the test on turnaround Tuesday.
Indeed, the greenback saw its upside bias exacerbated along with the move higher in US yields across the curve after US inflation figures tracked by the CPI rose more than estimated during February. Against this backdrop, the USD Index (DXY) rose to the 103.20 region, adding to Monday’s bullish price action.
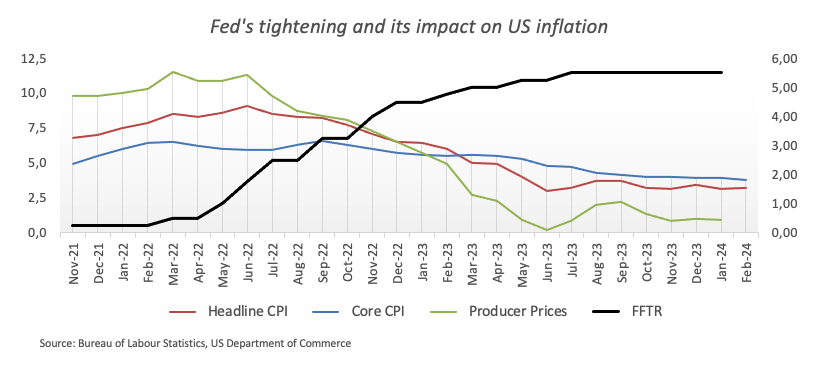
Despite the firmer CPI readings, expectations of an interest rate cut by the Fed at its June 12 event remained well anchored, with a nearly 60% probability, according to CME Group’s FedWatch Tool.
Closer to home, final inflation figures in Germany showed the CPI rising at an annualized 2.5% in February.
Additional US data saw the NFIB Business Optimism Index ease to 89.4 for the month of February.
The initial resistance level for EUR/USD is the March high of 1.0981 (March 8). North of here is the weekly top of 1.0998 (January 5, 2011), which comes before the psychological 1.1000 level. The breakout of this zone may pave the way for a challenge to the December 2023 peak of 1.1139 (December 27), which is supported by the 200-week SMA of 1.1147 and occurs before the 2023 high of 1.1275 (July 18). In contrast, the loss of the 200-day SMA of 1.0835 may pose a challenge to the weekly low of 1.0795 (February 29), which emerges before the 2024 low of 1.0694 (February 14). A further decline might lead to a test of the weekly low of 1.0495 (October 13, 2023), prior to the 2023 low of 1.0448 (October 3), and the round milestone of 1.0400. The daily RSI deflated to the 62 zone.
Resistance levels: 1.0981 1.0998 1.1139 (4H chart)
Support levels: 1.0867 1.0819 1.0795 (4H chart)
USDJPY
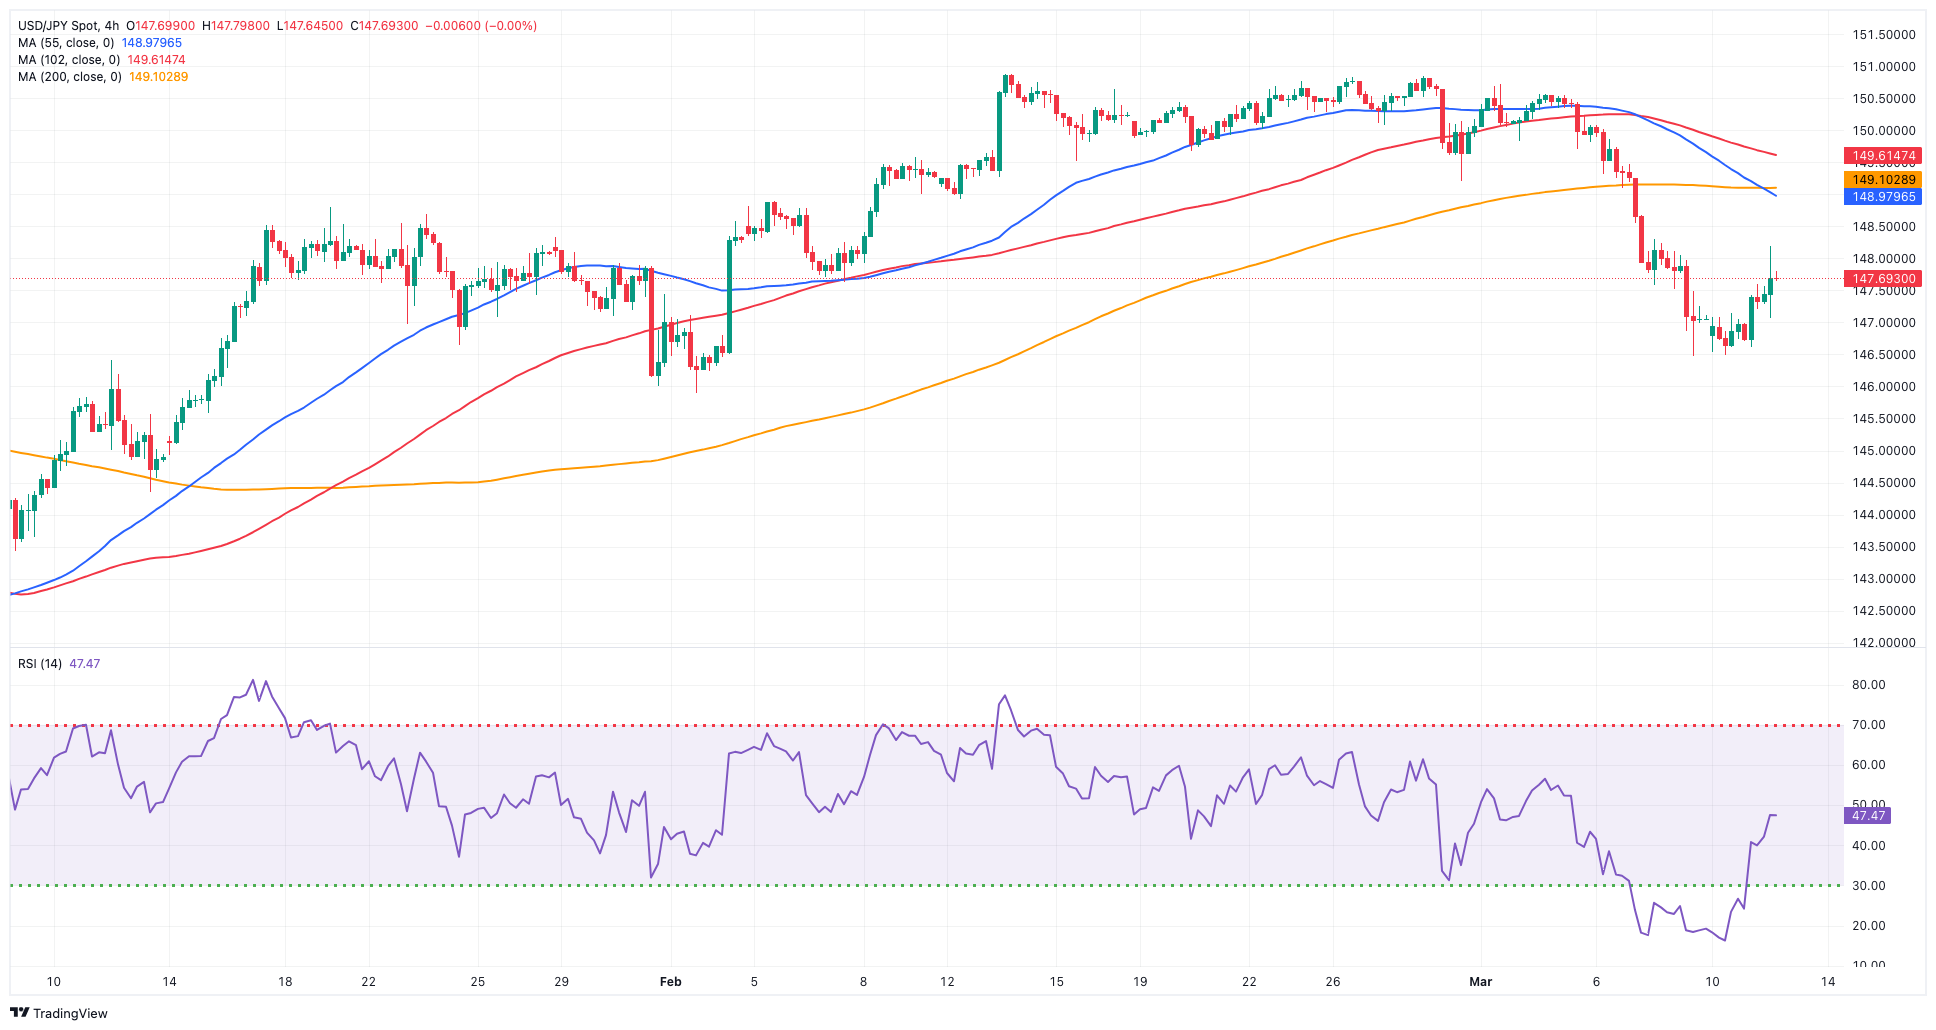
Finally, USD/JPY saw its current decline somewhat mitigated on Tuesday.
The renewed depreciation of the Japanese yen lifted spot to three-day highs in the 148.15/20 band, as investors seem to have pared back some bets regarding a potential BoJ’s lift-off at its event on March 18-19.
The latter appeared underpinned by early comments from Governor Ueda, who stated that adjustments to the negative rate policy, yield curve control, and other easing measures will be considered once the desired goal is within reach. He added that the specific actions and strategies will be contingent upon the economic and price conditions prevailing at that time, further expressing his belief that despite weaknesses observed in certain household spending indicators, the gradual economic recovery persists.
It's worth noting that the market still assigns nearly 65% probability to a hike next week, although this estimate appears overly optimistic considering the recent softness in economic data.
Also collaborating with the upward bias in the pair emerged an extra recovery in the dollar as well as the continuation of the upside momentum in US yields across the curve.
In Japan, Producer Prices rose by 0.2% MoM in February and 0.6% from a year earlier. Finally, the BSI Large Manufacturing index eased by 6.7% QoQ in Q1.
If bears apply more pressure, USD/JPY may retest the crucial 200-day SMA around 146.23, which precedes the February low of 145.89 (February 1). Once this zone is cleared, the pair should find support at the December 2023 low of 140.24 (December 28), which is before to the round number 140.00 and the July low of 137.23 (July 14). On the contrary, the nearest upside hurdle is the 2024 top of 150.88 (February 13), ahead of the 2023 peak of 151.90 (November 13). The 2022 high of 151.94 (October 21) is immediately followed by the round number 152.00. The daily RSI rebounded past 41.
Resistance levels: 148.15 149.10 150.88 (4H chart)
Support levels: 146.47 145.89 144.34 (4H chart)
GBPUSD
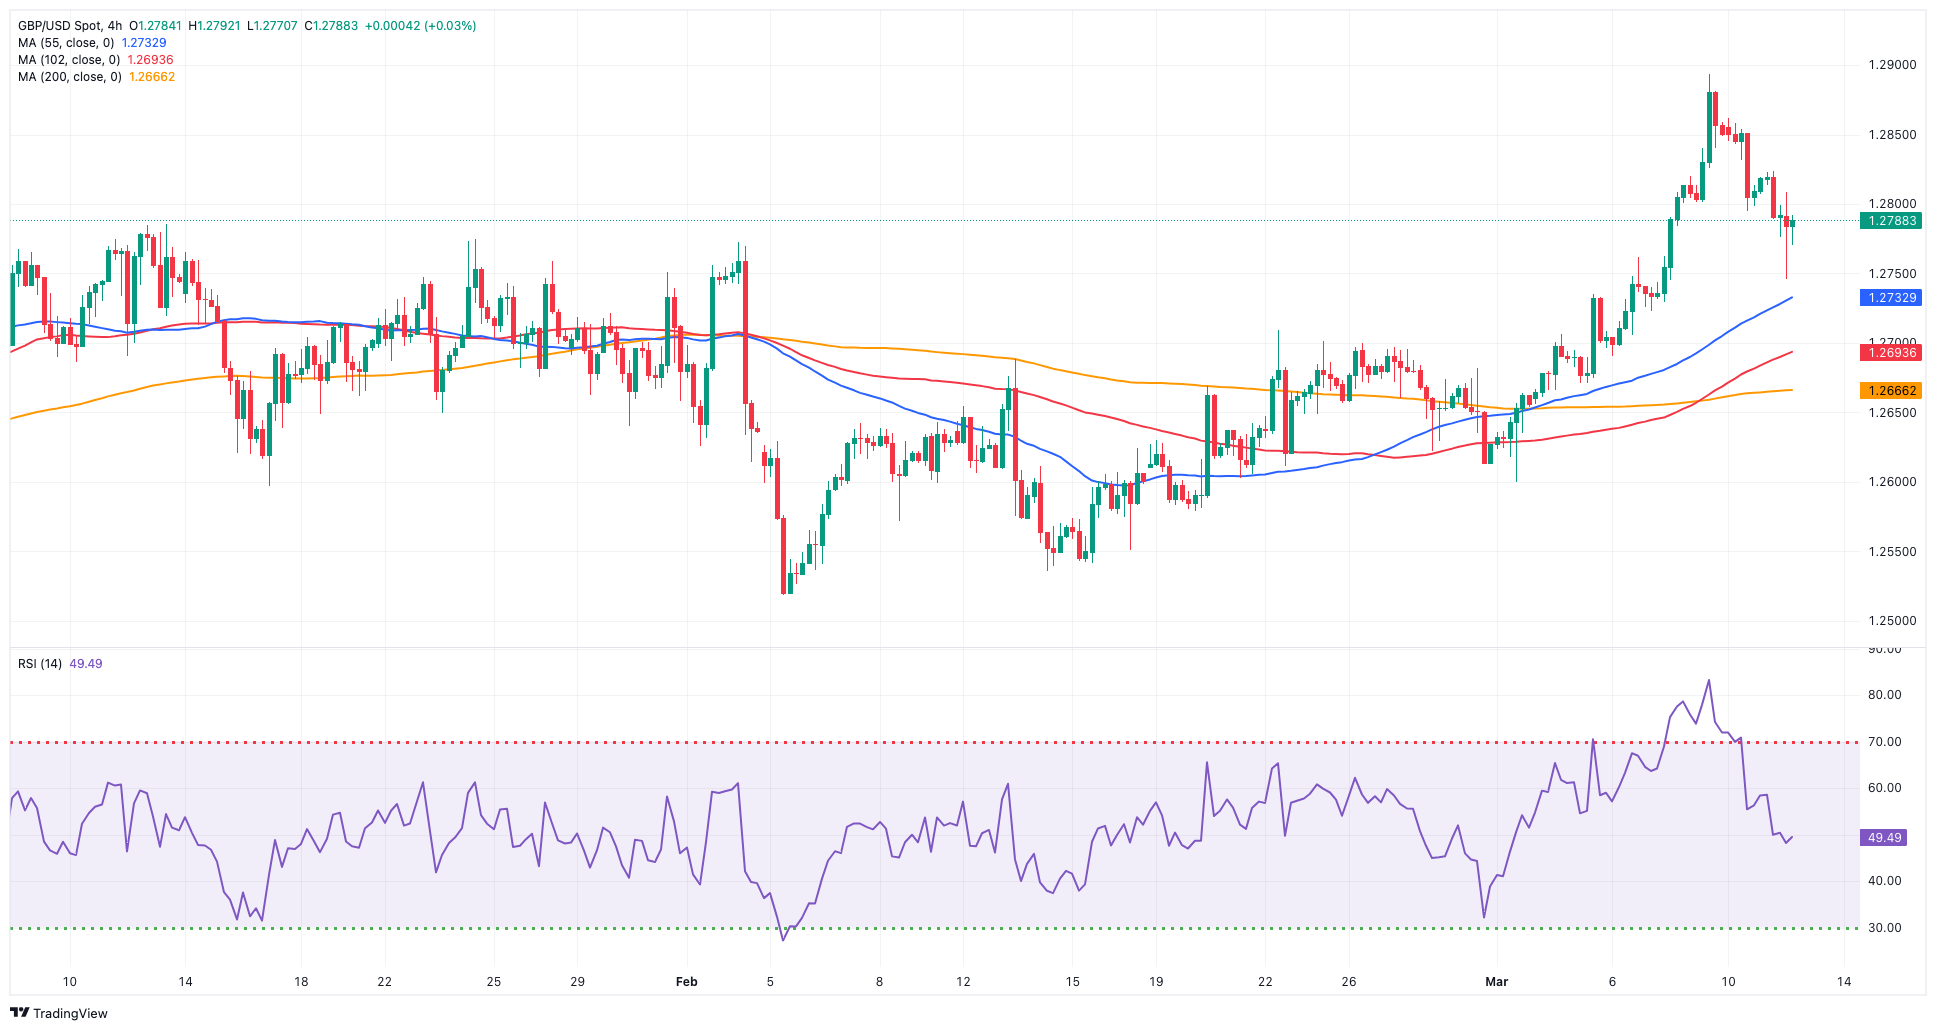
Further recovery in the greenback kept the risk complex on the backfoot and dragged GBP/USD to the area of three-day lows near 1.2740 on Tuesday.
In fact, Cable extended its weekly corrective move on the back of extra improvement in the dollar along with US yields, particularly after US CPI came in above estimates in February.
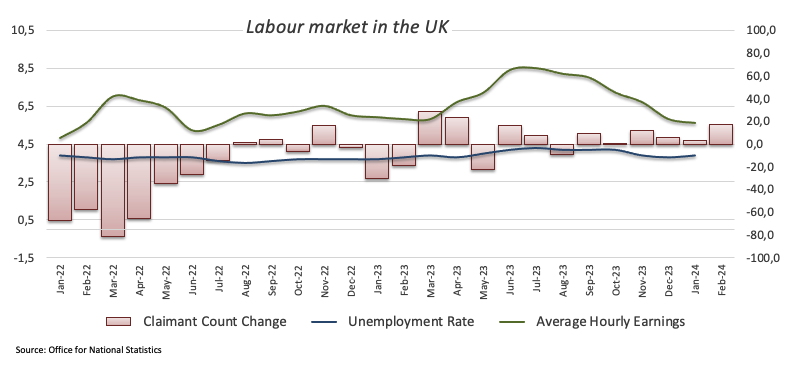
Also weighing on the quid emerged the broad-based discouraging prints from the UK jobs report, where the unemployment rate ticked higher to 3.9% in January and the employment change shrank by 21K individuals also in the first month of the year. In addition, average earnings inc. bonus expanded by 5.6% in the year to January, and the claimant count change increased by 16.8K people.
The pair’s second pullback in a row was accompanied by a drop in UK 10-year gilts to levels last seen in early February, around 3.90%.
The next upward hurdle for GBP/USD is the 2024 top of 1.2893 (March 8), followed by the weekly peak of 1.2995 (July 27, 2023), all anticipating the important 1.3000 yardstick. In the opposite direction, bearish trends may push the pair to the preliminary 55-day SMA at 1.2684 before hitting the March low of 1.2599 (March 1) and the critical 200-day SMA at 1.2584. The loss of this zone may put the 2024 low of 1.2518 (February 5) back into focus, before the December 2023 low of 1.2500 (December 13). A deeper pullback should not see any support of note until the weekly low of 1.2187 (November 10, 2023), followed by the October 2023 bottom of 1.2037, the key 1.2000 barrier, and the 2023 low of 1.1802 (March 8). On the daily chart, the RSI dropped to the 61 mark.
Resistance levels: 1.2893 1.2995 1.3142 (4H chart)
Support levels: 1.2745 1.2664 1.2599 (4H chart)
GOLD
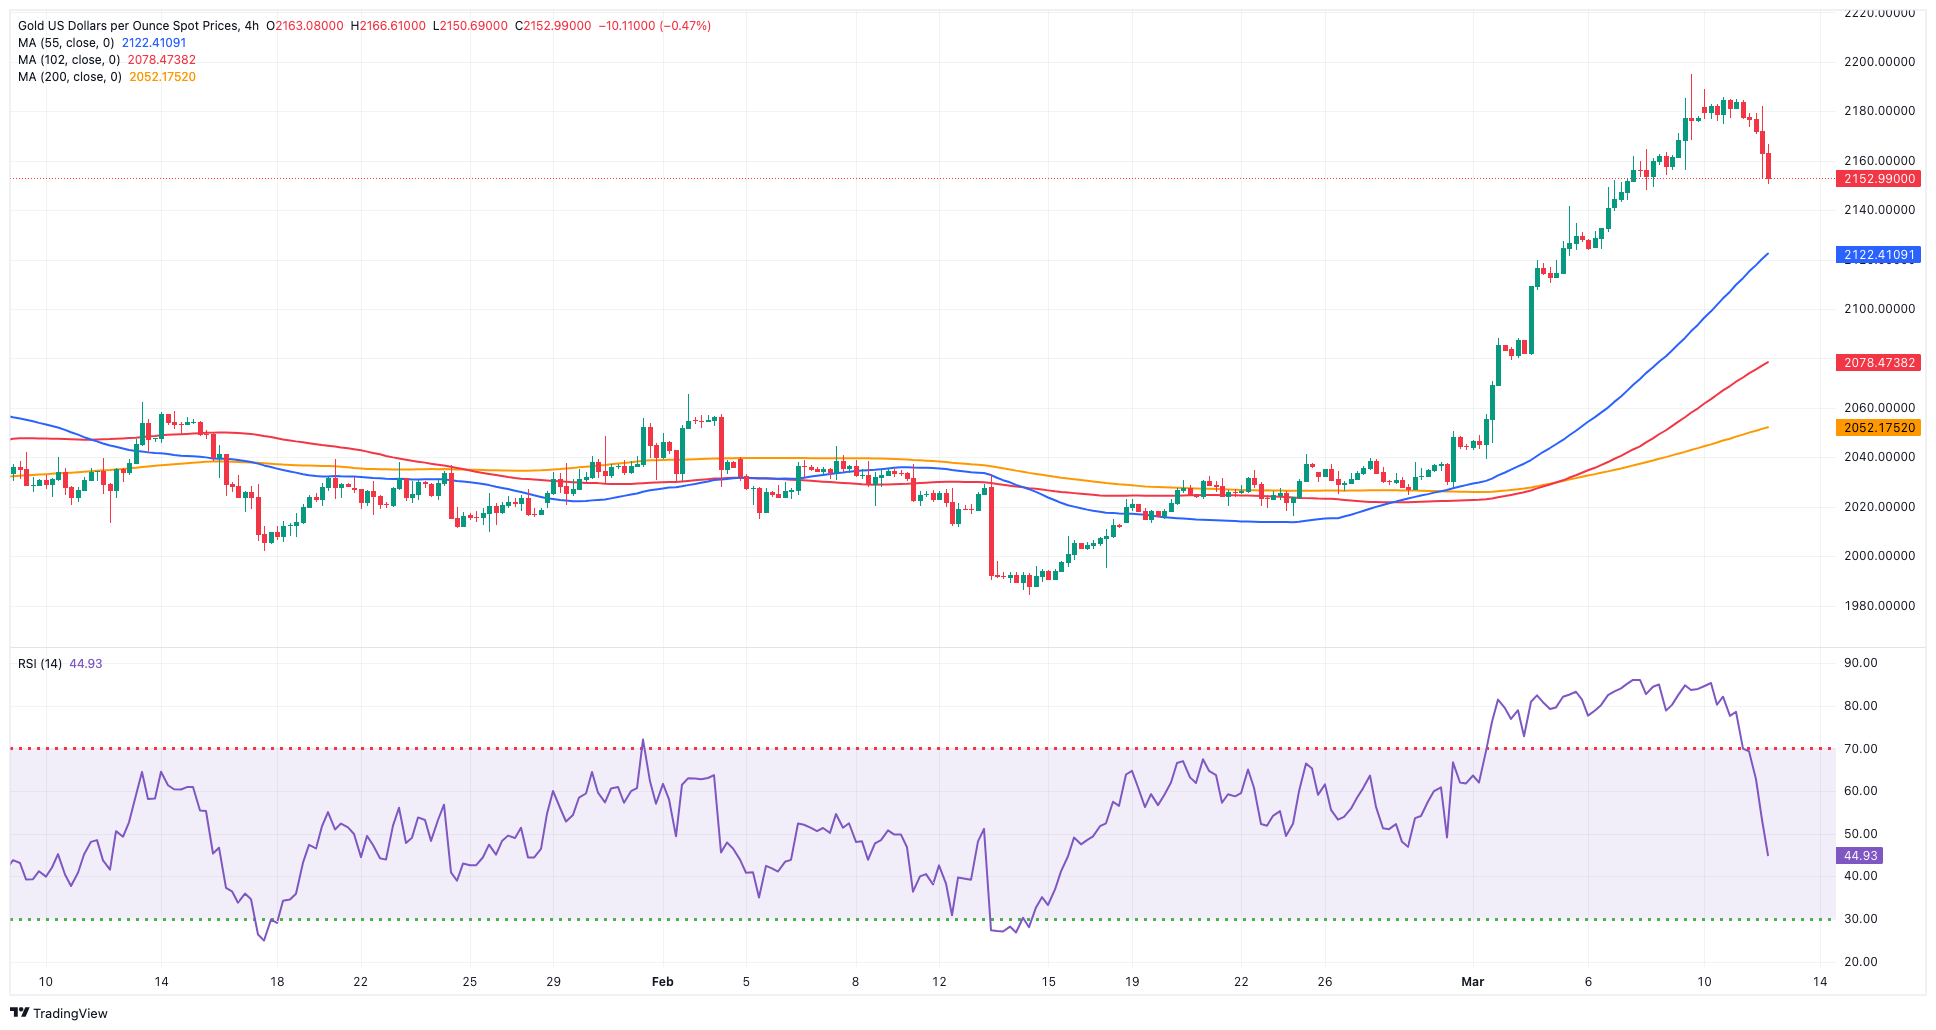
Finally, some correction seems to have emerged around the precious metal, with prices of the troy ounce receding to the $2,150 zone after nine consecutive sessions of gains.
The daily pullback in bullion came in tandem with the stronger dollar and further upside in US yields across the board, a trend that was exacerbated after the US CPI surprised to the upside in February.
In the meantime, dynamics around the greenback and the potential timing of the Fed’s first interest rate cut are expected to remain on the fore when it comes to drivers of the metal’s price action.
Gold hit an all-time high of $2,195 on March 8. On the other hand, the 55-day and 100-day SMAs of $2,046 and $2,024 should provide interim support, followed by the 2024 low of $1,984 (February 14) and the December 2023 low of $1,973, which is supported by its proximity to the critical 200-day SMA of $1,973 and precedes the November 2023 low of $1,931. The breach of the latter may prompt bullion to retest its October 2023 low of $1,810, which preceded the 2023 low of $1,804 and the important $1,800 conflict zone.
Resistance levels: $2,195 (4H chart)
Support levels: $2,152 $2,121 $2,052 (4H chart)
CRUDE WTI
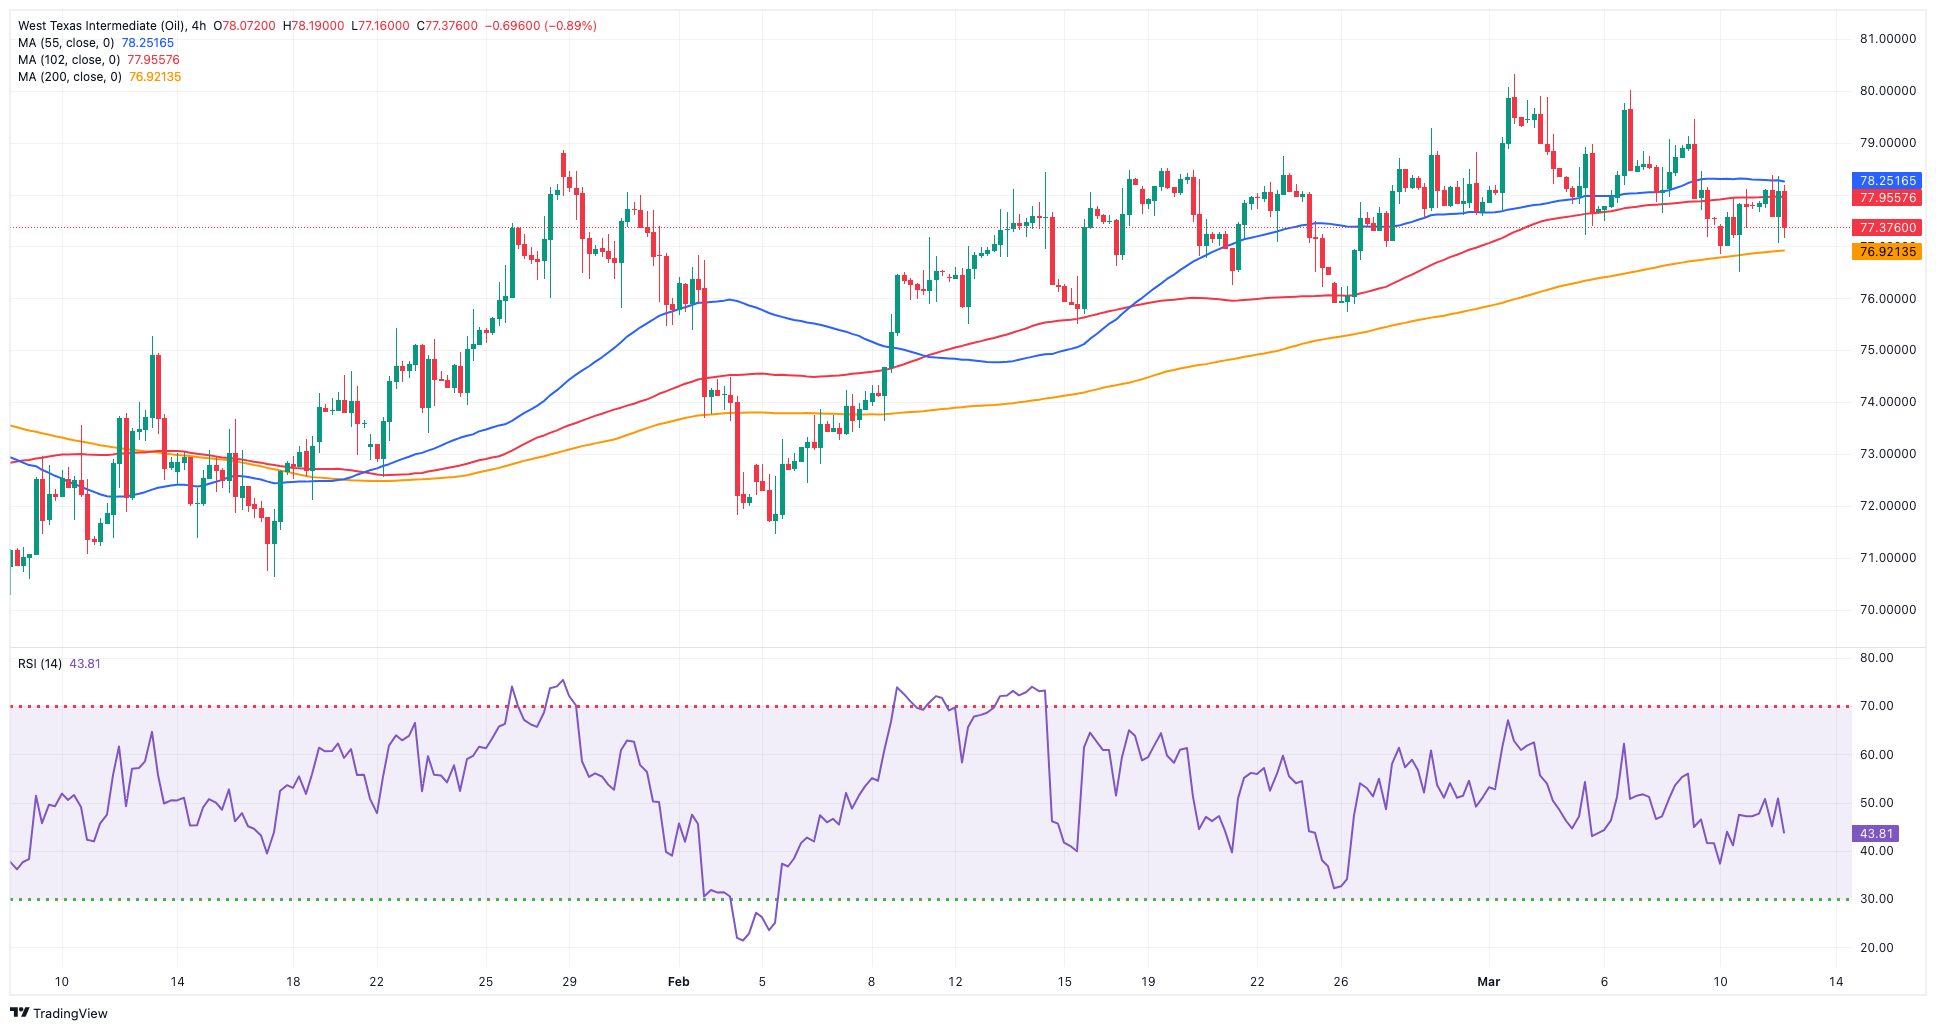
WTI prices edged higher and maintained Monday’s optimism in place, navigating the $78.00 region per barrel on Tuesday, an area coincident with the key 200-day SMA.
Daily gains in crude oil came despite further recovery in the greenback on the back of stickier inflation figures and continuing geopolitical tensions while OPEC’s upbeat assessment of the market also contributed to the upside momentum.
On the latter, the cartel kept its outlook for robust growth in global oil demand for 2024 and 2025 while also revising its economic growth projection for the current year upwards, indicating room for further improvement. According to the OPEC monthly report, it anticipates a rise in world oil demand by 2.25 bpd this year and by 1.85 mbpd in 2025, consistent with the previous month's projections, while its latest assessment suggests a world economic growth rate of 2.8% for 2024, underpinned by expectations of ongoing moderation in general inflation throughout this year. The forecast for the following year remains unchanged at 2.9%.
Later in the week, the EIA will release its weekly report on US crude oil inventories for the week ended March 8.
The next upward challenge for WTI is the 2024 peak of $80.82 (March 1), which comes before the weekly high of $89.83 (October 18, 2023) and the 2023 top of $94.99 (September 28, 2023). Further north, the weekly peak of $97.65 (August 30) arrives before the psychological $100.00 mark. Having said that, the 100-day and 55-day SMAs should provide provisional support at $75.90 and $75.48, respectively, before sliding to the February low of $71.43 (February 5). Extra losses highlight the important $70.00 milestone ahead of the 2024 low of $69.31 (January 3).
Resistance levels: $80.82 $83.56 $85.85 (4H chart)
Support levels: $76.76 $75.81 $71.37 (4H chart)
GER40
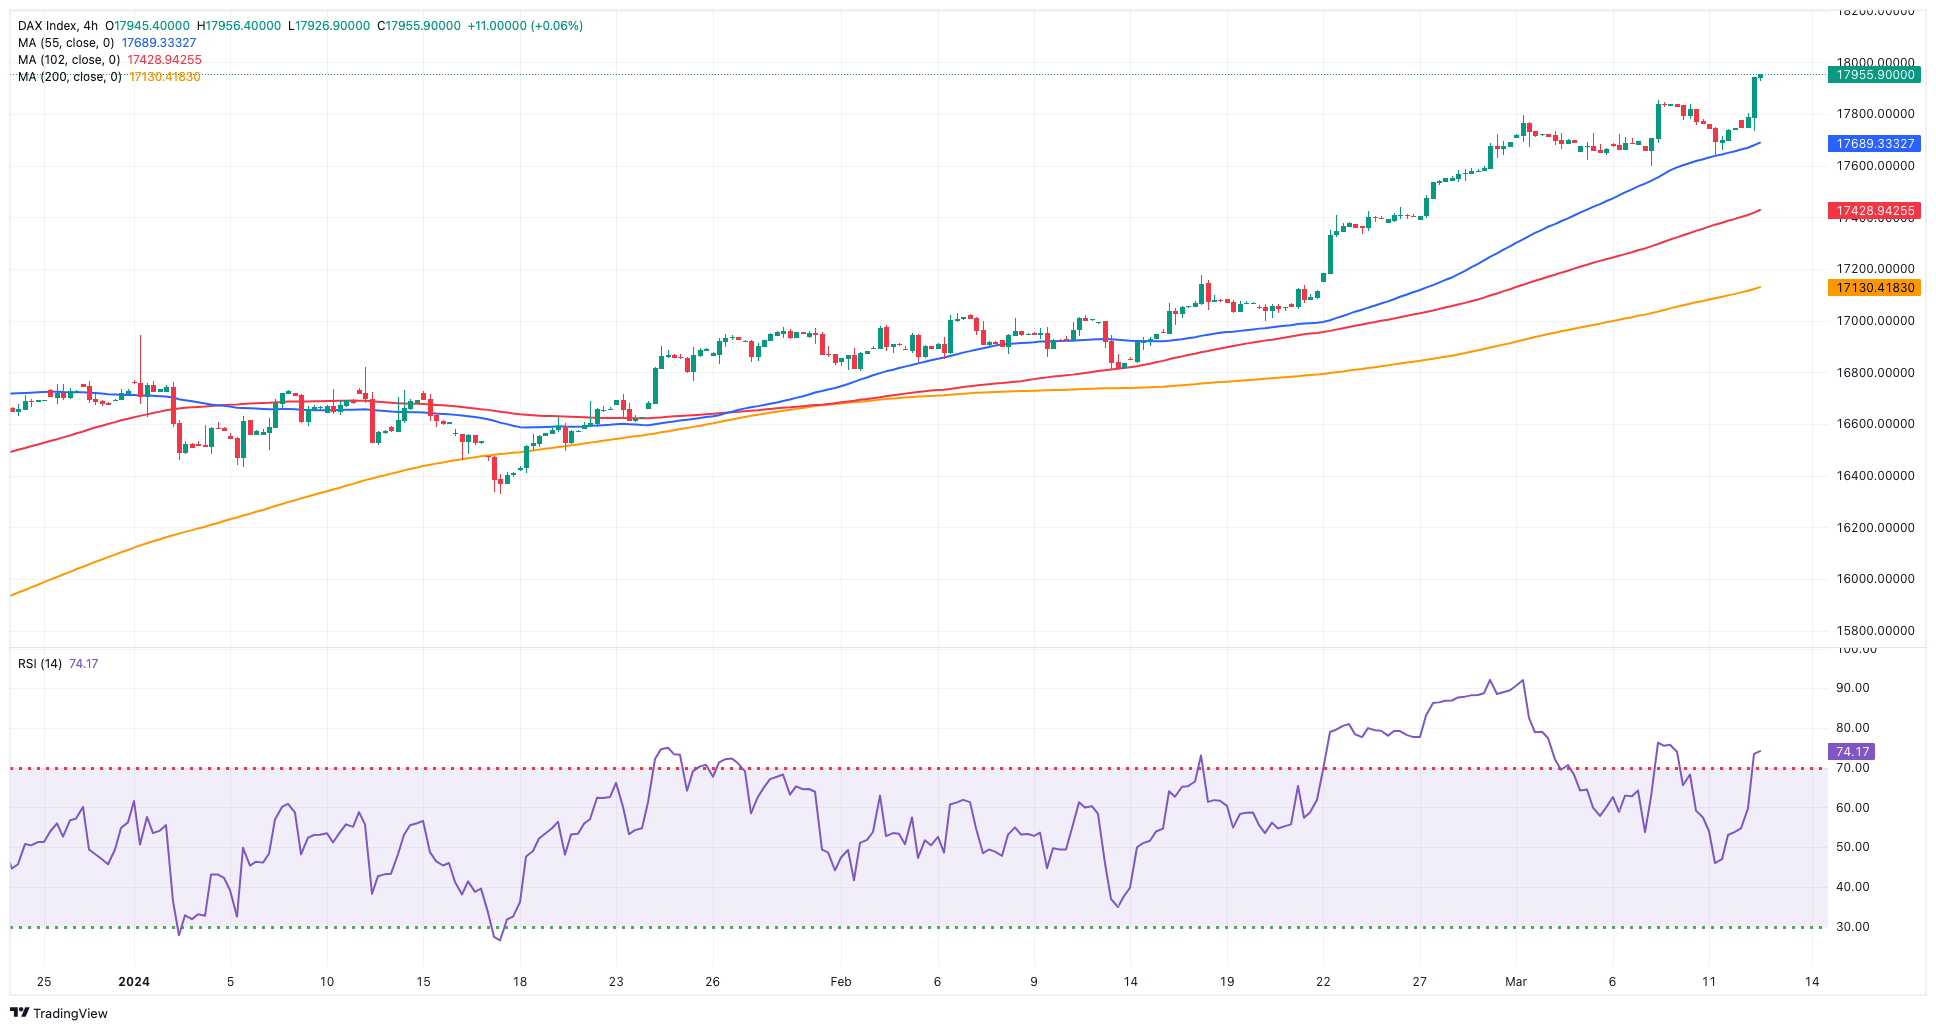
European stocks ended Tuesday's trading session at an all-time high, driven primarily by gains in the automotive and banking sectors.
By the same token, Germany’s benchmark DAX40 rose to an all-time peak in levels just shy of the key 18,000 barrier on Tuesday.
In the meantime, investors maintained their expectations of a Fed’s interest rate cut in June after US CPI rose more than expected in February. In the same line, final inflation readings in Germany showed confirmed consumer prices gained 2.5% in the year to February, also bolstering the prospects of an ECB rate reduction in the summer.
In tandem with the uptick in the DAX40, German 10-year bund yields advanced to three-day highs near 2.35%.
The DAX40's next resistance level is the record high of 17,973 (March 12). The 55-day SMA at 17,027 should give transitory support before the February low of 16,821 (February 1). If the index breaks below this zone, it might put a potential test of the 2024 bottom at 16,345 (January 17) back on the radar prior to the key 200-day SMA at 16,143. A deeper retracement could see the weekly low is 15,915 (November 28) revisited ahead of the October 2023 low of 14,630 (October 23) and the 2023 low of 14,458 (March 20). The daily RSI rose above 77, indicating that the market remained markedly overbought.
Best Performers: Dr Ing hc F Porsche Prf, Deutsche Bank AG, Porsche
Worst Performers: MTU Aero, E.ON SE, Vonovia
Resistance levels: 17,973 (4H chart)
Support levels: 17,619 16,970 16,831 (4H chart)
GBPJPY
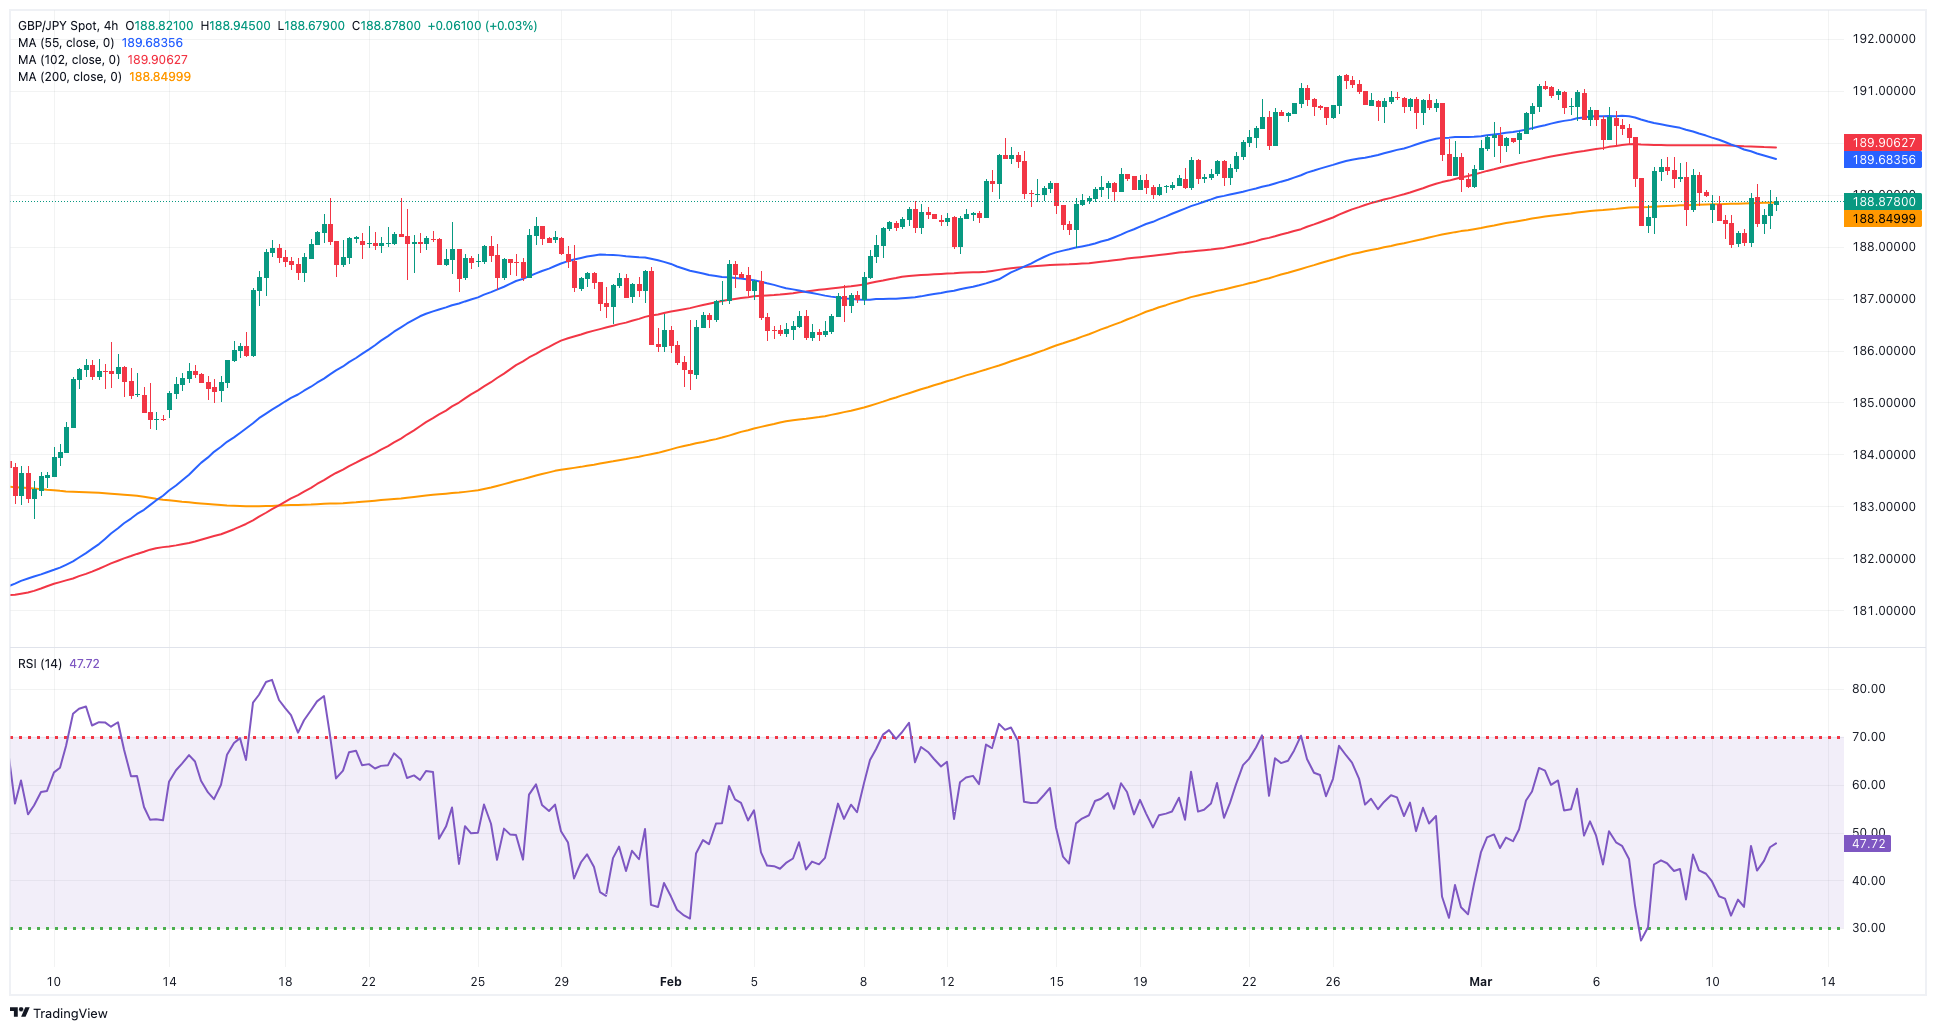
GBP/JPY finally managed to leave behind, albeit partially, its multi-session leg lower and rebounded markedly on Tuesday, all after retesting four-week lows in the sub-188.00 zone.
The corrective upside in the cross came in response to the renewed selling pressure hurting the Japanese yen, which offset the strong decline in the British pound in a context dominated by further gains in the greenback.
Supporting the downward bias in the yen emerged shrinking bets on a potential exit of the BoJ’s ultra-accommodative stance at its next event on March 18–19.
The March low of 187.96 (March 11) is the next immediate contention for GBP/JPY, prior to the intermediate 55-day and 100-day SMAs of 187.23 and 185.92, respectively. The breach of the latter might open the way for a move to the February low of 185.22 (February 1), ahead of the more important 200-day SMA at 184.01 and the December 2023 low of 178.33 (December 14). Further south, the October 2023 low of 178.03 is followed by the July 2023 low of 176.30. On the flip side, the initial resistance is located at the 2024 peak of 191.32 (February 26), seconded by the August 2015 high of 195.28 (August 18) and the record top of 195.88 (June 24, 2015). The daily RSI rebounded beyond the 48 level.
Resistance levels: 189.20 189.72 191.19 (4H chart)
Support levels: 187.96 186.44 185.22 (4H chart)
NASDAQ
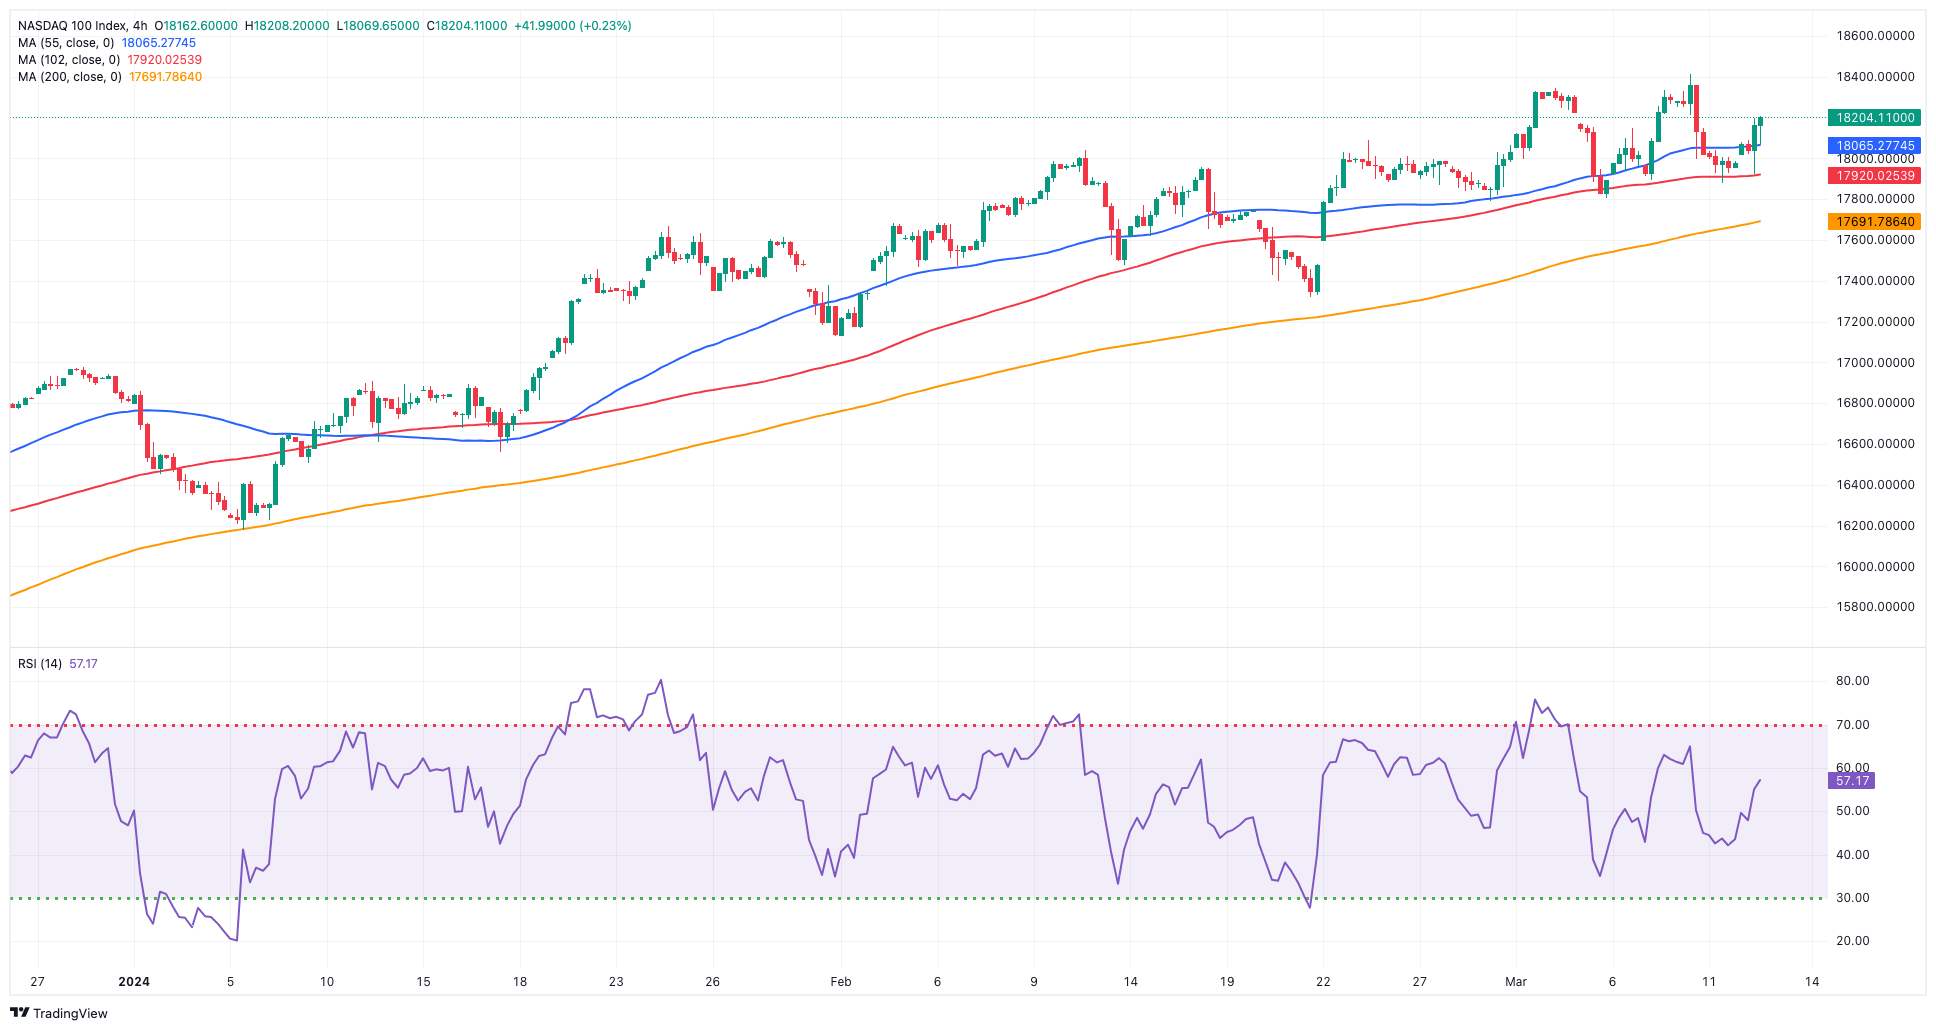
The key tech reference Nasdaq 100 reversed two consecutive sessions of losses and advanced markedly on Tuesday.
The strong comeback of the tech index was underpinned by the extra conviction of the Fed’s rate reduction at its June 12 gathering and came despite the firmer tone in the greenback and the continuation of the march north in US yields across different timeframes.
Further gains might encourage the Nasdaq 100 to confront its all-time high of 18,416 (March 8). The other way around, the index should meet transitory contention at the 55-day SMA of 17,413 before the weekly lows of 17,319 (February 21) and 17,128 (January 31). Once the latter is cleared, the index could challenge the 2024 low of 16,249 (January 5), which is just before the critical 200-day SMA of 15,825 and the December 2023 low of 15,695 (December 4). Additional losses from here may test the October 2023 low of 14,058 (October 26), prior to the April 2023 low of 12,724 (April 25), the March 2023 low of 11,695 (March 13), and the 2023 low of 10,696 (January 3). The daily RSI bounced to the vicinity of 58.
Top Gainers: PDD Holdings DRC, NVDA, CrowdStrike Holdings
Top Losers: Illumina, Sirius XM, Warner Bros Discovery
Resistance levels: 18,416 (4H chart)
Support levels: 17,804 17,319 17,128 (4H chart)
DOW JONES
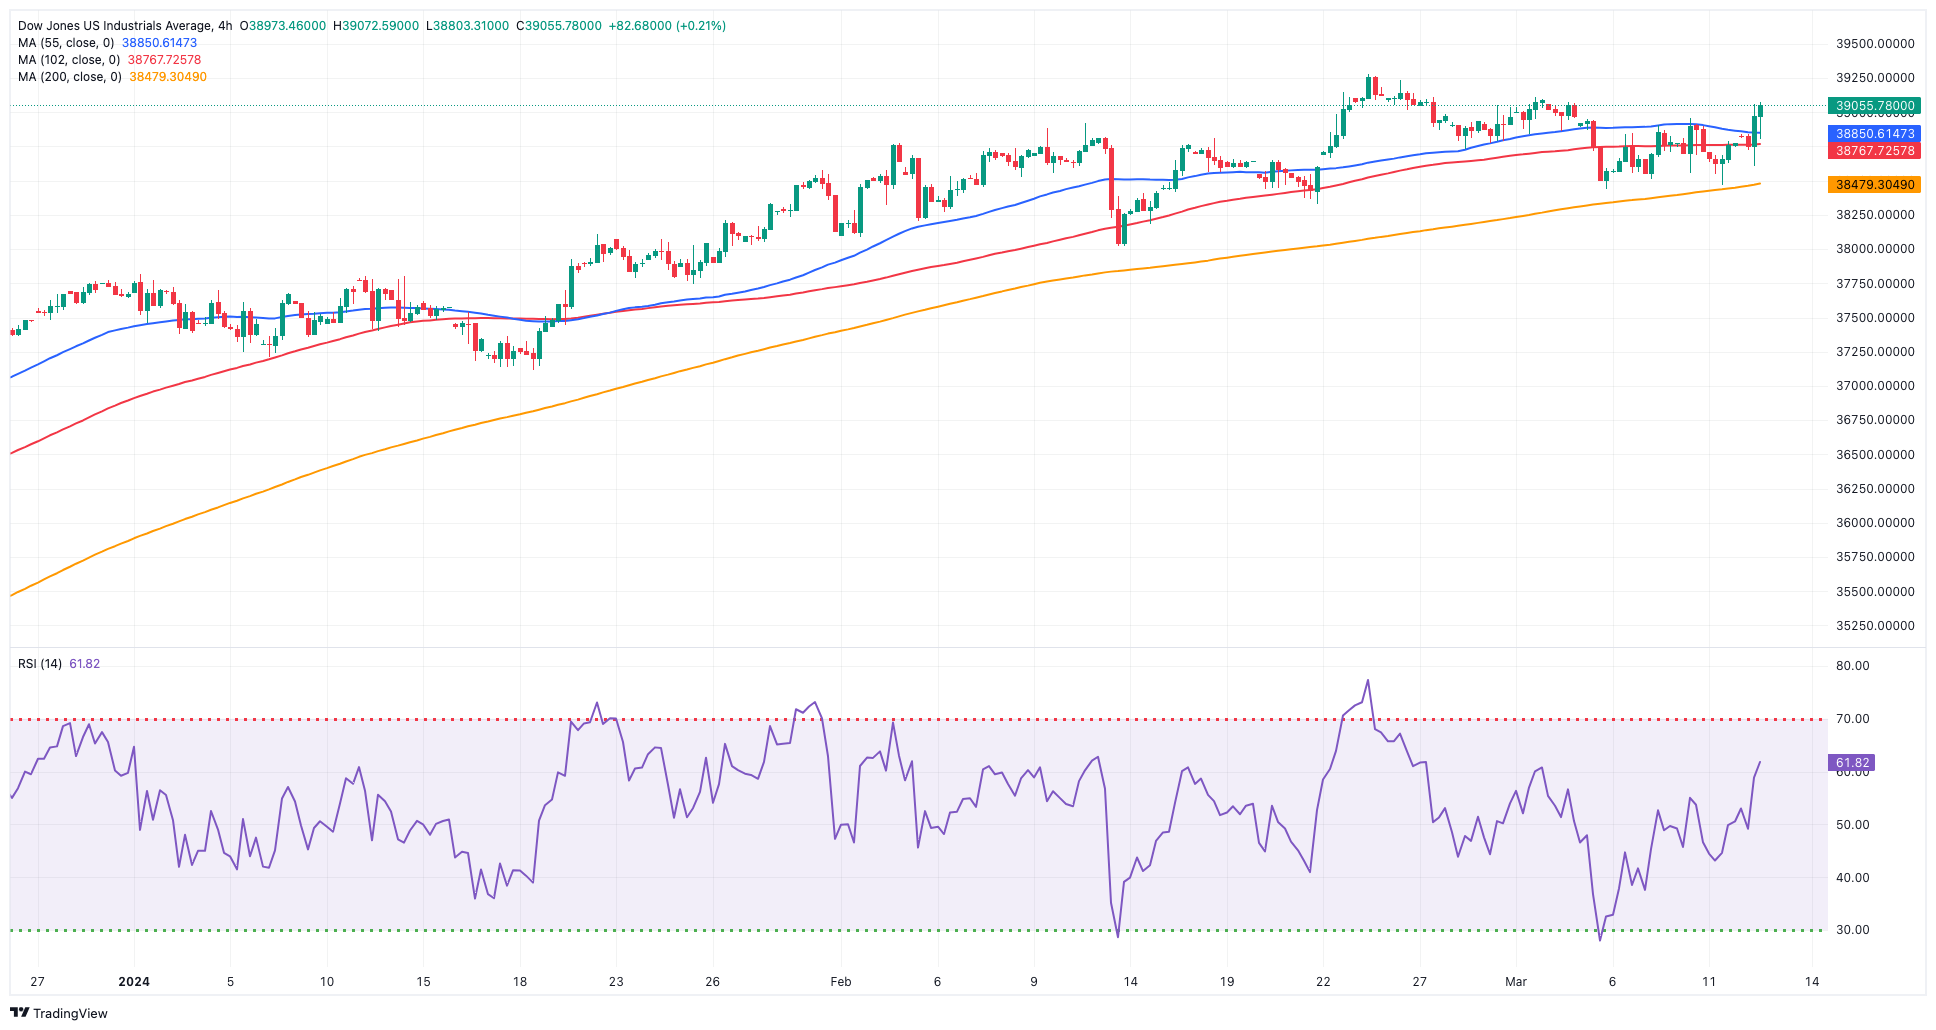
Investors extended Monday’s optimism and lifted the stock benchmark Dow Jones back above the key 39,000 hurdle on turnaround Tuesday.
Extra gains in US equities were propped up by firm bets that the Fed might start its easing cycle in June, a view that was reinvigorated following sticky US inflation figures gauged by the CPI for the month of February.
On this, the probability of the above-mentioned scenario rose above 60%, according to the FedWatch Tool tracked by CME Group.
Still around a Fed’s rate cut, and during Chief Powell's semiannual testimonies last week, he offered additional insights that bolstered the notion of an early commencement of the easing cycle, potentially in the summer. Powell indicated that the Federal Reserve is nearing the requisite level of confidence in reducing inflation, which would serve as a foundation for initiating interest rate cuts.
All in all, the Dow Jones rose by 0.66% to 39,023, the S&P 500 advanced by 0.99% to 5,168, and the tech-heavy Nasdaq Composite gained 1.20% to 16,212.
If buyers push harder, the Dow Jones might break its record high of 39,282 (February 23). On the other hand, the 55-day SMA of 38,209 provides intermediate support, followed by the 2024 low of 37,122 (January 18) and the weekly low of 37,073 (December 20, 2023). If the index goes below this level, it may breach the 100-day SMA at 36,713, which comes before the 200-day SMA at 35,503. The weekly low of 33,859 (November 7, 2023) comes next, followed by the October 2023 low of 32,327 (October 27) and the 2023 bottom of 31,429 (March 15). The daily RSI seems to be constant at approximately 54.
Top Performers: 3M, IBM, Microsoft
Worst Performers: Boeing, Nike, Honeywell
Resistance levels: 39,282 (4H chart)
Support levels: 38,457 38,039 37,122 (4H chart)
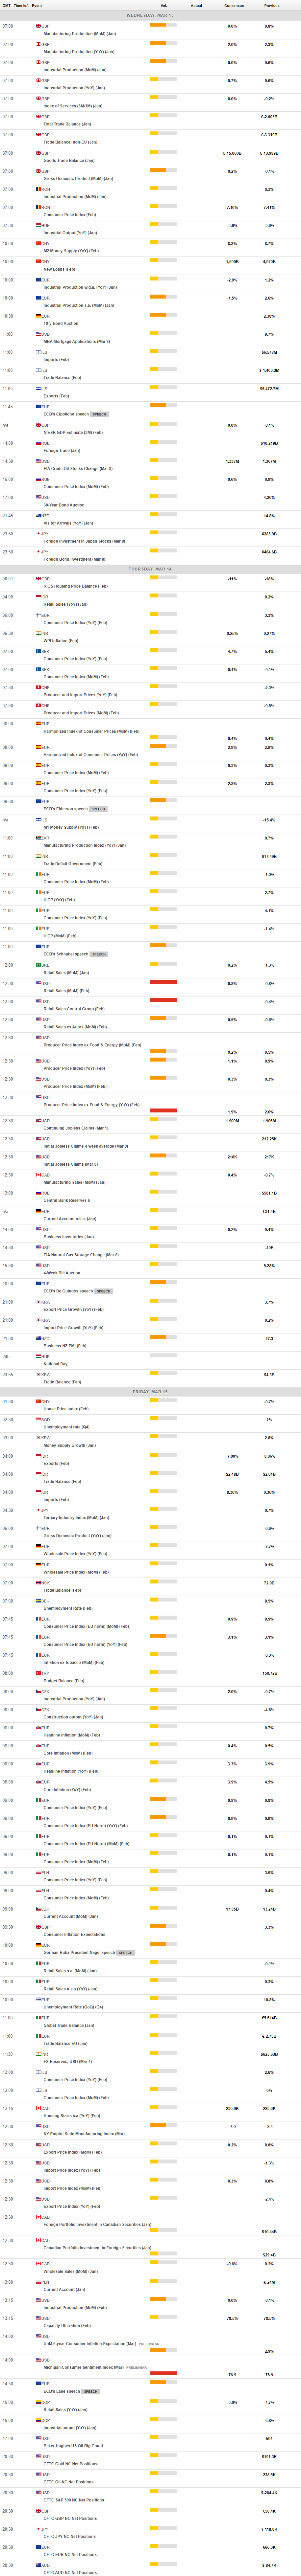
MACROECONOMIC EVENTS
All Information & Updates provided by:

All information relating to the financial markets available on this page has been prepared and issued by FXStreet (Forexstreet SL, Spain, Reg: B62498233) on the basis of publicly available information and all information believed to be reliable and does not conflict with Kuwaiti local laws, and all necessary care has been taken to before the company to ensure that the facts mentioned are correct from the source.
NCM Investment nor any of its directors or employees shall in any way be held responsible for the contents of this news, and the information contained on this page is intended only to provide clients with publicly available information and should not be construed as investment advice, report or analysis and/or constitute an offer or invitation to buy or sell financial instruments of any kind.
RISK WARNING: Forex and CFDs are highly risky leveraged products, as losses can exceed deposits. Please ensure you understand all the risks and take independent advice if necessary. NCM will segregate the clients based on the criteria of the regulator and its bylaws. NCM does not provide any advisory service; the material published does not constitute advice or a recommendation for a transaction in any financial instrument. NCM accepts no responsibility for any use of the content presented and any consequences of that use. Anyone acting on the information provided does so at their own risk.