
- Contact Us:
-

-

-

-


Daily Market Updates
14 Mar 2024
EURUSD
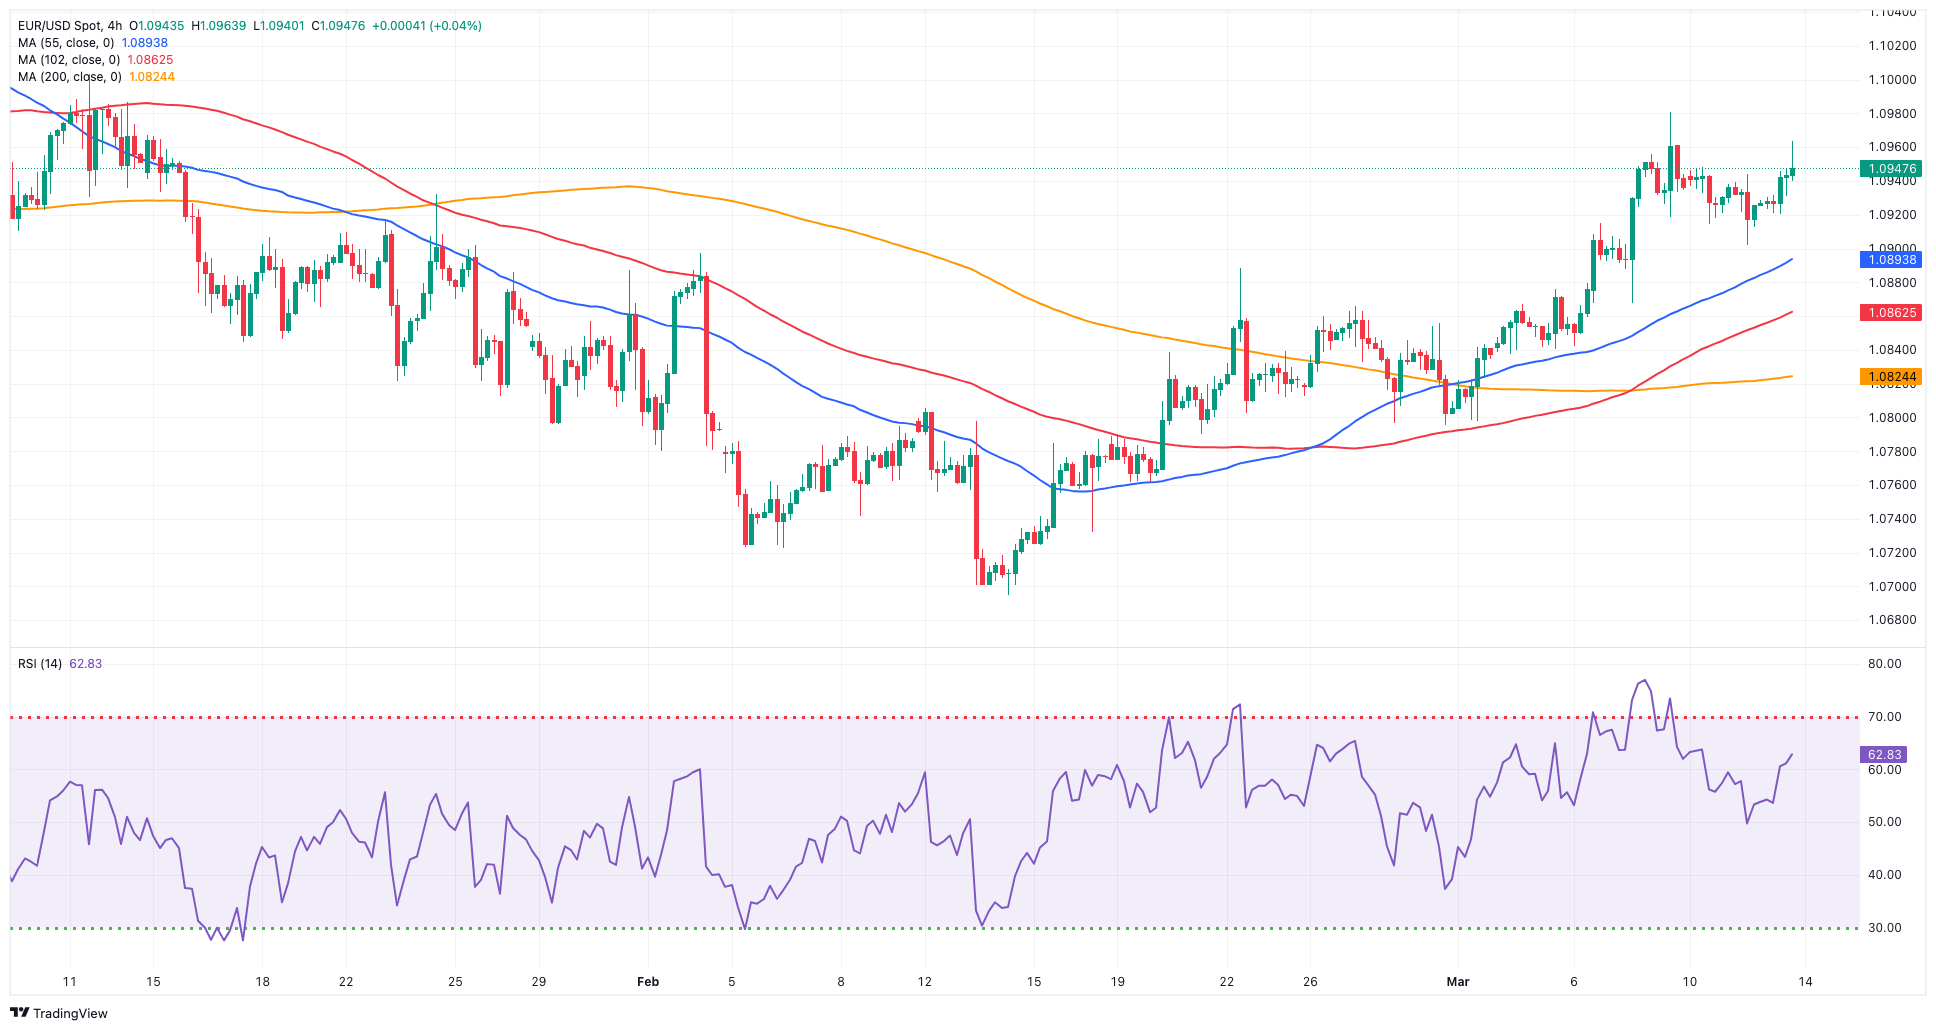
EUR/USD continued its recovery, adding to Tuesday’s advance well north of 1.0900 the figure on the back of renewed weakness in the greenback.
In fact, the dollar faced some selling pressure despite another increase in US yields, while the resumption of investors’ preference for risk-linked assets seems to have weighed on the buck, giving away part of the US CPI-driven gains recorded in the previous session.
In the meantime, speculations of interest rate cuts by both the Fed and the ECB continued to dominate among participants. Furthermore, CME Group's FedWatch Tool indicates a nearly 60% probability of the Fed reducing its rate in June.
On the ECB’s front, Board member Villeroy indicated that the possibility of a rate cut in the spring still exists, adding that the Governing Council will maintain a high level of vigilance until we reach the 2% inflation target. His colleague Kazaks also mentioned that there is still significant uncertainty prevailing, while the decision regarding an ECB rate cut will be made in the upcoming meetings. He suggested that there remains notable tension in the labour market and that it is important not to excessively postpone the ECB rate reduction.
On the domestic calendar, Industrial Production in the broader euro bloc contracted by 6.7% in the year to January.
In the US, weekly Mortgage Applications increased by 7.1% in the week to March 8, according to MBA.
EUR/USD's initial resistance level is the March top of 1.0981 (March 8). North of here aligns the weekly peak of 1.0998 (January 5, 2011), which precedes the psychological 1.1000 level. The breakout of this zone might pave the way for a challenge to the December 2023 high of 1.1139 (December 27), which is supported by the 200-week SMA of 1.1147 and comes before the 2023 top of 1.1275 (July 18). In contrast, the loss of the 200-day SMA of 1.0836 may put a strain on the weekly low of 1.0795 (February 29), ahead of the 2024 low of 1.0694 (February 14). A further decrease may result in a test of the weekly low of 1.0495 (October 13, 2023), prior to the 2023 low of 1.0448 (October 3), and the round level of 1.0400. The daily RSI rose above the 65 level.
Resistance levels: 1.0981 1.0998 1.1139 (4H chart)
Support levels: 1.0902 1.0867 1.0819 (4H chart)
USDJPY
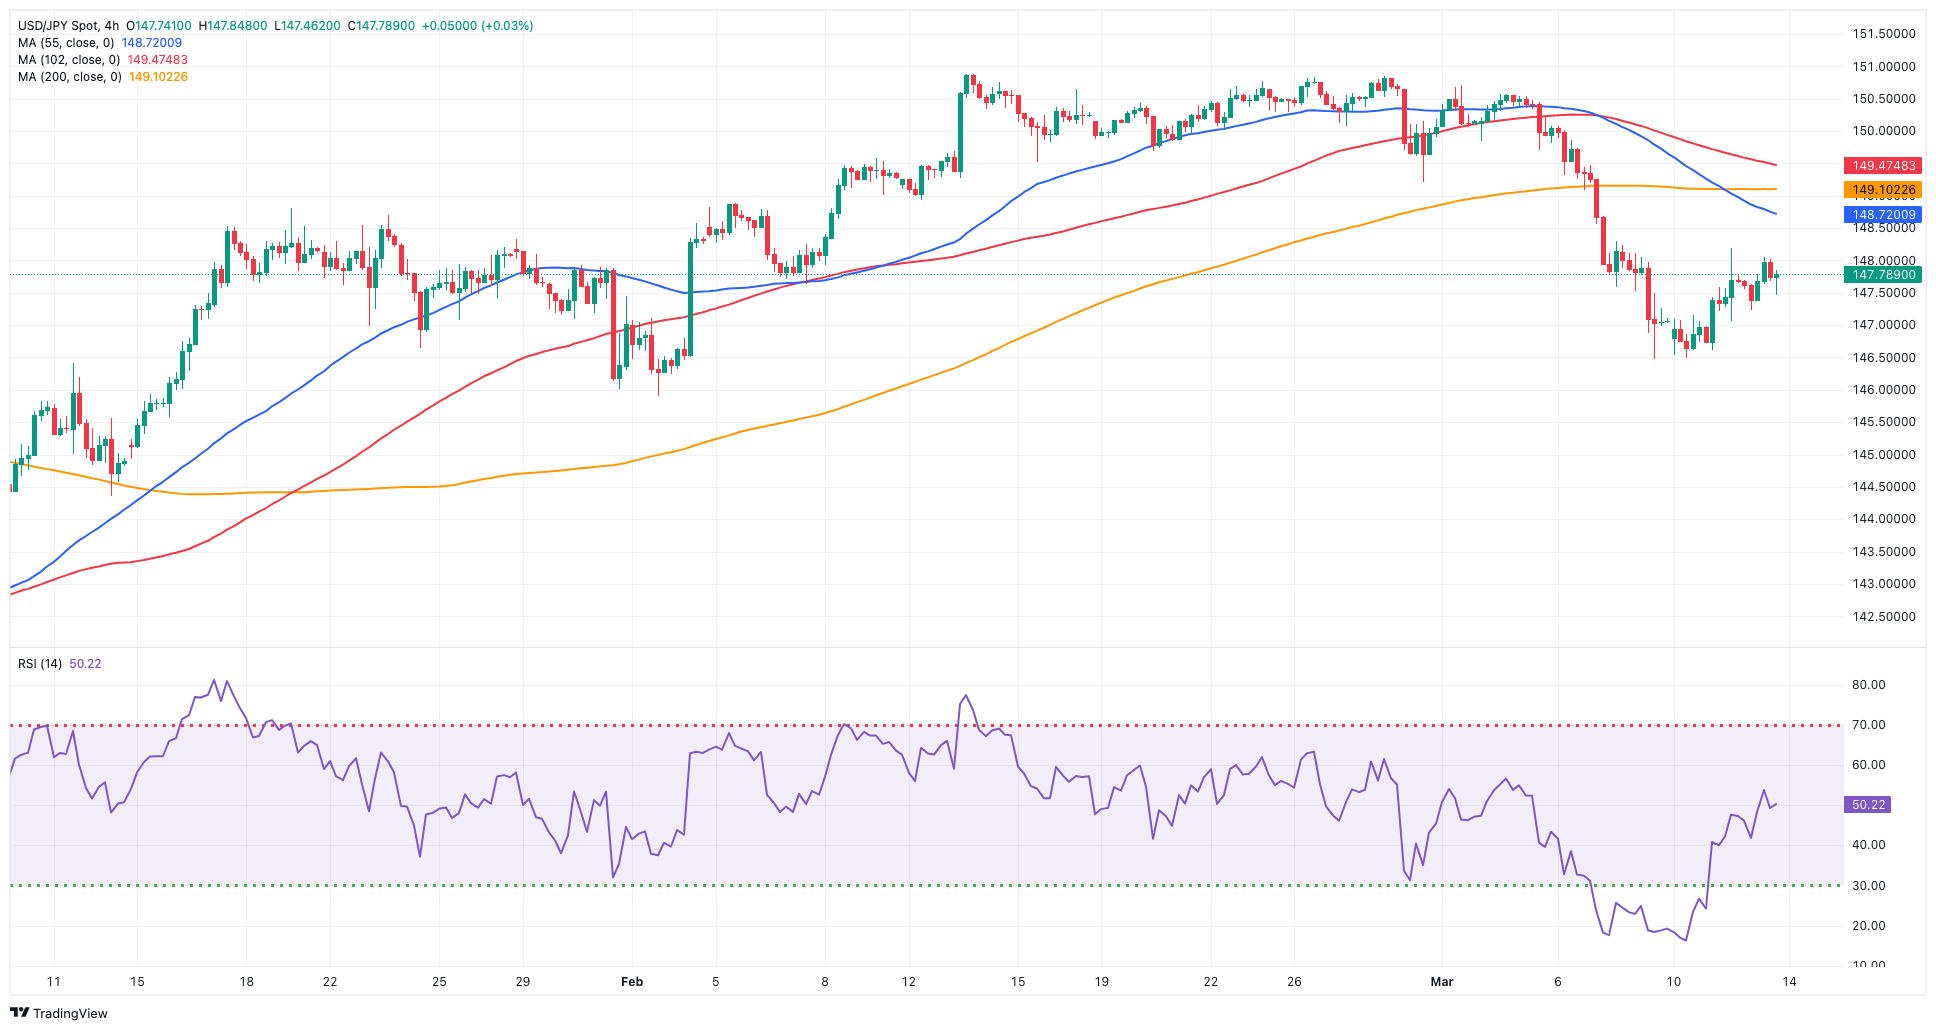
USD/JPY printed humble gains and briefly surpassed the 148.00 hurdle on Wednesday, flirting at the same time with weekly peaks.
Price action around the pair came on the back of the small drop in the greenback and further upside in US yields across different maturities.
In the meantime, several corporations' decisions to raise wages in Japan pointed to a robust wage-price cycle, as investors are closely monitoring this week's union pay agreements to gauge whether pricing pressures will warrant the BoJ considering raising interest rates as soon as next week.
Still around the BoJ, Governor Ueda stated that the bank will consider a policy adjustment once it approaches the price target. He added that this year's wage negotiations will play a crucial role in determining the timing for exiting stimulus measures, while the BoJ needs to carefully examine whether a favourable wage-inflation cycle emerges to assess whether the conditions for scaling back stimulus are aligning properly.
The Japanese docket was empty on Wednesday.
If bears exert more pressure, USD/JPY may retest the critical 200-day SMA at 146.27, which precedes the February low of 145.89 (February 1). Once this zone is cleared, the pair should find support around the December 2023 low of 140.24 (December 28), prior to the round number 140.00 and the July low of 137.23 (July 14). The next upside hurdle, instead, emerges at the 2024 high of 150.88 (February 13), ahead of the 2023 top of 151.90 (November 13). The round number 152.00 directly follows the 2022 high of 151.94 (October 21). The daily RSI settled around the 41 region.
Resistance levels: 148.16 149.10 150.88 (4H chart)
Support levels: 146.47 145.89 144.34 (4H chart)
GBPUSD
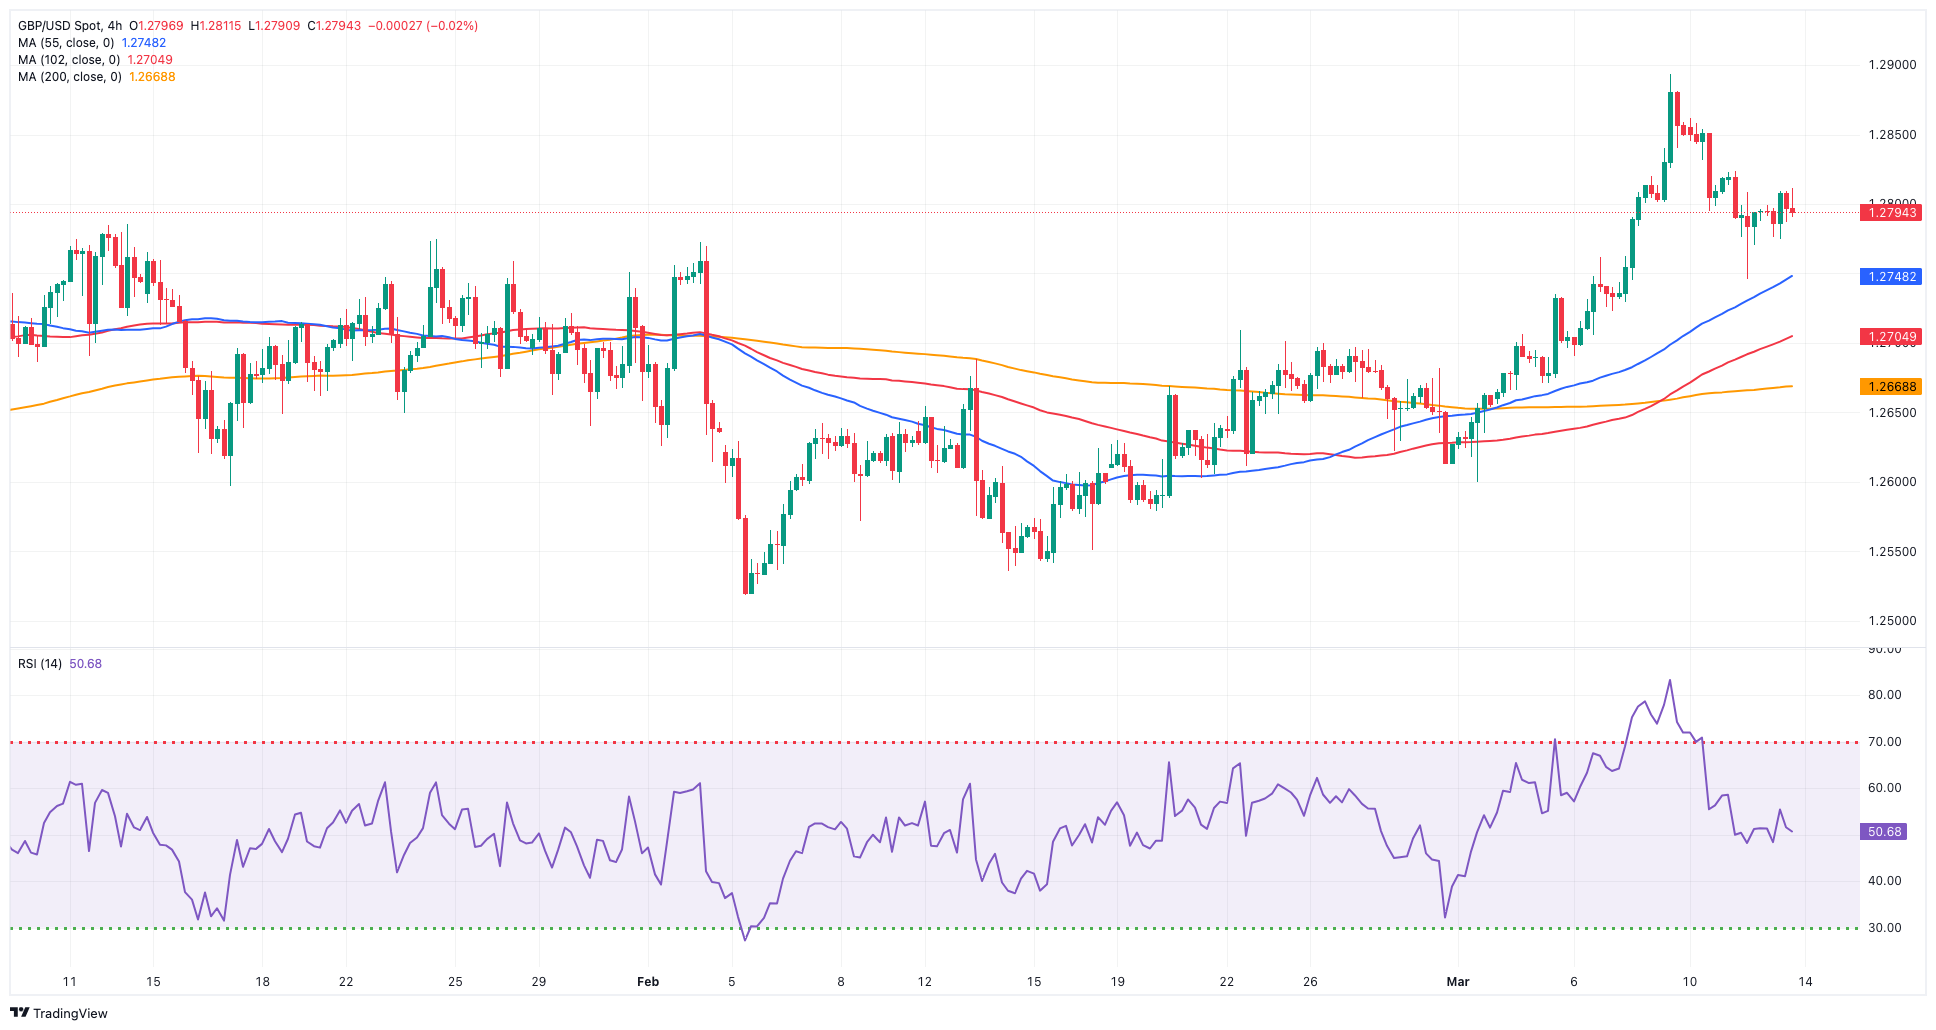
Renewed weakness hurt the greenback and lent legs to the risk-related markets, motivating GBP/USD to advance modestly and set aside two consecutive daily pullbacks on Wednesday.
Indeed, Cable regained some balance amidst increased appetite for riskier assets and despite mixed results from the UK calendar for the month of January.
On the latter, the GDP 3-Month Average contracted by 0.1% and 0.3% over the last twelve months. In addition, the trade deficit widened less than expected to £14.515B, Construction Output expanded by 0.7% YoY, Industrial Production rose by 0.5% from a year earlier, and Manufacturing Production rose by 2.0% vs. January 2023. Lastly, the NIESR Monthly GDP Tracker came in flat for the month of February.
In the UK money market, 10-year gilt yields rose past 4.0%, or multi-day highs.
The next upward hurdle for GBP/USD is the 2024 peak of 1.2893 (March 8), seconded by the weekly high of 1.2995 (July 27, 2023), all in anticipation of the critical 1.3000 yardstick. In the other direction, bearish attempts may lead the pair to the preliminary 55-day SMA at 1.2686 before the March low of 1.2599 (March 1) and the important 200-day SMA at 1.2586. The loss of this region might bring the 2024 bottom of 1.2518 (February 5) back into focus, ahead of the December 2023 low of 1.2500 (December 13). A deeper decline should not have any notable support until the weekly low of 1.2187 (November 10, 2023), followed by the October 2023 bottom of 1.2037, the important 1.2000 barrier, and the 2023 low of 1.1802 (March 8). On the daily chart, the RSI looked stable around 62.
Resistance levels: 1.2893 1.2995 1.3142 (4H chart)
Support levels: 1.2744 1.2667 1.2599 (4H chart)
GOLD
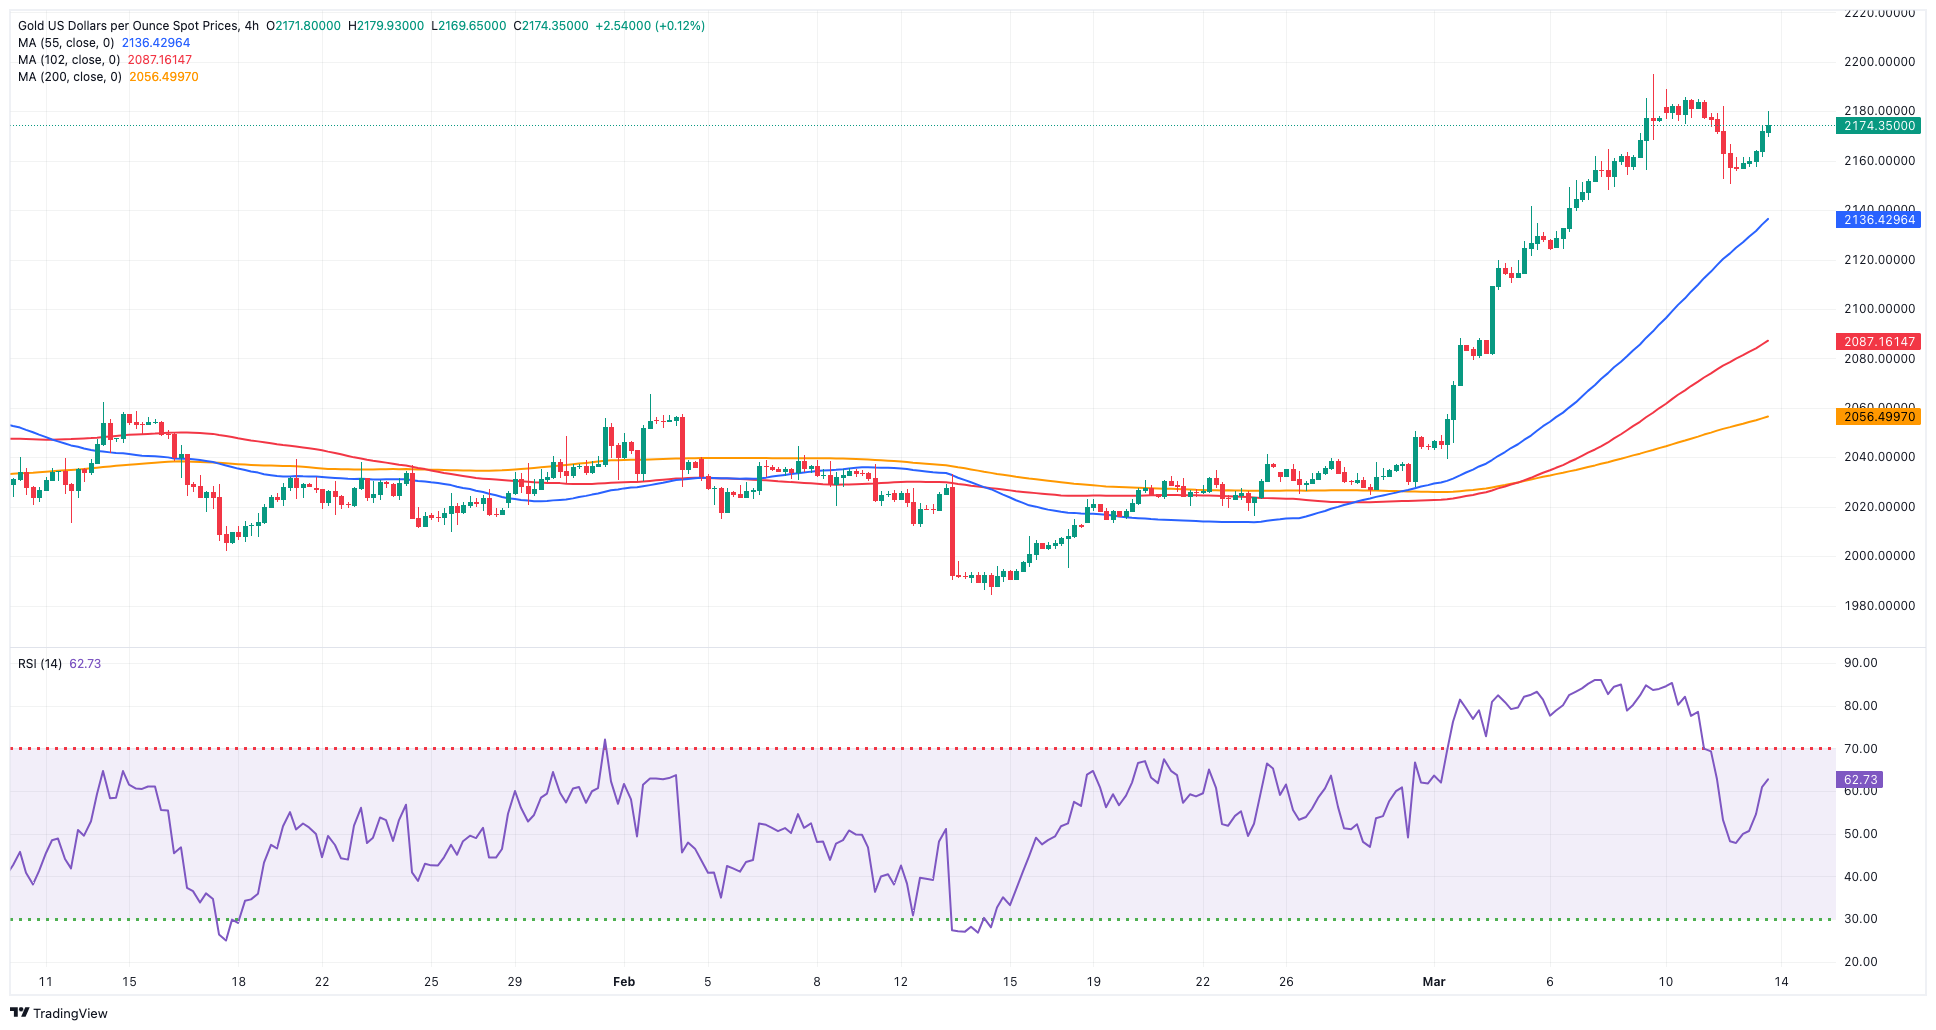
Gold prices resumed their uptrend and rapidly left behind Tuesday’s post-US CPI pullback.
In fact, fresh selling pressure motivated the greenback to relinquish some of its earlier gains, lifting the precious metal to the boundaries of the $2,180 region per troy ounce on Wednesday.
In the meantime, US yields remained on the rise across the board on steady speculation of the start of the easing cycle by both the Fed and the ECB at some point in the summer.
Immediately to the upside for Gold emerges its all-time top of $2,195 (March 8). On the flip side, the 55-day and 100-day SMAs of $2,050 and $2,028 should provide temporary support, respectively, seconded by the 2024 low of $1,984 (February 14) and the December 2023 low of $1,973, which is supported by its proximity to the critical 200-day SMA of $1,975 and precedes the November 2023 low of $1,931. The breach of the latter might cause the yellow metal to retest its October 2023 low of $1,810, which comes ahead of the 2023 low of $1,804 and the critical $1,800 conflict zone.
Resistance levels: $2,174 $2,195 (4H chart)
Support levels: $2,152 $2,135 $2,056 (4H chart)
CRUDE WTI
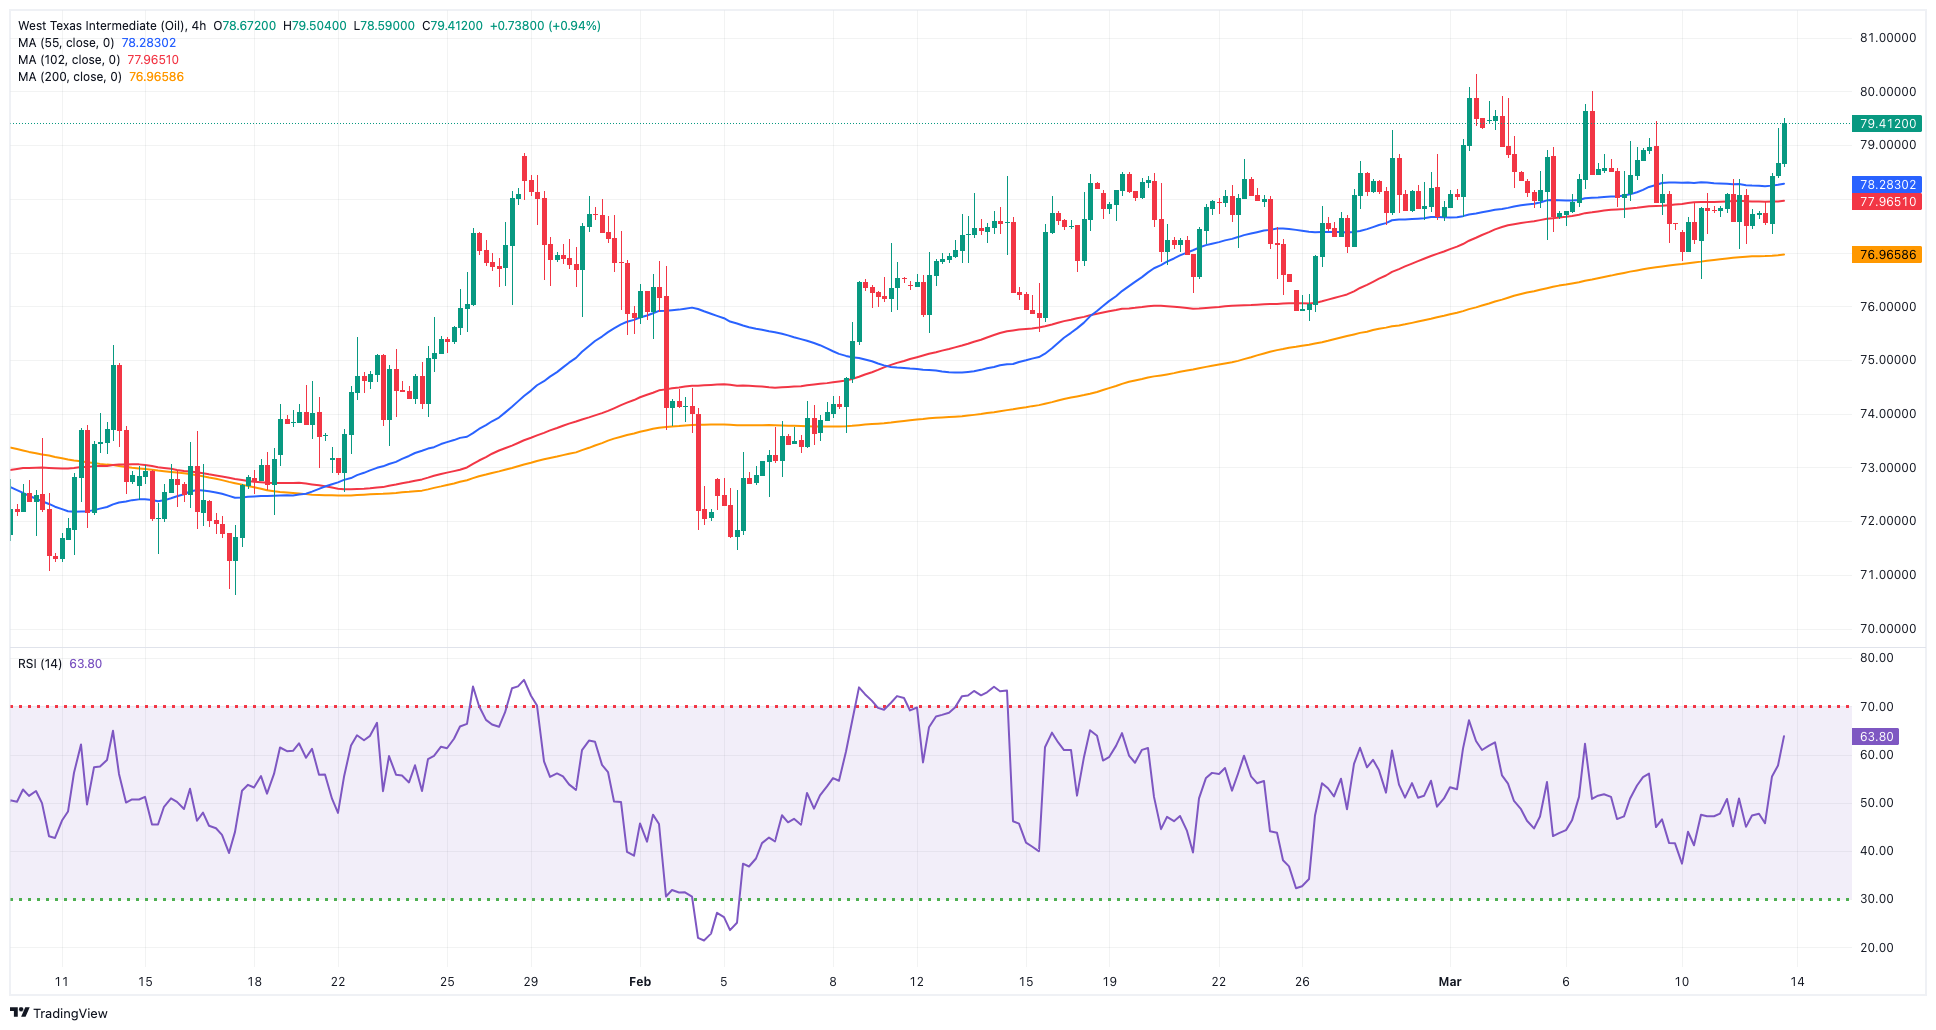
Prices of WTI climbed to three-day highs and traded at shouting distance from the key $80.00 mark per barrel on Wednesday.
The strong resumption of the bid bias in the commodity came in response to a larger-than-expected drop in the weekly US crude oil supplies and gasoline inventories, as per the EIA’s report.
On the latter, the EIA reported that US crude oil inventories went down by 1.536M barrels in the week to March 8, while supplies at Cushing decreased by 0.220M barrels, Weekly Distillate Stocks increased by 0.888M barrels, and gasoline stockpiles shrank by 5.662M barrels.
Also adding to the upside pressure in the commodity emerged fresh geopolitical concerns after drone attacks on Russian crude oil refineries.
The next upward challenge for WTI is the 2024 peak of $80.82 (March 1), prior to the weekly high of $89.83 (October 18, 2023) and the 2023 top of $94.99 (September 28, 2023). Further north, the weekly peak of $97.65 (August 30) occurs before the psychological $100.00 level. Having said that, the 100-day and 55-day SMAs should give temporary support around $75.83 and $75.55, respectively, before falling to the February low of $71.43 (February 5). Extra losses underscore the significant $70.00 milestone ahead of the 2024 low of $69.31 (January 3).
Resistance levels: $79.69 $80.82 $83.56 (4H chart)
Support levels: $76.76 $75.81 $71.37 (4H chart)
GER40
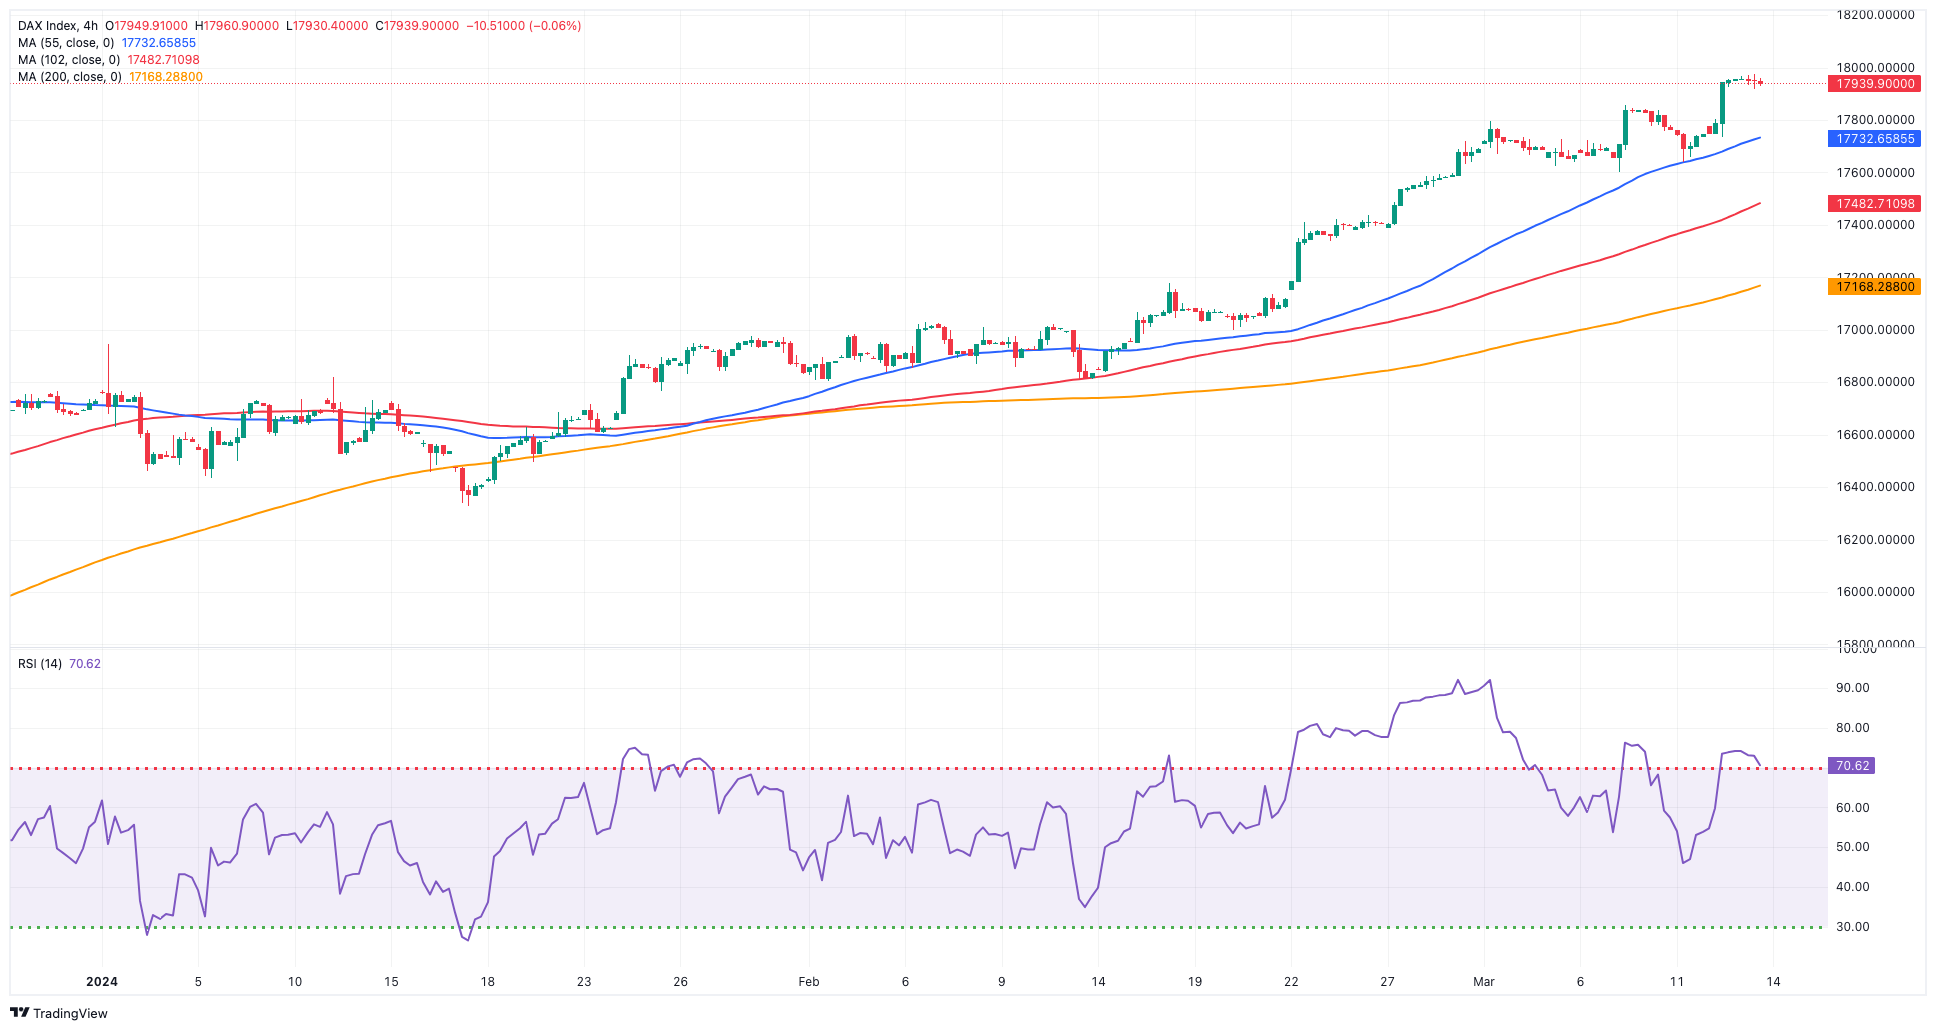
The main European stock indices closed Wednesday’s session with gains, with the exception of the German reference DAX40. Despite marginal losses, the DAX40 managed to reach an all-time high just beyond the 18,000 mark.
Indeed, German stocks traded on the defensive as market participants continued to digest the release of higher-than-expected US inflation figures in February as well as mixed results from UK fundamentals.
In addition, expectations surrounding an interest rate cut by both the Fed and the ECB in the summer remained on the rise, which further bolstered the appetite for the risk complex.
Meanwhile, in the German debt market, 10-year bund yields extended their advance for the third straight session, this time revisiting the 2.37% zone.
The DAX40's next level of resistance is the record high of 18,001 (March 13). The 55-day SMA at 17,050 should provide temporary support prior to the February low of 16,821 (February 1). If the index falls below this level, a potential challenge of the 2024 bottom at 16,345 (January 17) may resurface ahead of the important 200-day SMA at 16,153. A deeper decline might see the weekly low of 15,915 (November 28) revisited, ahead of the October 2023 lows of 14,630 (October 23) and the Mach bottom of 14,458 (March 20). The daily RSI receded to the sub-77 area, suggesting that the market remained significantly overbought.
Best Performers: Zalando SE, E.ON SE, Adidas
Worst Performers: Volkswagen VZO, Dr Ing hc F Porsche Prf, Deutsche Boerse
Resistance levels: 17,973 (4H chart)
Support levels: 17,619 16,970 16,831 (4H chart)
GBPJPY
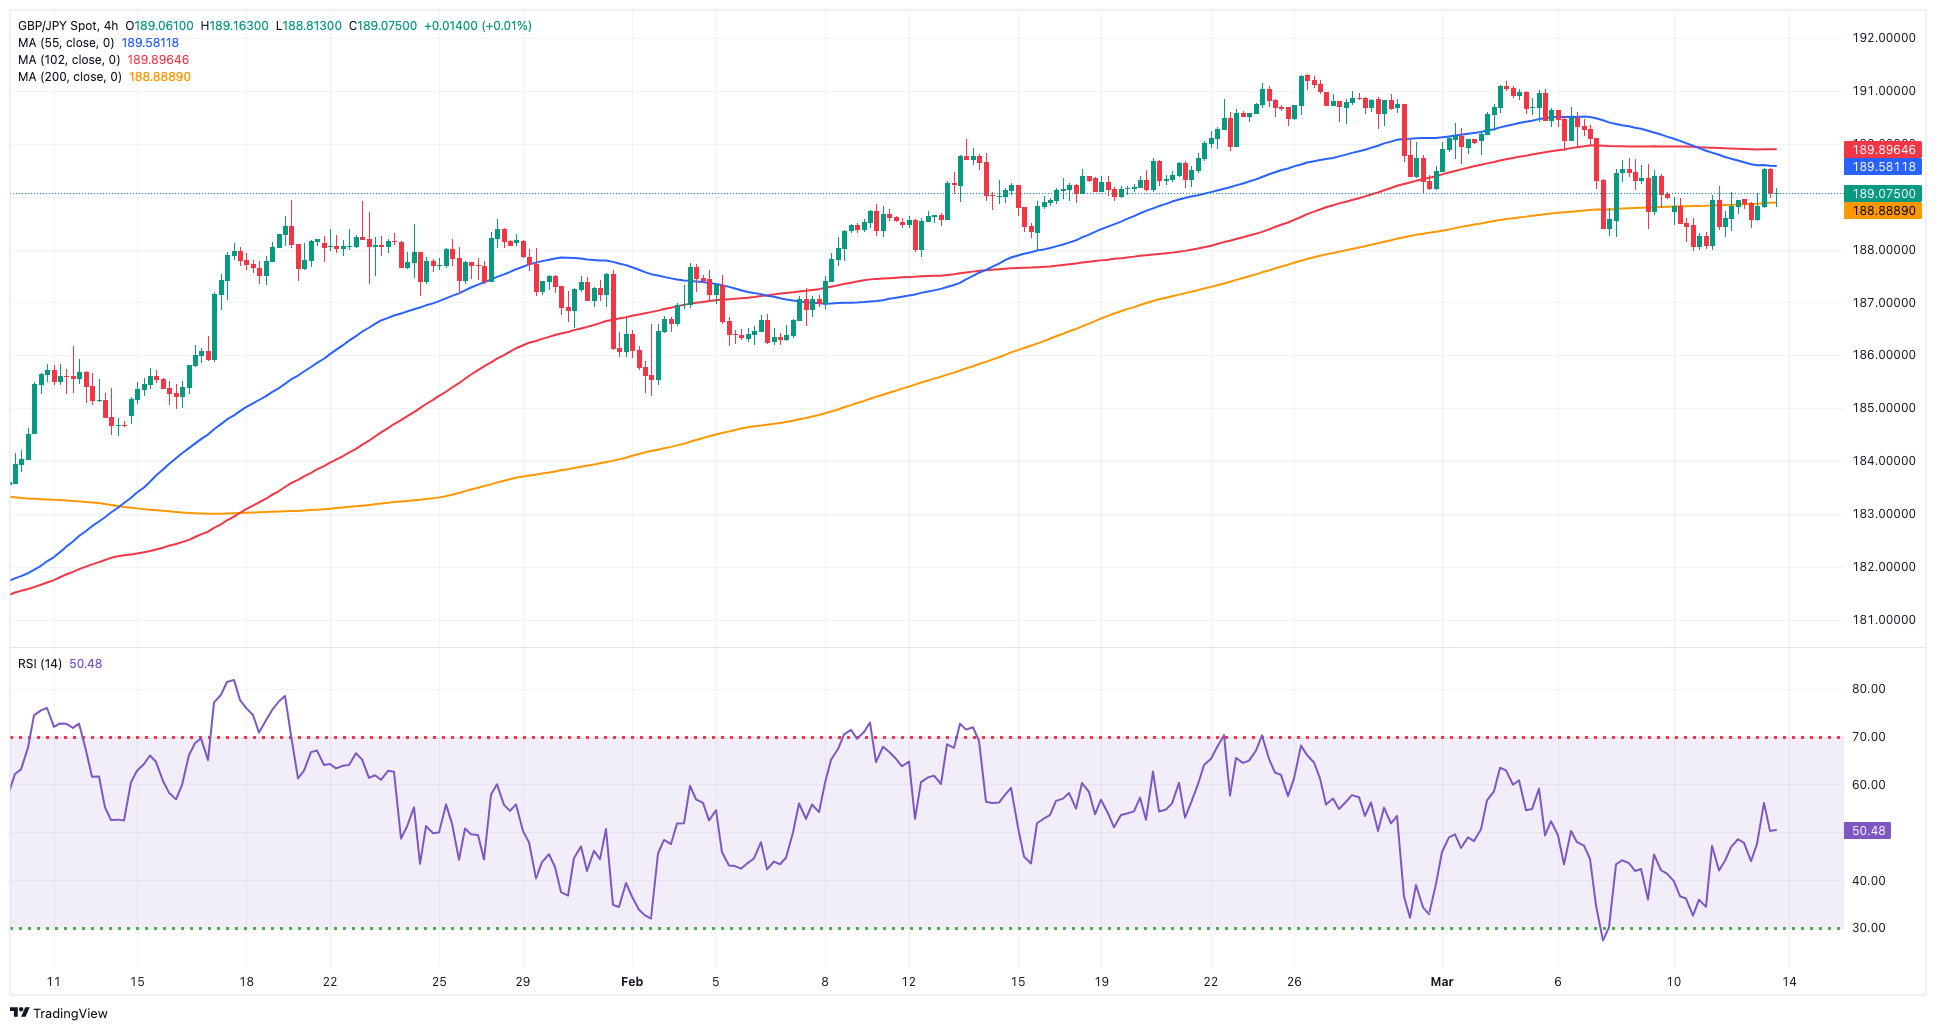
In quite a volatile session, GBP/JPY advanced marginally to the 189.00 neighbourhood in a context of further weakness in the dollar and prevailing risk-on trade.
In the meantime, traders continued to closely follow developments around the BoJ and its potential lift-off at its gathering on March 18–19, while mixed results from key UK fundamentals also prompted the quid to face alternating risk appetite moves.
The next immediate contention for GBP/JPY is the March low of 187.96 (March 11), followed by intermediate support levels at the 55-day and 100-day SMAs of 187.37 and 185.98, respectively. The breach of the latter may pave the way for a move to the February low of 185.22 (February 1), ahead of the more critical 200-day SMA at 184.09. Down from here, there are no support levels of note until the December 2023 low of 178.33 (December 14) prior to the October 2023 low of 178.03 and the July 2023 bottom of 176.30. On the other hand, the initial resistance is placed at the 2024 peak of 191.32 (February 26), followed by the August 2015 high of 195.28 (August 18) and the record top of 195.88 (June 24, 2015). The daily RSI recovered past 49.
Resistance levels: 189.54 189.72 191.19 (4H chart)
Support levels: 187.96 186.44 185.22 (4H chart)
NASDAQ
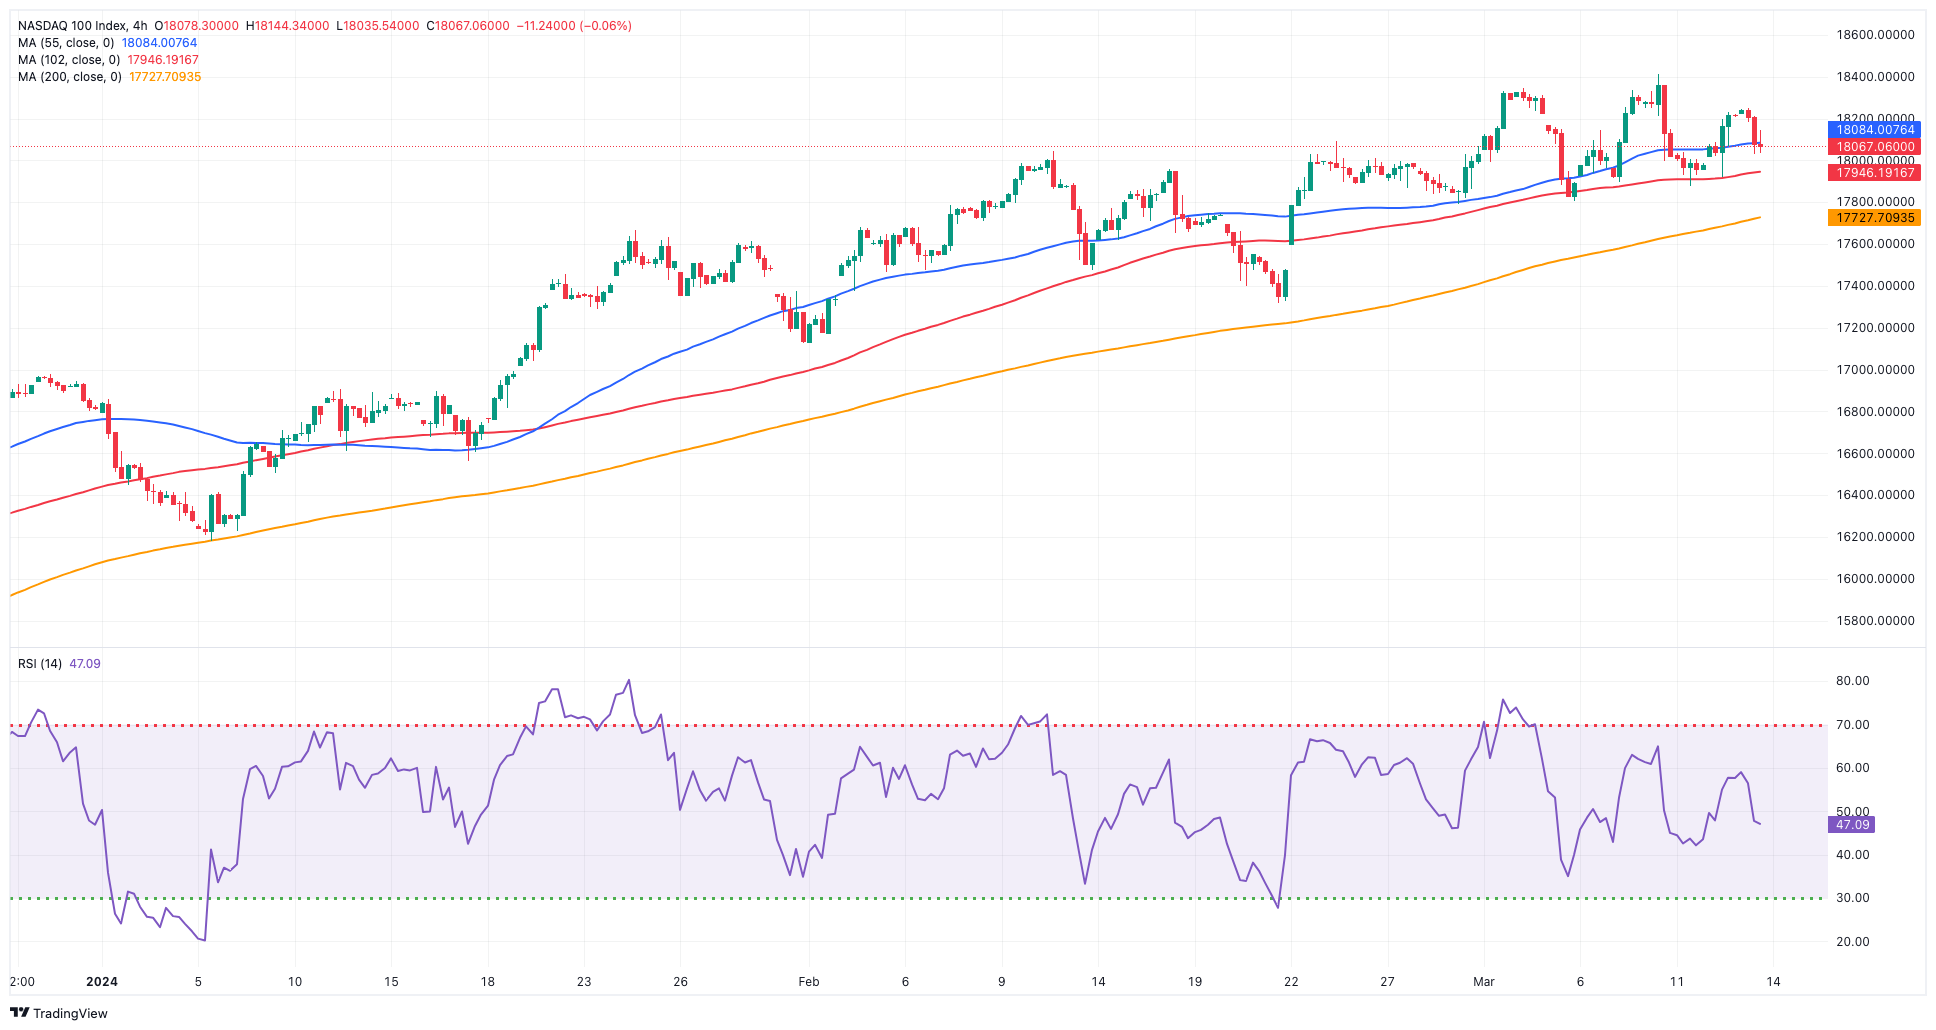
Further weakness hurt the US tech sector and prompted the reference Nasdaq 100 to fade Tuesday’s decent advance and refocus on the downside instead.
The move lower in the key index came in tandem with a slight drop in the greenback, while US yields extended further their recovery ahead of further inflation data due on Thursday (Producer Prices) and steady bets on a Fed’s rate cut in the summer.
Further advances might motivate the Nasdaq 100 to test its all-time high of 18,416 (March 8). The other way around, the index should face temporary support at the 55-day SMA of 17,438 before the weekly lows of 17,319 (February 21) and 17,128 (January 31). Once the latter is passed, the index may target the 2024 low of 16,249 (January 5), which is above the crucial 200-day SMA of 15,846 and the December 2023 low of 15,695 (December 4). Additional losses from here may challenge the October 2023 low of 14,058 (October 26), which precedes the April 2023 bottom of 12,724 (April 25), the March 2023 low of 11,695 (March 13), and the 2023 low of 10,696 (January 3). The day-to-day RSI slipped back to the 56 area.
Top Gainers: PDD Holdings DRC, PayPal, MongoDB
Top Losers: Dollar Tree, Marvell, Tesla
Resistance levels: 18,416 (4H chart)
Support levels: 17,804 17,319 17,128 (4H chart)
DOW JONES
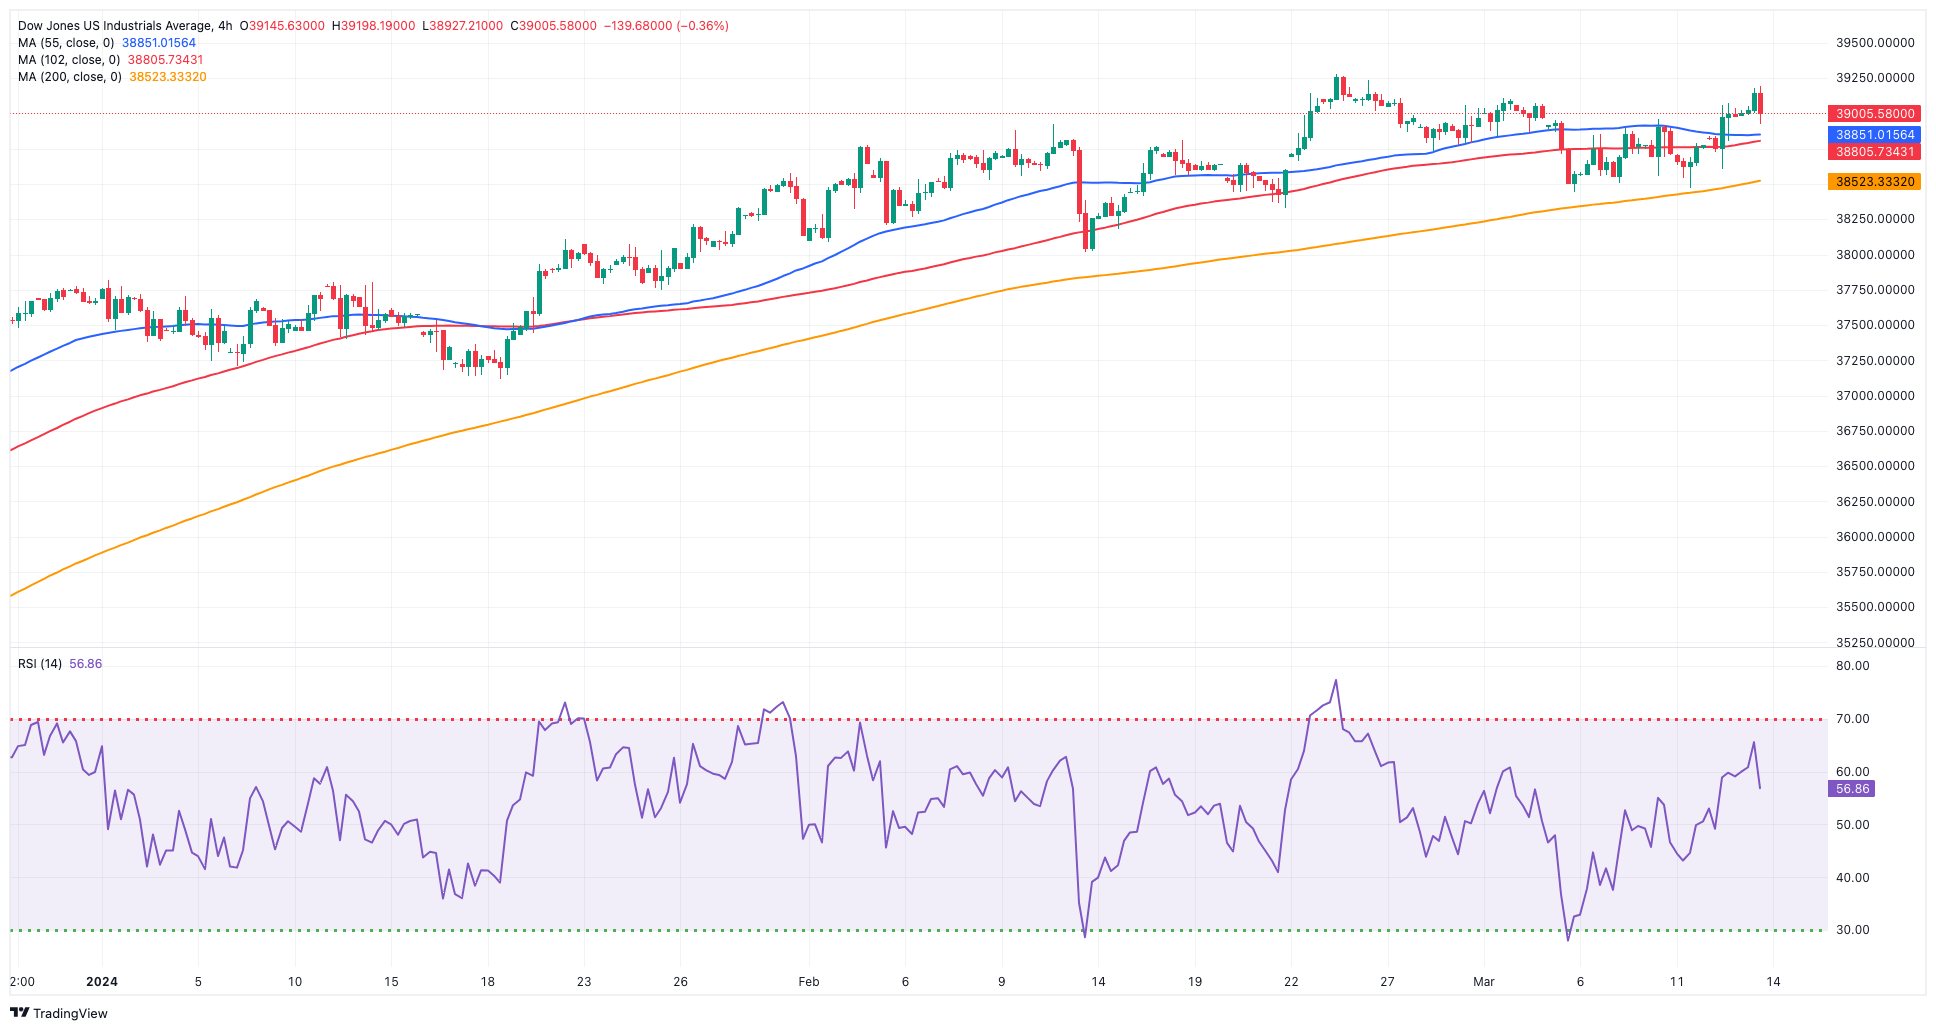
Wednesday’s colourless session saw the US stock benchmark Dow Jones clock small gains, adding to the weekly recovery and reclaiming the area above the key 39,000 yardstick.
The prevailing risk-on mood underpinned the third consecutive daily advance in equities measured by the Dow Jones, always in a context of rising cautiousness prior to further inflation-related data due on Thursday in the form of Producer Prices.
Overall, the Dow Jones gained 0.17% to 39,073, the S&P 500 dropped by 0.07% to 5,171, and the tech-centric Nasdaq Composite deflated by 0.32% to 16,212.
If buyers push harder, the Dow Jones might break its record high of 39,282 (February 23). Just the opposite, the 55-day SMA of 38,274 serves as intermediate support, followed by the 2024 low of 37,122 (January 18) and the weekly low of 37,073 (December 20, 2023). If the index falls below this level, it may break the 100-day SMA at 36,817, which is prior to the 200-day SMA at 35,565. The weekly low of 33,859 (November 7, 2023) is next, followed by the October 2023 low of 32,327 (October 27) and the 2023 bottom of 31,429 (March 15). The daily RSI rose a tad past the 60 level.
Top Performers: 3M, Chevron, Home Depot
Worst Performers: McDonald’s, Intel, Merck&Co
Resistance levels: 39,282 (4H chart)
Support levels: 38,457 38,039 37,122 (4H chart)
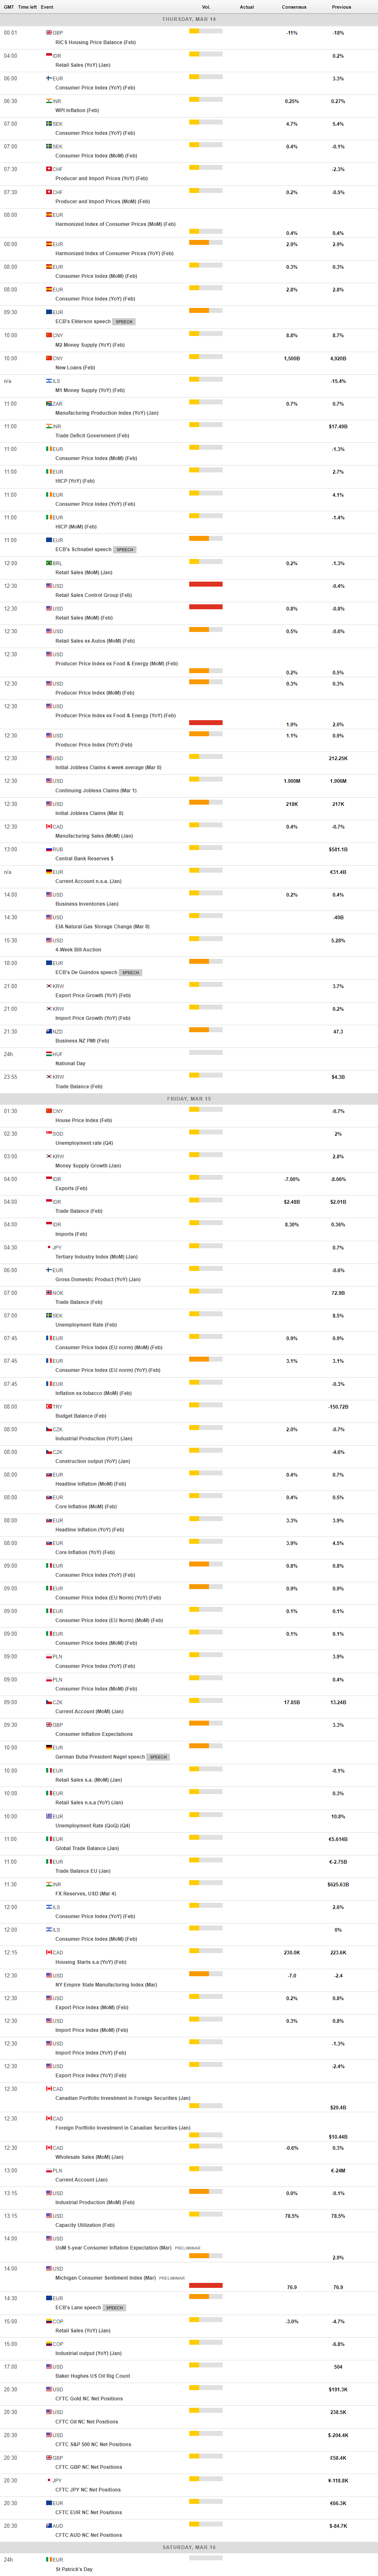
MACROECONOMIC EVENTS
All Information & Updates provided by:

All information relating to the financial markets available on this page has been prepared and issued by FXStreet (Forexstreet SL, Spain, Reg: B62498233) on the basis of publicly available information and all information believed to be reliable and does not conflict with Kuwaiti local laws, and all necessary care has been taken to before the company to ensure that the facts mentioned are correct from the source.
NCM Investment nor any of its directors or employees shall in any way be held responsible for the contents of this news, and the information contained on this page is intended only to provide clients with publicly available information and should not be construed as investment advice, report or analysis and/or constitute an offer or invitation to buy or sell financial instruments of any kind.
RISK WARNING: Forex and CFDs are highly risky leveraged products, as losses can exceed deposits. Please ensure you understand all the risks and take independent advice if necessary. NCM will segregate the clients based on the criteria of the regulator and its bylaws. NCM does not provide any advisory service; the material published does not constitute advice or a recommendation for a transaction in any financial instrument. NCM accepts no responsibility for any use of the content presented and any consequences of that use. Anyone acting on the information provided does so at their own risk.