
- Contact Us:
-

-

-

-


Daily Market Updates
15 Mar 2024
EURUSD
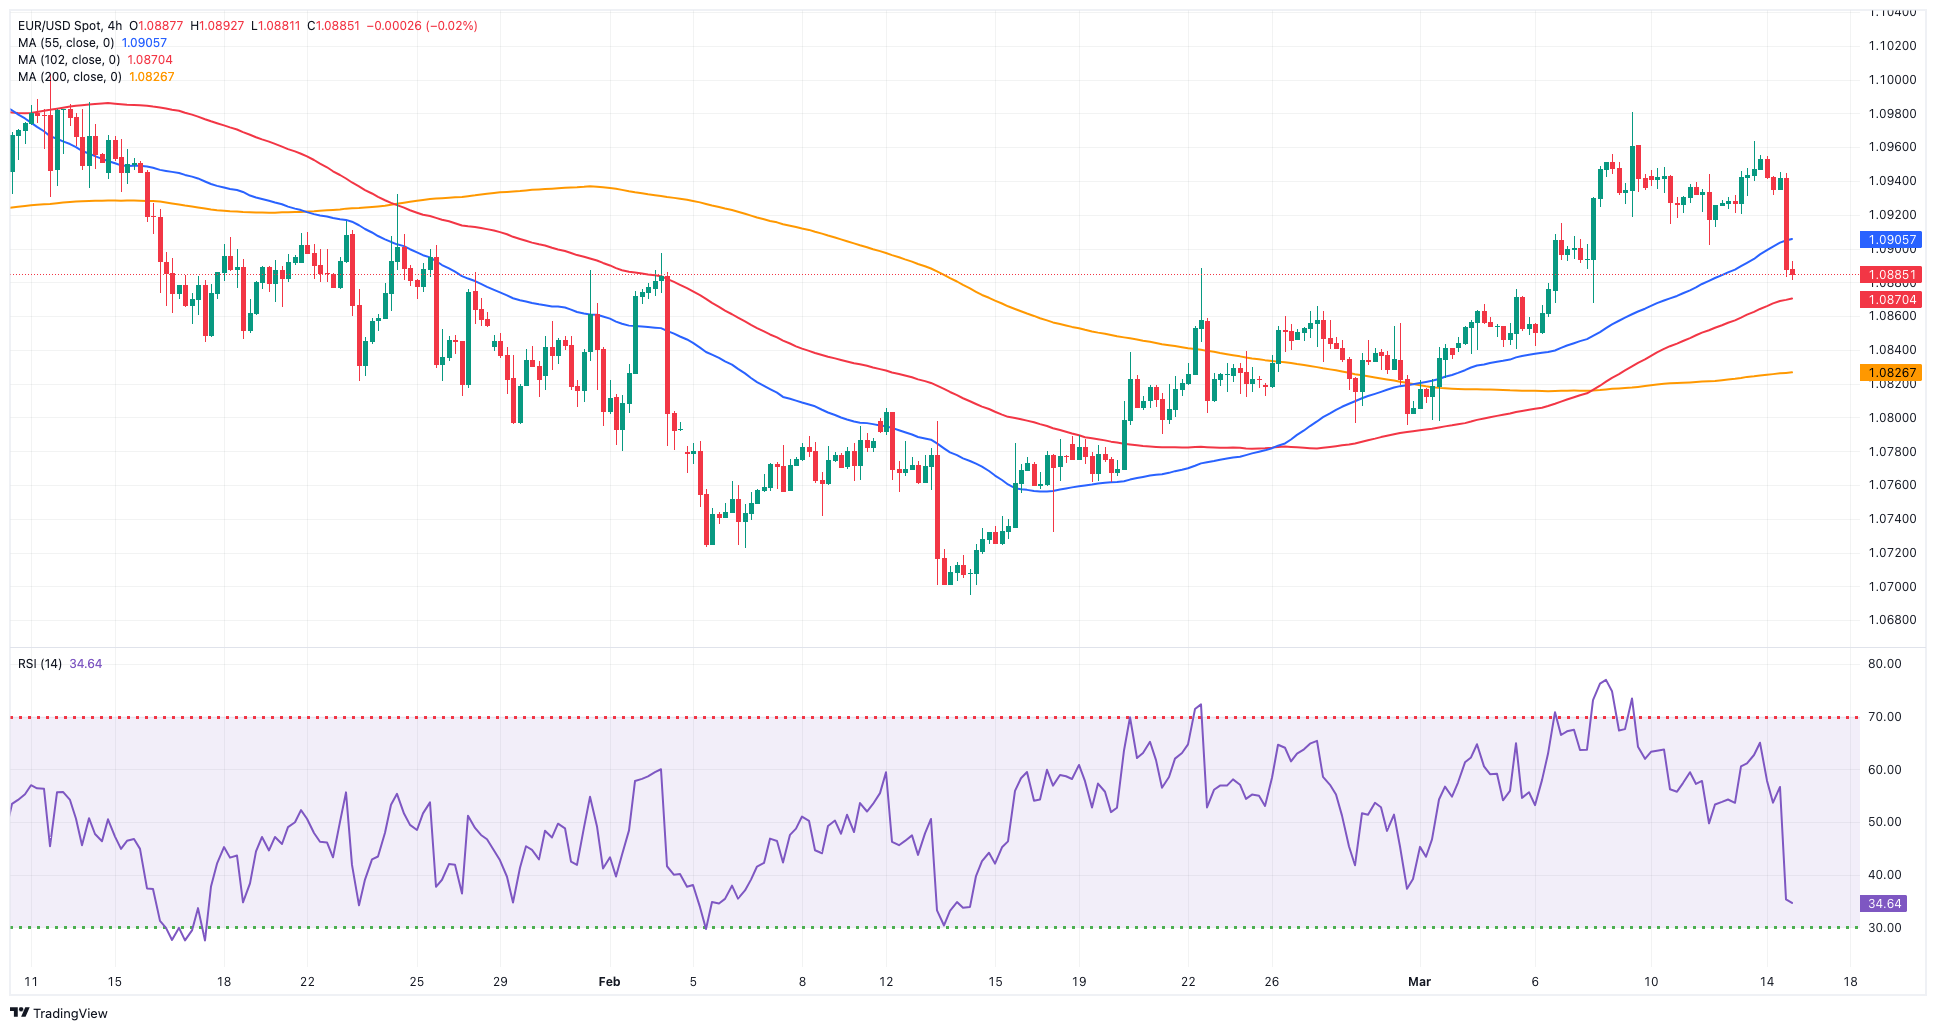
The strong resumption of the bid bias in the greenback prompted EUR/USD to retreat to weekly lows in the 1.0880 region on Thursday.
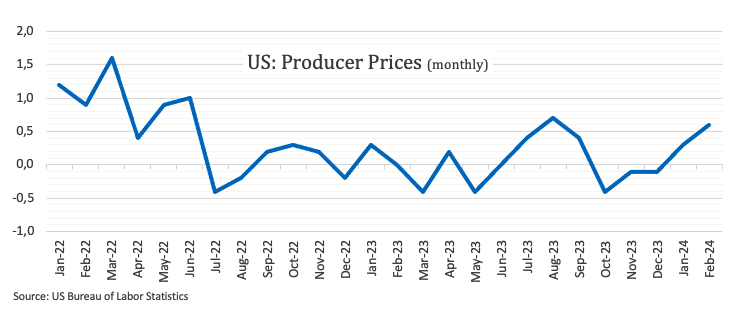
Indeed, another strong print from US inflation, this time in the form of producer prices, coupled with a solid prints from the labour market lent unexpected support to the buck and lifted the USD Index (DXY) back above the 103.00 barrier.
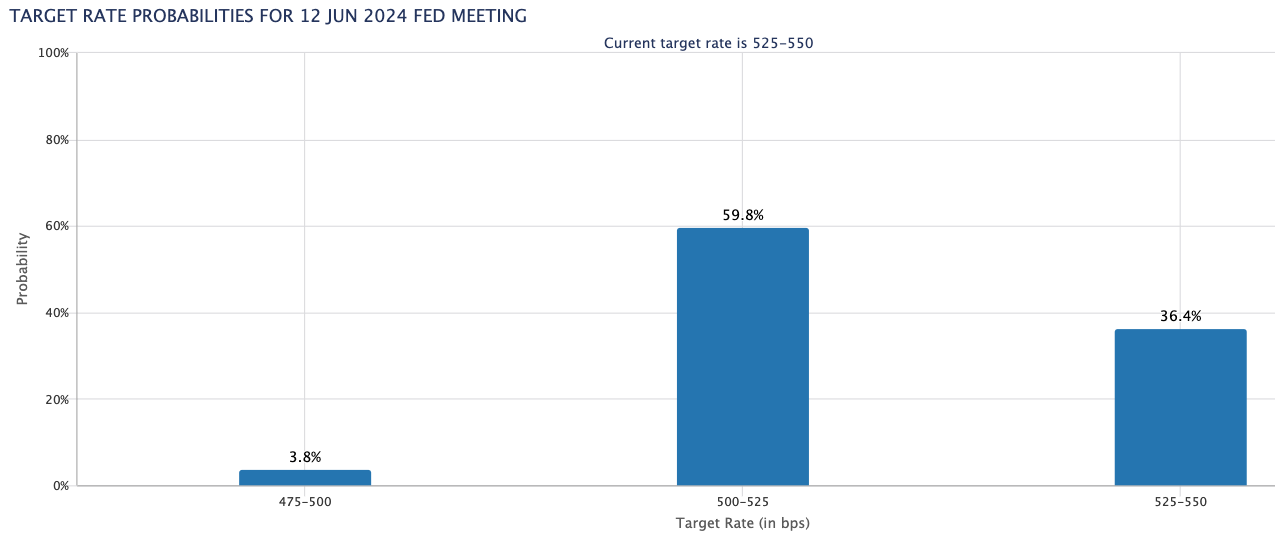
The marked bounce in the dollar was also underpinned by further gains in US yields, which reached multi-day highs across various timeframes on the back of a steady conviction of a rate cut by the Fed at its June 12 event.
On the other side of the road, ECB board member Knot advocated for the first rate cut in June, followed by extra cuts in September and December. On the flip side, there was no news from his colleagues Muller and Lane, who suggested that further information is needed before the ECB starts cutting rates and that the bank must avoid giving calendar guidance, respectively. On a more hawkish (overly optimistic?) tone, member Stournaras favoured two rate cuts before the summer break.
Back on the docket, US producer prices rose at a monthly 0.6% in February, while headline retail sales expanded by 0.6% MoM during last month and usual weekly initial claims increased by 209K in the week to March 9.
EUR/USD's initial resistance level is the March high of 1.0981 (March 8). North of here is the weekly top of 1.0998 (January 5, 2011), which comes before the psychological 1.1000 mark. The breakout of this zone may pave the way for a challenge to the December 2023 peak of 1.1139 (December 27), which is supported by the 200-week SMA of 1.1148 and comes before the 2023 high of 1.1275 (July 18). In contrast, the loss of the 200-day SMA at 1.0836 may put pressure on the weekly low of 1.0795 (February 29), which is ahead of the 2024 low of 1.0694 (February 14). A deeper decline may result in a test of the weekly low of 1.0495 (October 13, 2023), before the 2023 low of 1.0448 (October 3), and the round level of 1.0400. The daily RSI tumbled below 57.
Resistance levels: 1.0981 1.0998 1.1139 (4H chart)
Support levels: 1.0900 1.0867 1.0819 (4H chart)
USDJPY
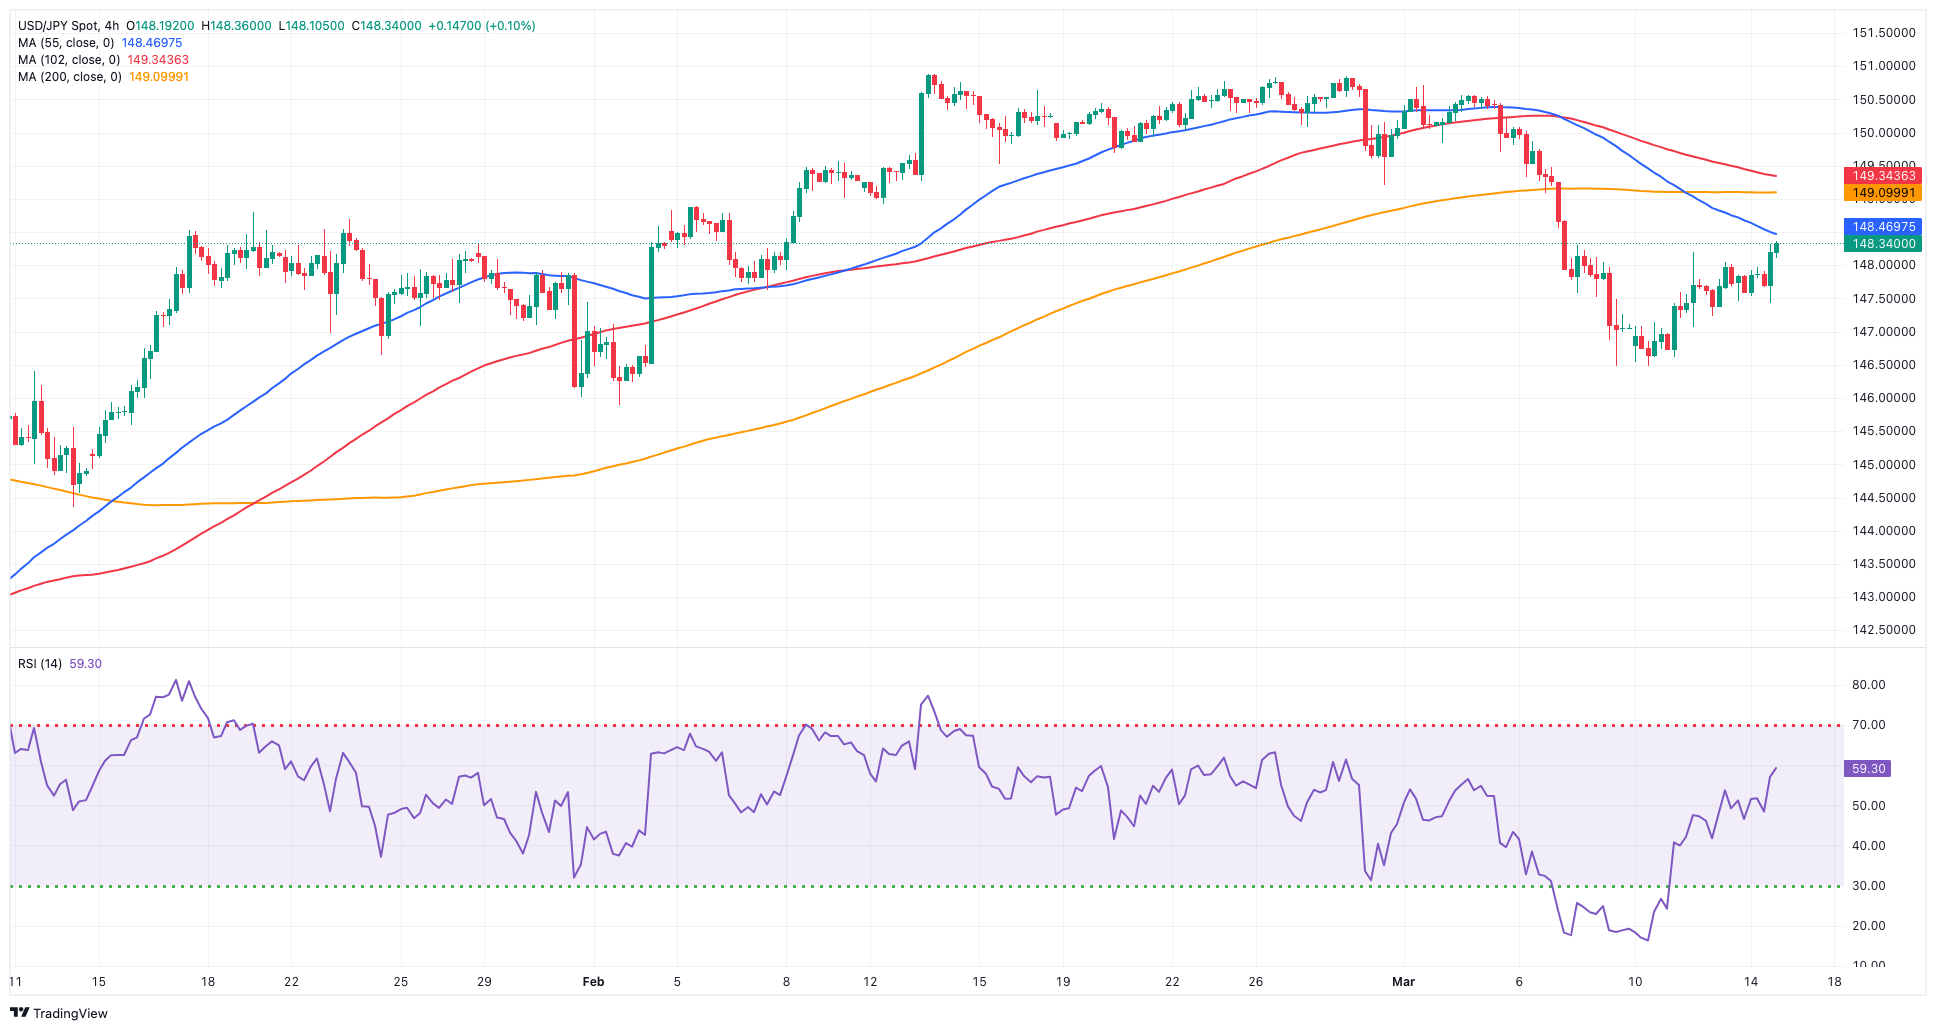
USD/JPY advanced for the third consecutive session on Thursday, consolidating the breakout of the 148.00 barrier and reaching fresh weekly tops.
The strong move higher in the greenback gathered extra steam after auspicious data releases in the US docket, while the continuation of the march north in US yields across the board also collaborated with the pair’s improvement.
Meanwhile, all the attention remains on the upcoming BoJ gathering, where speculation over a potential lift-off seems to have lost some momentum in the last couple of sessions.
Data-wise, foreign bond investment rose to ¥1579.6B in the week to March 9, which was the sole release in Japan.
The continuation of the recovery in USD/JPY now shifts its focus to the 2024 top of 150.88 (February 13), prior to the 2023 peak of 151.90 (November 13). Further up aligns the 2022 high of 151.94 (October 21) just before the round number 152.00. Instead, initial contention is seen at the March low of 147.47 (March 8), which appears bolstered by the key 200-day SMA at 146.31. The breach of the latter could open the door to a potential visit to the February low of 145.89 (February 1) ahead of the December 2023 low of 140.24 (December 28), which precedes the round number 140.00 and the July low of 137.23 (July 14). The day-to-day RSI climbed to the 46 region.
Resistance levels: 148.19 149.10 150.88 (4H chart)
Support levels: 146.47 145.89 144.34 (4H chart)
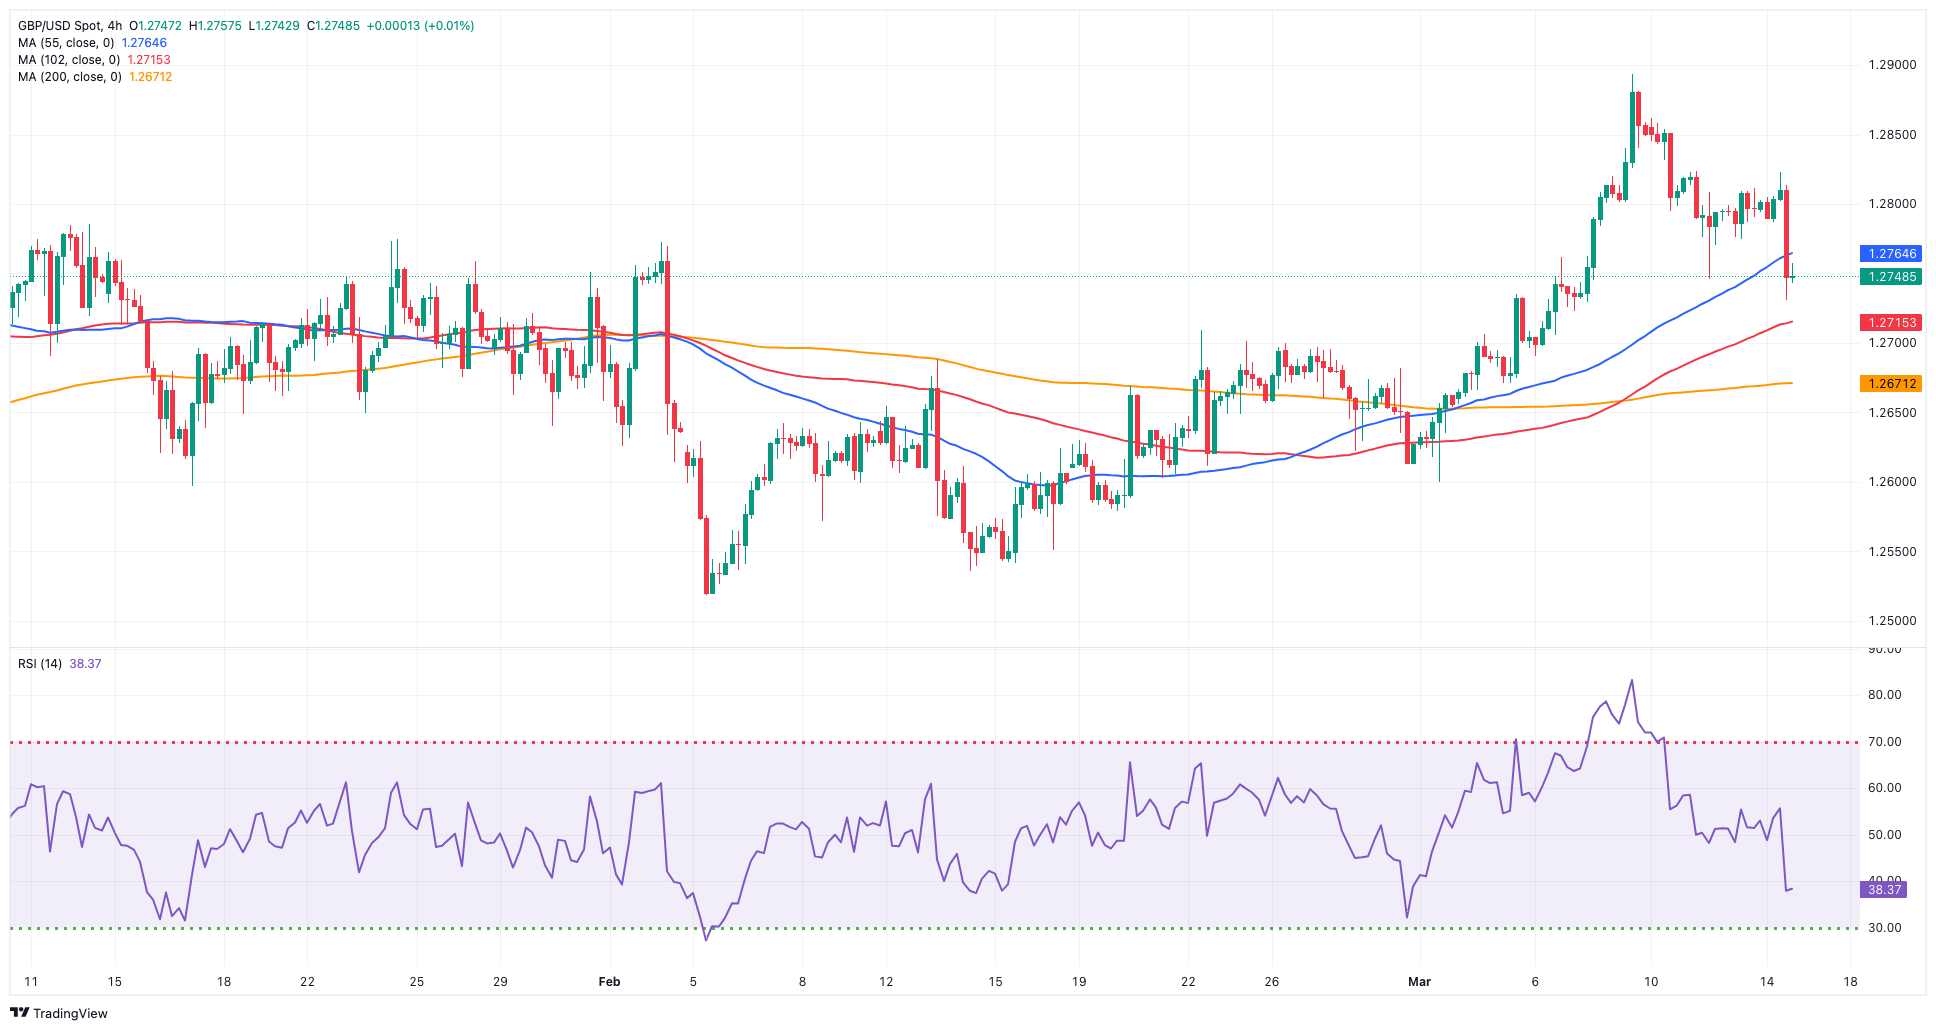
GBPUSD
The sentiment surrounding the risk-linked galaxy deteriorated further on the back of extra gains in the greenback on Thursday.
Against that backdrop, GBP/USD followed its peers and dropped to multi-day lows well south of the 1.2800 support in response to the data-driven U-turn in the dollar, which sparked a meaningful advance in the USD Index (DXY) past the 103.00 hurdle.
Further weakness in the British pound contrasted with a sharp bounce in UK 10-year gilts to multi-session peaks around 4.10%.
In the domestic docket, RICS house price balance dropped by 10% in February.
Immediately to the downside for GBP/USD now emerges the preliminary 55-day SMA at 1.2684, before the March low of 1.2599 (March 1) and the crucial 200-day SMA at 1.2587. The loss of this zone may put the 2024 low of 1.2518 (February 5) back into focus, ahead of the December 2023 low of 1.2500 (December 13). A deeper slide should not have any meaningful support until the weekly low of 1.2187 (November 10, 2023), followed by the October 2023 bottom of 1.2037, the significant 1.2000 barrier, and the 2023 low of 1.1802 (March 8). In the other direction, the next upward hurdle for GBP/USD is the 2024 top of 1.2893 (March 8), seconded by the weekly peak of 1.2995 (July 27, 2023), all ahead of the important 1.3000 yardstick. On the daily chart, the RSI dropped to the 53 zone.
Resistance levels: 1.2823 1.2893 1.2995 (4H chart)
Support levels: 1.2734 1.2669 1.2599 (4H chart)
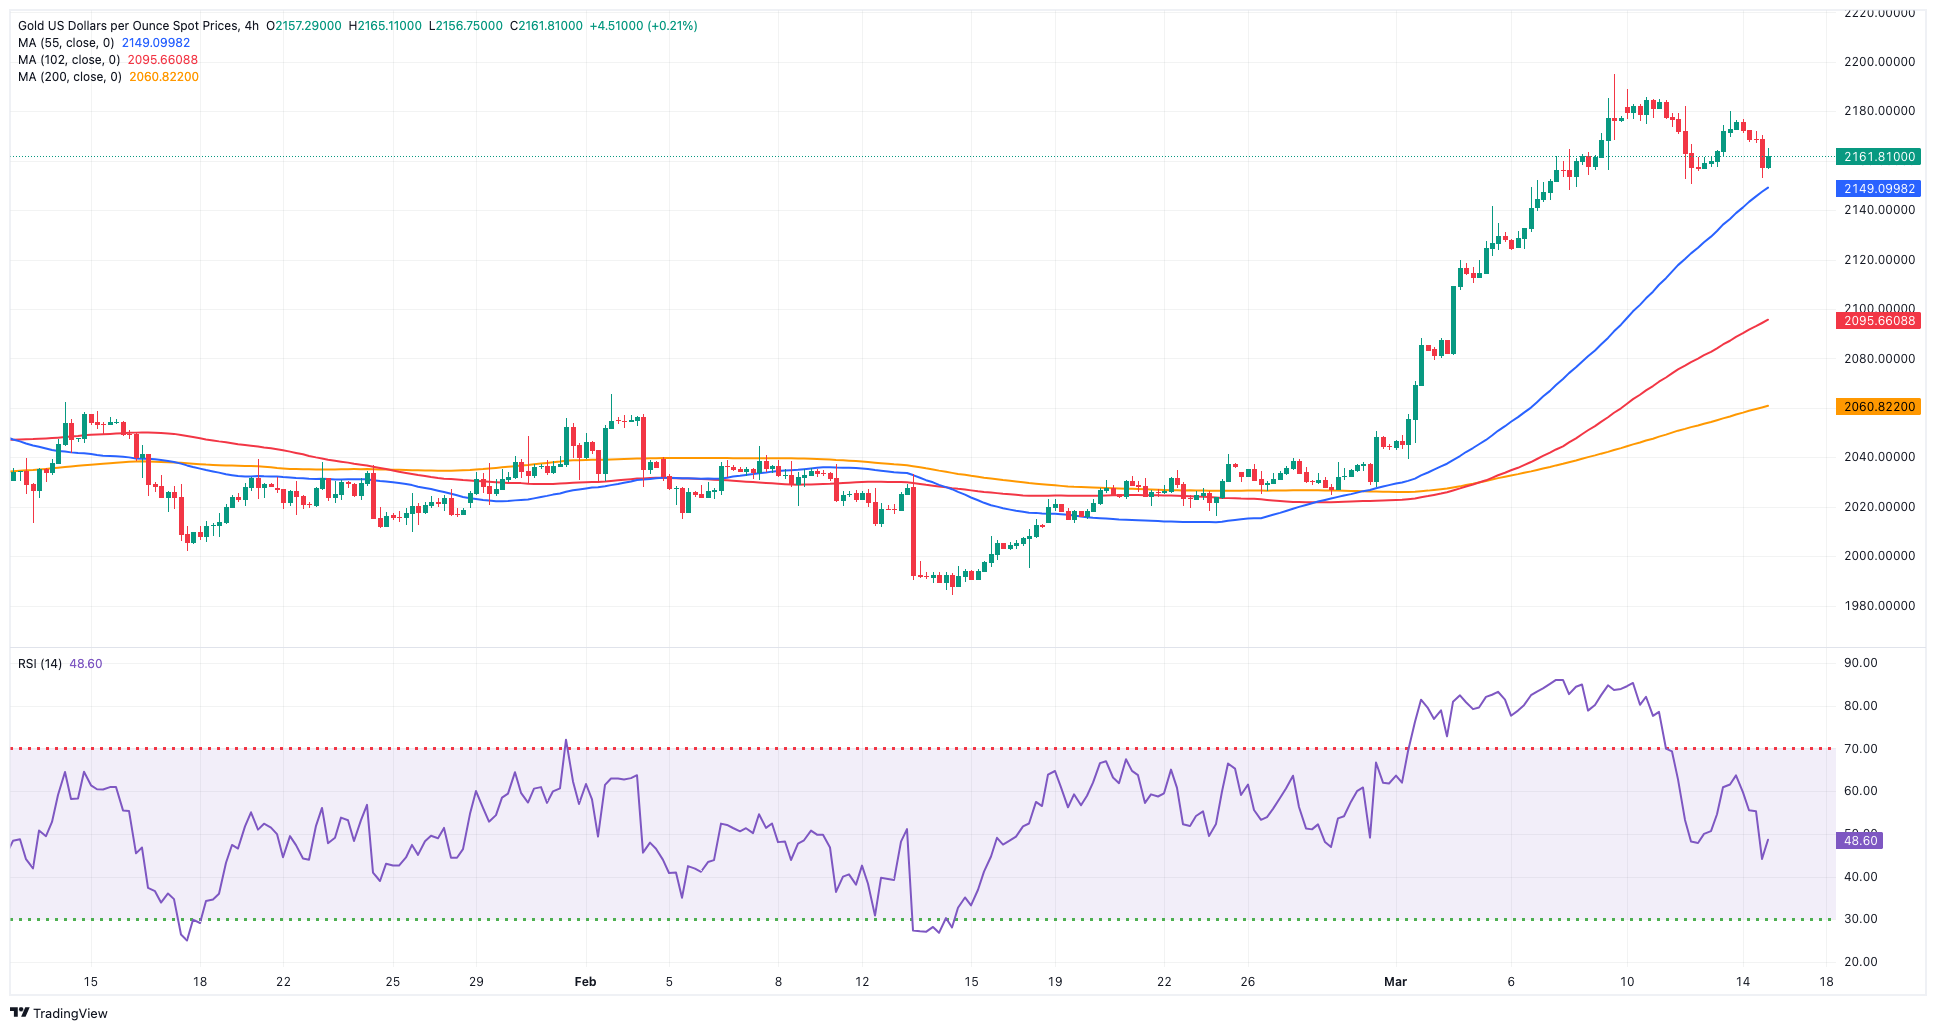
GOLD
Prices of the troy ounce of the yellow metal met another wave of selling orders and rapidly faded Wednesday’s rebound, returning to the $2,150 zone on Thursday.
Data-driven strength benefited the greenback while maintaining the upside momentum in US yields unchanged for yet another session, all amidst persistent expectations of the start of the easing cycle by both the Fed and the ECB at some point in the summer.
In the meantime, the $2,150 area seems to have emerged as quite a decent contention zone for the time being.
If bulls regain the upper hand, Gold should challenge its all-time high of $2,195 (March 8) sooner rather than later. On the other hand, the 55-day and 100-day SMAs of $2,050 and $2,028 should provide temporary support, respectively, followed by the 2024 low of $1,984 (February 14) and the December 2023 low of $1,973, which is supported by its proximity to the critical 200-day SMA of $1,975 and precedes the November 2023 low of $1,931. The breach of the latter may prompt the yellow metal to retest its October 2023 bottom of $1,810, which is higher than the 2023 low of $1,804 and the crucial $1,800 conflict zone.
Resistance levels: $2,179 $2,195 (4H chart)
Support levels: $2,152 $2,096 $2,060 (4H chart)
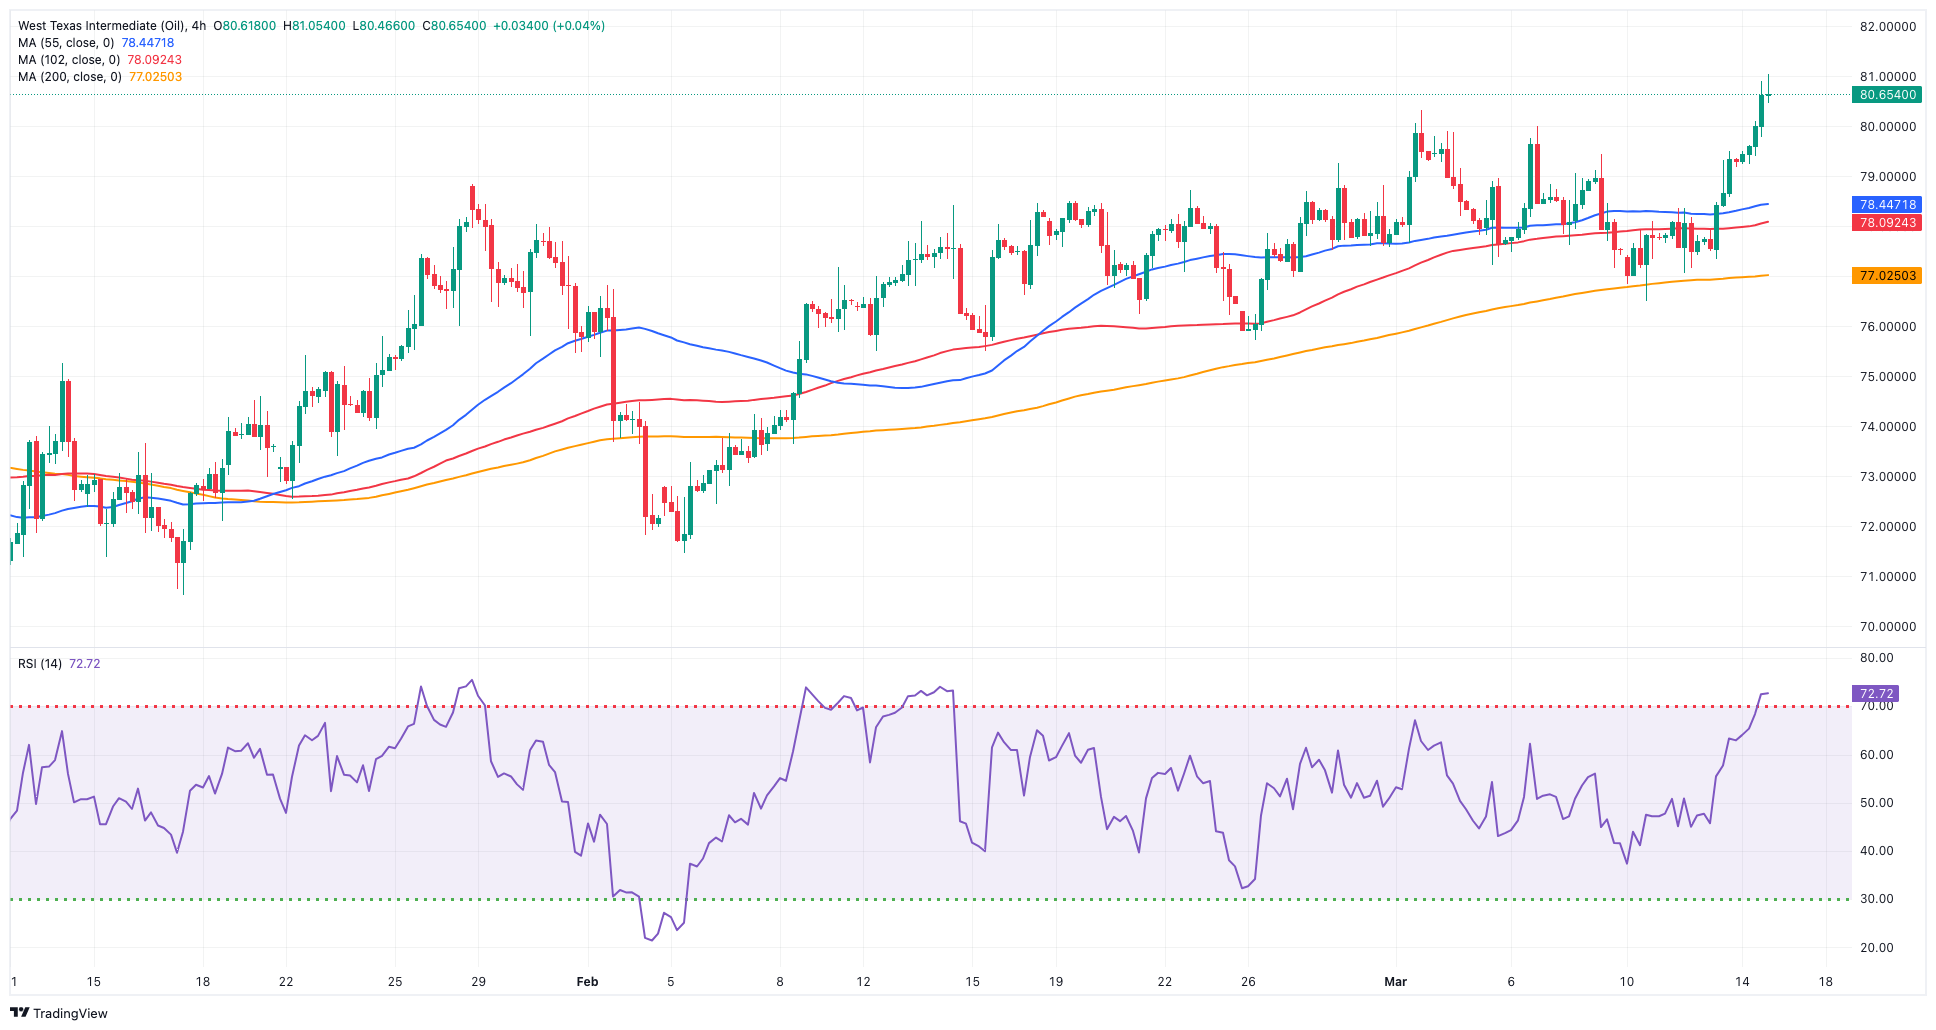
CRUDE WTI
WTI prices added to Wednesday’s uptick and climbed to levels last seen in early November, north of the $81.00 mark per barrel on Thursday.
Extra gains in crude oil prices exclusively came in response to the upbeat assessment of the market by the IEA in its report published earlier in the session.
According to the latest report from the Paris-based agency, global oil demand is projected to increase by 1.3 mbpd in 2024, which is an upward revision of 110 kbpd compared to last month's estimate. The report also forecasts a minor supply deficit for this year, following the extension of production cuts by OPEC+ members.
Adding to the strong upside pressure in the commodity remained the Red Sea crisis and the unexpectedly strong drop of gasoline stockpiles (5.662M barrels), as per the EIA’s weekly report released on Wednesday, while omnipresent concerns stemming from China carry the potential to somehow limit the upside potential.
The next upward challenge for WTI is the 2024 peak of $81.58 (March 14), which precedes the weekly high of $89.83 (October 18, 2023) and the 2023 top of $94.99 (September 28, 2023). Further north, the weekly peak of $97.65 (August 30) comes before the psychological $100.00 barrier. Having said that, the 100-day and 55-day SMAs should provide brief support around $75.81 and $75.69, respectively, before sliding to the February low of $71.43 (February 5). Extra losses highlight the important $70.00 milestone ahead of the 2024 bottom of $69.31 (January 3).
Resistance levels: $81.44 $83.56 $85.85 (4H chart)
Support levels: $76.76 $75.81 $71.37 (4H chart)
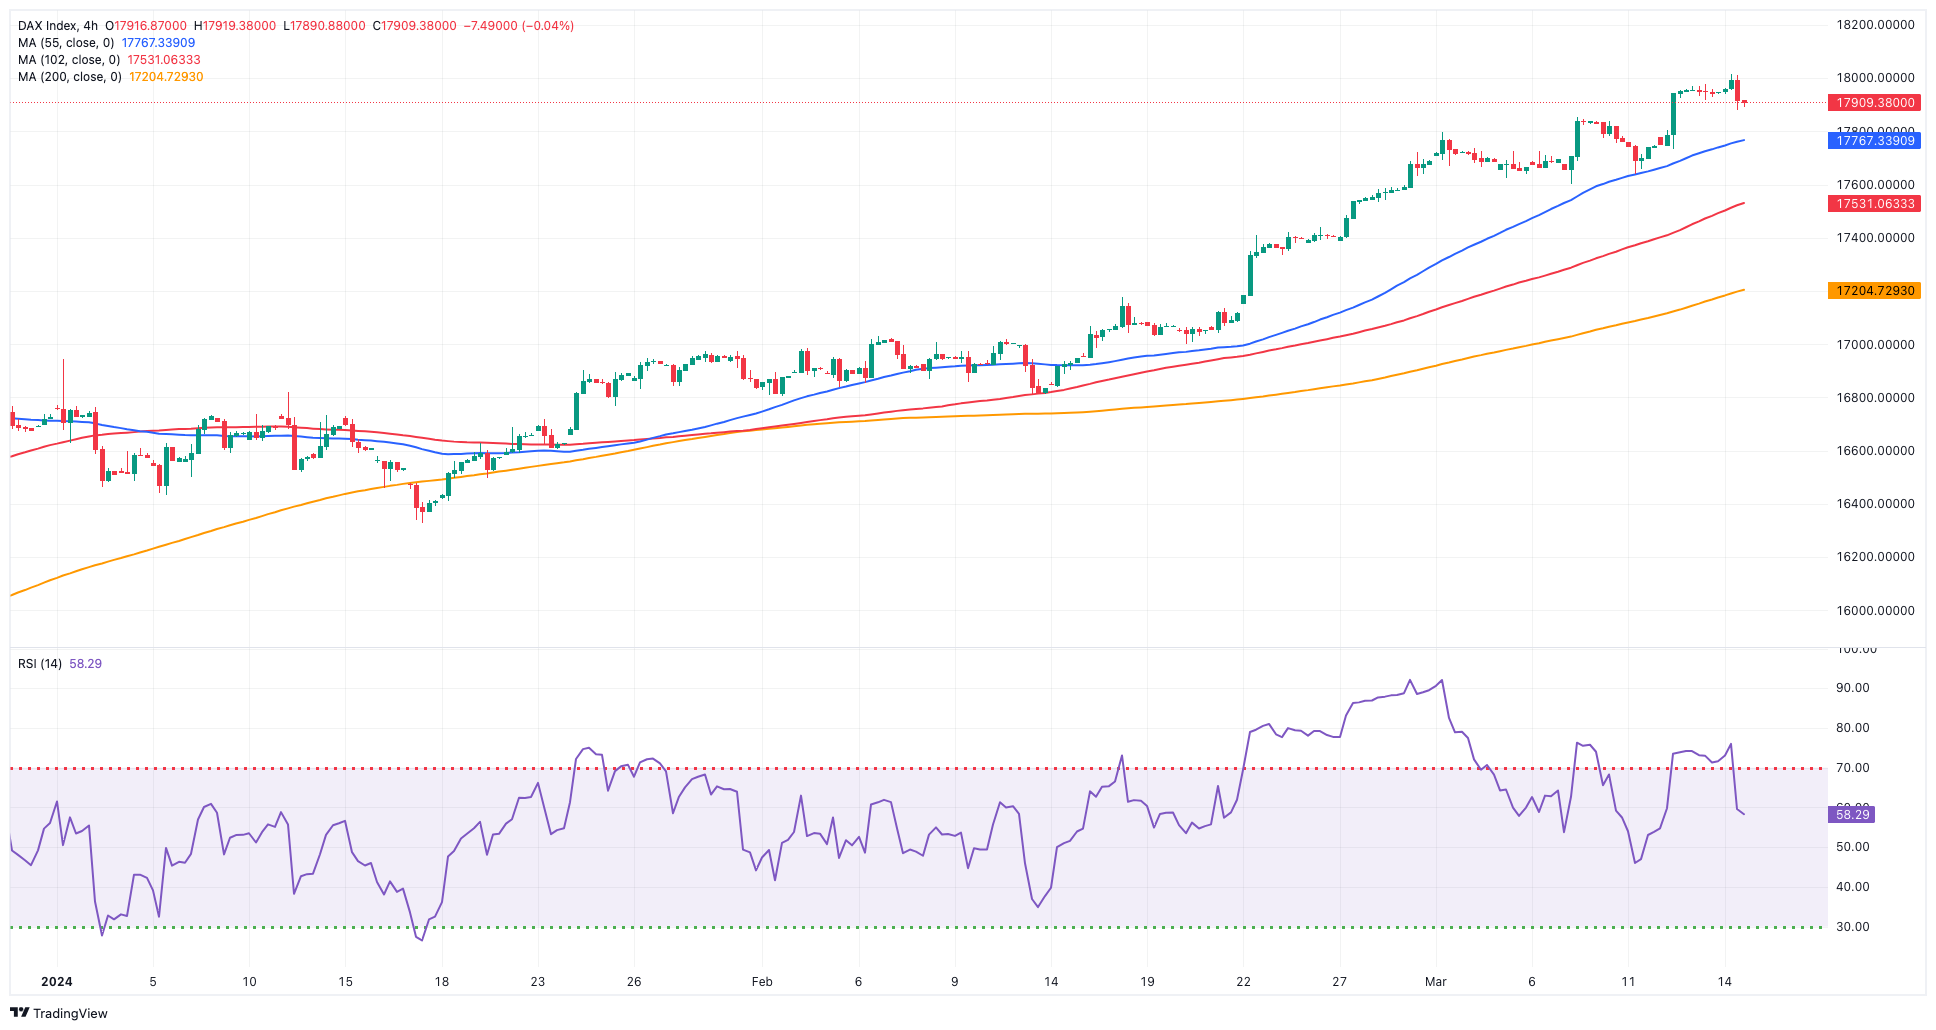
GER40
European stock markets closed mostly on the defensive on Thursday with the exception of France’s reference CAC40, all in the context of a broad-based, marked risk-off sentiment.
Regarding the DAX40, the index came under pressure after hitting a record peak past the 18,000 mark, retreating for the second session in a row at the same time.
In the meantime, renewed weakness in the market was ignited by fresh uncertainty around the potential timing of the ECB and the Fed easing cycles, particularly following comments from ECB rate setters and firmer US inflation figures.
In the meantime, 10-year bund yields climbed to multi-day highs and approached 2.45%.
The next level of resistance for the DAX40 is the record high of 18,039 (on March 14). The other way around, the 55-day SMA around 17,072 should offer brief contention prior to the February low of 16,821 (February 1). If the index goes below this level, a challenge to the 2024 bottom at 16,345 (January 17) might emerge ahead of the key 200-day SMA at 16,163. Once the latter is cleared, the index may confront the weekly low of 15,915 (November 28), ahead of the October 2023 low of 14,630 (October 23) and the 2023 bottom of 14,458 (March 20). The daily RSI fell to the 75 region, indicating that the market remained severely overbought.
Best Performers: Rheinmetall AG, Adidas, Siemens Energy AG
Worst Performers: RWE AG ST, BMW ST, Zalando SE
Resistance levels: 18,039 (4H chart)
Support levels: 17,619 17,009 16,831 (4H chart)
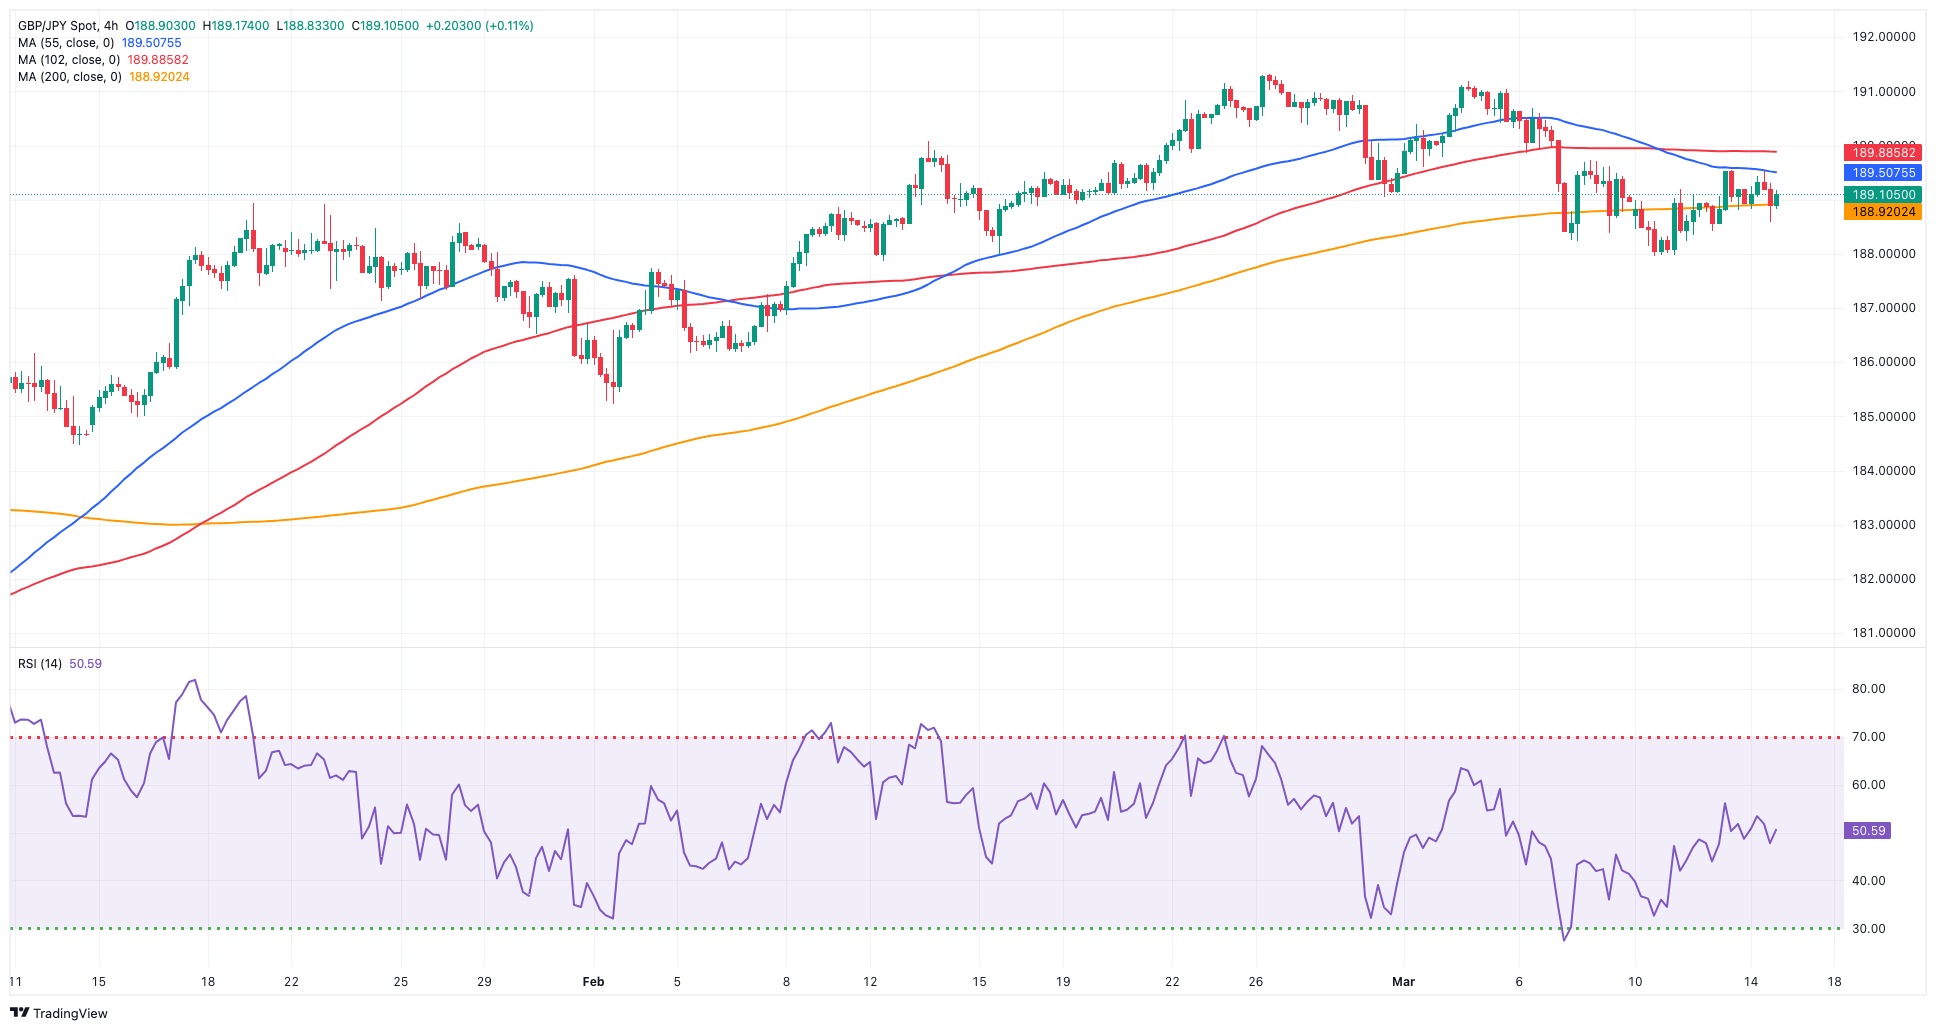
GBPJPY
The sharp corrective decline in the British pound was enough to spark a reversal in GBP/JPY on Thursday.
Indeed, the greenback’s robust performance forced the cross to give away part of the recent gains and return to negative territory despite the persistent depreciation of the Japanese yen.
Meanwhile, traders persisted in closely monitoring the developments surrounding the BoJ and the possibility of an exit of its ultra-accommodative monetary stance during its meeting scheduled for March 18–19.
The next immediate target for GBP/JPY is the March low of 187.96 (March 11), with intermediate support levels at the 55-day and 100-day SMAs of 187.50 and 186.05, respectively. The breakdown of the latter might open the way for a move to the February low of 185.22 (February 1), ahead of the more important 200-day SMA at 184.16. From here, there are no significant support levels until the December 2023 low of 178.33 (December 14), which precedes the October 2023 low of 178.03 and the July 2023 bottom of 176.30. On the other hand, the initial resistance is located at the 2024 peak of 191.32 (February 26), followed by the August 2015 high of 195.28 (August 18) and the record top of 195.88 (June 24, 2015). The day-to-day RSI retreated to around 48.
Resistance levels: 189.54 189.72 191.19 (4H chart)
Support levels: 187.96 186.44 185.22 (4H chart)
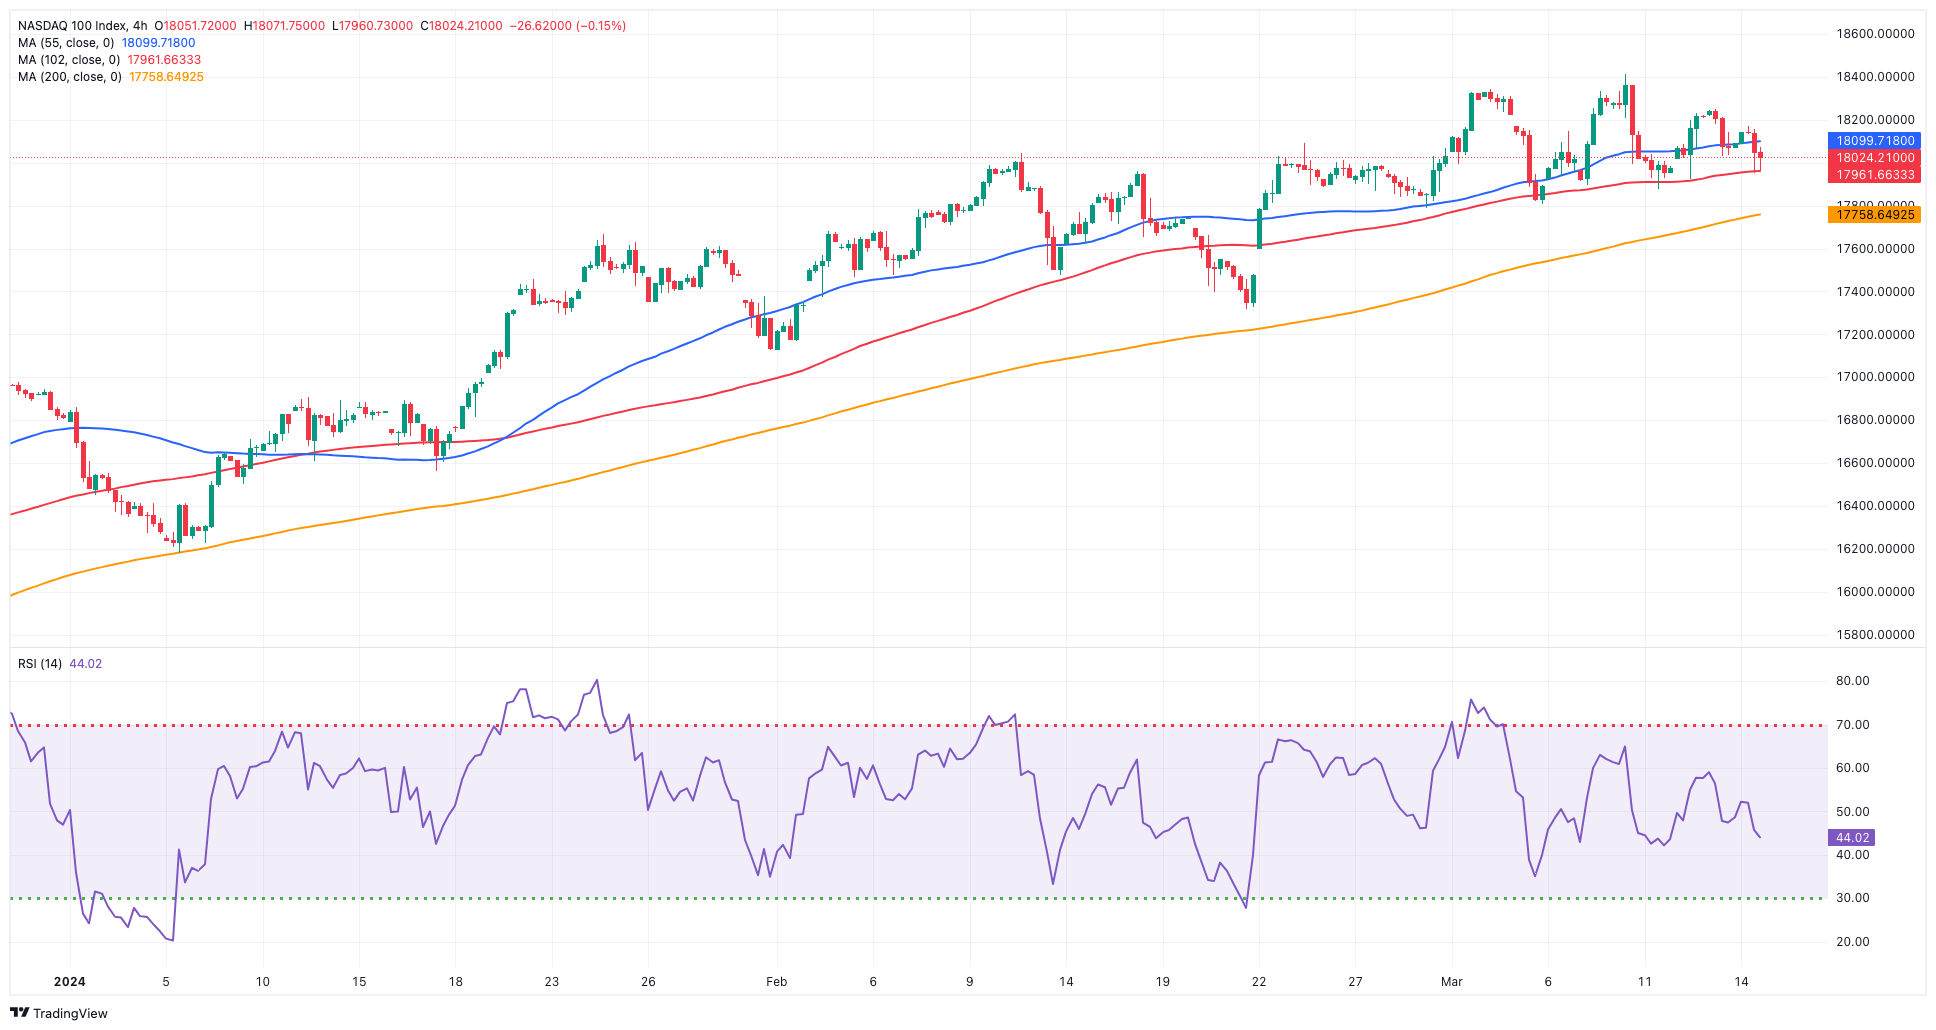
NASDAQ
Sellers remained in control of the US tech sector on Thursday, sparking the second straight session of losses in the benchmark Nasdaq 100.
In fact, extra weakness hurt tech equities after another stronger-than-expected release of US inflation, this time from Producer Prices, while the tight labour market and some cooling of consumer spending also accompanied the downbeat sentiment among traders.
Also contributing to the selling tone lined up extra gains in the greenback as well as the persistent march north of US yields across the curve.
Further rises may push the Nasdaq 100 to challenge its all-time high of 18,416 (March 8). In the opposite direction, the index should find brief support around the 55-day SMA of 17,461 before dropping to weekly lows of 17,319 (February 21) and 17,128 (January 31). Once the latter is cleared, the index may aim for the 2024 low of 16,249 (January 5), which is above the critical 200-day SMA of 15,865 and the December 2023 low of 15,695 (December 4). Additional losses from here may test the October 2023 low of 14,058 (October 26), which precedes the April 2023 low of 12,724 (April 25), the March 2023 low of 11,695 (March 13), and the 2023 low of 10,696 (January 3). The everyday RSI dropped back to 54.
Top Gainers: Microsoft, Alphabet A, Alphabet C
Top Losers: Warner Bros Discovery, Tesla, AMD
Resistance levels: 18,416 (4H chart)
Support levels: 17,804 17,319 17,128 (4H chart)
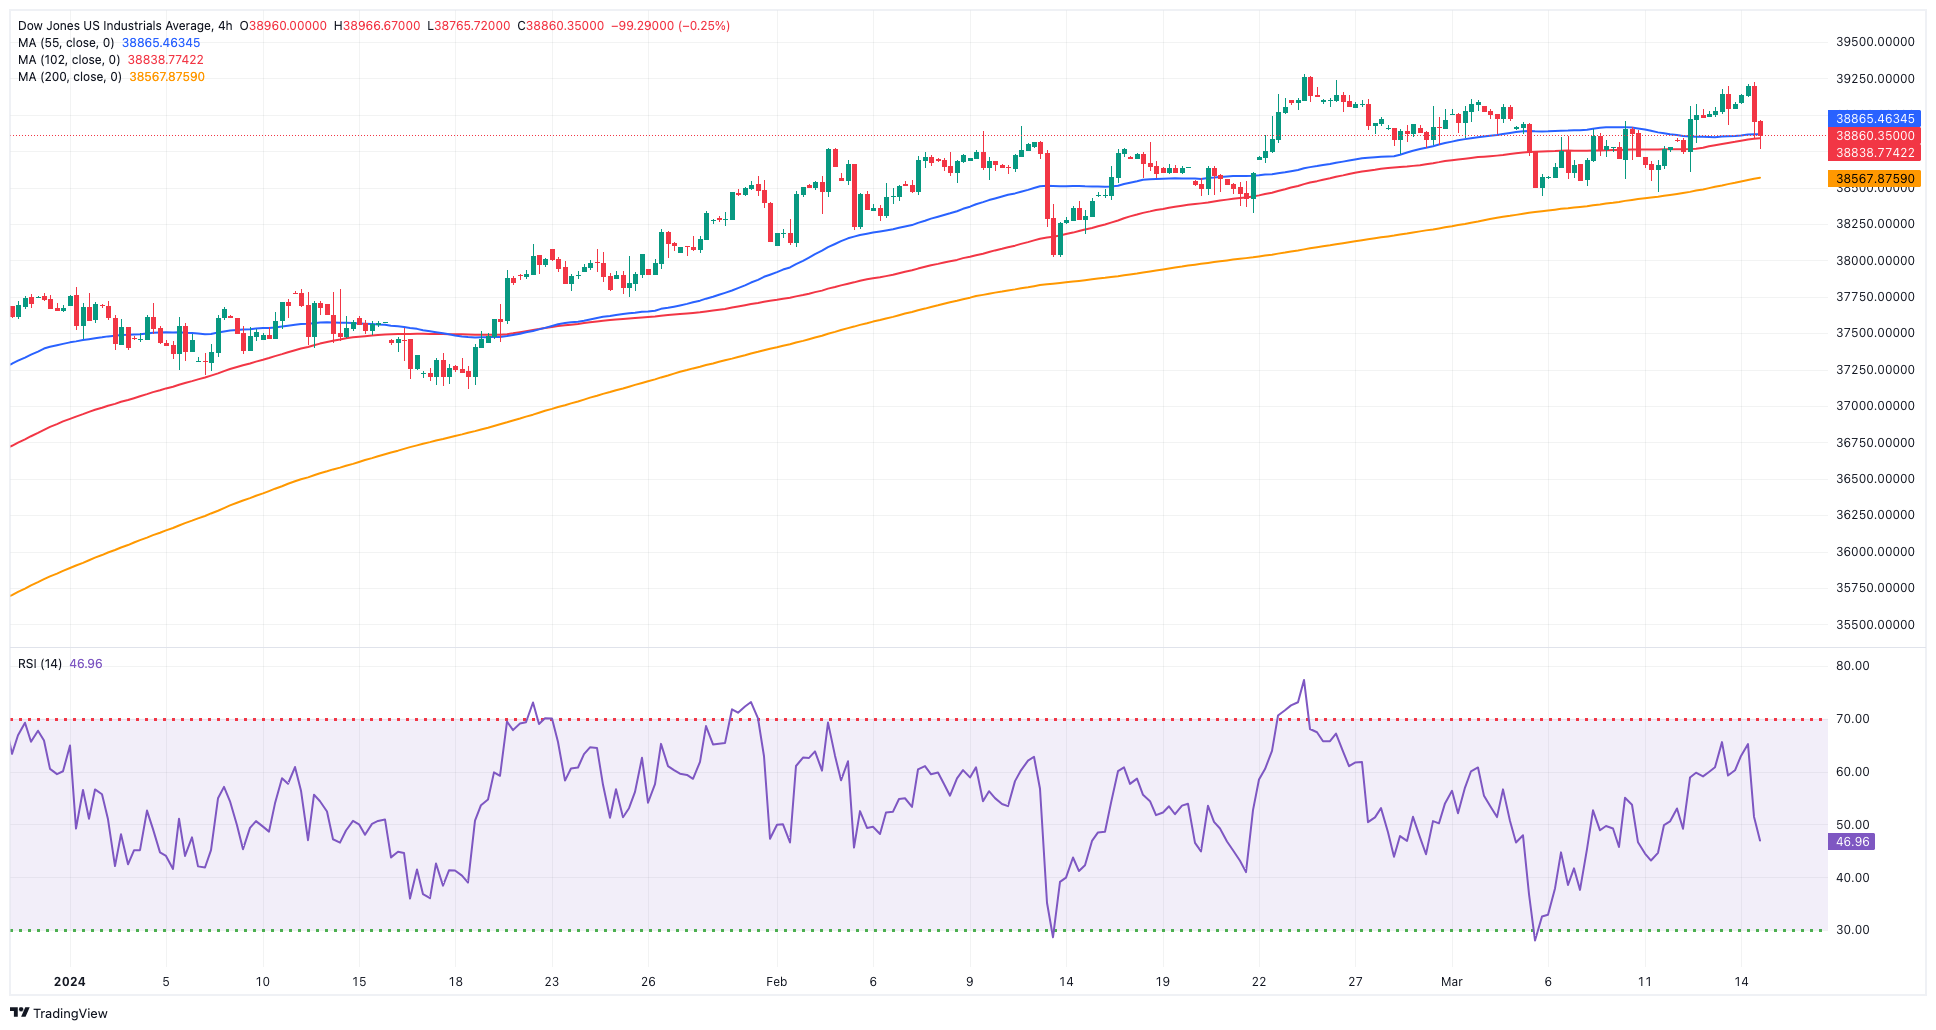
DOW JONES
US stocks tracked by the reference Dow Jones lost momentum and retreated modestly on Thursday.
In fact, strong weekly prints from the US labour market coupled with further signs of sticky inflation seem to have triggered fresh uncertainty regarding the timing of the first interest rate cut by the Fed as well as the quantity of rate cuts this year.
All in all, the Dow Jones dropped 0.42% to 38,880, the S&P 500 retreated 0.34% to 5,147, and the tech-focused Nasdaq Composite eased by 0.07% to 16,165.
Further gains in the Dow Jones continue to target its record high of 39,282 (February 23). On the contrary, the 55-day SMA of 38,301 provides intermediate support, followed by the 2024 low of 37,122 (January 18) and the weekly low of 37,073 (December 20, 2023). If the index goes below this level, it might confront the provisional 100-day SMA at 36,871, which comes before the 200-day SMA at 35,594. The weekly low of 33,859 (November 7, 2023) comes next, seconded by the October 2023 low of 32,327 (October 27) and the 2023 bottom of 31,429 (March 15). The daily RSI deflated to the 55 zone.
Top Performers: Microsoft, Apple, Amazon.com
Worst Performers: Verizon, JPMorgan, IBM
Resistance levels: 39,282 (4H chart)
Support levels: 38,457 38,039 37,122 (4H chart)
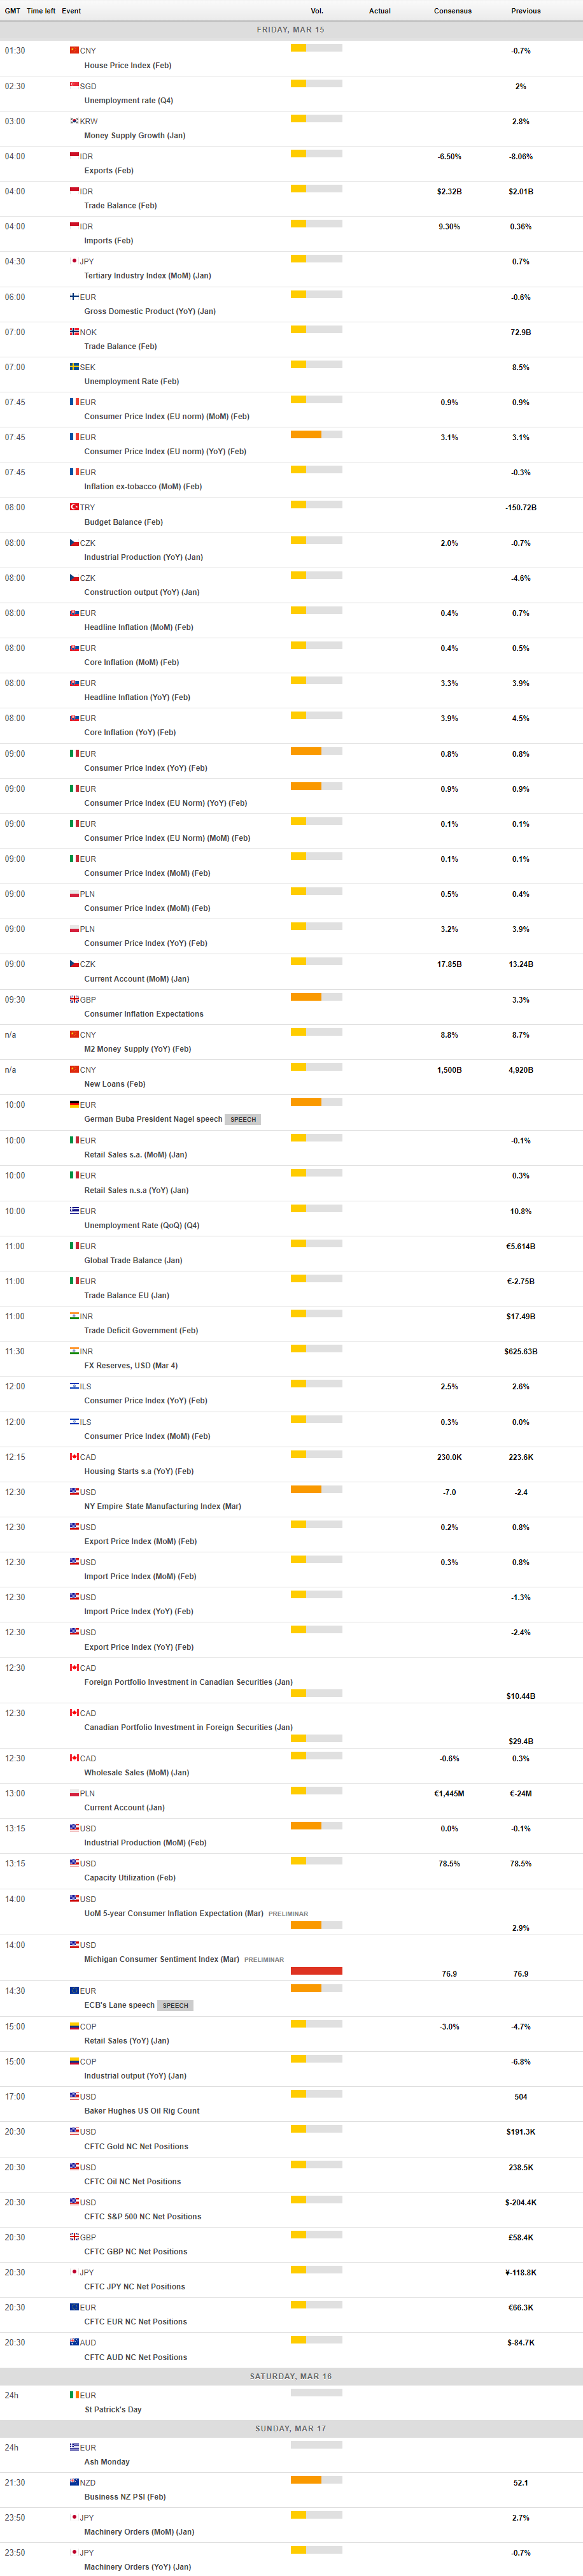
MACROECONOMIC EVENTS
All Information & Updates provided by:

All information relating to the financial markets available on this page has been prepared and issued by FXStreet (Forexstreet SL, Spain, Reg: B62498233) on the basis of publicly available information and all information believed to be reliable and does not conflict with Kuwaiti local laws, and all necessary care has been taken to before the company to ensure that the facts mentioned are correct from the source.
NCM Investment nor any of its directors or employees shall in any way be held responsible for the contents of this news, and the information contained on this page is intended only to provide clients with publicly available information and should not be construed as investment advice, report or analysis and/or constitute an offer or invitation to buy or sell financial instruments of any kind.
RISK WARNING: Forex and CFDs are highly risky leveraged products, as losses can exceed deposits. Please ensure you understand all the risks and take independent advice if necessary. NCM will segregate the clients based on the criteria of the regulator and its bylaws. NCM does not provide any advisory service; the material published does not constitute advice or a recommendation for a transaction in any financial instrument. NCM accepts no responsibility for any use of the content presented and any consequences of that use. Anyone acting on the information provided does so at their own risk.