
- Contact Us:
-

-

-

-


Daily Market Updates
18 Mar 2024
EURUSD
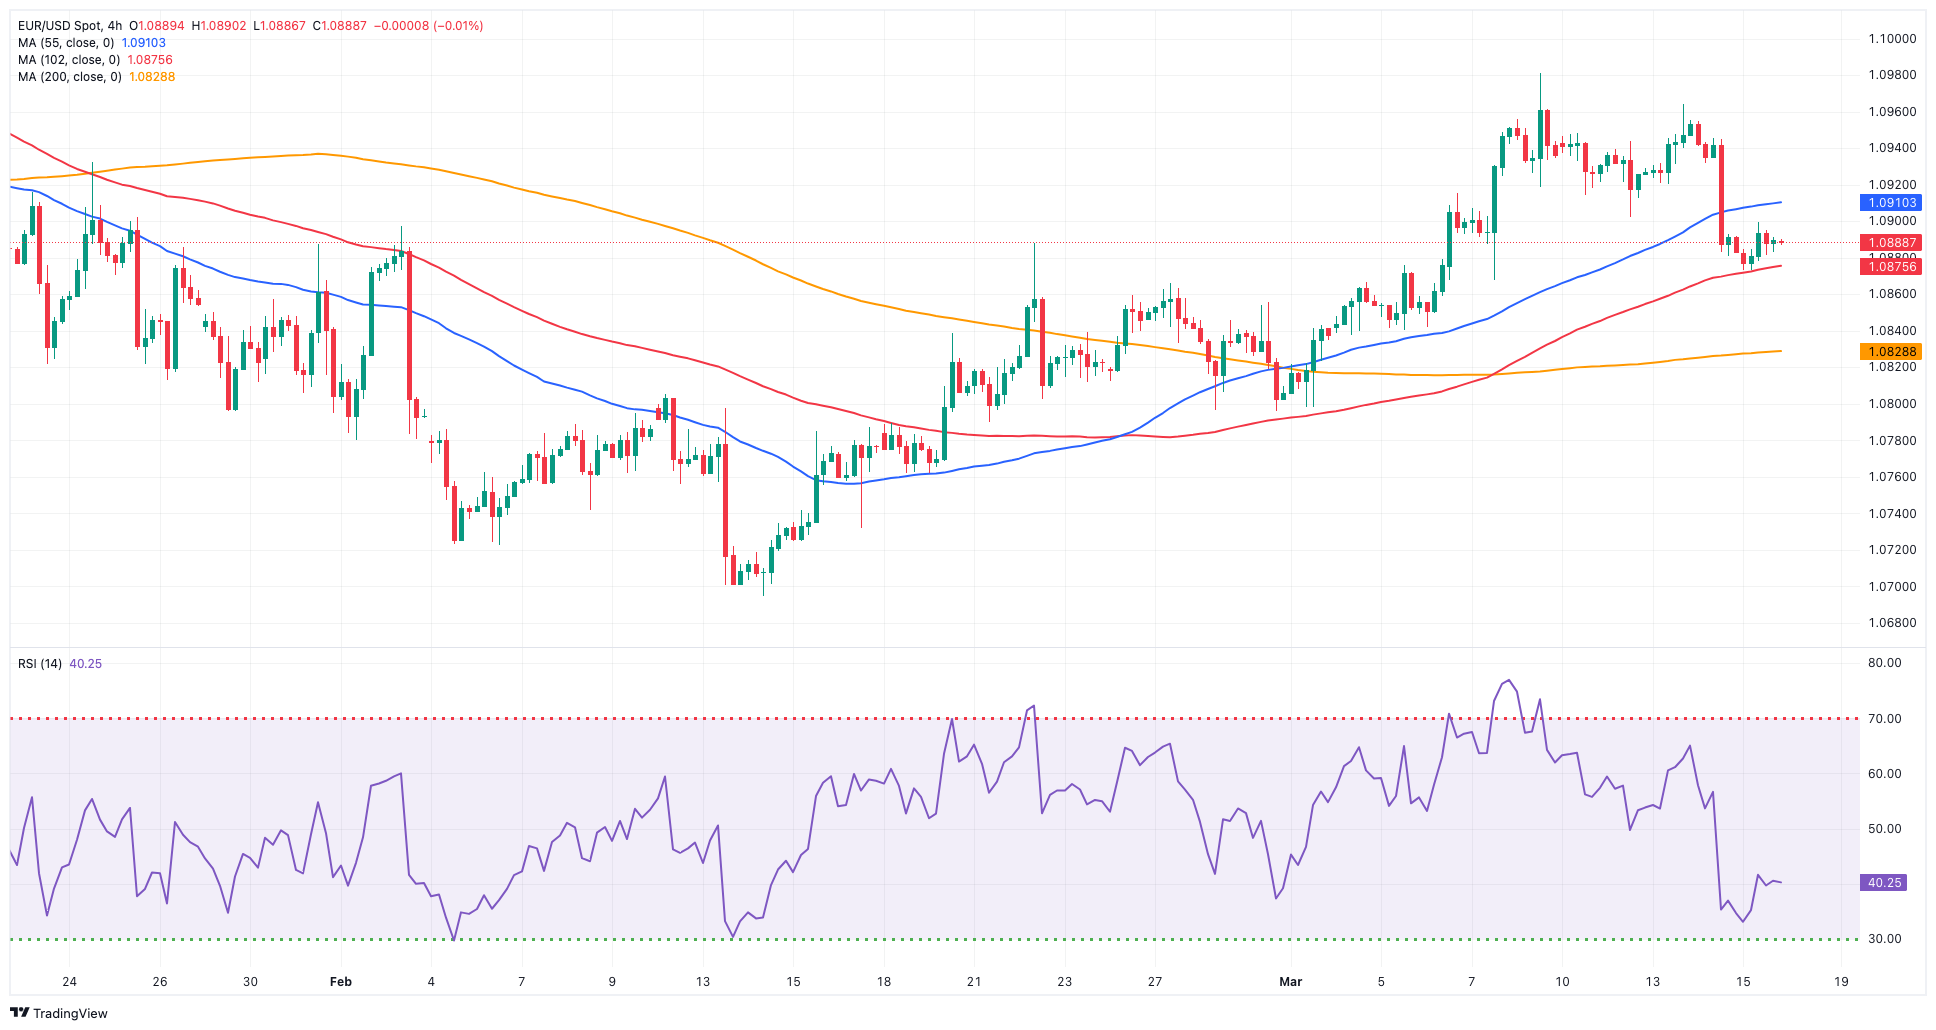
The tenacity of the bullish sentiment in the greenback remained well in place on Friday, prompting the USD Index (DXY0) to add to the optimism seen in the latter part of the week.
Against that backdrop, EUR/USD was able to clinch marginal gains and close the session in the 1.0885/90 band amidst the broad-based weekly retracement.
The small gains in the pair came on the back of the unabated march north in US yields, this time in the short end and the belly of the curve, while German 10-year bund yields eased marginally after several sessions of gains, always amidst growing confidence in a rate cut by the Fed and the ECB in June.
In the US calendar, industrial production expanded by 0.1% MoM in February and contracted by 0.2% over the last twelve months. In addition, the preliminary Michigan Consumer Sentiment eased to 76.5 for the month of March.
The initial resistance level for EUR/USD is the March high of 1.0981 (March 8). North of here is the weekly top of 1.0998 (January 5, 2011), just before the psychological 1.1000 threshold. The breakout of this zone may pave the way for a challenge to the December 2023 peak of 1.1139 (December 27), which is supported by the 200-week SMA of 1.1148 and occurs before the 2023 high of 1.1275 (July 18). In contrast, the loss of the 200-day SMA at 1.0837 might put pressure on the weekly low of 1.0795 (February 29), prior to the 2024 low of 1.0694 (February 14). A further slide might touch the weekly low of 1.0495 (October 13, 2023), before the 2023 low of 1.0448 (October 3), and the round level of 1.0400. The daily RSI rose slightly past 53.
Resistance levels: 1.0981 1.0998 1.1139 (4H chart)
Support levels: 1.0872 1.0827 1.0795 (4H chart)
USDJPY
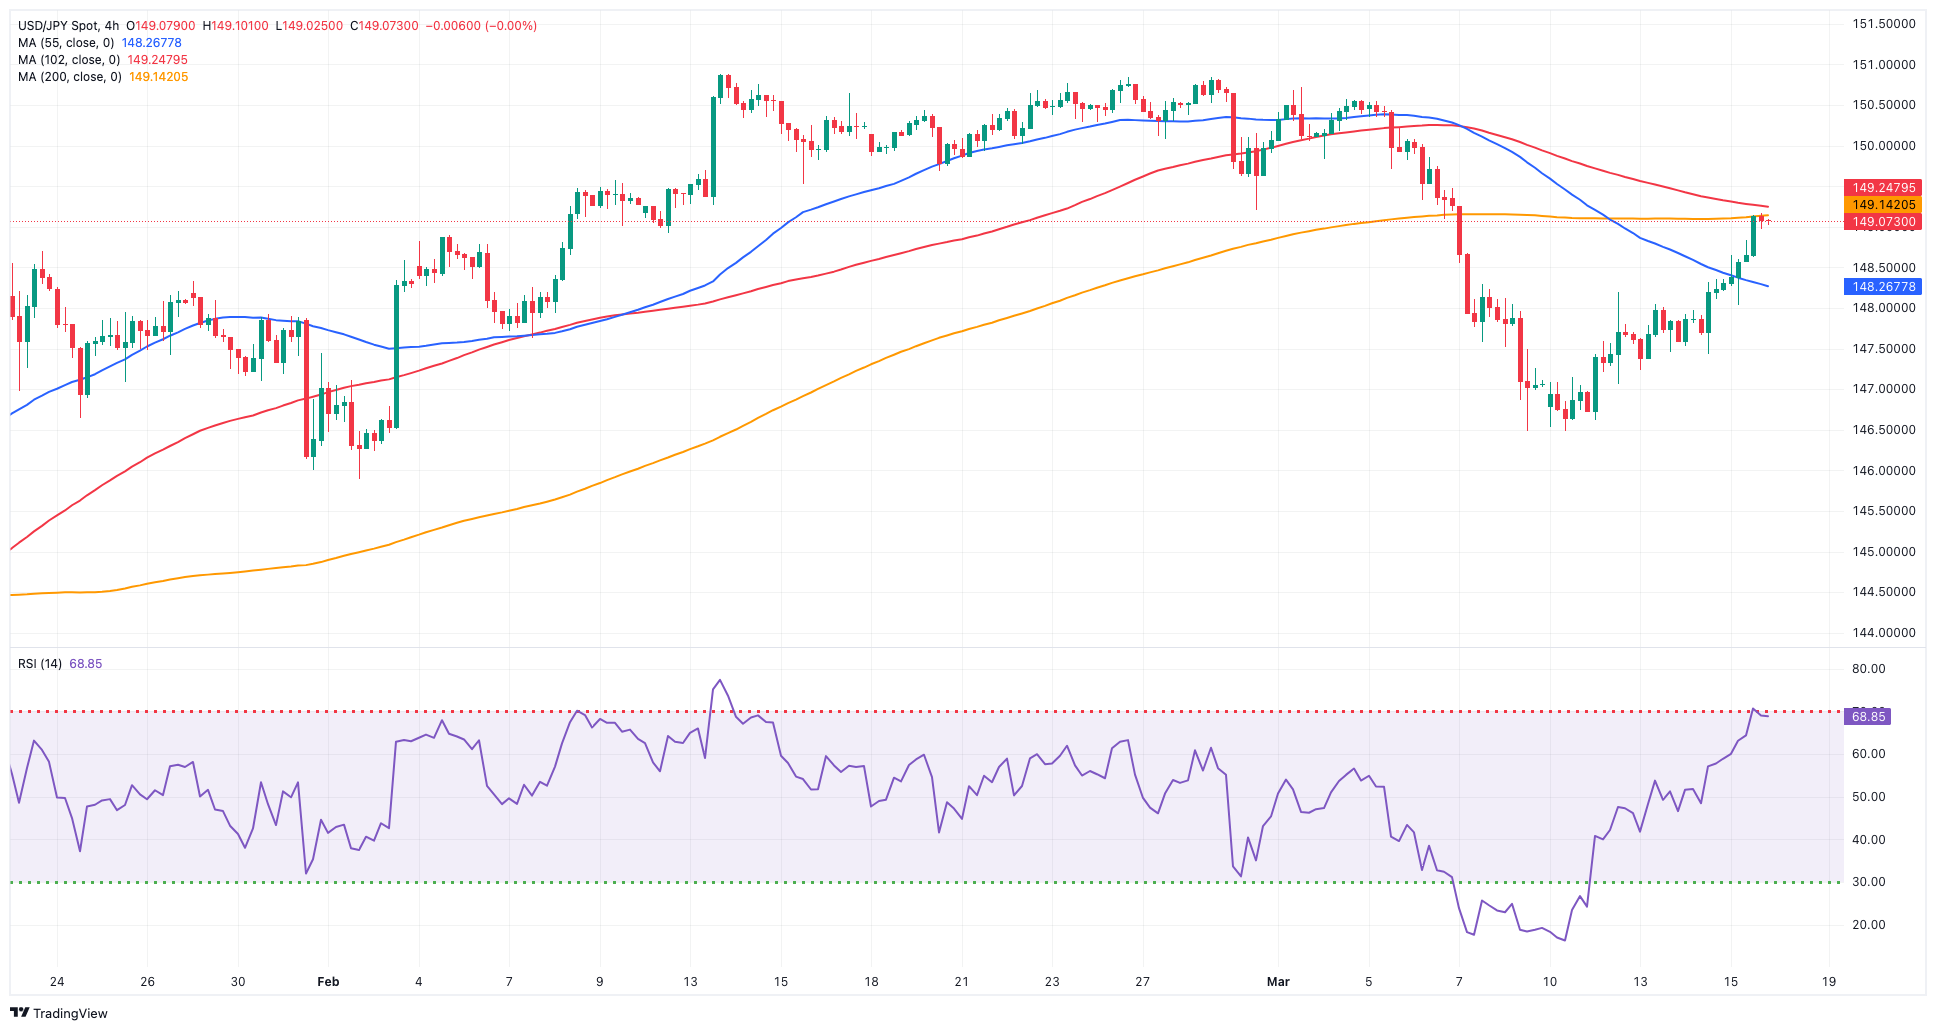
USD/JPY extended its gains for the fourth consecutive session at the end of the week, solidifying its rally, which briefly trespassed the 149.00 barrier, or fresh multi-day tops.
The modest upward movement in the dollar gained additional momentum pari passu with extra gains in US yields as market participants continued to assess the start of the Fed’s easing cycle in June.
Meanwhile, all eyes are on the upcoming BoJ meeting on March 18–19. On this, it is worth mentioning that Rengo, Japan's largest trade union federation, announced that total pay increases averaged 5.3% for this year, up from 3.8% in the previous year. Notably, base pay increases averaged 3.7% compared to 2.3% in the prior year.
In terms of data, the Tertiary Industry Index rose by 0.3% MoM in January.
The surpass of the weekly high of 149.16 (March 15) could motivate USD/JPY to attempt a move to the 2024 top of 150.88 (February 13), prior to the 2023 peak of 151.90 (November 13). Further up aligns the 2022 high of 151.94 (October 21) just before the round number 152.00. Instead, initial contention is seen at the March low of 147.47 (March 8), which appears bolstered by the key 200-day SMA at 146.36. The breach of the latter could pave the way to a potential visit to the February low of 145.89 (February 1) ahead of the December 2023 low of 140.24 (December 28), which precedes the round number 140.00 and the July low of 137.23 (July 14). The day-to-day RSI climbed to the 46 region.
Resistance levels: 149.16 150.71 150.88 (4H chart)
Support levels: 146.47 145.89 144.34 (4H chart)
GBPUSD
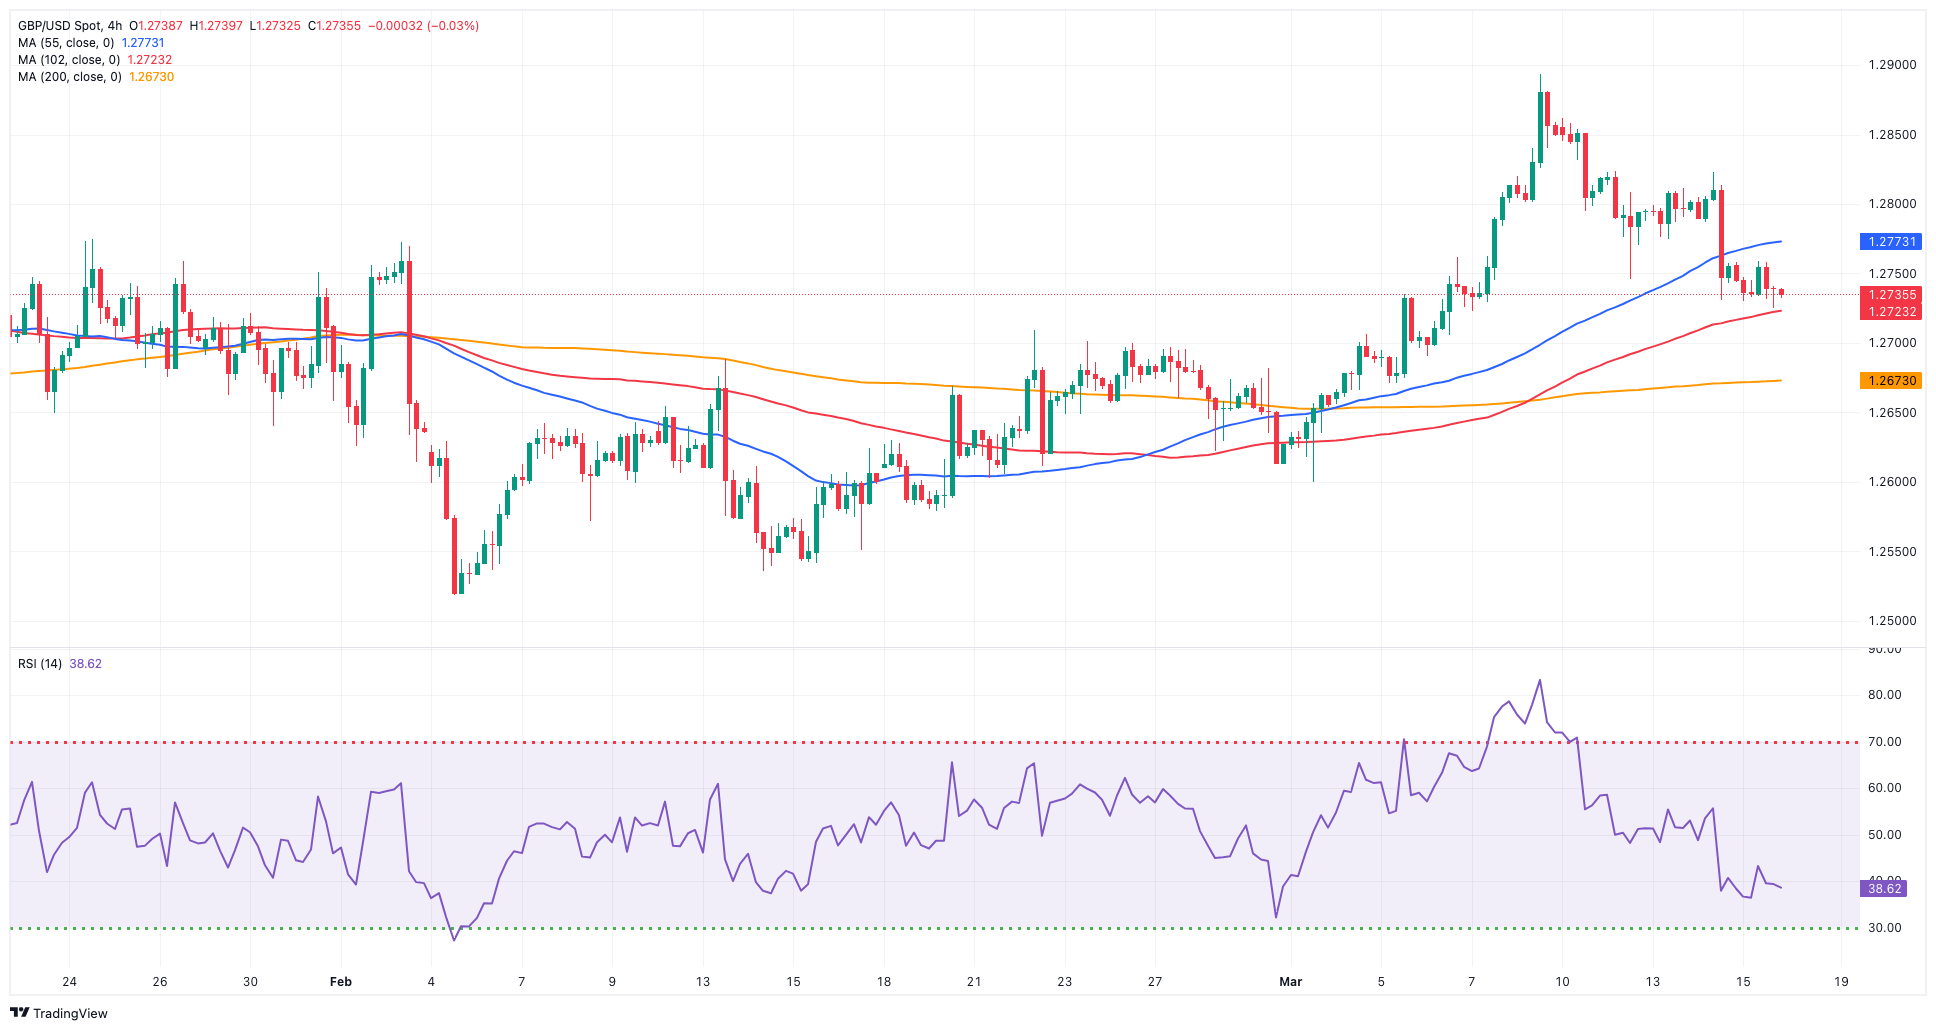
The sentiment surrounding risk-linked assets deteriorated further due to additional gains in the dollar on Thursday.
In this context, GBP/USD fell to multi-day lows in the low 1.2700s against the backdrop of further investors’ repricing of a potential interest rate cut by the Fed in June, while expectations remain firm around the start of the easing cycle by the BoE later in the year.
The continued weakness in the British pound contrasted with a marginal drop in UK 10-year gilts, easing below 4.10% after hitting multi-session peaks.
There were no data releases scheduled across the Channel on Friday.
Immediately to the downside for GBP/USD comes the weekly low of 1.2720 (March 15) ahead of the preliminary 55-day SMA at 1.2685 and followed by the March low of 1.2599 (March 1) and the critical 200-day SMA at 1.2589. The loss of this zone might bring the 2024 bottom of 1.2518 (February 5) back into focus, ahead of the December 2023 low of 1.2500 (December 13). A deeper decline should not find substantial support until the weekly low of 1.2187 (November 10, 2023), followed by the October 2023 low of 1.2037, the major 1.2000 barrier, and the 2023 low of 1.1802 (March 8). In the other direction, the next upward hurdle is the 2024 high of 1.2893 (March 8), followed by the weekly top of 1.2995 (July 27, 2023), all ahead of the significant 1.3000 milestone. On the daily chart, the RSI dropped below the 53 level.
Resistance levels: 1.2823 1.2893 1.2995 (4H chart)
Support levels: 1.2720 1.2671 1.2599 (4H chart)
GOLD
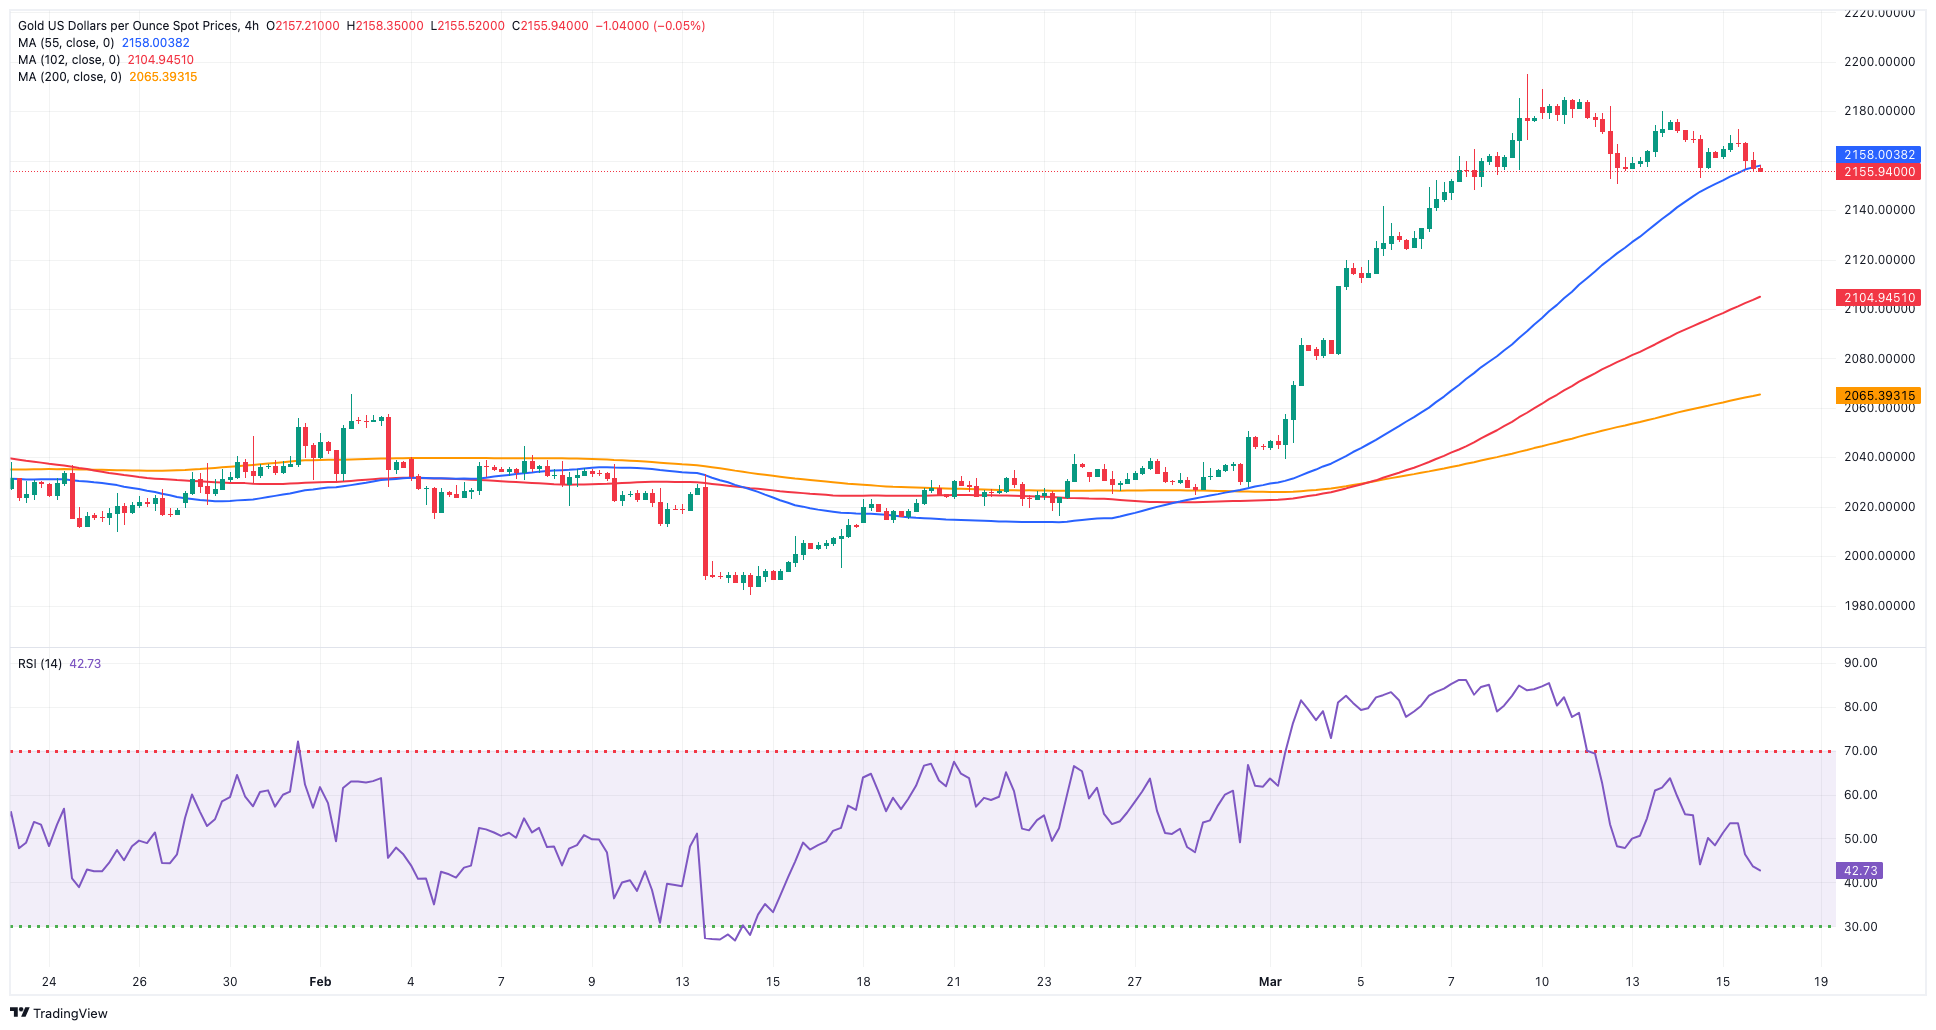
The price of a troy ounce of gold faced another round of selling pressure and came under extra pressure, dropping back to the $2,150 range at the end of the week.
Data-supported strength, exclusively from inflation figures, bolstered the greenback while keeping the upward momentum in US yields intact for another session, all amidst the loss of traction from potential easing measures by the Fed sometime in the summer.
Meanwhile, the $2,150 level appears to have become a significant support zone for now.
If bulls take control, gold will likely dispute its all-time high of $2,195 (March 8) sooner rather than later. On the other hand, the 55-day and 100-day SMAs of $2,053 and $2,032 should provide transitory support, followed by the 2024 low of $1,984 (February 14) and the December 2023 low of $1,973, which is supported by its proximity to the critical 200-day SMA of $1,977 and precedes the November 2023 low of $1,931. The breach of the latter might cause the yellow metal to retest its October 2023 low of $1,810, which comes ahead of the 2023 low of $1,804 and the critical $1,800 conflict zone.
Resistance levels: $2,172 $2,179 $2,195 (4H chart)
Support levels: $2,152 $2,106 $2,065 (4H chart)
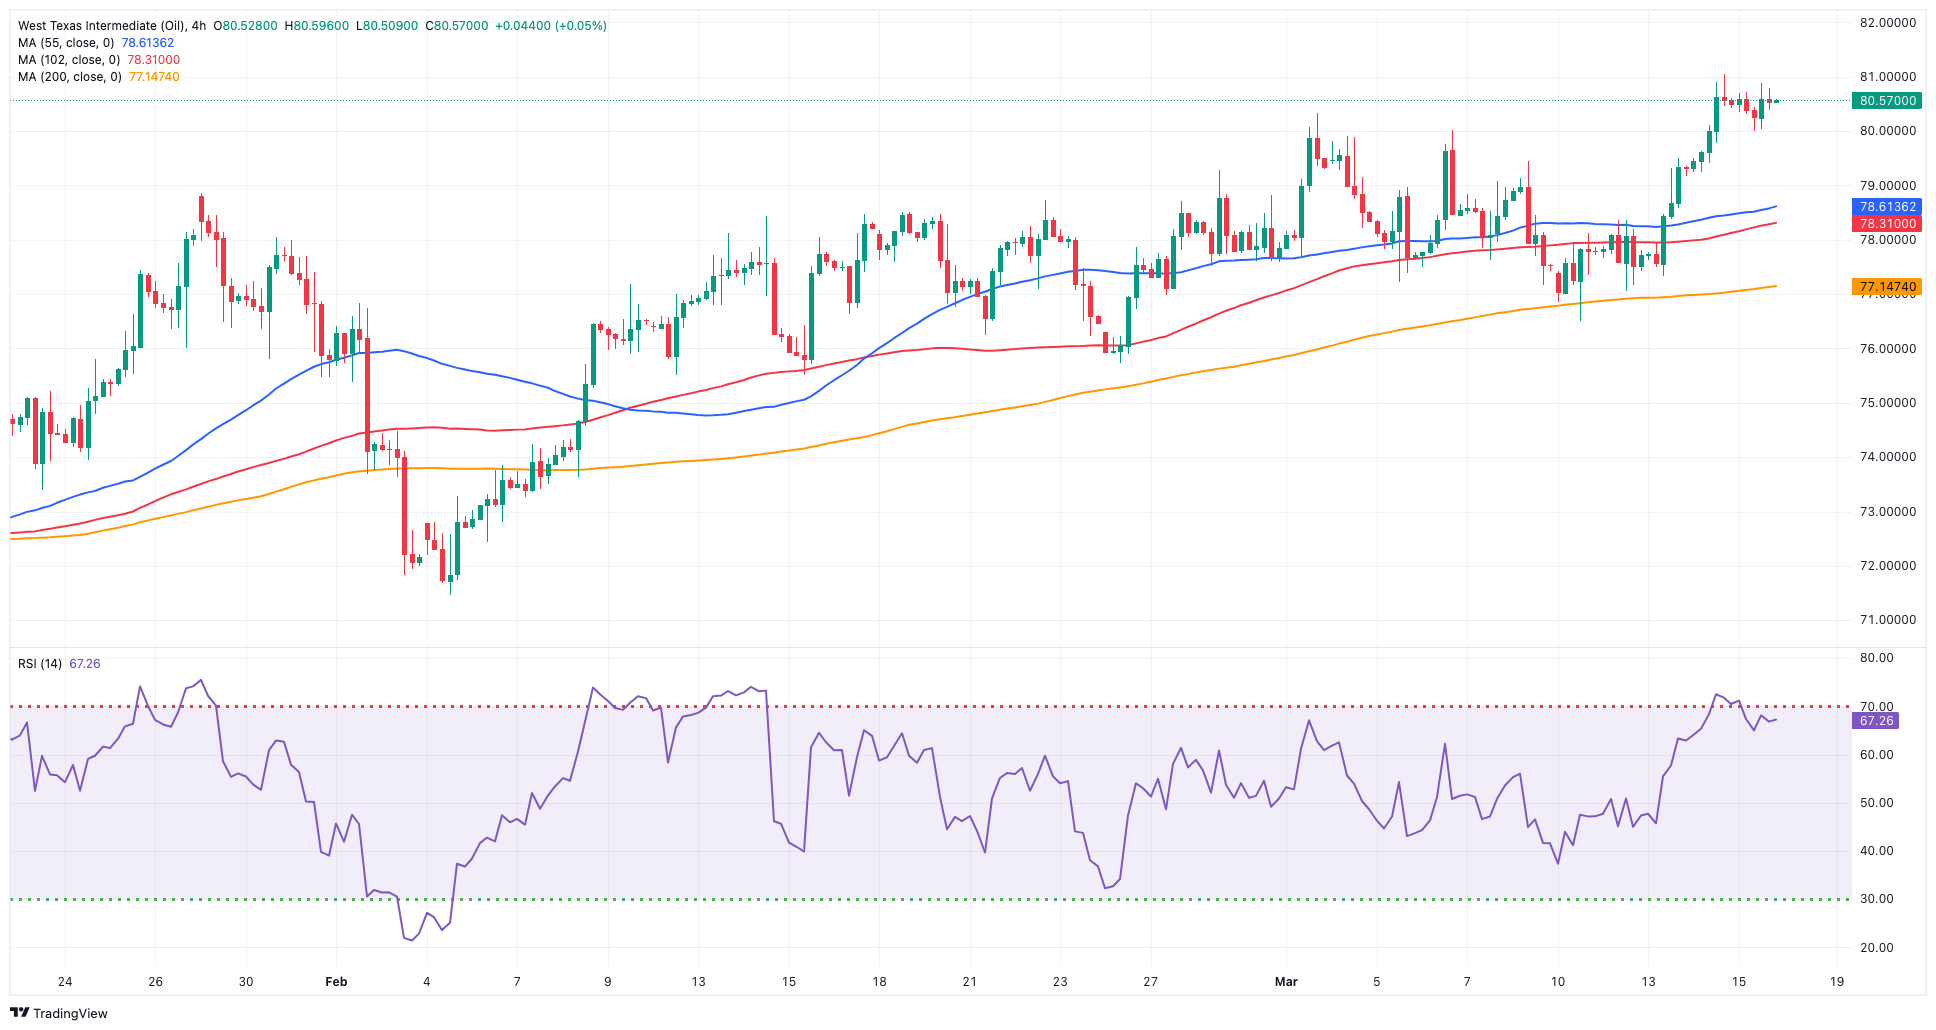
CRUDE WTI
WTI finished Friday's trading session with minimal change, hovering around the $81.00 per barrel level after reaching multi-month highs near $81.60 on Thursday.
The slight downward movement in the commodity was driven by renewed concerns about the possibility of the Fed not proceeding with its planned interest rate reductions, which were prompted by persistent US inflation readings.
However, weekly gains in crude oil prices were fueled by the resumption of the narrative surrounding tight supply as well as the positive market assessment provided by the IEA in its recently released report, where it projected that global oil demand is expected to increase by 1.3 mbpd this year.
Closing the weekly calendar, driller Baker Hughes reported an increase of 6 oil rigs to 510 US total oil rigs in the week to March 15.
The next upward challenge for WTI is the 2024 peak of $81.58 (March 14), which comes before the weekly high of $89.83 (October 18, 2023) and the 2023 top of $94.99 (September 28, 2023). Further north, the weekly top of $97.65 (August 30) precedes the psychological $100.00 barrier. The other way around, the 200-day SMA offers initial contention at $78.25 ahead of the February low of $71.43 (February 5). Extra losses underscore the significant $70.00 milestone ahead of the 2024 low of $69.31 (January 3).
Resistance levels: $81.58 $83.56 $85.85 (4H chart)
Support levels: $76.76 $75.81 $71.37 (4H chart)
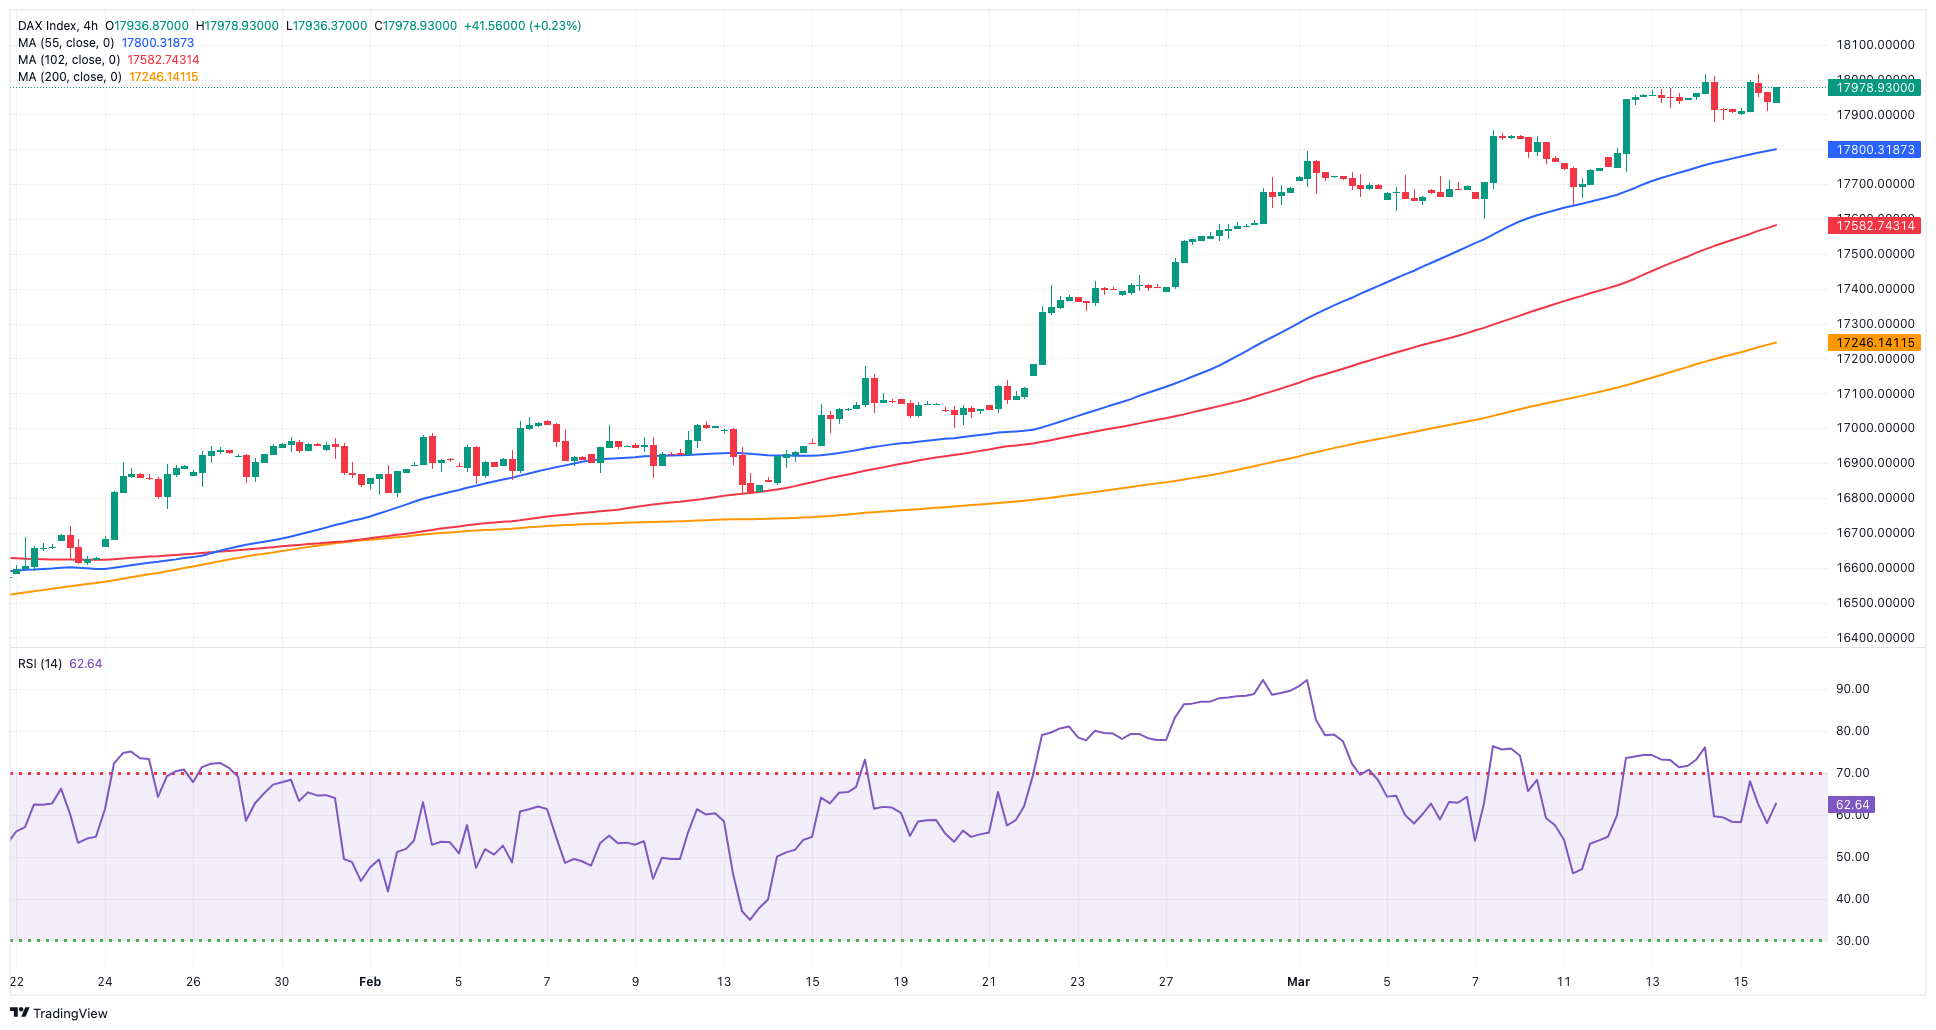
GER40
European stocks declined on Friday as investors maintained a cautious stance amid growing worries that the Fed might postpone interest rate cuts. Furthermore, the release of hotter-than-anticipated US inflation figures earlier this week has added uncertainty to the Fed's monetary policy trajectory.
In the meantime, further comments from ECB officials continued to place the start of the bank’s easing programme at some point in the summer.
That said, Germany’s benchmark DAX40 clinched its third consecutive daily drop, although it managed well to keep the trade in the upper end of the range and near its all-time peak.
Looking at the German bond market, 10-year bund yields eased marginally after four sessions in a row of gains.
The next level of resistance for the DAX40 is the record high of 18,039 (on March 14). Having said that, the 55-day SMA around 17,094 should offer brief contention prior to the February low of 16,821 (February 1). If the index goes below this level, a challenge to the 2024 bottom at 16,345 (January 17) might emerge ahead of the key 200-day SMA at 16,172. Once the latter is cleared, the index may confront the weekly low of 15,915 (November 28), ahead of the October 2023 low of 14,630 (October 23) and the 2023 bottom of 14,458 (March 20). The daily RSI fell to the sub-75 zone, indicating that the market remained overbought.
Best Performers: Rheinmetall AG, Daimler Truck Holding, Hannover Rueck SE
Worst Performers: Vonovia, Infineon, Merck
Resistance levels: 18,039 (4H chart)
Support levels: 17,619 17,028 16,831 (4H chart)
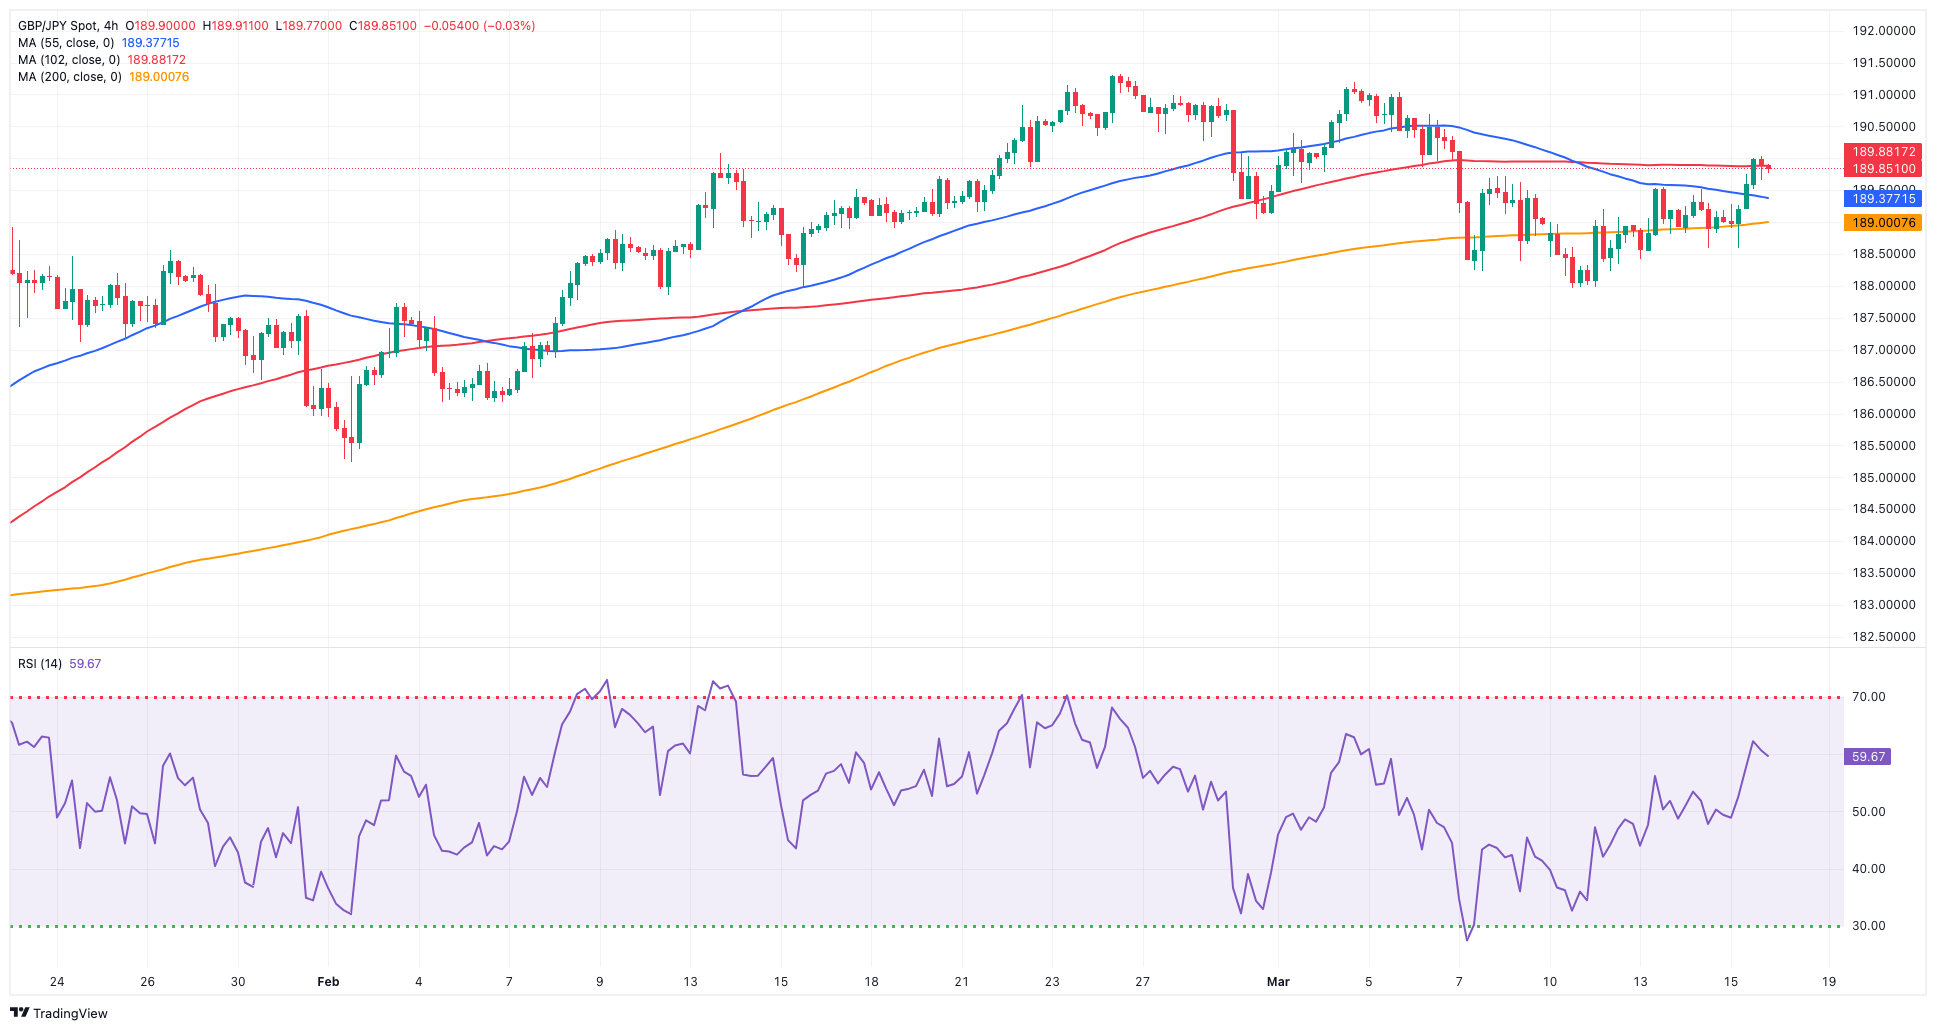
GBPJPY
GBP/JPY confirmed the weekly rebound and advanced to six-day highs just above the 190.00 hurdle at the end of the week, having advanced in the last four sessions.
While the better tone in the greenback and the dominating risk-off mood weighed on the quid, the persevering depreciation of the Japanese yen favoured extra upside in the cross, which closed the week with decent gains after two consecutive pullbacks.
In the meantime, traders continued to closely observe the developments regarding the BoJ and the potential shift away from its highly accommodative monetary policy stance. The BoJ's upcoming meeting, scheduled for March 18–19, is expected to shed light on this matter.
Immediately to the upside for GBP/JPY comes the weekly top of 190.02 (March 15) ahead of the 2024 peak of 191.32 (February 26), followed by the August 2015 high of 195.28 (August 18), and the record top of 195.88 (June 24). On the flip side, the March low of 187.96 (March 11) emerges as the initial support before the provisional support at the 55-day and 100-day SMAs of 187.69 and 186.13, respectively. The breakdown of the latter might put a test of the February low of 185.22 (February 1) back on the radar, ahead of the more crucial 200-day SMA at 184.24. South fro here, there are no substantial support levels until the December 2023 low of 178.33 (December 14), which precedes the October 2023 low of 178.03 and the July 2023 bottom of 176.30. The day-to-day RSI bounced to the vicinity of 55.
Resistance levels: 190.02 191.19 191.85 (4H chart)
Support levels: 187.96 186.44 185.22 (4H chart)
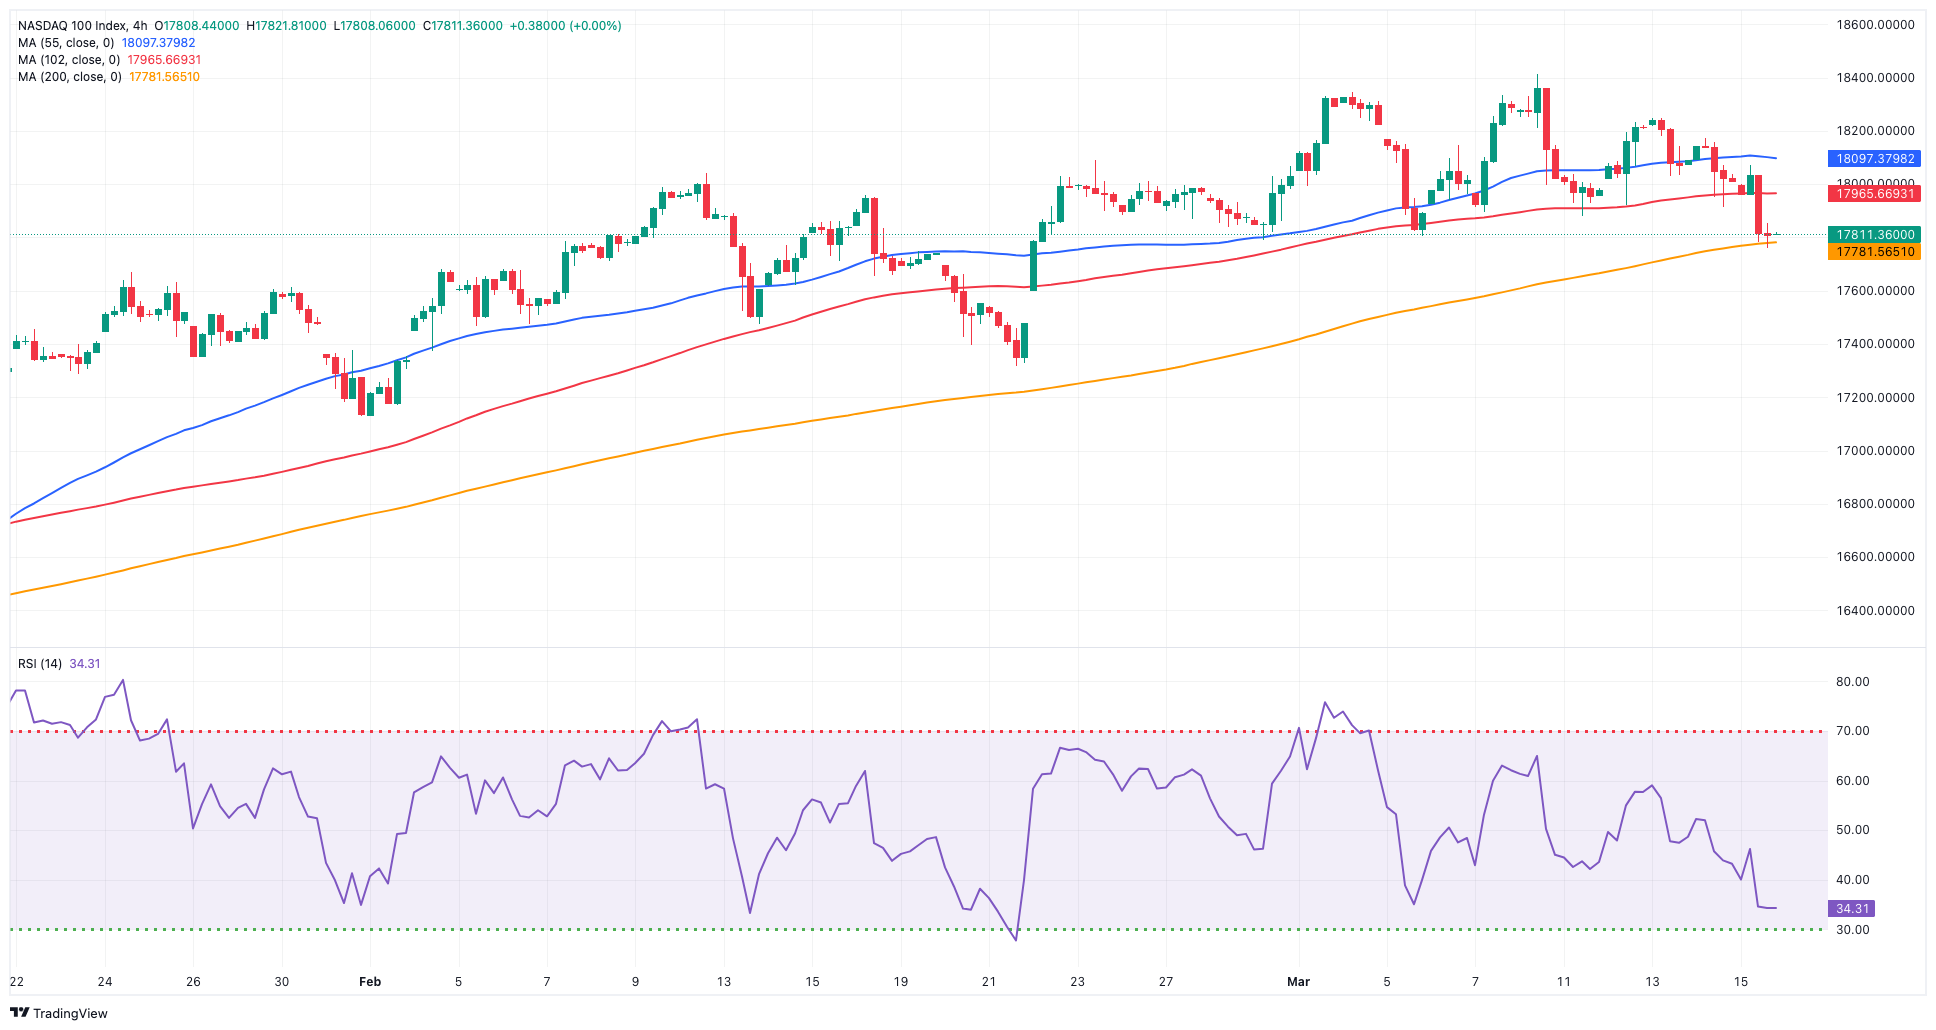
NASDAQ
On Friday, sellers continued to dominate the sentiment around the US tech sector, leading to the third consecutive session of declines in the reference Nasdaq 100.
Indeed, additional weakness weighed on tech stocks following further repricing of the likelihood that the Fed could start its easing cycle as soon as at its June gathering, all against the backdrop of sticky inflation figures and the tight condition of the labour market.
Also collaborating with the downward trend in the index came further gains in the dollar in combination with the march north in US yields.
Further gains might drive the Nasdaq 100 to confront its all-time high of 18,416 (March 8). In the opposite direction, the index should find temporary support at the 55-day SMA of 17,477 before falling to weekly lows of 17,319 (February 21) and 17,128 (January 31). Once the latter is passed, the index might target the 2024 low of 16,249 (January 5), which is higher than the key 200-day SMA of 15,882 and the December 2023 low of 15,695 (December 4). Additional losses from here may test the October 2023 low of 14,058 (October 26), which comes before the April 2023 bottom of 12,724 (April 25), the March 2023 low of 11,695 (March 13), and the 2023 low of 10,696 (January 3). The daily RSI slipped back below 49.
Top Gainers: CoStar, Intuitive Surgical., PACCAR
Top Losers: Adobe, Atlassian Corp Plc, MercadoLibre
Resistance levels: 18,416 (4H chart)
Support levels: 17,764 17,319 17,128 (4H chart)
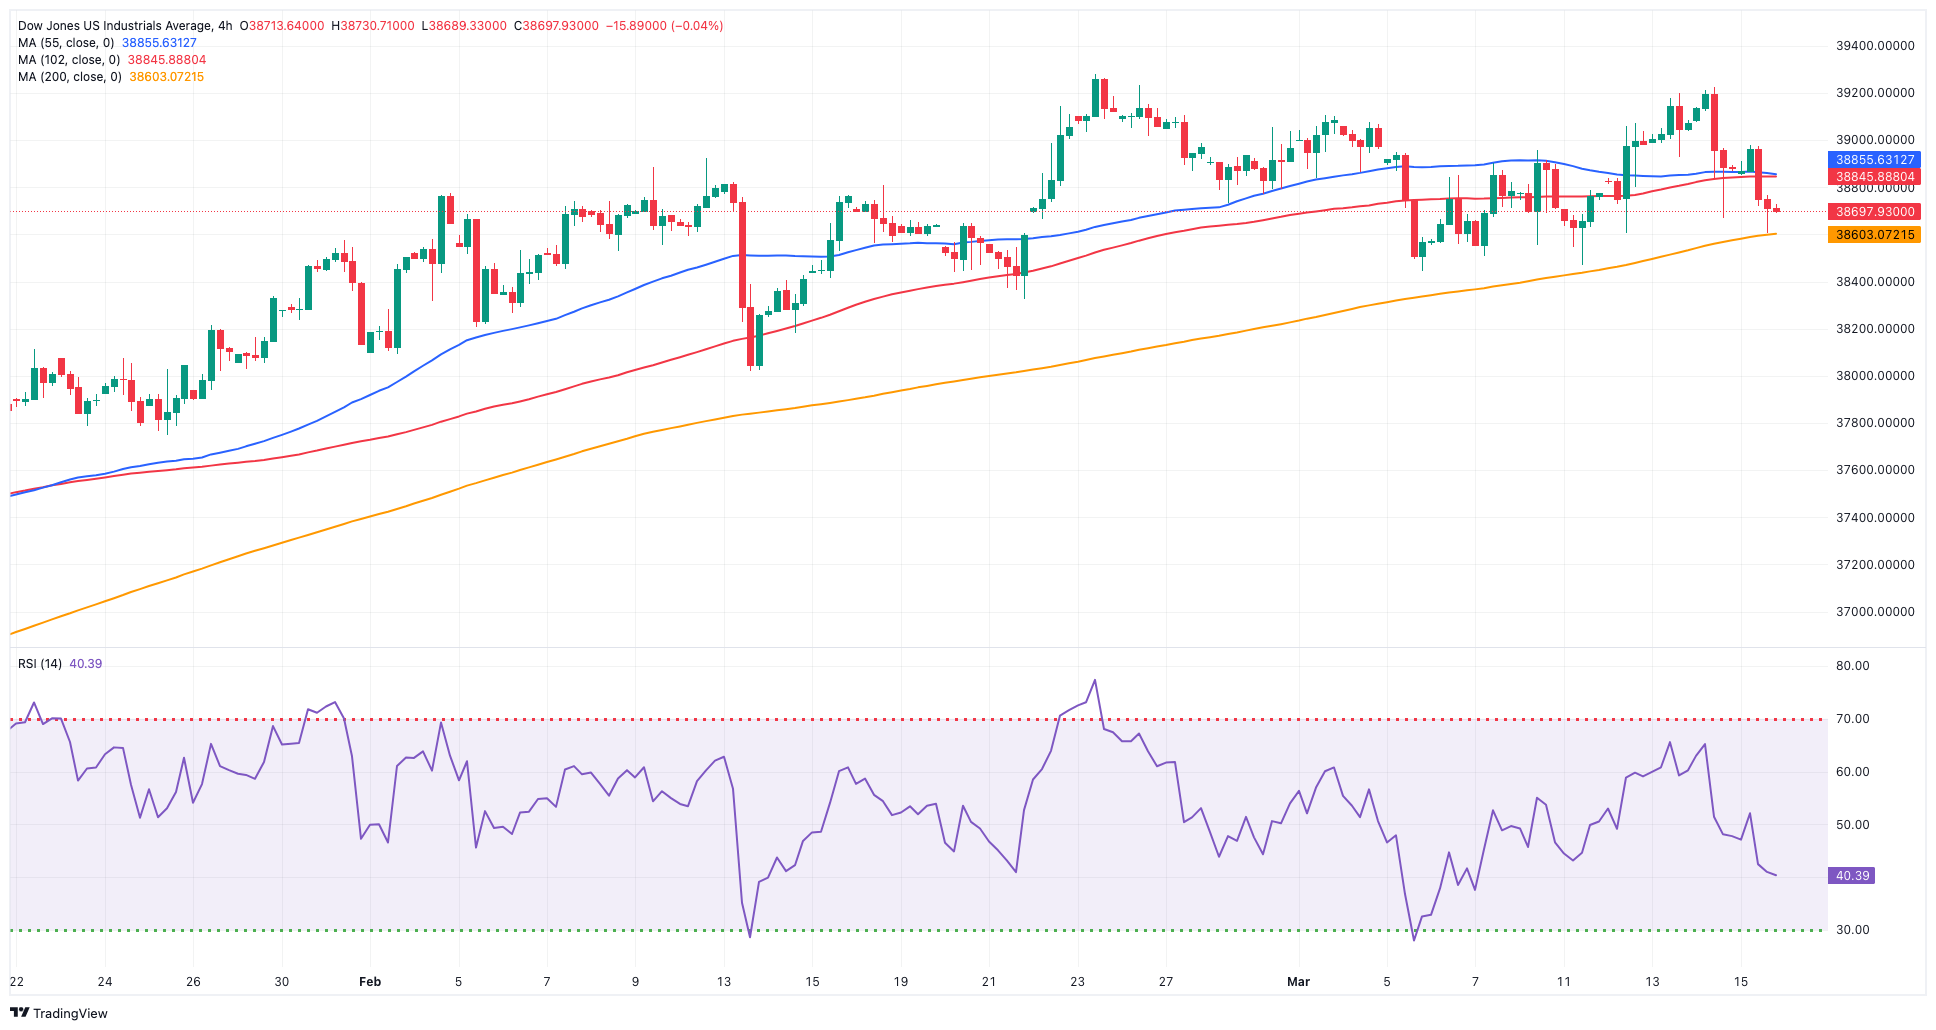
DOW JONES
The US stocks represented by the Dow Jones index experienced a further loss of momentum and added to Thursday’s pullback at the end of the week, this time visiting four-week lows near 38,600.
Indeed, the pessimism seen in the latter part of the week came in response to shrinking bets over a potential interest rate cut by the Fed in June, all after US inflation showed consumer prices continued to run above the bank's target in February.
The above, in combination with the persistently tight labour market, seems to have reignited worries that the Fed might refrain from lowering its interest rates in the next few months.
At the end of the week, the Dow Jones eased by 0.49% to 38,714, the S&P 500 dropped by 0.65% to 5,117, and the tech-centric Nasdaq Composite retreated by 0.96% to 15,973.
Further upside could prompt the Dow Jones to climb towards its record high of 39,282 (February 23). Just the opposite, the 55-day SMA of 38,323 serves as intermediate support, followed by the 2024 low of 37,122 (January 18) and the weekly low of 37,073 (December 20, 2023). If the index breaks below this level, it may encounter the provisional 100-day SMA at 36,927, which comes before the 200-day SMA at 35,623. The weekly low of 33,859 (November 7, 2023) is followed by the October 2023 low of 32,327 (October 27) and the 2023 bottom of 31,429 (March 15). The daily RSI dropped to the 50 region.
Top Performers: 3M, Caterpillar, JPMorgan
Worst Performers: Salesforce Inc, Amazon.com, Microsoft
Resistance levels: 39,201 39,282 (4H chart)
Support levels: 38,457 38,039 37,122 (4H chart)
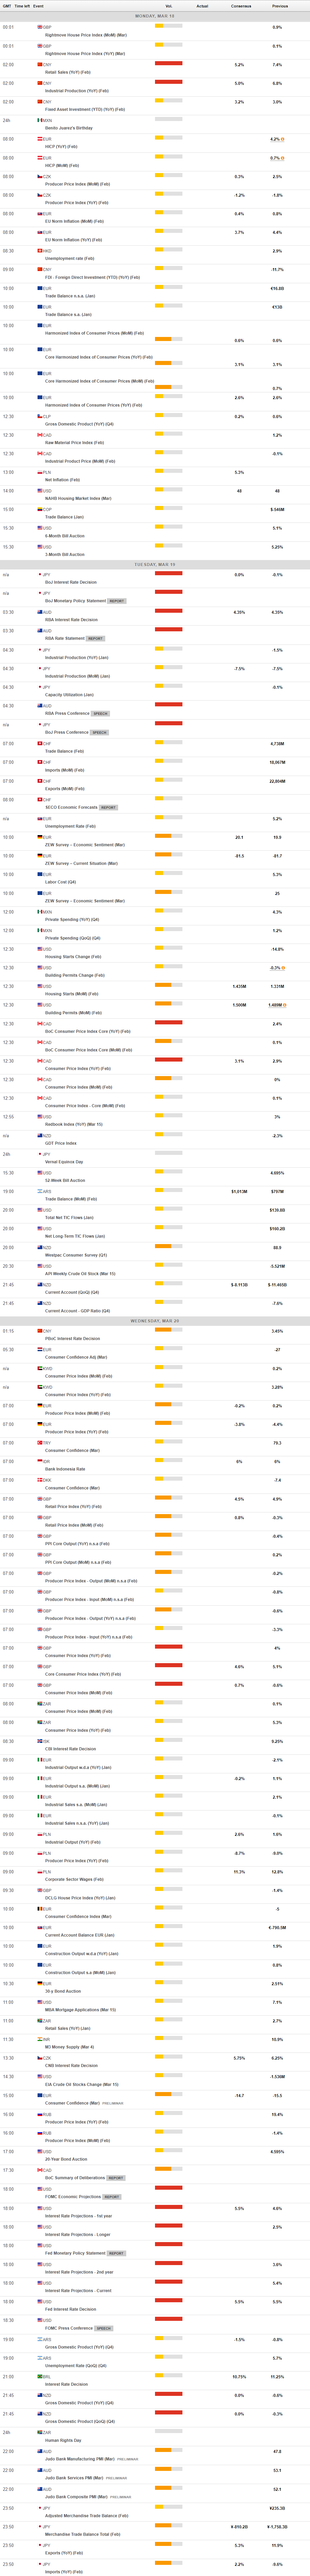
MACROECONOMIC EVENTS
All Information & Updates provided by:

All information relating to the financial markets available on this page has been prepared and issued by FXStreet (Forexstreet SL, Spain, Reg: B62498233) on the basis of publicly available information and all information believed to be reliable and does not conflict with Kuwaiti local laws, and all necessary care has been taken to before the company to ensure that the facts mentioned are correct from the source.
NCM Investment nor any of its directors or employees shall in any way be held responsible for the contents of this news, and the information contained on this page is intended only to provide clients with publicly available information and should not be construed as investment advice, report or analysis and/or constitute an offer or invitation to buy or sell financial instruments of any kind.
RISK WARNING: Forex and CFDs are highly risky leveraged products, as losses can exceed deposits. Please ensure you understand all the risks and take independent advice if necessary. NCM will segregate the clients based on the criteria of the regulator and its bylaws. NCM does not provide any advisory service; the material published does not constitute advice or a recommendation for a transaction in any financial instrument. NCM accepts no responsibility for any use of the content presented and any consequences of that use. Anyone acting on the information provided does so at their own risk.