
- Contact Us:
-

-

-

-


Daily Market Updates
19 Mar 2024
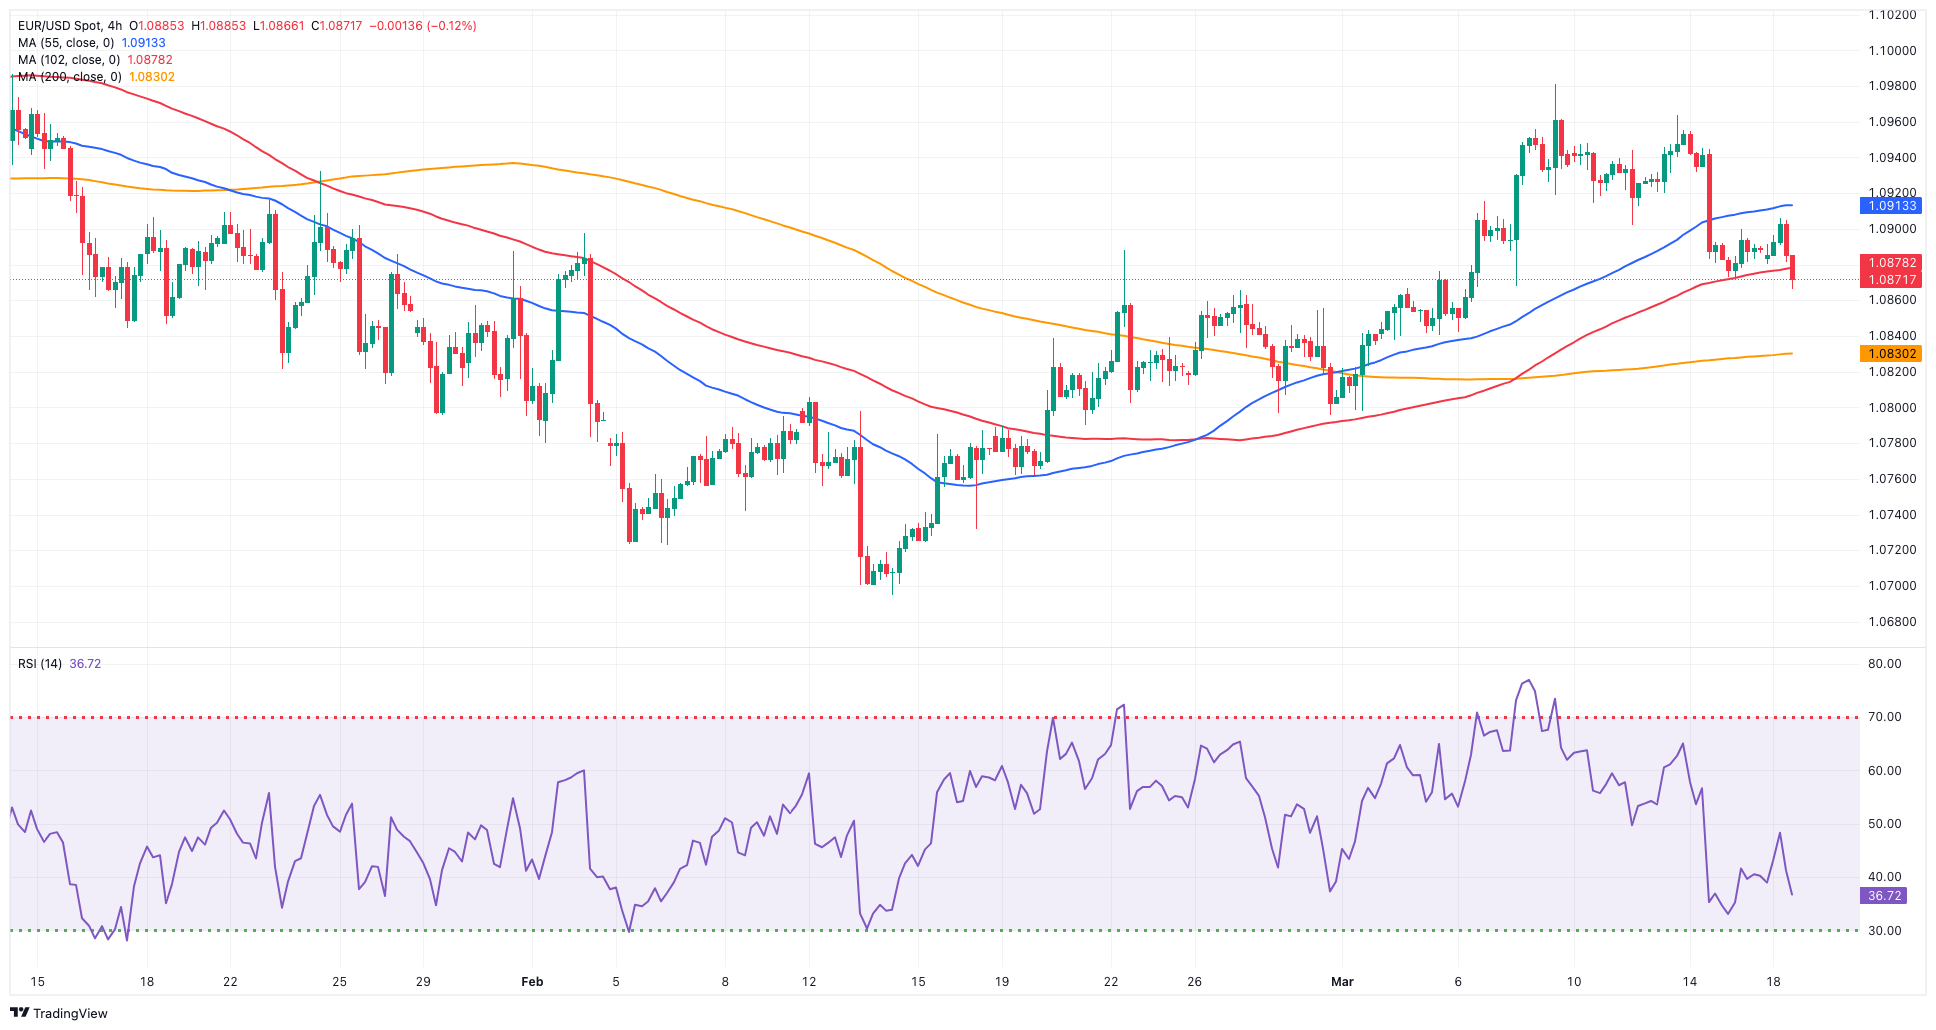
EURUSD
The generalized lack of clear direction in the global markets and the bounce in the greenback motivated EUR/USD to extend its losses to the sub-1.0900 region at the beginning of the week.
In the meantime, the USD Index (DXY) picked up extra pace and rose to multi-day highs past 103.60 against the backdrop of the persevering march north in US yields across different timeframes, a scenario that could extend in the next couple of sessions prior to the interest rate decision by the Fed on March 20.
On the latter, it is largely anticipated that the Fed will keep its interest rates unchanged, while there remains steady speculation of a rate cut at the June 12 event.
In the domestic docket, final inflation figures in the broader Euroland saw the headline CPI rise 2.6% in the year to February and 3.1% when it came to the Core CPI. In addition, the trade surplus shrank to €11.4B in January.
In the US, the NAHB index improved to 51 for the month of March (from 48).
EUR/USD's initial resistance level is the March top of 1.0981 (March 8). North of here is the weekly peak of 1.0998 (January 5, 2011), barely short of the psychological 1.1000 mark. The breakout of this zone might pave the way for a challenge to the December 2023 high of 1.1139 (December 27), which is supported by the 200-week SMA of 1.1148 and comes before the 2023 top of 1.1275 (July 18). In contrast, the loss of the 200-day SMA at 1.0838 may put pressure on the weekly low of 1.0795 (February 29), which precedes the 2024 low of 1.0694 (February 14). A further decline might reach the weekly low of 1.0495 (October 13, 2023), before the 2023 bottom of 1.0448 (October 3), and the round level of 1.0400. The daily RSI ticked higher marginally to the 54 region.
Resistance levels: 1.0981 1.0998 1.1139 (4H chart)
Support levels: 1.0866 1.0828 1.0795 (4H chart)
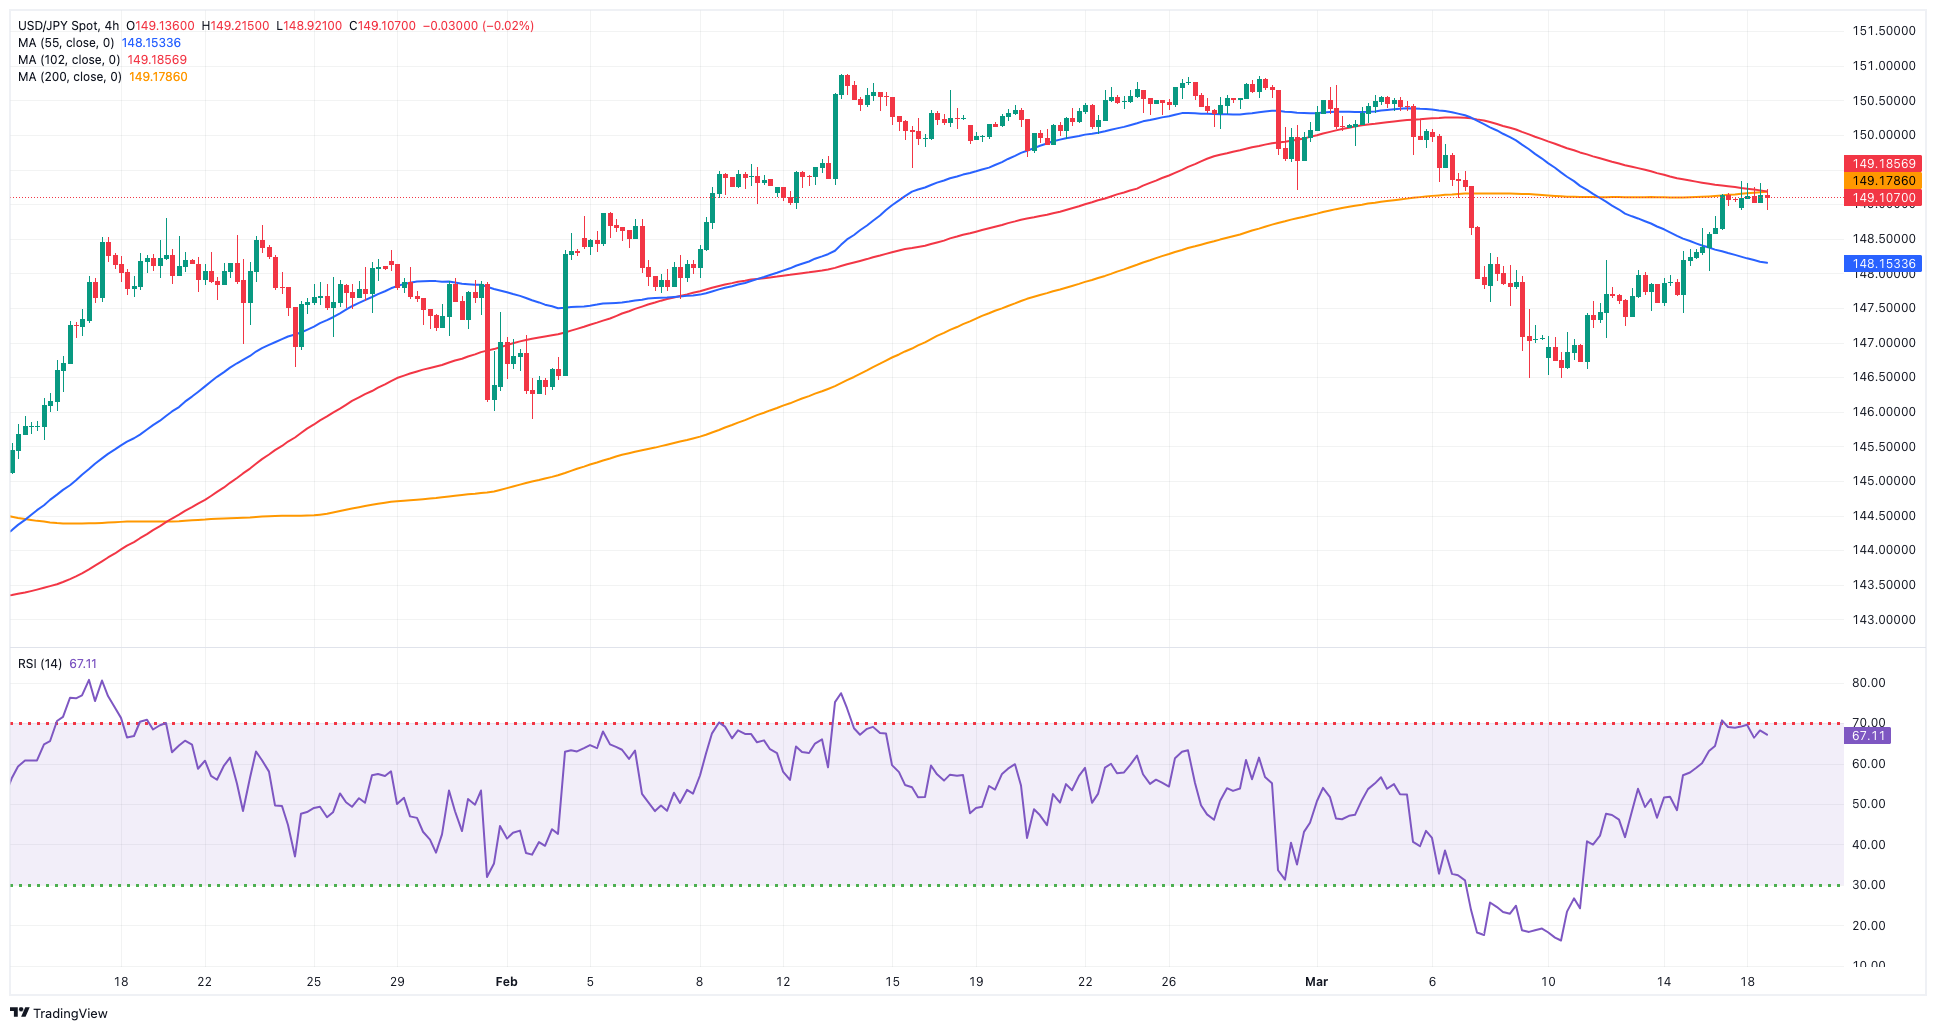
USDJPY
The Japanese yen added to the recent weakness and lifted USD/JPY to fresh multi-day highs around 149.30 on Monday.
Additional weakening of the JPY occurred prior to the significant BoJ meeting scheduled for March 19, during which investors anticipate the central bank to move away from its highly accommodative position. It's notable that on Friday, Rengo, Japan's largest trade union federation, disclosed that overall pay raises averaged 5.3% for the current year, marking an increase from 3.8% in the preceding year. Particularly noteworthy is the rise in base pay increases, which averaged 3.7% compared to 2.3% in the previous year.
Extra upside traction in the pair also came from further gains in the greenback as well as the continuation of the move higher in US yields across the curve.
In Japan, Machinery Orders contracted by 10.9% in the year to January, less than initially estimated.
The surpass of the weekly high of 149.33 (March 18) may encourage USD/JPY to dispute the 2024 top of 150.88 (February 13), before the 2023 peak of 151.90 (November 13). Further up, the 2022 high of 151.94 (October 21) appears just before the round figure 152.00. Instead, first support level is indicated at the March low of 146.47 (March 8), which appears to be supported by the crucial 200-day SMA at 146.41. The breach of this region might lead to a potential visit to the February low of 145.89 (February 1), followed by the December 2023 low of 140.24 (December 28), which precedes the round number 140.00 and the July bottom of 137.23 (July 14). The day-to-day RSI rose to the boundaries of 53.
Resistance levels: 149.33 150.71 150.88 (4H chart)
Support levels: 148.15 146.47 145.89 (4H chart)
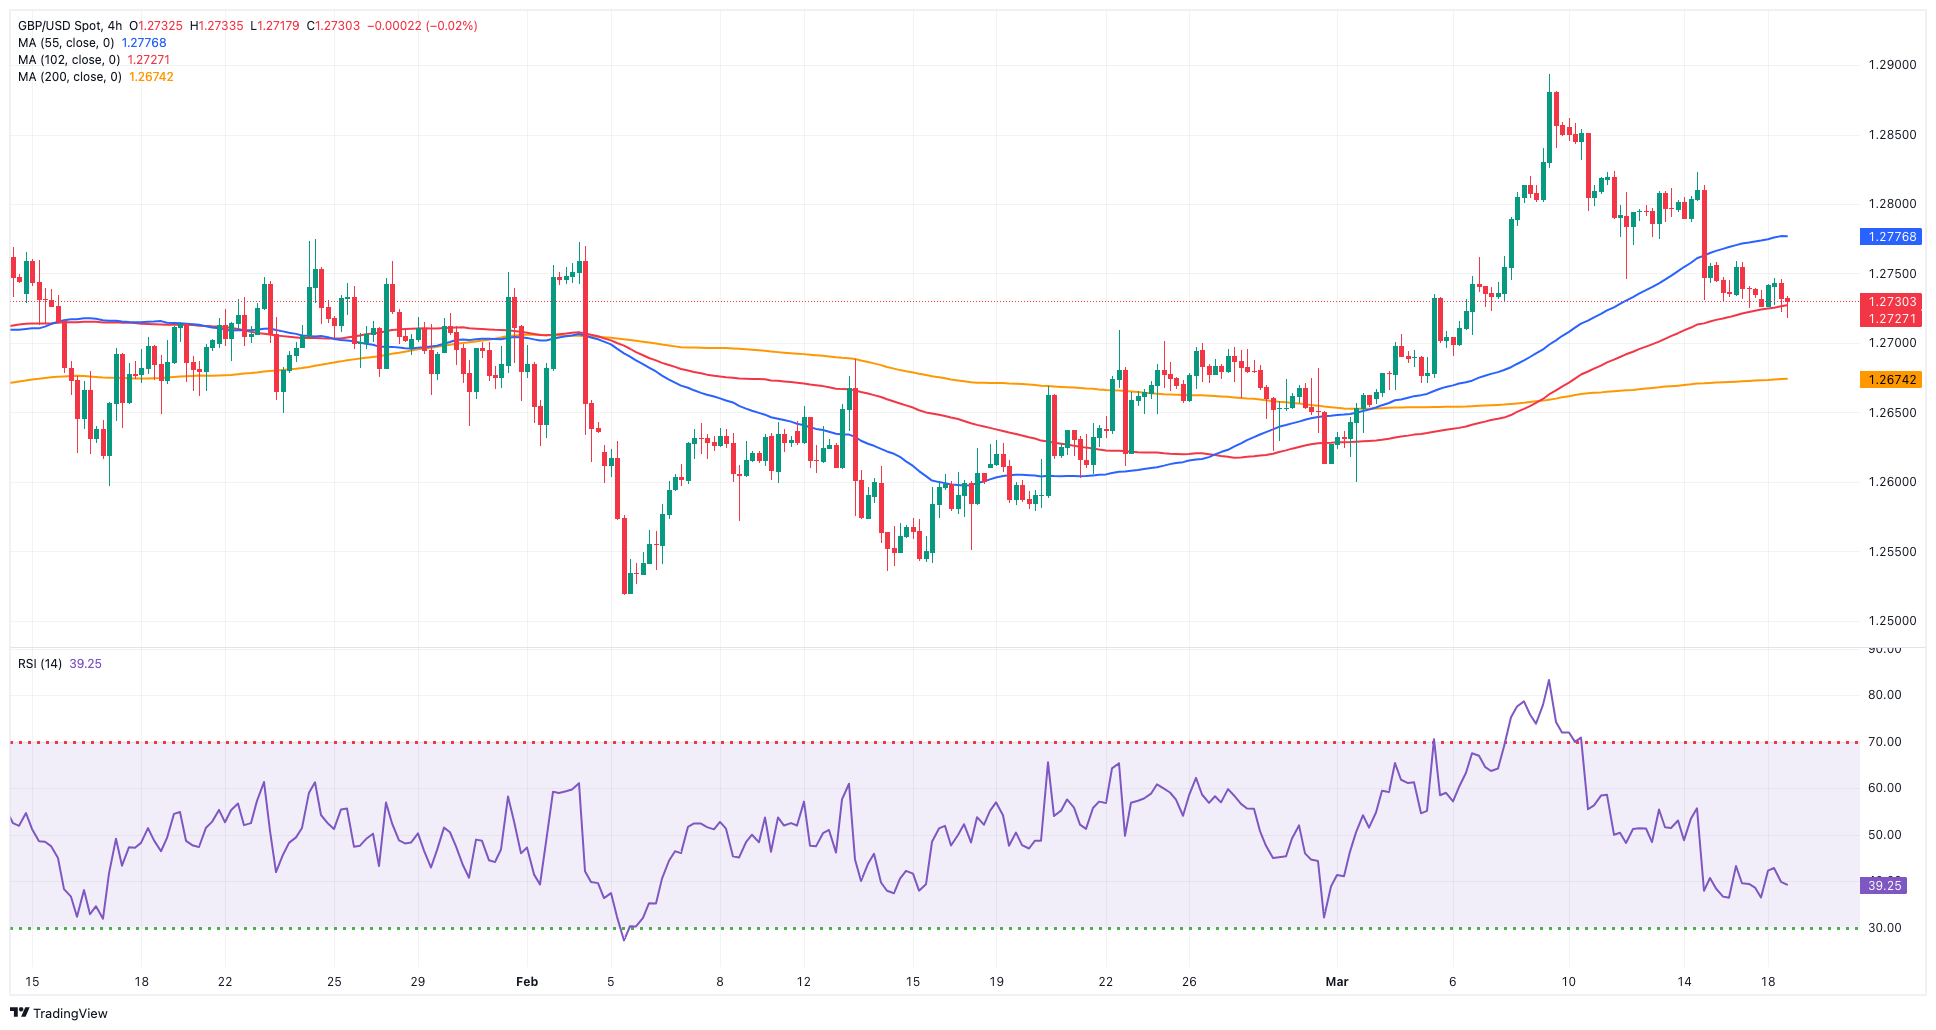
GBPUSD
A decent bounce in the greenback put the risk complex under extra pressure and dragged GBP/USD to the area of multi-session lows near 1.2720 on Monday.
Indeed, in quite a dull session, the dollar managed to add to recent gains and climbed further when gauged by the USD Index (DXY), all against the backdrop of a mild uptick in US yields and shrinking bets of an interest rate cut in June.
The sustained weakness of the sterling contrasted with a small dip in UK 10-year gilt yields, which fell below 4.10%.
The UK calendar was empty at the beginning of the week.
The weekly low of 1.2719 (March 18) precedes the preliminary 55-day SMA at 1.2685 and is followed by the March low of 1.2599 (March 1) and the key 200-day SMA at 1.2590. The loss of this zone may put the 2024 low of 1.2518 (February 5) back into focus, ahead of the December 2023 low of 1.2500 (December 13). A deeper slide should not find significant support until the weekly low of 1.2187 (November 10, 2023), then the October 2023 bottom of 1.2037 and the main 1.2000 barrier. In the other direction, the next upward obstacle is the 2024 peak of 1.2893 (March 8), followed by the weekly high of 1.2995 (July 27, 2023), all ahead of the significant 1.3000 milestone. On the daily chart, the RSI retreated to the 51 zone.
Resistance levels: 1.2823 1.2893 1.2995 (4H chart)
Support levels: 1.2717 1.2672 1.2599 (4H chart)
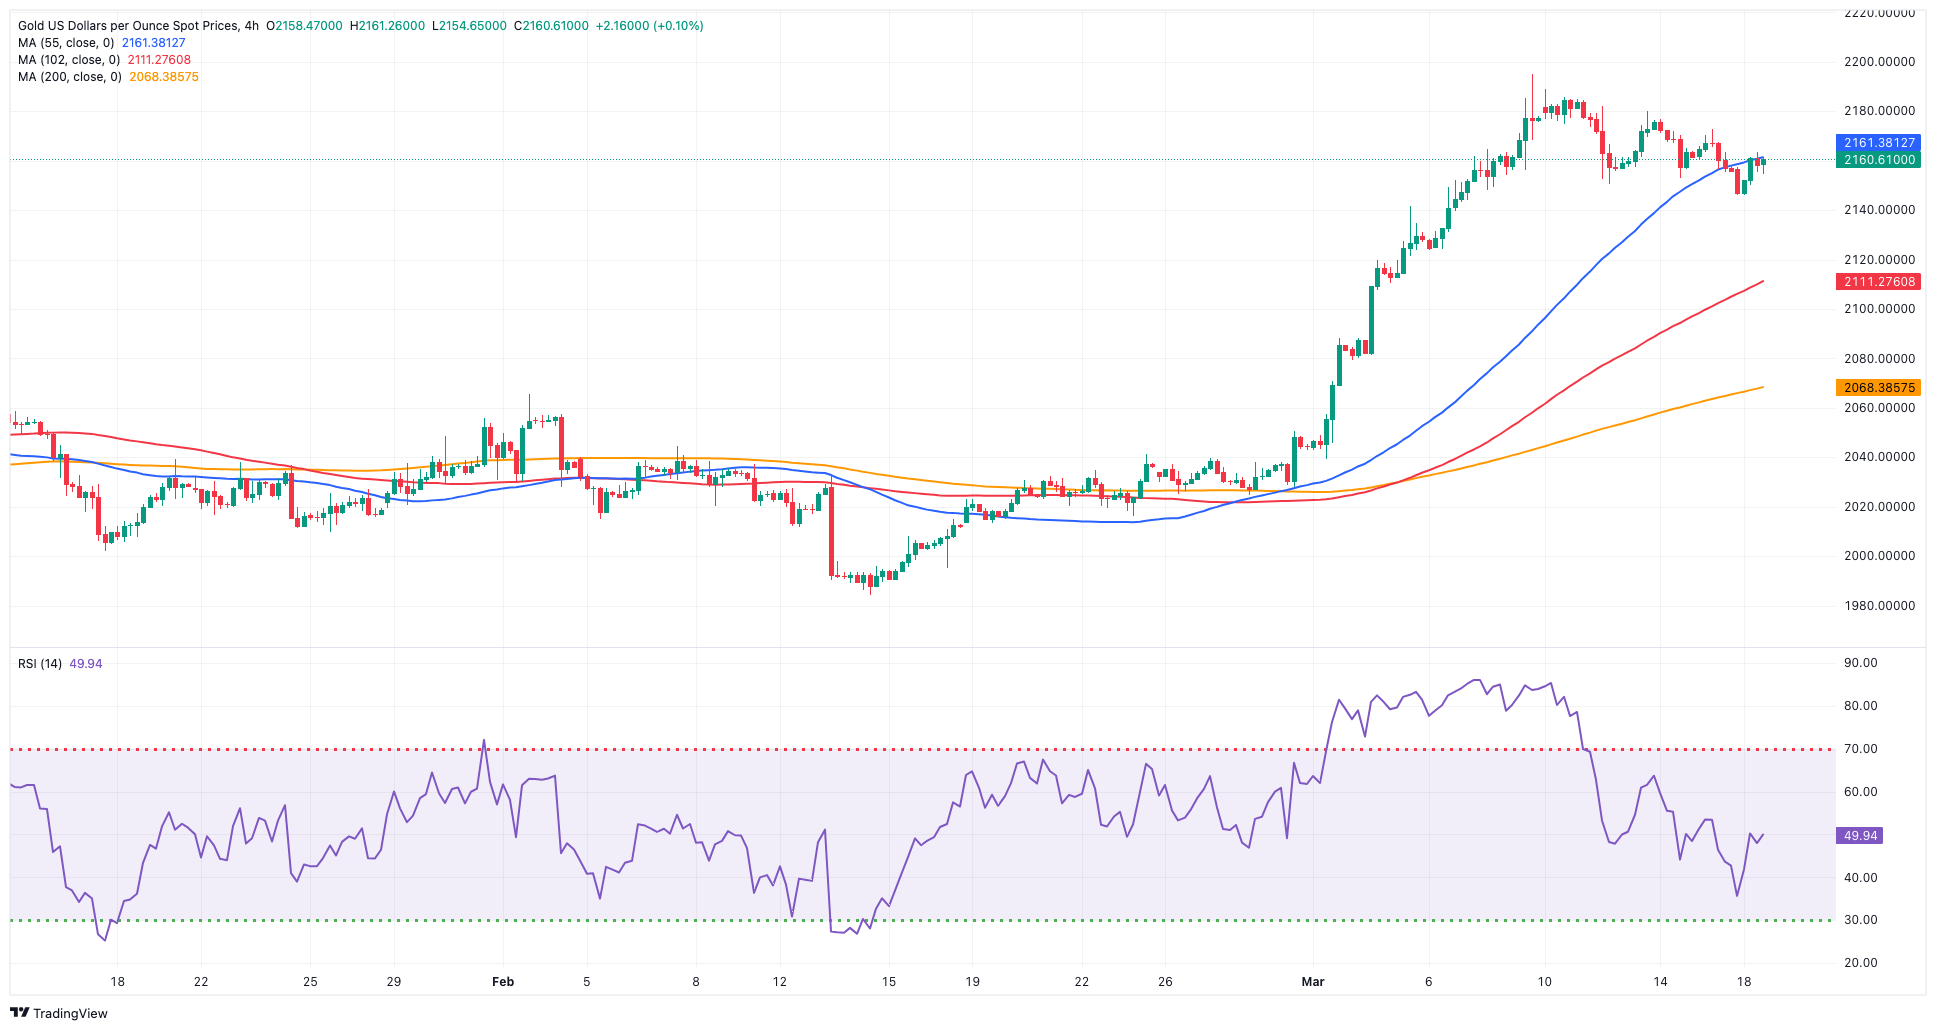
GOLD
Gold prices resumed the uptrend after two consecutive daily pullbacks on Monday.
That said, the precious metal regained the $2,160 zone per troy ounce despite the move higher in the greenback and the persistent march north in US yields across different timeframes.
The next risk event for the yellow metal comes from the FOMC gathering on March 20. Even though the Committee is widely anticipated to keep its interest rates unchanged, investors will be closely watching any hint by Chief Powell on the potential timing of the start of the bank’s easing cycle as well as how many times the Fed may cut its rates this year.
If bulls retake control, gold is expected to test its all-time high of $2,195 (March 8) sooner rather than later. The 55-day and 100-day SMAs of $2,055 and $2,034 should provide temporary support, followed by the 2024 low of $1,984 (February 14) and the December 2023 low of $1,973, which is supported by its proximity to the critical 200-day SMA of $1,978 and comes before the November 2023 low of $1,931. The breakdown of the latter may prompt the yellow metal to retest its October 2023 bottom of $1,810, which is higher than the 2023 low of $1,804 and the crucial $1,800 conflict zone.
Resistance levels: $2,172 $2,179 $2,195 (4H chart)
Support levels: $2,146 $2,114 $2,068 (4H chart)
CRUDE WTI
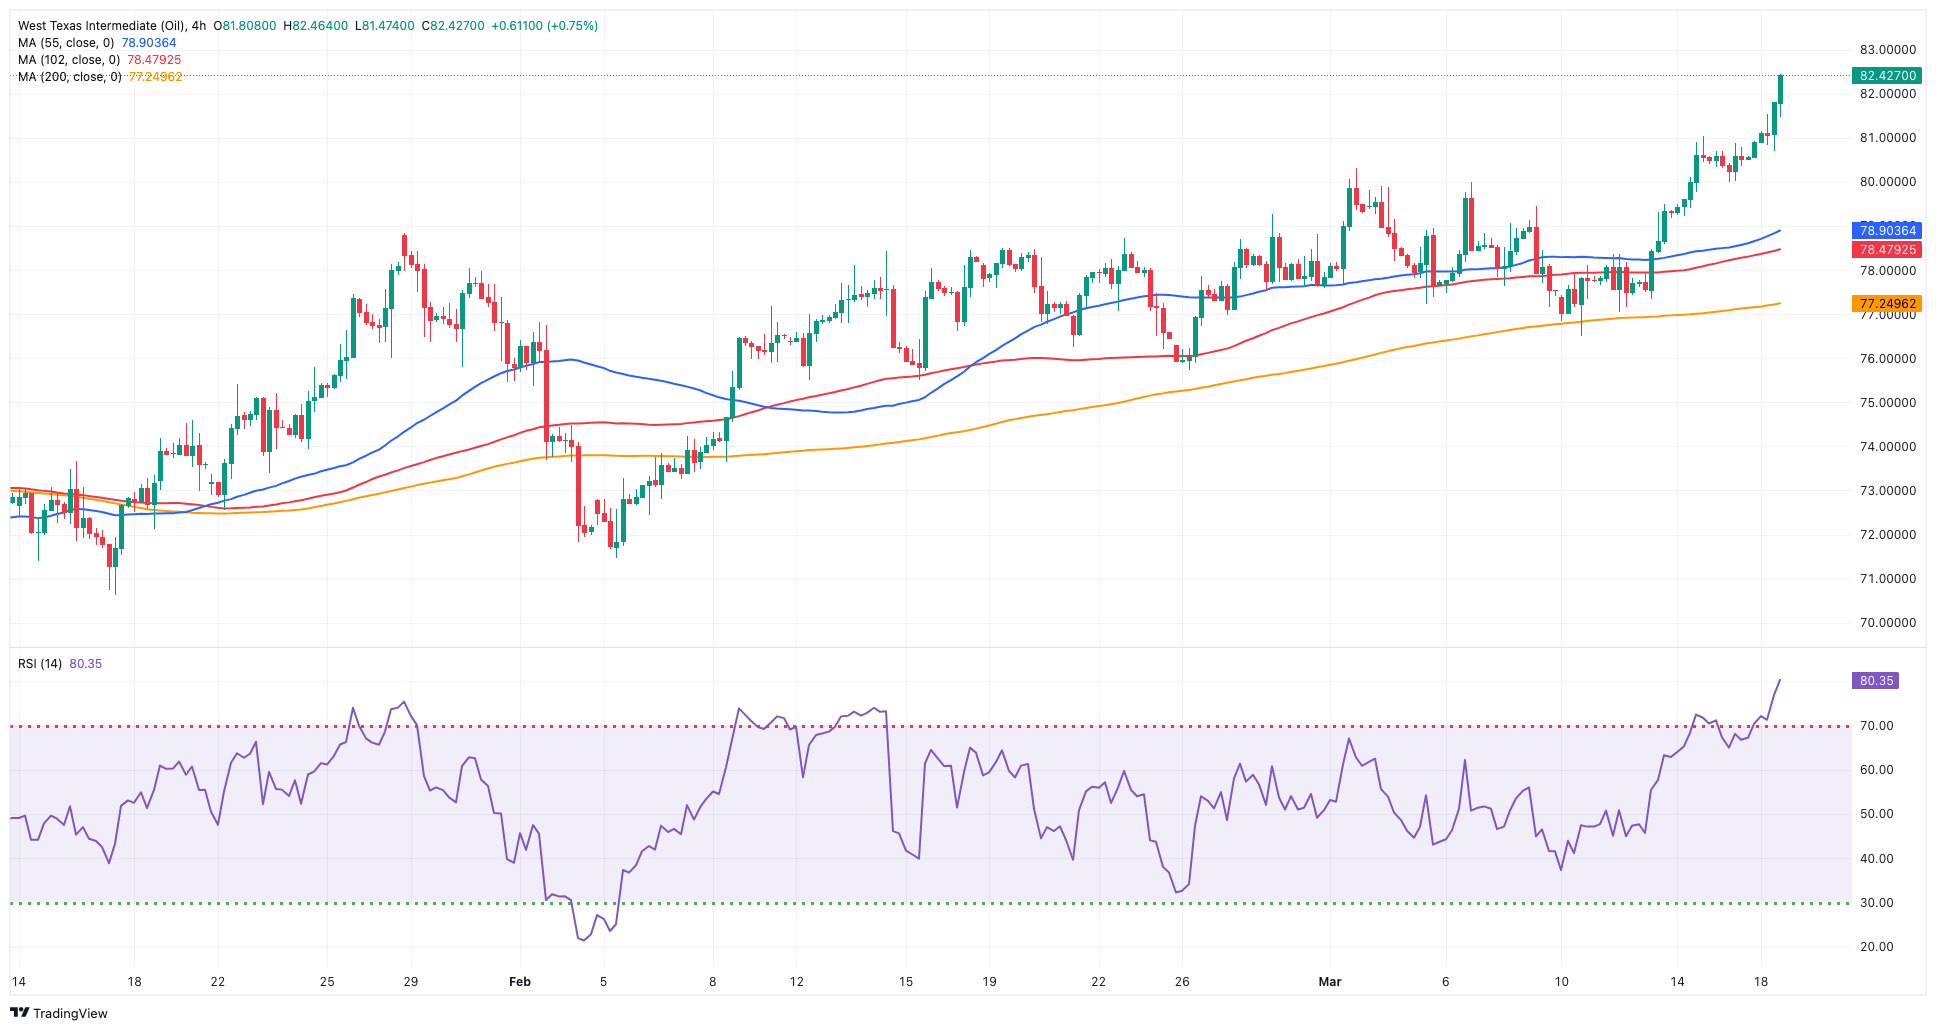
In quite a promising start to the new trading week, prices of WTI climbed to levels last seen in early November 2023, past the $82.00 mark per barrel.
Indeed, the move higher in crude oil prices came after Iraq, the second-largest producer within OPEC, announced its intention to decrease crude oil exports to 3.3 mbpd in the upcoming months. This decision aims to offset the overage of its OPEC+ quota since January.
Also adding to the renewed upside in the commodity emerged auspicious prints from the Chinese docket, which reinforced the demand side, as well as a move to multi-month tops in gasoline futures near the $2.75 level.
Later in the week, the API and the EIA will release their usual weekly reports on US crude oil inventories on Tuesday and Wednesday, respectively.
The next upward challenge for WTI is the 2024 peak of $82.15 (March 18), which precedes the weekly high of $89.83 (October 18, 2023) and the 2023 top of $94.99 (September 28, 2023). Further north, the weekly peak of $97.65 (August 30) comes before the psychological $100.00 barrier. Just the opposite, the 200-day SMA provides first support at $78.30, prior to the February low of $71.43 (February 5). Extra losses highlight the important $70.00 milestone ahead of the 2024 bottom of $69.31 (January 3).
Resistance levels: $82.15 $83.56 $85.85 (4H chart)
Support levels: $76.76 $75.81 $71.37 (4H chart)
GER40
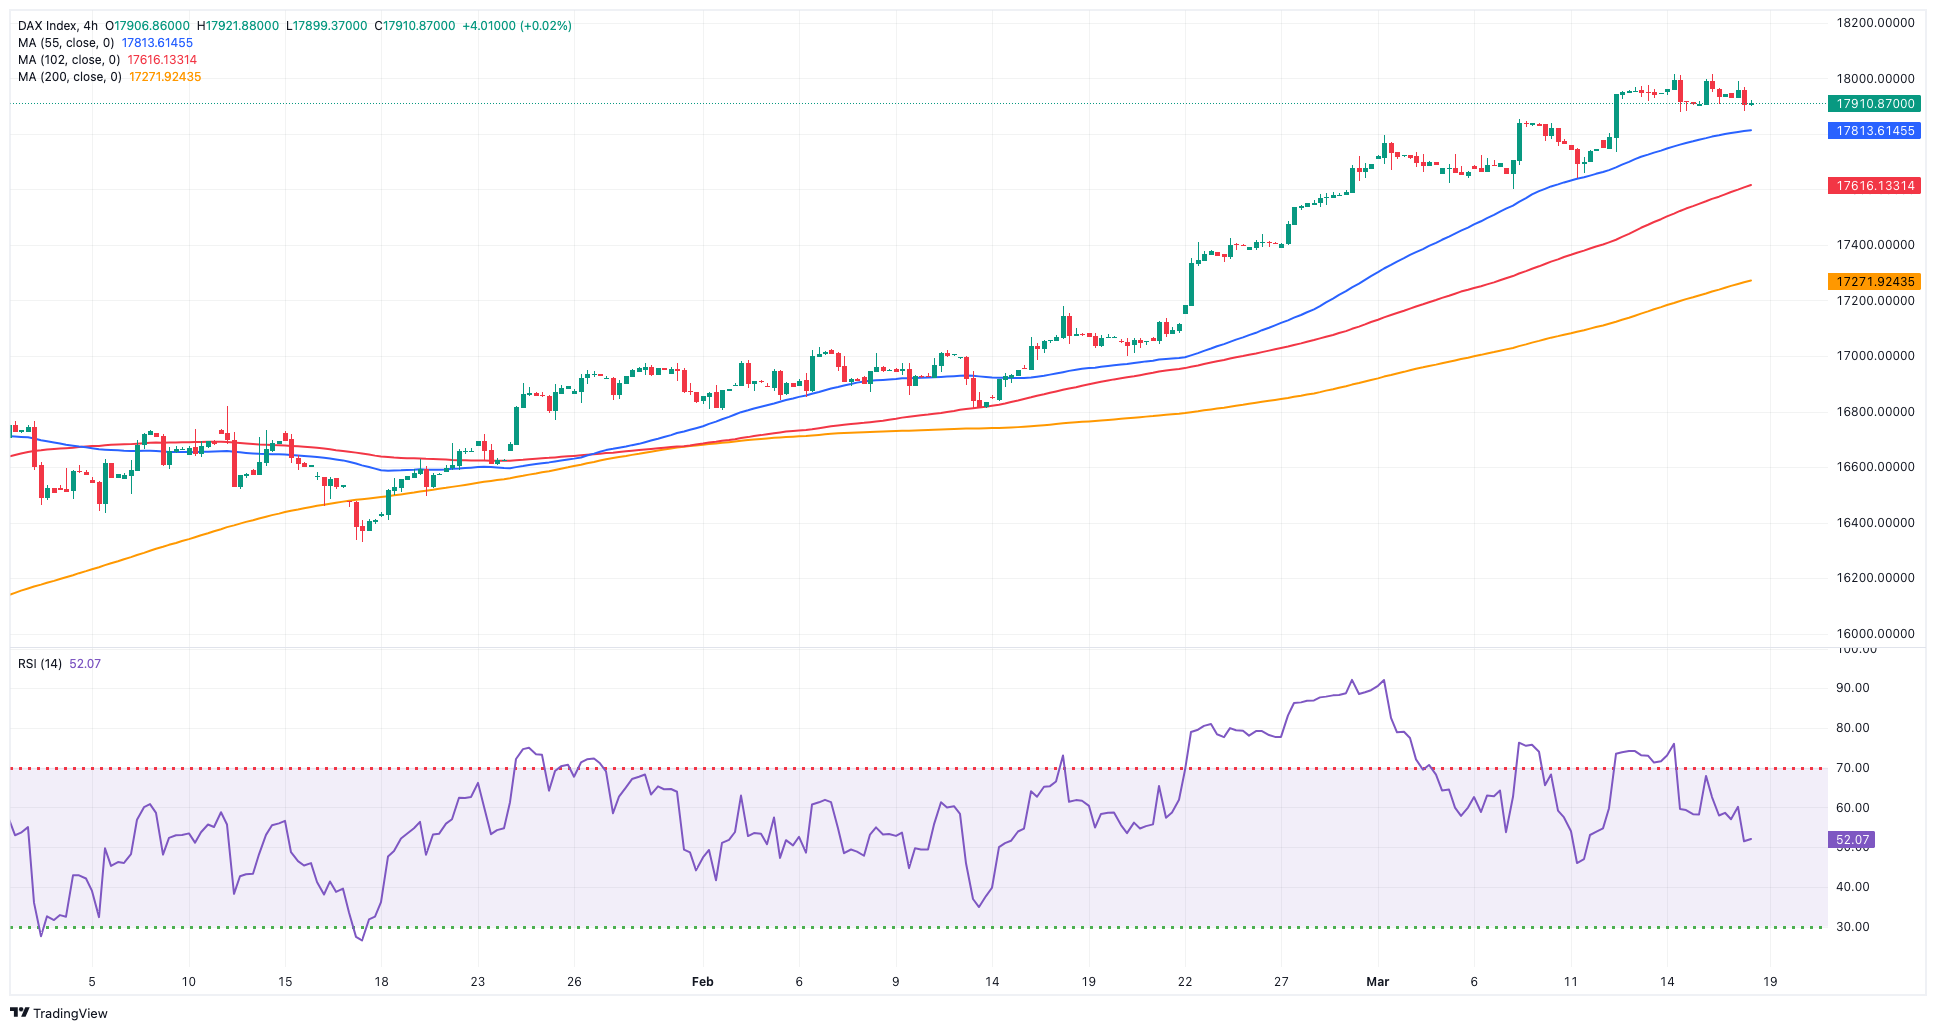
European equities kicked off the week mostly on the back foot, while Germany’s benchmark ended marginally lower around the 17,900 region amidst a vacillating session.
In fact, the broad-based absence of volatility in the global markets followed the increasing prudence ahead of the key FOMC event later in the week, all against the backdrop of growing concerns that the Fed might delay interest rate cuts.
In the meantime, recent remarks from ECB officials indicated that the start of the bank’s easing programme might occur sometime in the summer.
In the German bond market, 10-year bund yields resumed the uptrend and approached the 2.50% region.
The next level of resistance for the DAX40 is the record high of 18,039 (March 14). Having said that, the 55-day SMA around 17,116 should provide some brief support before the February low of 16,821 (February 1). If the index falls below this level, a challenge to the 2024 low of 16,345 (January 17) may arise ahead of the important 200-day SMA at 16,182. Once the latter is passed, the index may face the weekly low of 15,915 (November 28), followed by the October 2023 low of 14,630 (October 23) and the 2023 bottom of 14,458 (March 20). The daily RSI dipped below 75, indicating that the market remained overbought.
Best Performers: Rheinmetall AG, Dr Ing hc F Porsche Prf, Vonovia
Worst Performers: Adidas, Sartorius AG VZO, Deutsche Post
Resistance levels: 18,039 (4H chart)
Support levels: 17,619 17,046 16,831 (4H chart)
GBPJPY
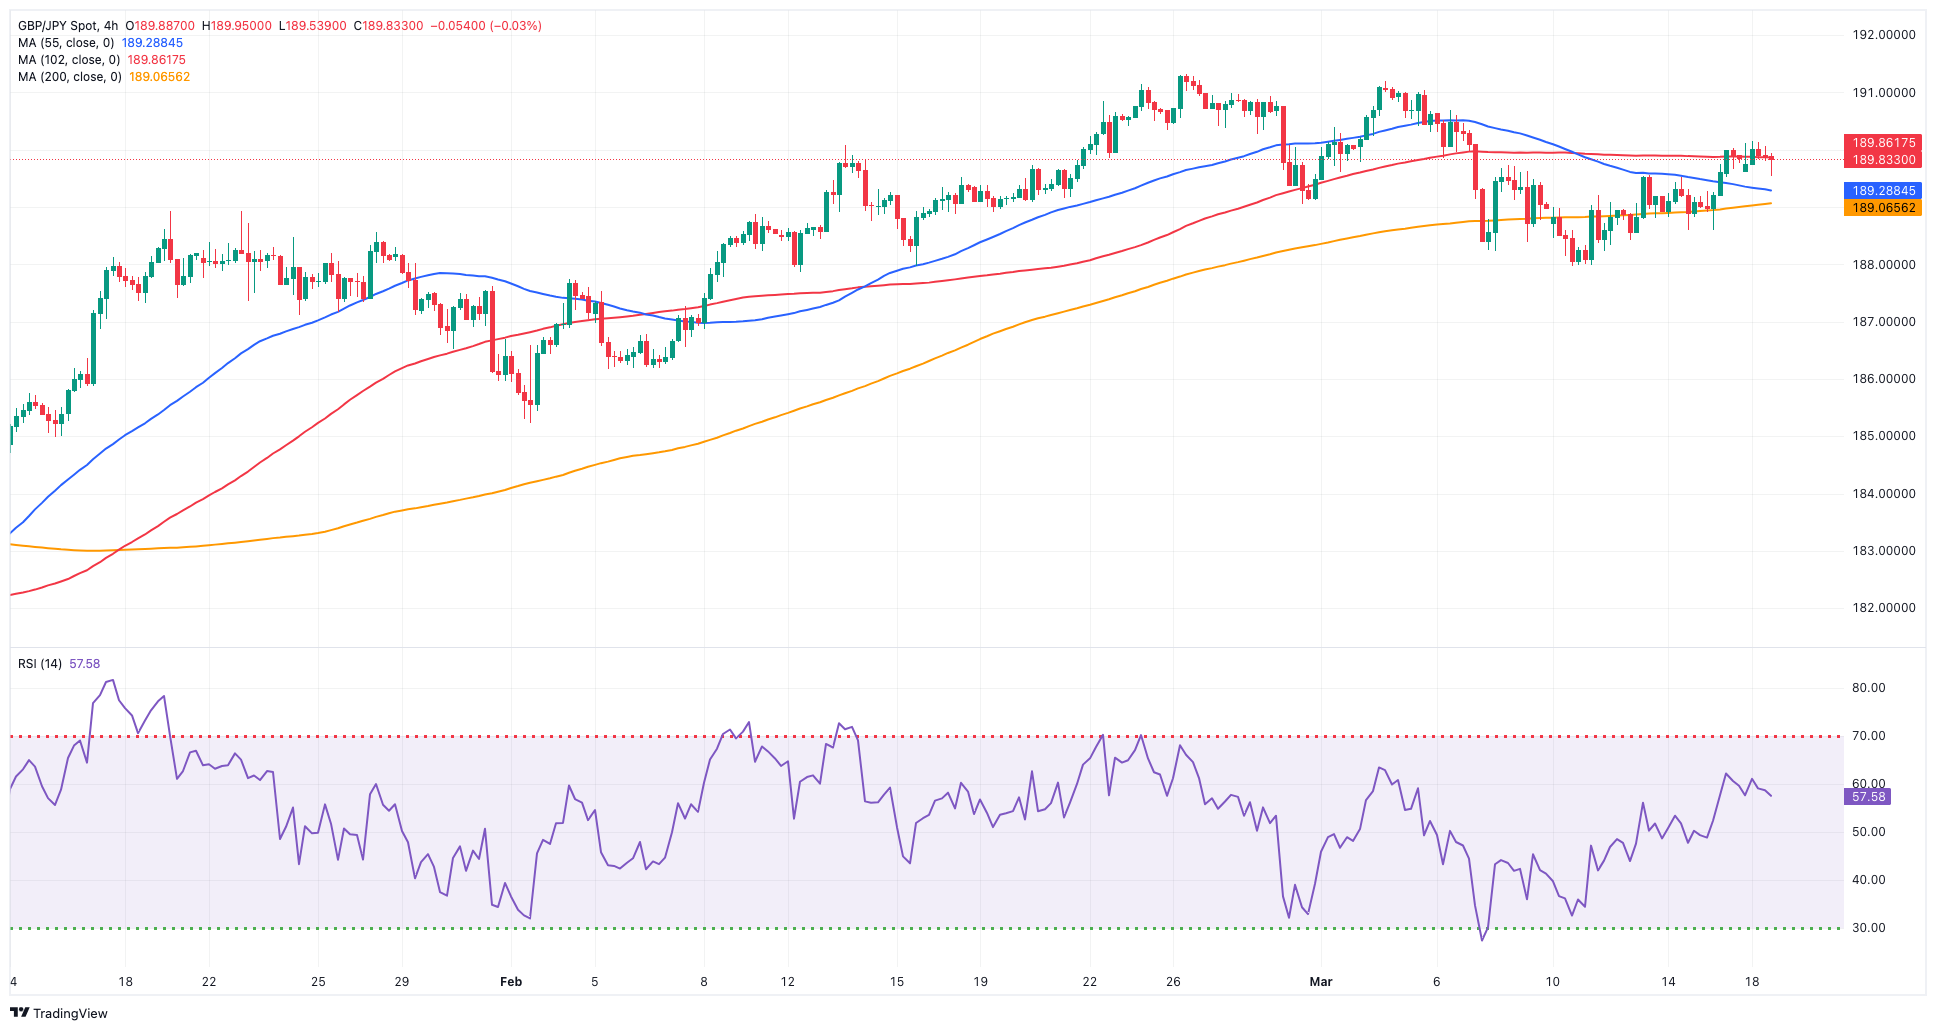
GBP/JPY traded in an inconclusive fashion despite printing new multi-session peaks just beyond 190.00 the figure at the beginning of the week.
Price action around the cross was amidst further loss of momentum in the Japanese yen, while the British pound also traded on the back foot in response to further advance in the greenback.
Meanwhile, traders remained vigilant as they closely monitored the progress surrounding the BoJ and its possible departure from its extremely accommodating monetary policy position, a move that could be announced at its imminent meeting on March 19.
The weekly high of 190.16 (March 18) precedes the 2024 top of 191.32 (February 26), the August 2015 peak of 195.28 (August 18), and the record high of 195.88 (June 24). On the other hand, the March low of 187.96 (March 11) serves as the initial support, which appears propped up by the provisional 55-day SMA at 187.87 and comes ahead of the interim 100-day SMA of 186.20. The breakdown of the latter might put a test of the February low of 185.22 (February 1) back on the agenda, ahead of the more important 200-day SMA at 184.32. South of here, there is no significant support levels until the December 2023 low of 178.33 (December 14), which precedes the October 2023 low of 178.03 and the July 2023 bottom of 176.30. The day-to-day RSI receded to the proximity of 54.
Resistance levels: 190.16 191.19 191.85 (4H chart)
Support levels: 189.05 187.96 186.44 (4H chart)
NASDAQ
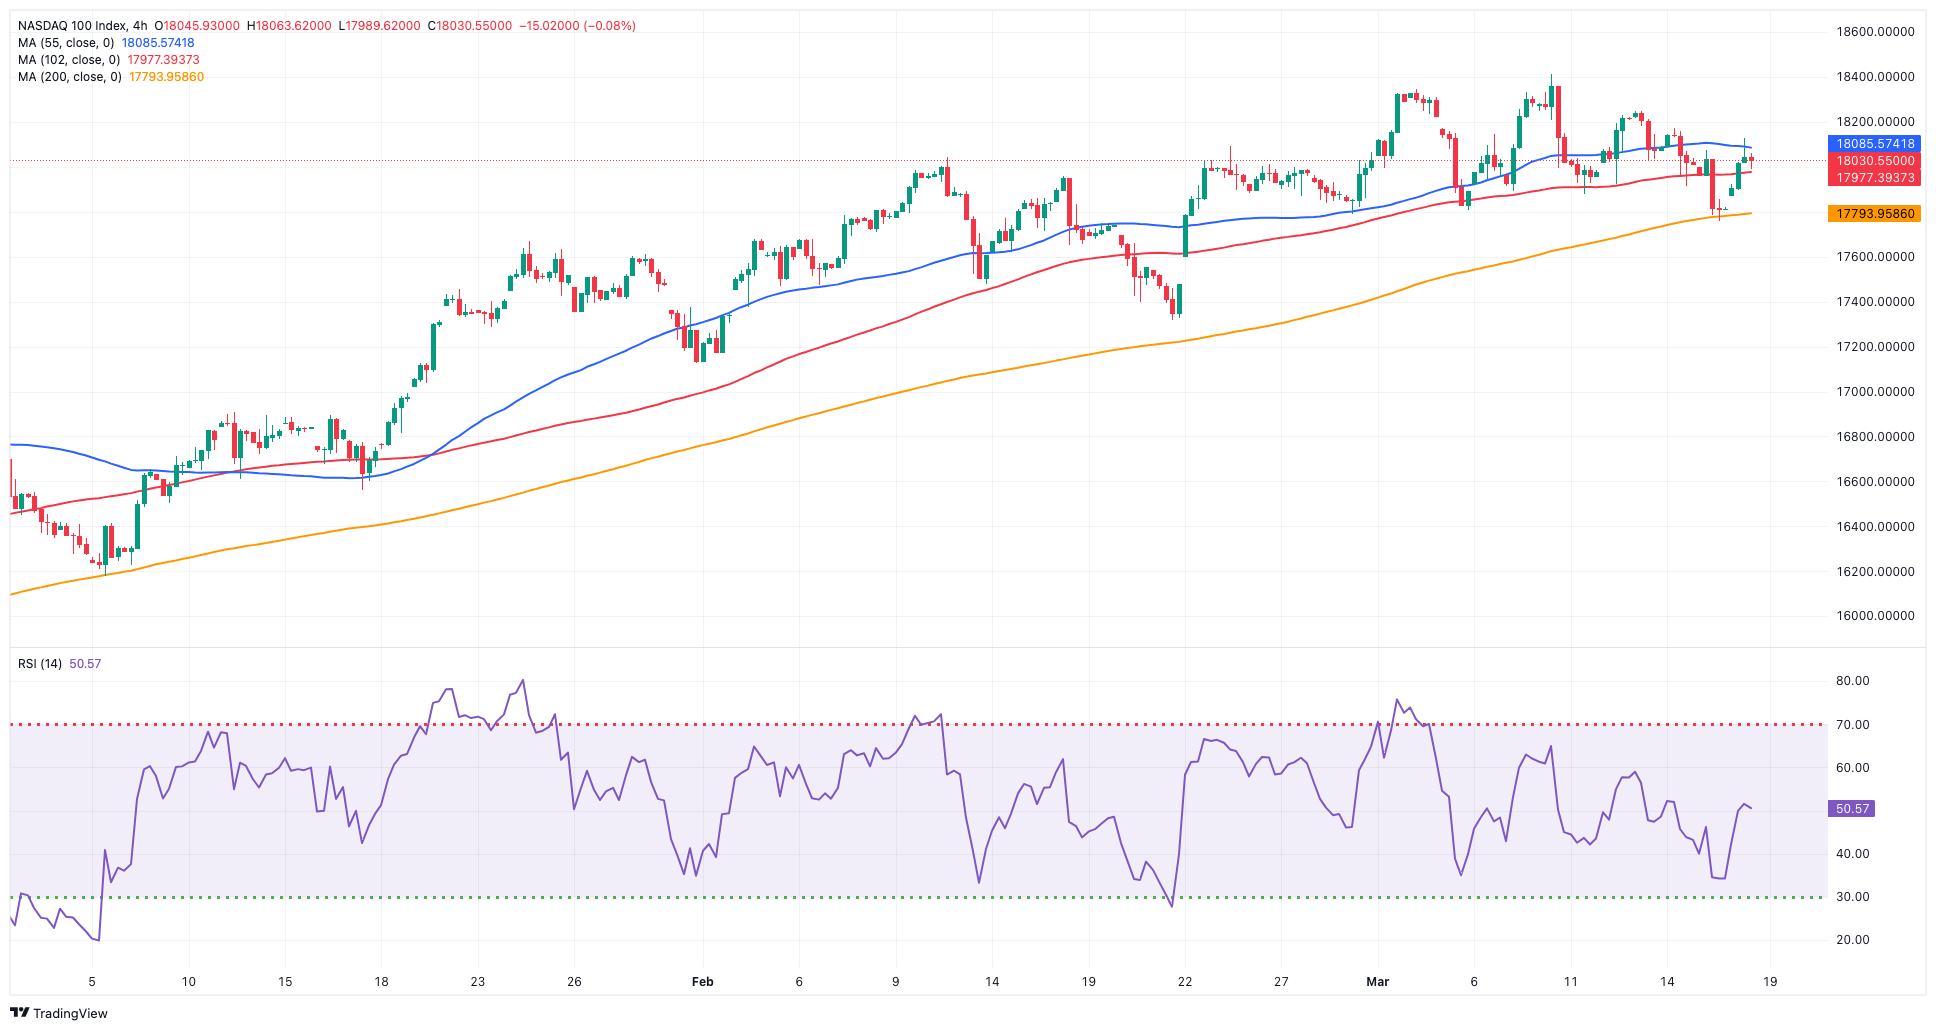
Monday witnessed a reversal of recent seller dominance in the sentiment surrounding the US tech sector, resulting in marked gains past the 38,000 barrier after three consecutive sessions of declines in the Nasdaq 100 index.
Moreover, tech stocks experienced a strong rebound, driven by the rally in prominent mega-cap growth stocks like Alphabet and Tesla, just before the FOMC upcoming meeting.
In addition, the recovery in the index came despite the decent advance in the greenback and the persistent move higher in US yields across the board.
Further increases may push the Nasdaq 100 to test its all-time high of 18,416 (March 8). In the opposite direction, the index should find temporary support at the 55-day SMA of 17,498 before sliding to weekly lows of 17,319 (February 21) and 17,128 (January 31). Once the latter is passed, the index might aim for the 2024 low of 16,249 (January 5), ahead of the critical 200-day SMA of 15,901 and the December 2023 low of 15,695 (December 4). Additional losses from here could test the October 2023 low of 14,058 (October 26), which comes before the April 2023 bottom of 12,724 (April 25), the March 2023 low of 11,695 (March 13), and the 2023 low of 10,696 (January 3). The daily RSI rebounded past 54.
Top Gainers: Tesla, Alphabet A, Alphabet C
Top Losers: Analog Devices, Texas Instruments, Electronic Arts
Resistance levels: 18,416 (4H chart)
Support levels: 17,764 17,319 17,128 (4H chart)
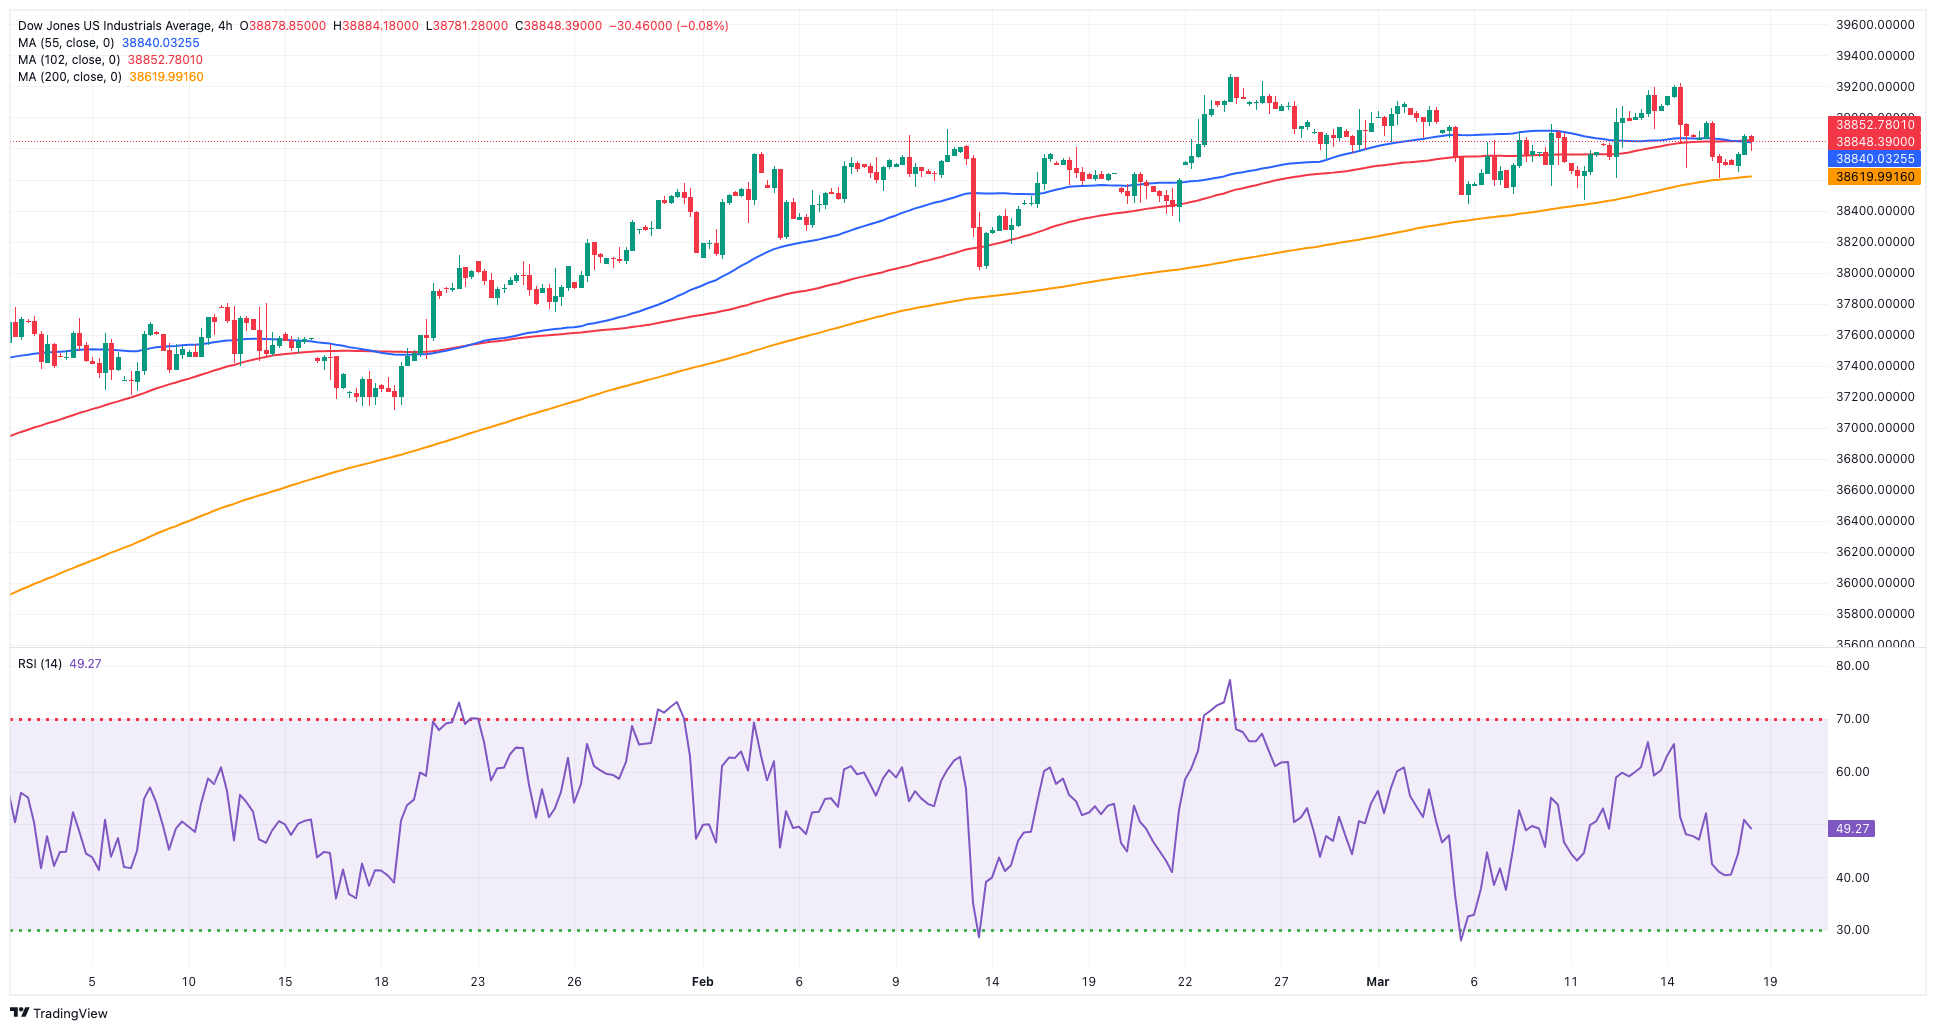
DOW JONES
The Dow Jones index, representing US stocks, reversed two straight sessions of losses and started the week on a positive foot, flirting once again with the 38,900 zone.
Rising cautiousness ahead of the FOMC event due on March 20 prompted investors to fade the pessimism observed in the latter part of last week on the back of diminishing expectations for a potential interest rate cut by the Fed in June, especially after US inflation data indicated that consumer prices remained above the bank's target in February.
At the beginning of the week, the Dow Jones gained 0.42% to 38,877, the S&P 500 advanced 0.90% to 5,162, and the tech-heavy Nasdaq Composite rose by 1.13% to 16,154.
Further upside might propel the Dow Jones to its record high of 39,282 (February 23). On the contrary, the 55-day SMA of 38,345 provides transitory support, followed by the 2024 low of 37,122 (January 18) and the weekly low of 37,073 (December 20, 2023). If the index falls below this level, it may hit the preliminary 100-day SMA at 36,987, which comes before the 200-day SMA at 35,652. The weekly low of 33,859 (November 7, 2023) is followed by the October 2023 low of 32,327 (October 27) and the 2023 bottom of 31,429 (March 15). The daily RSI improved to around 55.
Top Performers: Walt Disney, Caterpillar, Salesforce Inc
Worst Performers: Boeing, UnitedHealth, Goldman Sachs
Resistance levels: 39,201 39,282 (4H chart)
Support levels: 38,457 38,039 37,122 (4H chart)
MACROECONOMIC EVENTS

All Information & Updates provided by:

All information relating to the financial markets available on this page has been prepared and issued by FXStreet (Forexstreet SL, Spain, Reg: B62498233) on the basis of publicly available information and all information believed to be reliable and does not conflict with Kuwaiti local laws, and all necessary care has been taken to before the company to ensure that the facts mentioned are correct from the source.
NCM Investment nor any of its directors or employees shall in any way be held responsible for the contents of this news, and the information contained on this page is intended only to provide clients with publicly available information and should not be construed as investment advice, report or analysis and/or constitute an offer or invitation to buy or sell financial instruments of any kind.
RISK WARNING: Forex and CFDs are highly risky leveraged products, as losses can exceed deposits. Please ensure you understand all the risks and take independent advice if necessary. NCM will segregate the clients based on the criteria of the regulator and its bylaws. NCM does not provide any advisory service; the material published does not constitute advice or a recommendation for a transaction in any financial instrument. NCM accepts no responsibility for any use of the content presented and any consequences of that use. Anyone acting on the information provided does so at their own risk.