
- Contact Us:
-

-

-

-


Daily Market Updates
21 Mar 2024
EURUSD
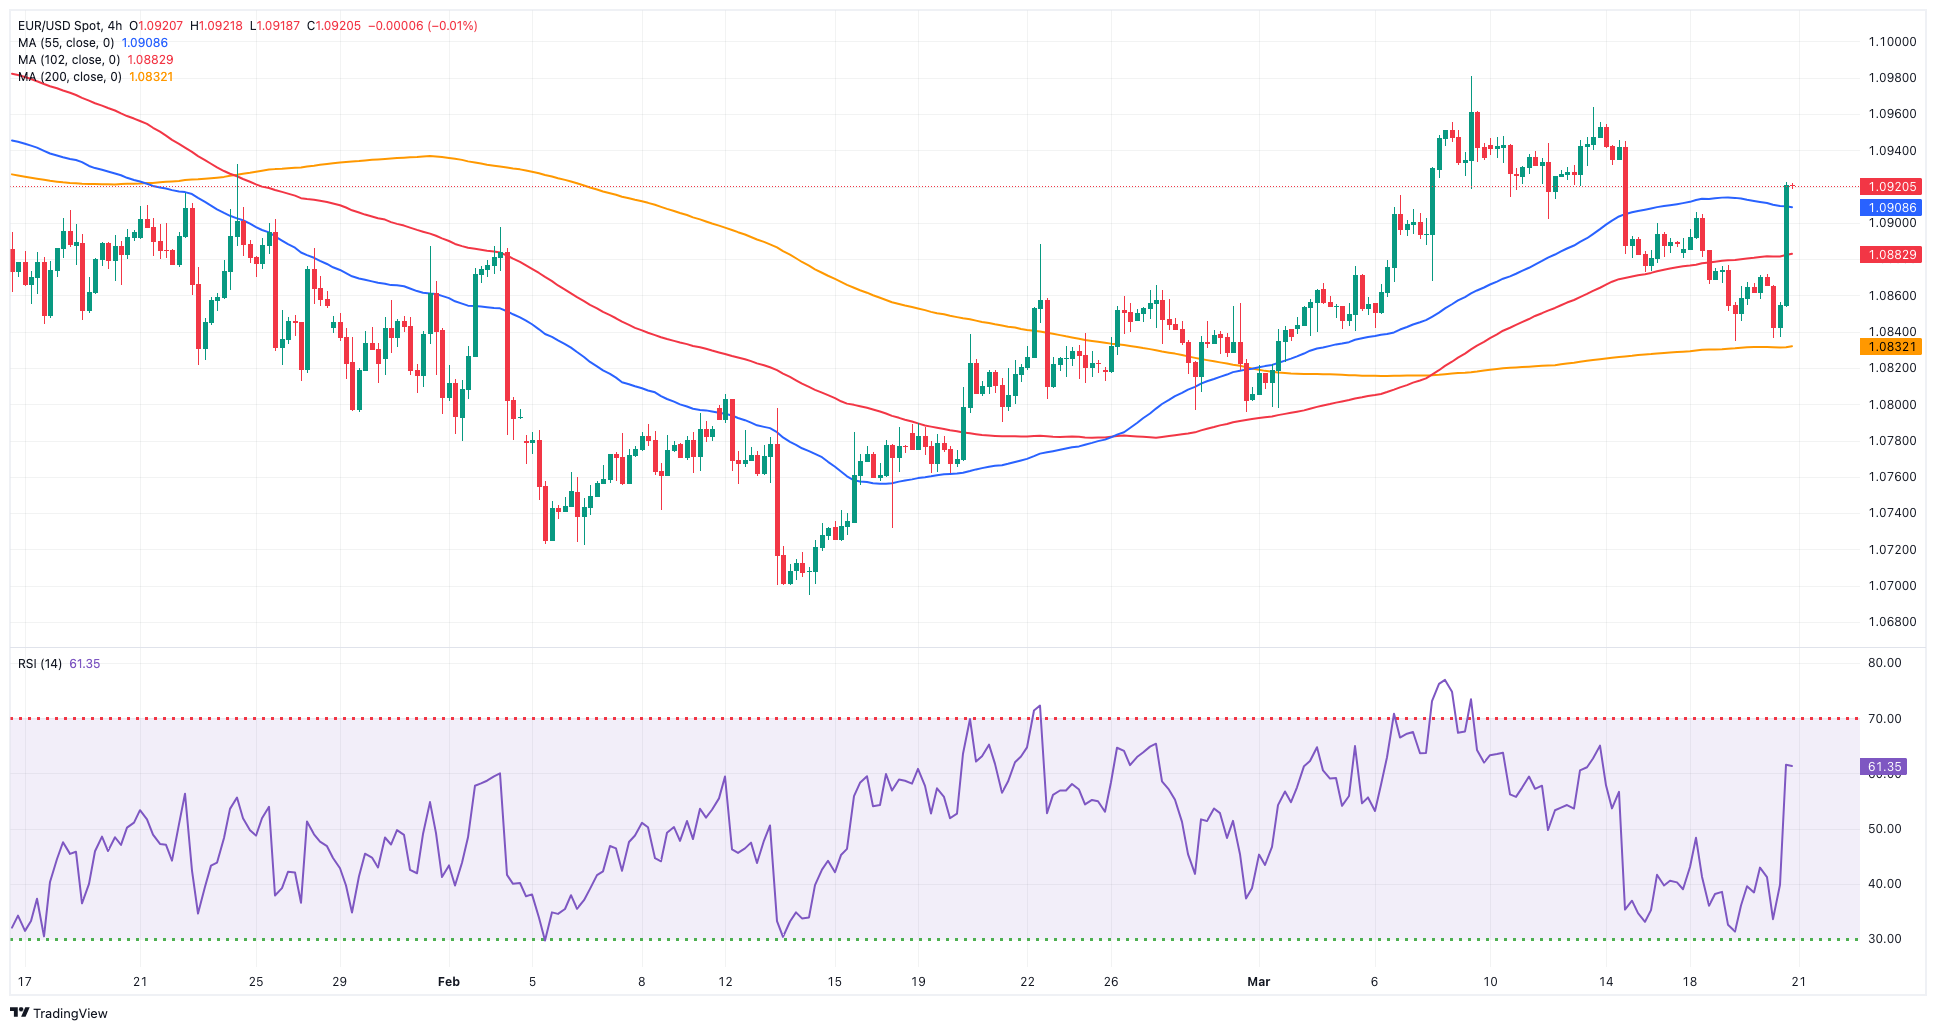
A weak session of the greenback saw the USD Index (DXY) drop to two-day lows near the 103.40 region after advancing past the 104.00 barrier earlier in the session.
The sharp decline in the buck came in response to the dovish message from Chair Powell at his press conference after the Fed left its interest rates unchanged.
On the Fed, members unanimously voted in favor of the bank’s policy, with the expectation that interest rates will not be reduced until there is stronger assurance that inflation is steadily progressing towards the 2% target. The risks associated with employment and inflation objectives are becoming more balanced. According to the latest projections, the Fed anticipates one less rate cut in 2025 compared to previous forecasts. Additionally, the median outlook of Fed officials for the Fed funds rate by the end of 2026 is now 3.1%, an increase from the previous estimate of 2.9%.
In fact, the Fed expects interest rates to be reduced until inflation reaches the 2% target, while it anticipates one rate cut in 2025 and a 3.1% median outlook for the Fed funds rate by 2026.
Meanwhile, Chief Powell commended the advancements in the economy, pointing to strong consumer demand and the recovery of supply chains. Nonetheless, he noted that elevated interest rates have impeded business investment. Despite this challenge, he highlighted the tightness of the labor market, with a gradual improvement in the alignment of supply and demand. He hinted at the possibility of rate cuts later in the year, underlining the importance of being confident in the sustainability of inflation's decrease before taking such actions.
Around the ECB, its President C. Lagarde has suggested earlier on Wednesday that June could witness the initial rate reduction, also emphasizing the ECB's commitment to data dependency and a meeting-by-meeting approach. This indicates that, even following the first cut, the ECB cannot pledge to a specific rate trajectory. Recently, Stournaras proposed the possibility of the ECB implementing two rate cuts prior to the summer hiatus and two thereafter. Market sentiment anticipates the first rate reduction occurring in June, with subsequent cuts likely in September, October, and potentially December.
In the domestic docket, the preliminary Consumer Confidence gauge by the European Commission improved to -14.9 for the current month.
If losses continue, EUR/USD may break below the 200-day SMA at 1.0839 on a convincing fashion and attempt a move to the weekly low of 1.0795 (February 29), which is prior to the 2024 low of 1.0694 (February 14). A further decrease might reach the weekly low of 1.0495 (October 13, 2023), prior to the 2023 bottom of 1.0448 (October 3) and the round milestone of 1.0400. Having said that, the first resistance is aligned at the March high of 1.0981 (March 8), before the weekly top of 1.0998 (January 5, 2011) and the psychological 1.1000 mark. The breakout of this zone may pave the way for a challenge to the December 2023 peak of 1.1139 (December 27), which remains bolstered by the 200-week SMA of 1.1148 and occurs before the 2023 high of 1.1275 (July 18). The daily RSI rose above the 58 level.
Resistance levels: 1.0922 1.0963 1.0981 (4H chart)
Support levels: 1.0834 1.0829 1.0795 (4H chart)
USDJPY
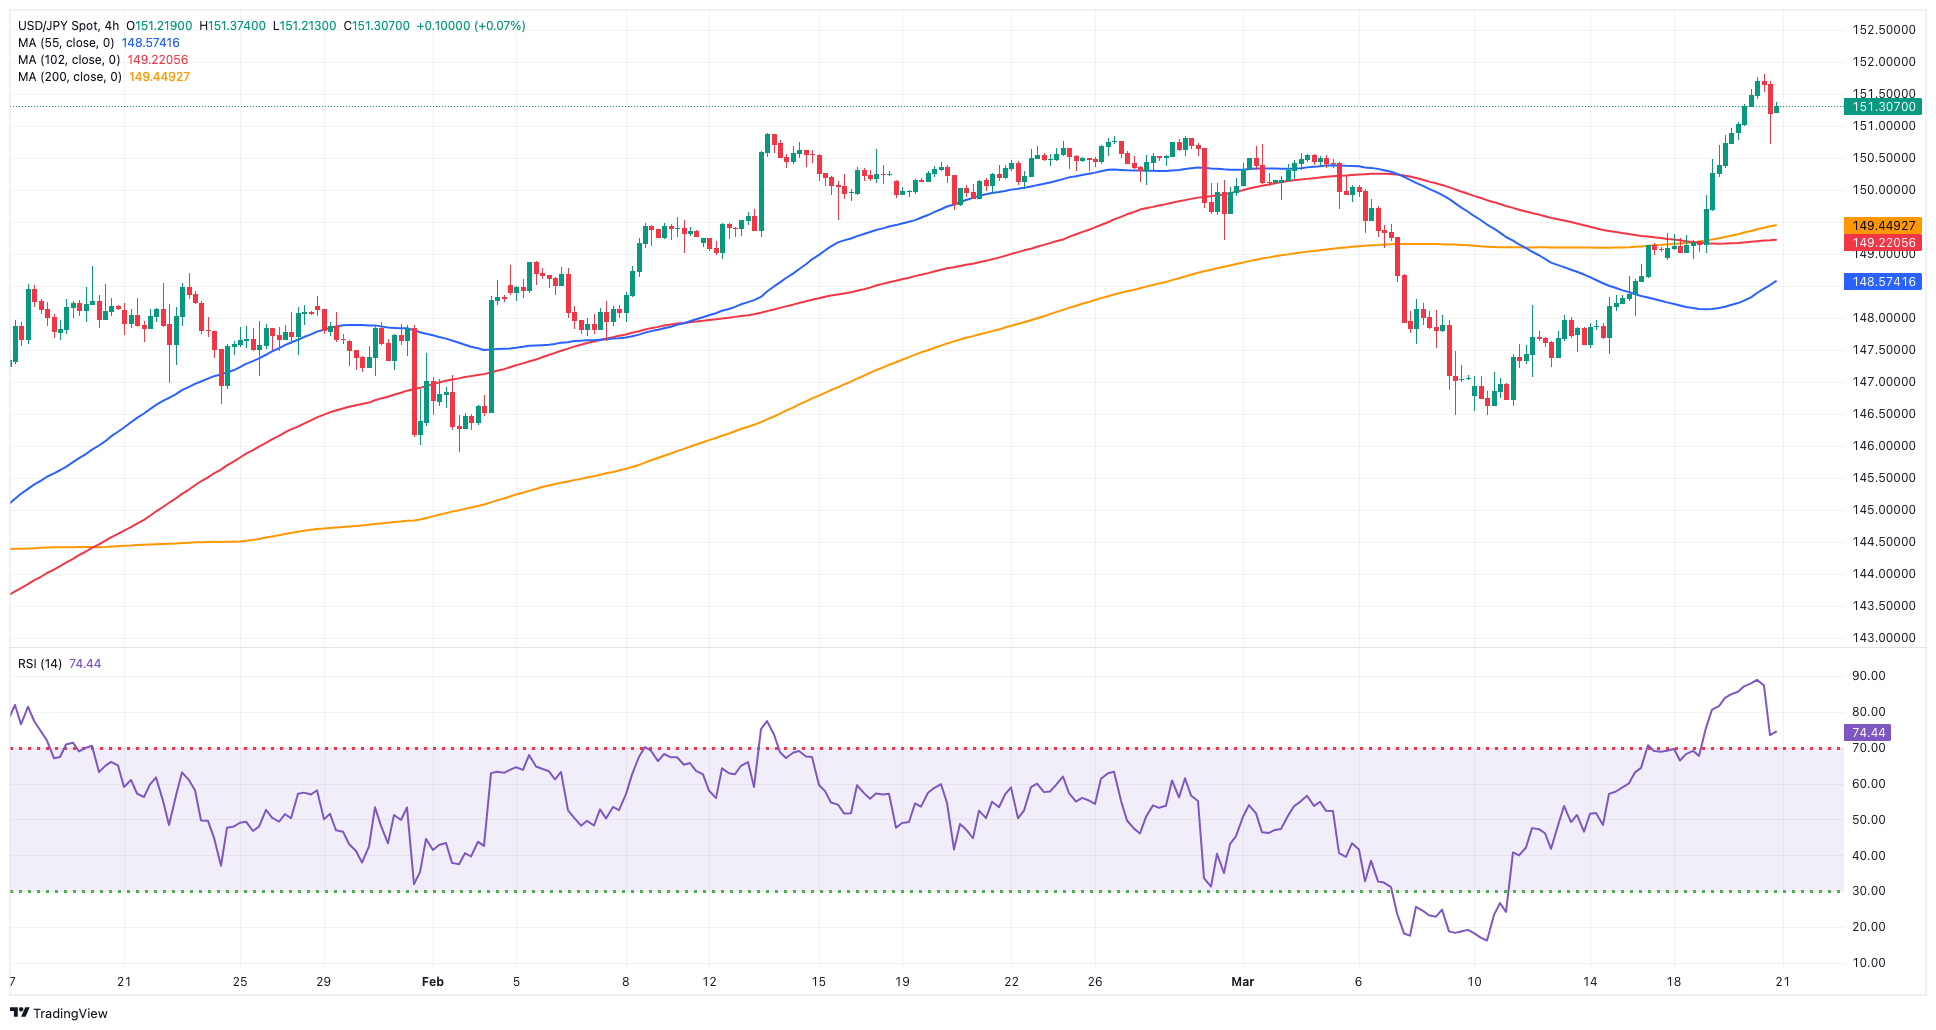
The downside pressure in the Japanese yen gathered fresh steam and propelled USD/JPY to levels last traded in mid-November around 151.80 against the backdrop of a weaker dollar and declining US yields following the FOMC event.
In fact, the Japanese currency remained on the back foot as investors continued to adjust their assessments following the BoJ decision to hike its policy rate by 10 bps for the first time since 2007.
It is important to note that during the subsequent news conference, Governor Ueda adopted a cautious stance, acknowledging the potential risks associated with not achieving the inflation target. Although the central bank decided to discontinue its yield curve control programme, it reaffirmed its commitment to continue buying long-term government debt.
USD/JPY is presently aiming for the 2024 high of 151.81 (March 20), which comes just before the 2023 top of 151.90 (November 13). Further up, the 2022 peak of 151.94 (October 21) anticipates the round figure of 152.00. Instead, the initial support level is set at March's low of 146.47 (March 8), a region reinforced by the proximity of the key 200-day SMA (146.52). The breakdown of this zone might result in a return to the February low of 145.89 (February 1), followed by the December 2023 low of 140.24 (December 28), which comes before the round number 140.00 and the July low of 137.23 (July 14). The day-to-day RSI rose beyond 66.
Resistance levels: 151.81 151.90 151.94 (4H chart)
Support levels: 149.27 148.16 146.47 (4H chart)
GBPUSD
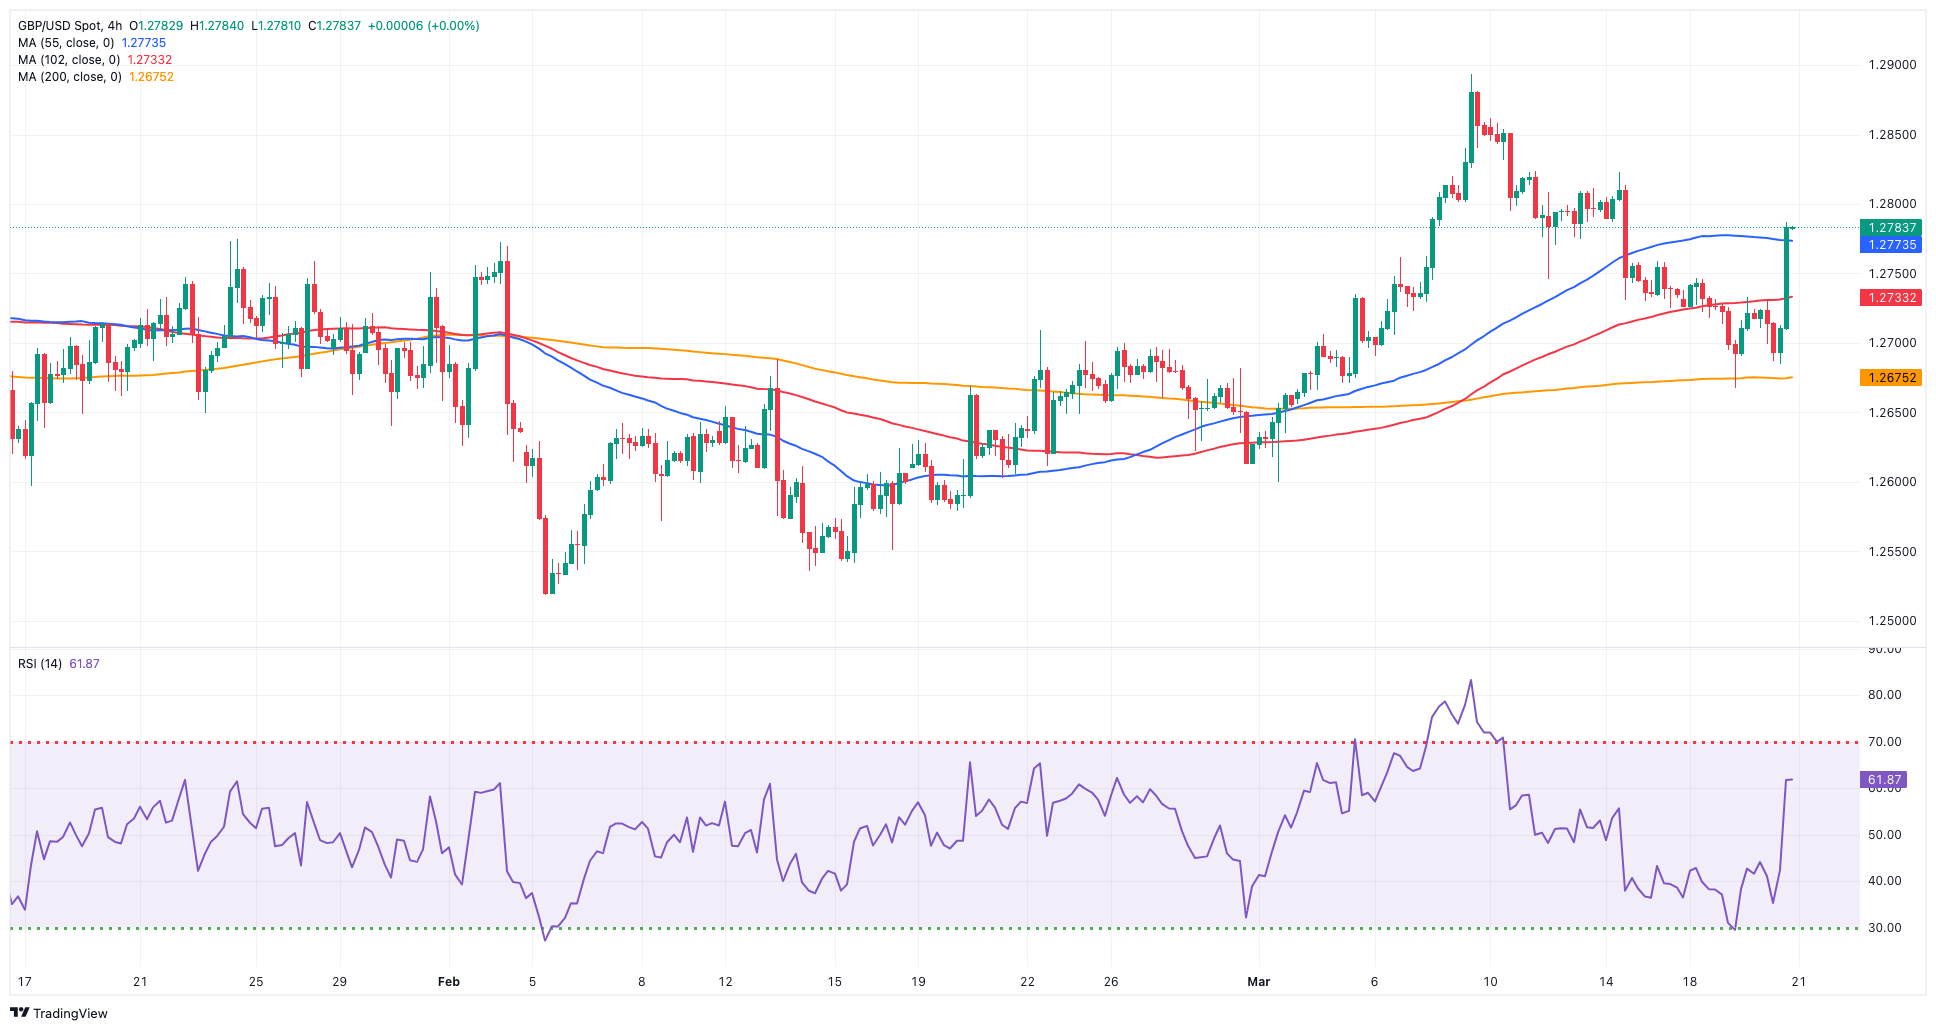
GBP/USD made a sharp U-turn in line with the rest of its risk-related peers on Wednesday, this time approaching the 1.2800 hurdle amidst the sharp retracement in the dollar.
Indeed, the greenback gathered unexpected downward pace in the wake of the FOMC event, where the Fed left its FFTR unchanged at 5.00%–5.25%, as widely expected, and Chief Powell stroke a dovish message.
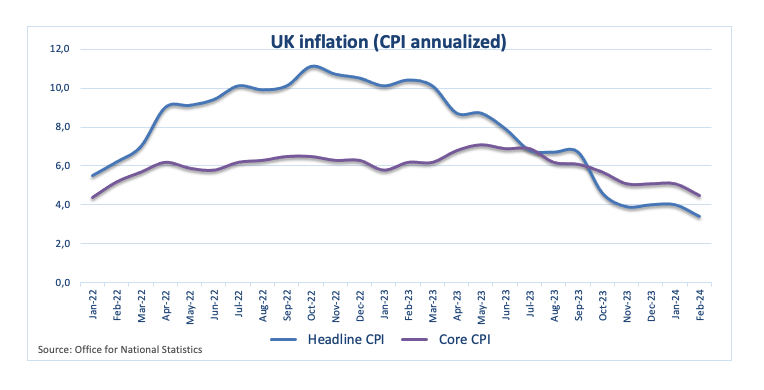
On the not-so-bright side for the British pound, UK disinflationary pressures picked up pace in February after inflation tracked by the headline CPI rose by 3.4% YoY and 4.5% when it came to the Core CPI, all allowing speculation of a rate cut by the BoE probably sooner than anticipated.
Ahead of the key BoE gathering on Thursday, 10-year gilt yields dropped further and revisited the key 4.0% zone.
The weekly low of 1.2667 (March 19) precedes the preliminary 100-day SMA at 1.2619, which is followed by the March low of 1.2599 (March 1) and the key 200-day SMA at 1.2592. The loss of this zone might bring the 2024 low of 1.2518 (February 5) back into focus, ahead of the December 2023 low of 1.2500 (December 13). A deeper decline should not find significant support until the weekly low of 1.2187 (November 10, 2023), followed by the October 2023 low of 1.2037 and the main 1.2000 barrier. In the other direction, the next upward obstacle is the 2024 top of 1.2893 (March 8), followed by the weekly peak of 1.2995 (July 27, 2023), all before the important 1.3000 mark. The daily RSI rose to the proximity of 60..
Resistance levels: 1.2786 1.2823 1.2893 (4H chart)
Support levels: 1.2667 1.2599 1.2579 (4H chart)
GOLD
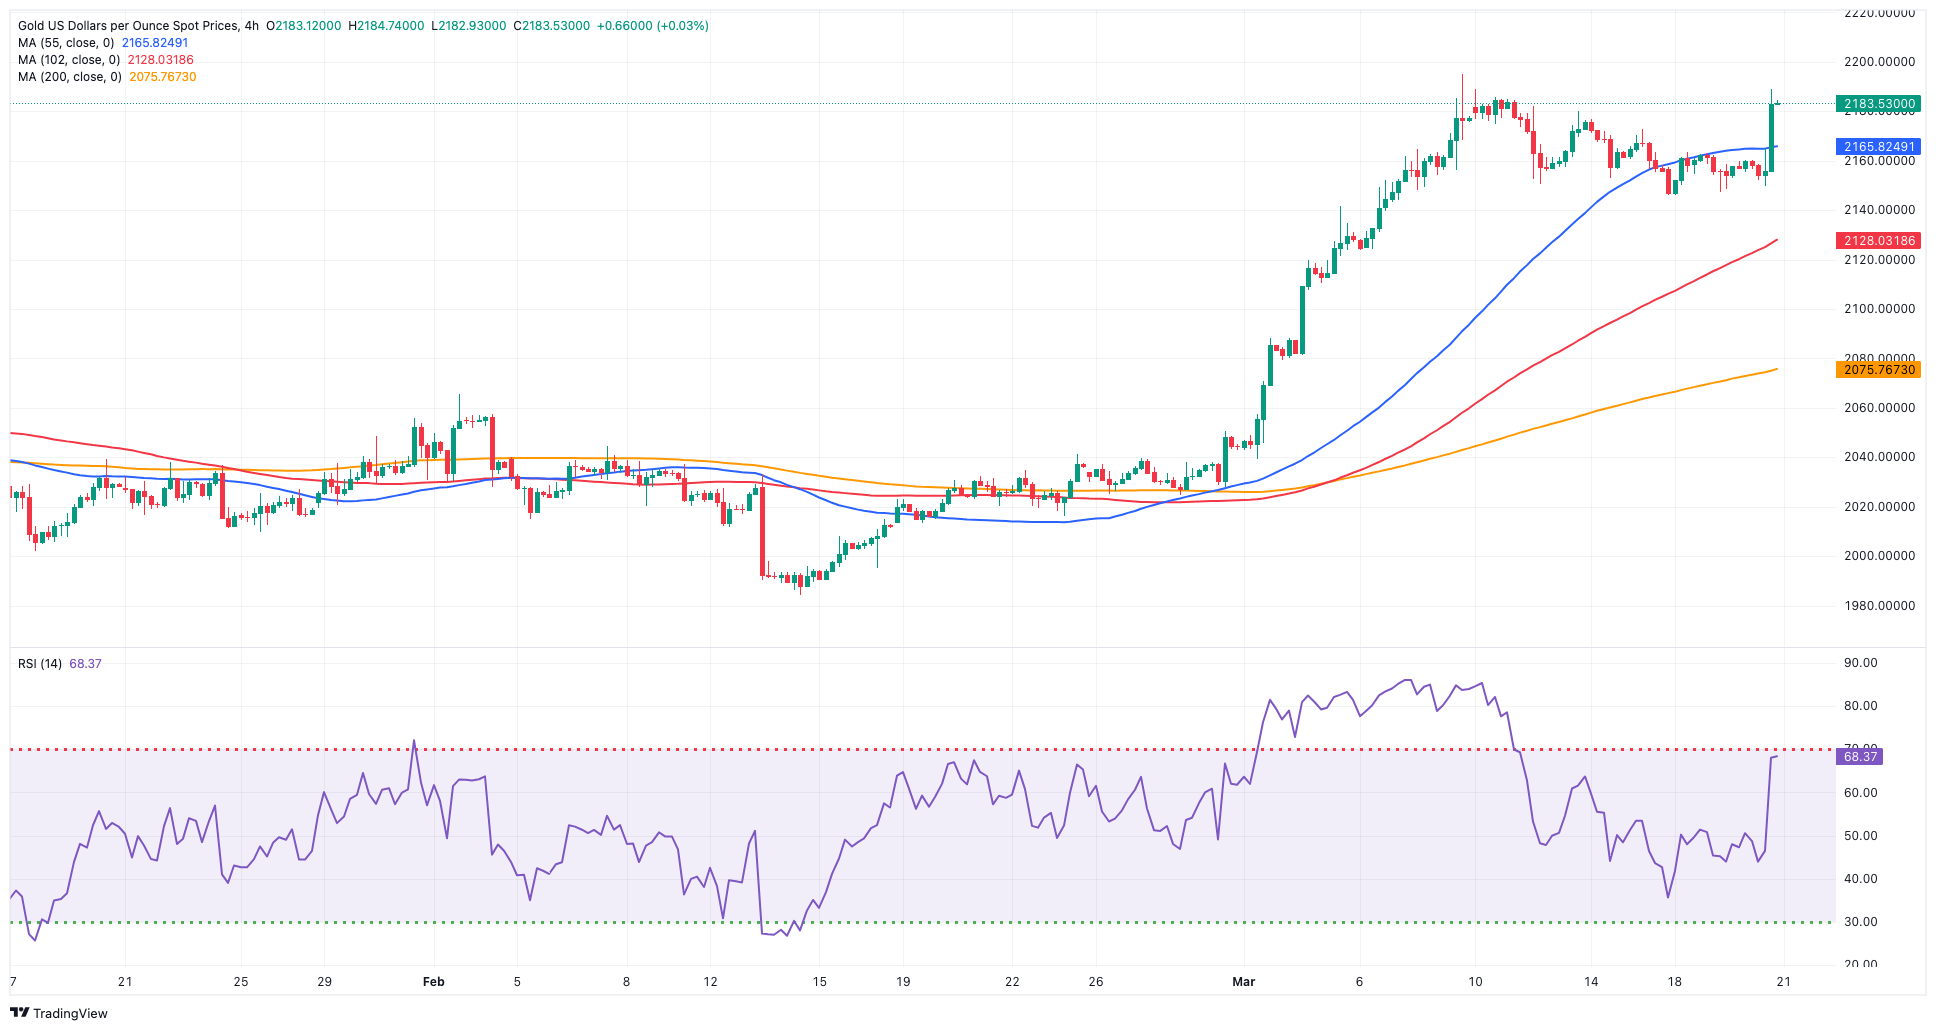
Gold prices rose markedly and approached the $2,180 region per troy ounce on Wednesday.
The metal’s firm price action came on the back of the renewed downside bias in the greenback, while US yields retreated further across the curve in the wake of the FOMC event and the dovish tone from Chair Powell at his press conference.
Immediately to the upside for gold emerges its all-time peak of $2,195 (March 8). Conversely, the 55-day and 100-day SMAs of $2,059 and $2,037 should provide temporary support, seconded by the 2024 low of $1,984 (February 14) and the critical 200-day SMA at $1,980. The loss of this region exposes the December 2023 low of $1,973 before the November 2023 low of $1,931. The breakdown of the latter might prompt the yellow metal to test its October 2023 bottom of $1,810, prior to the 2023 low of $1,804 and the important $1,800 conflict zone.
Resistance levels: $2,188 $2,195 (4H chart)
Support levels: $2,146 $2,129 $2,075 (4H chart)
CRUDE WTI
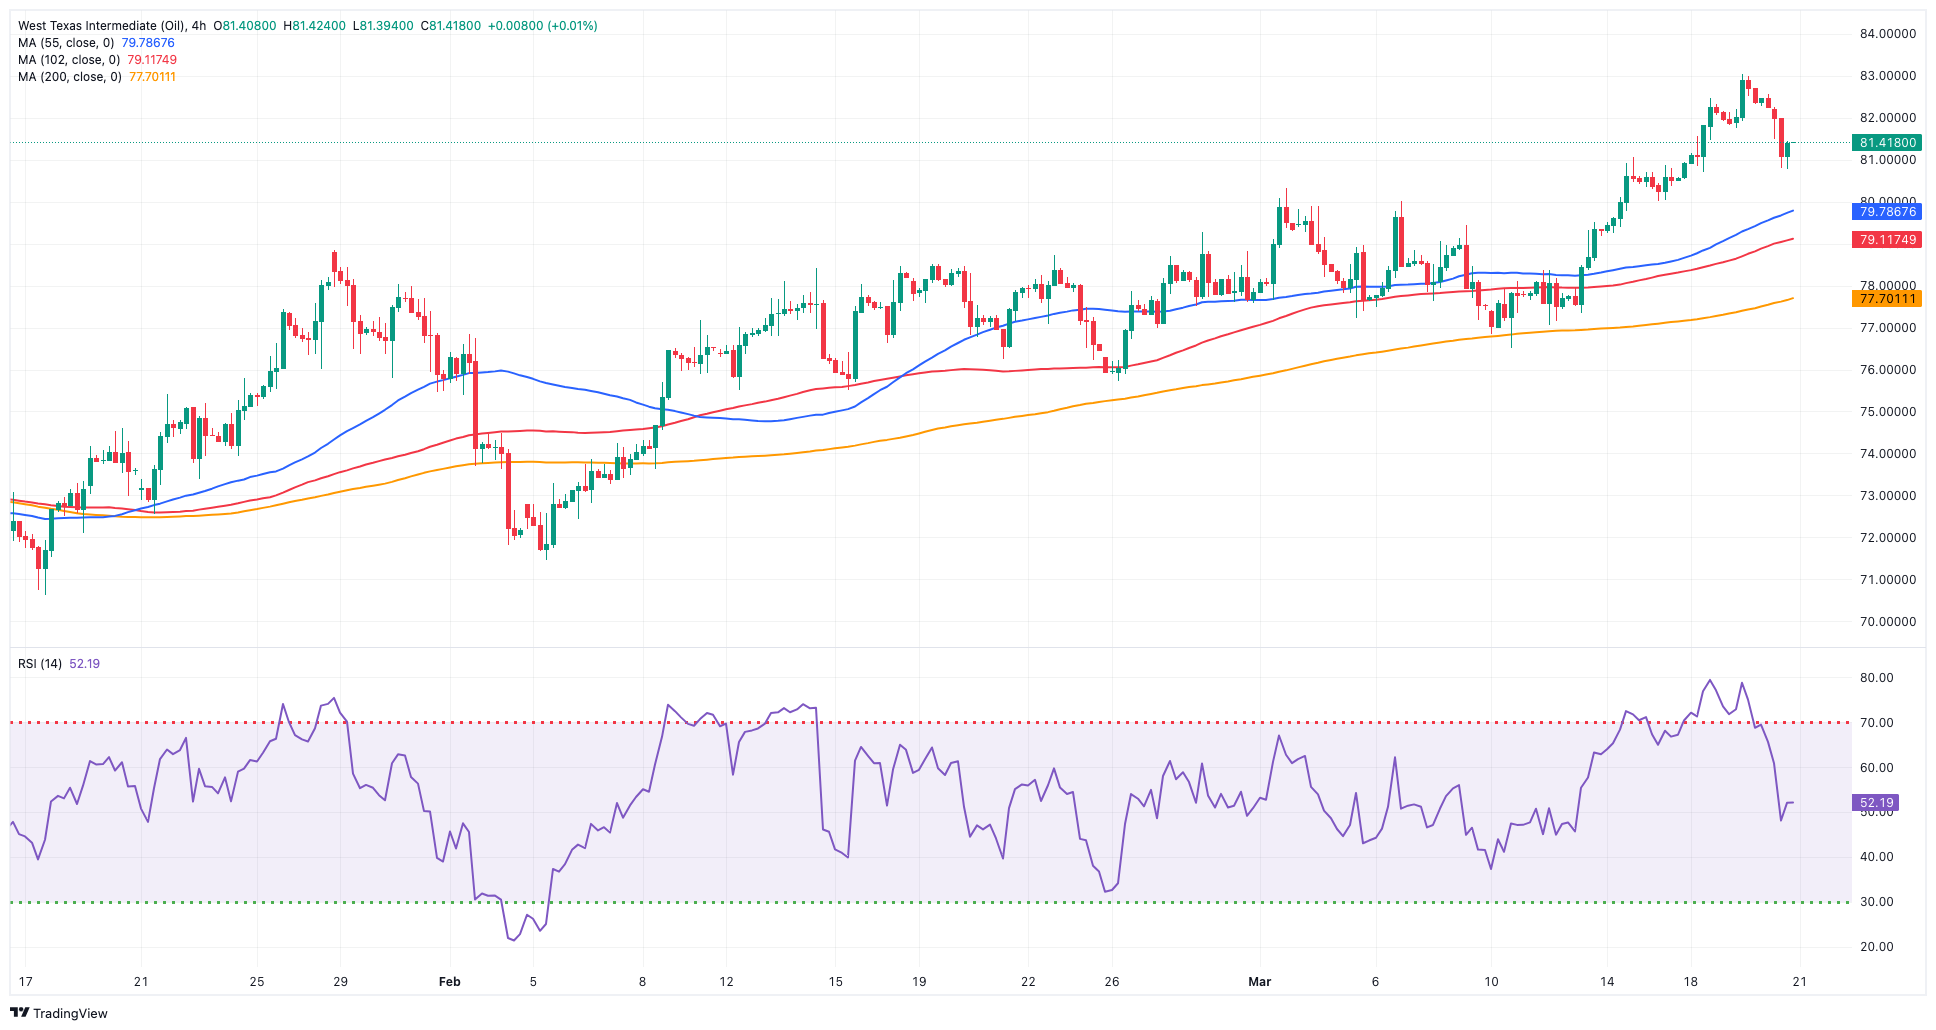
Prices of the American benchmark for sweet light crude oil abandoned the area of recent yearly highs and retreated to the $81.00 region per barrel on Wednesday.
In fact, the corrective decline in crude oil prices reversed two daily advances in a row, including Tuesday’s 2024 tops north of the $83.00 yardstick, on the back of the weak tone in the greenback after the FOMC meeting kept rates unchanged.
The negative price action in the commodity also ignored the positive report by the EIA, after the agency said that US crude oil inventories shrank by 1.952M barrels in the week to March 15, while supplies at Cushing dropped by 0.018M barrels, Weekly Distillate Stocks rose by 0.624M barrels, and gasoline stockpiles went down by 3.310M barrels.
In addition, persistent supply concerns lingered after recent Ukrainian attacks on Russian oil facilities, while shrinking exports from Iraq and Saudi Arabia also collaborated with the recent uptick in crude oil prices.
The next upward challenge for WTI is the 2024 peak of $83.09 (March 19), which is just before the weekly high of $89.83 (October 18, 2023) and the 2023 peak of $94.99 (September 28, 2023). Further north, the weekly peak of $97.65 (August 30) comes before the psychological $100.00 barrier. On the flip side, the 200-day SMA provides first support around $78.37, prior to the February low of $71.43 (February 5). Extra losses highlight the important $70.00 milestone ahead of the 2024 bottom of $69.31 (January 3).
Resistance levels: $83.09 $83.56 $85.85 (4H chart)
Support levels: $80.86 $76.76 $75.81 (4H chart)
GER40
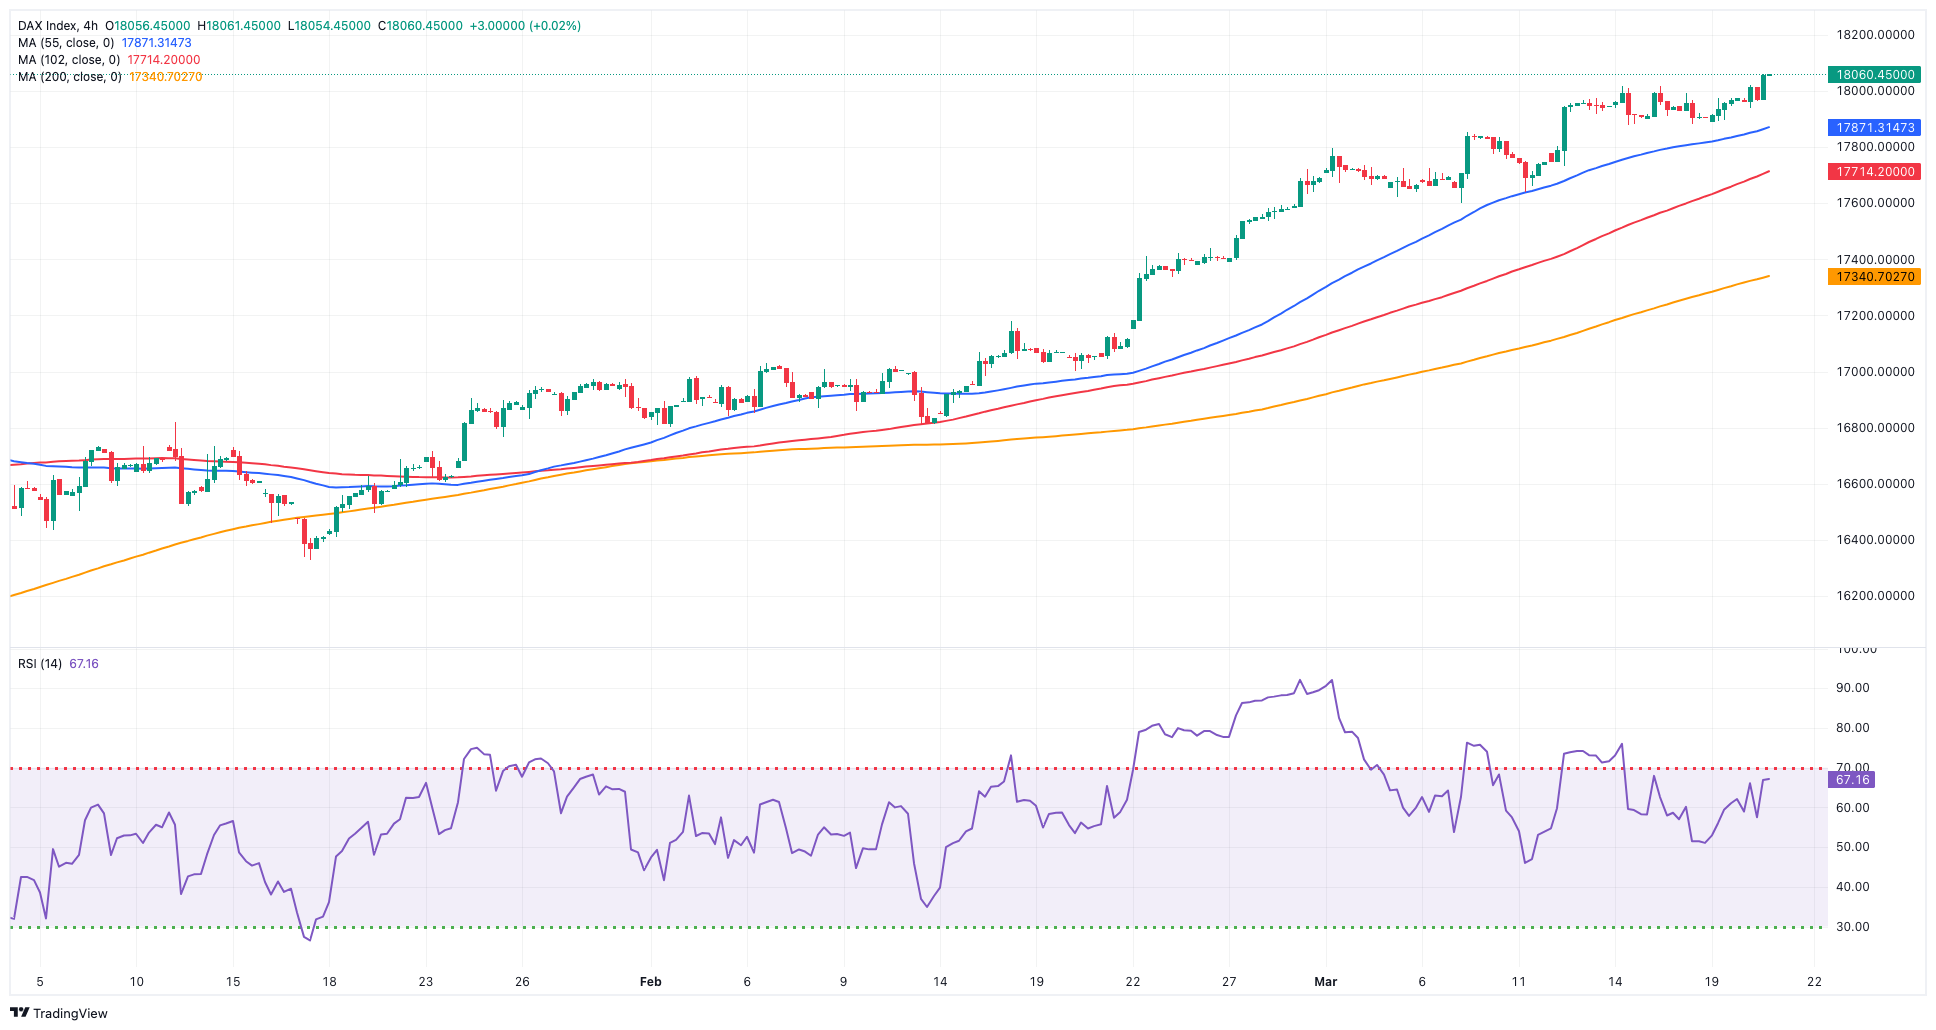
On Wednesday, European equities experienced a pause as global markets held their breath for a monetary policy announcement from the Fed.
However, investor sentiment was influenced by the lower-than-expected UK inflation figures during February, which suggested that the BoE might start its easing cycle earlier than anticipated.
The increased cautiousness among investors, however, did not prevent the German reference DAX40 from climbing to an all-time high past 18,040, adding to gains made in the previous session.
Around the ECB, President Lagarde also advocated for a likely interest rate cut in June, although she reiterated that any decision on rates will depend on upcoming data releases.
Meanwhile, the 10-year bund yields added to Tuesday’s drop and flirted with the 2.40% level.
The next level of resistance for the DAX40 is the record high of 18,044 (March 20). The other way around, the 55-day SMA at 17,165 should give some brief support until the February low of 16,821 (February 1). A decline below this level could drive the index to attempt the 2024 low of 16,345 (January 17), which is ahead of the crucial 200-day SMA at 16,203. Once the latter is passed, a potential challenge of the weekly low of 15,915 (November 28) may appear on the horizon, before the October low of 14,630 (October 23) and the 2023 bottom of 14,458 (March 20). The daily RSI edged to 77, indicating that the market remained overbought.
Best Performers: BASF, Covestro, RWE AG ST
Worst Performers: Henkel VZO, Rheinmetall AG, Siemens Healthineers
Resistance levels: 18,044 (4H chart)
Support levels: 17,619 17,046 16,831 (4H chart)
GBPJPY
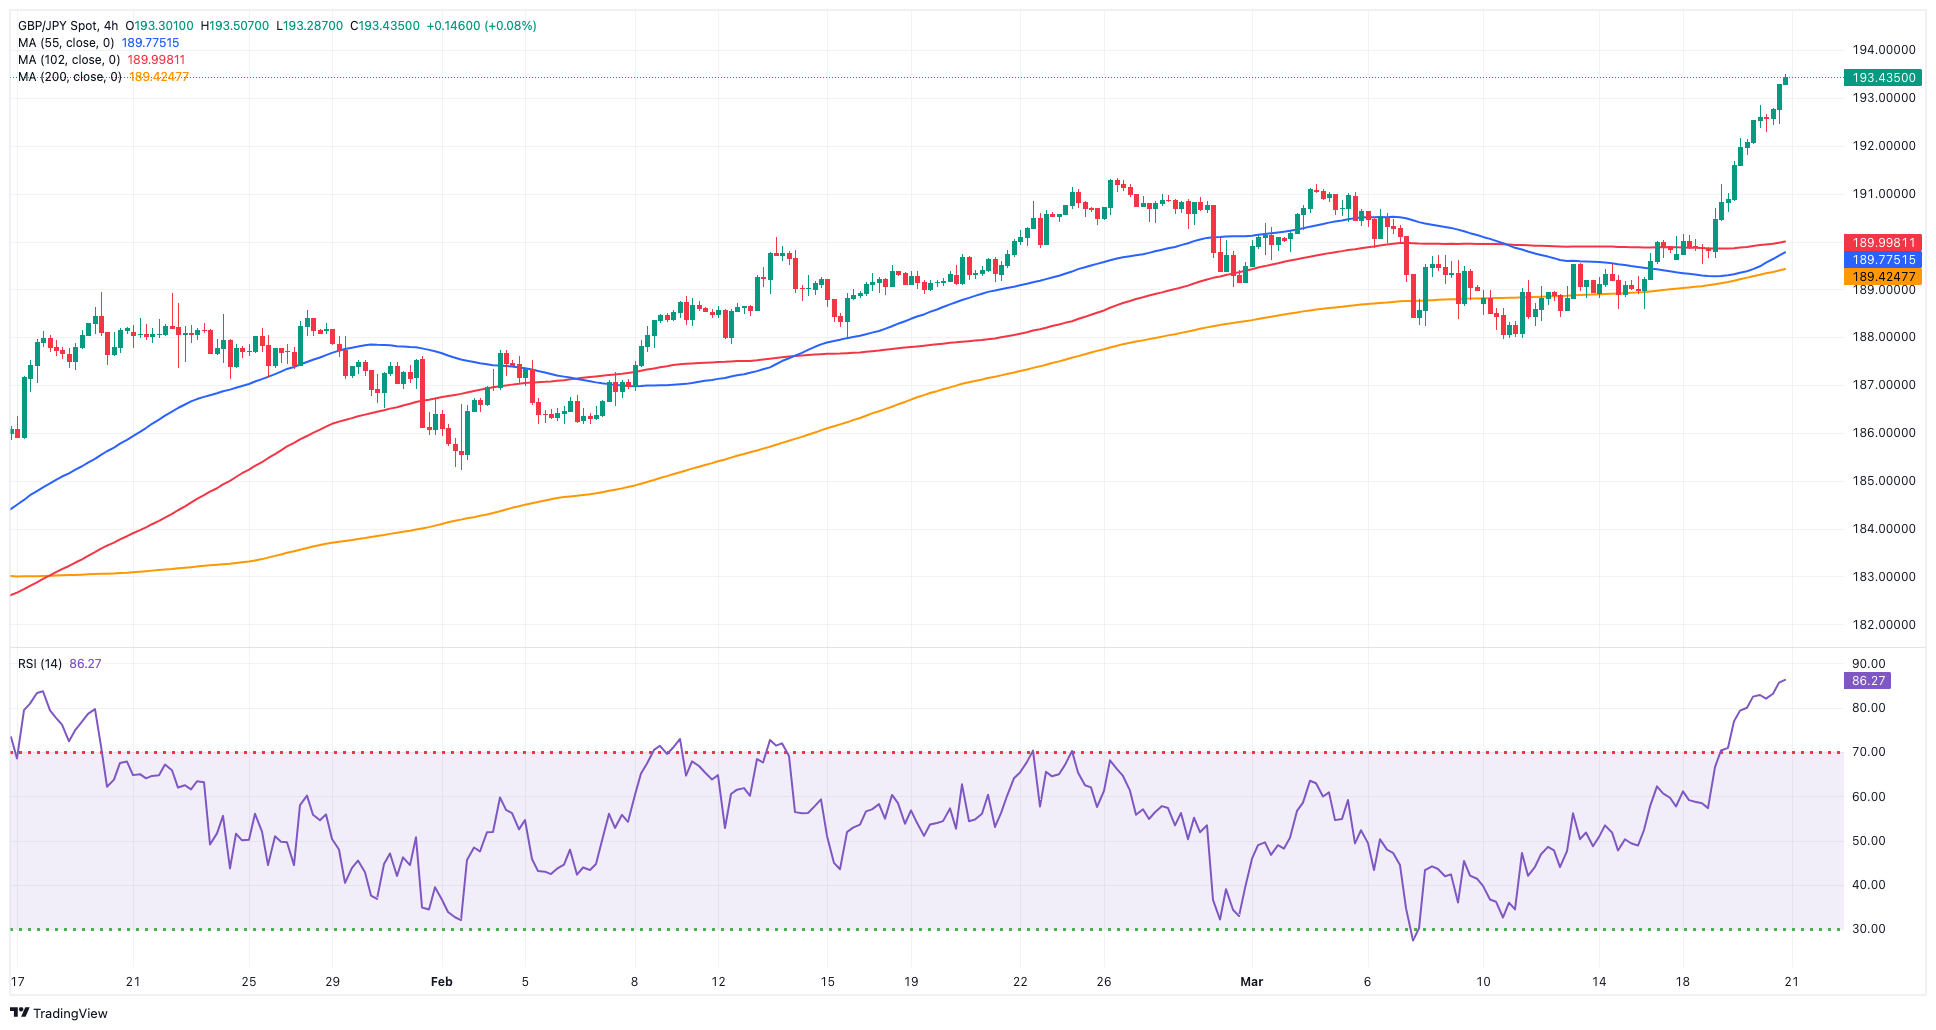
The strong downward bias in the Japanese yen sponsored the move to fresh 2024 highs around 193.30 in GBP/JPY on Wednesday.
Indeed, the yen retreated further as investors continued to digest the BoJ event, while the quid remained on the defensive in an atmosphere of further gains in the greenback, all after the Fed maintained its interest rates unchanged at its event.
The 2024 high of 193.29 (March 20) comes ahead of the August 2015 top of 195.28 (August 18) and the record peak of 195.88 (June 24, 2015). On the other side, there is interim support at the 55-day SMA at 188.31 prior to the March low of 187.96 (March 11) and the transitory 100-day SMA at 186.42. A breach of the latter might bring a test of the February low of 185.22 (February 1), ahead of the more important 200-day SMA around 184.49. A deeper retracement could revisit the December 2023 low of 178.33 (December 14), which comes before the October 2023 low of 178.03 and the July 2023 bottom of 176.30. The everyday RSI past 70, entering the overbought zone.
Resistance levels: 193.29 195.28 195.88 (4H chart)
Support levels: 189.18 187.96 186.44 (4H chart)
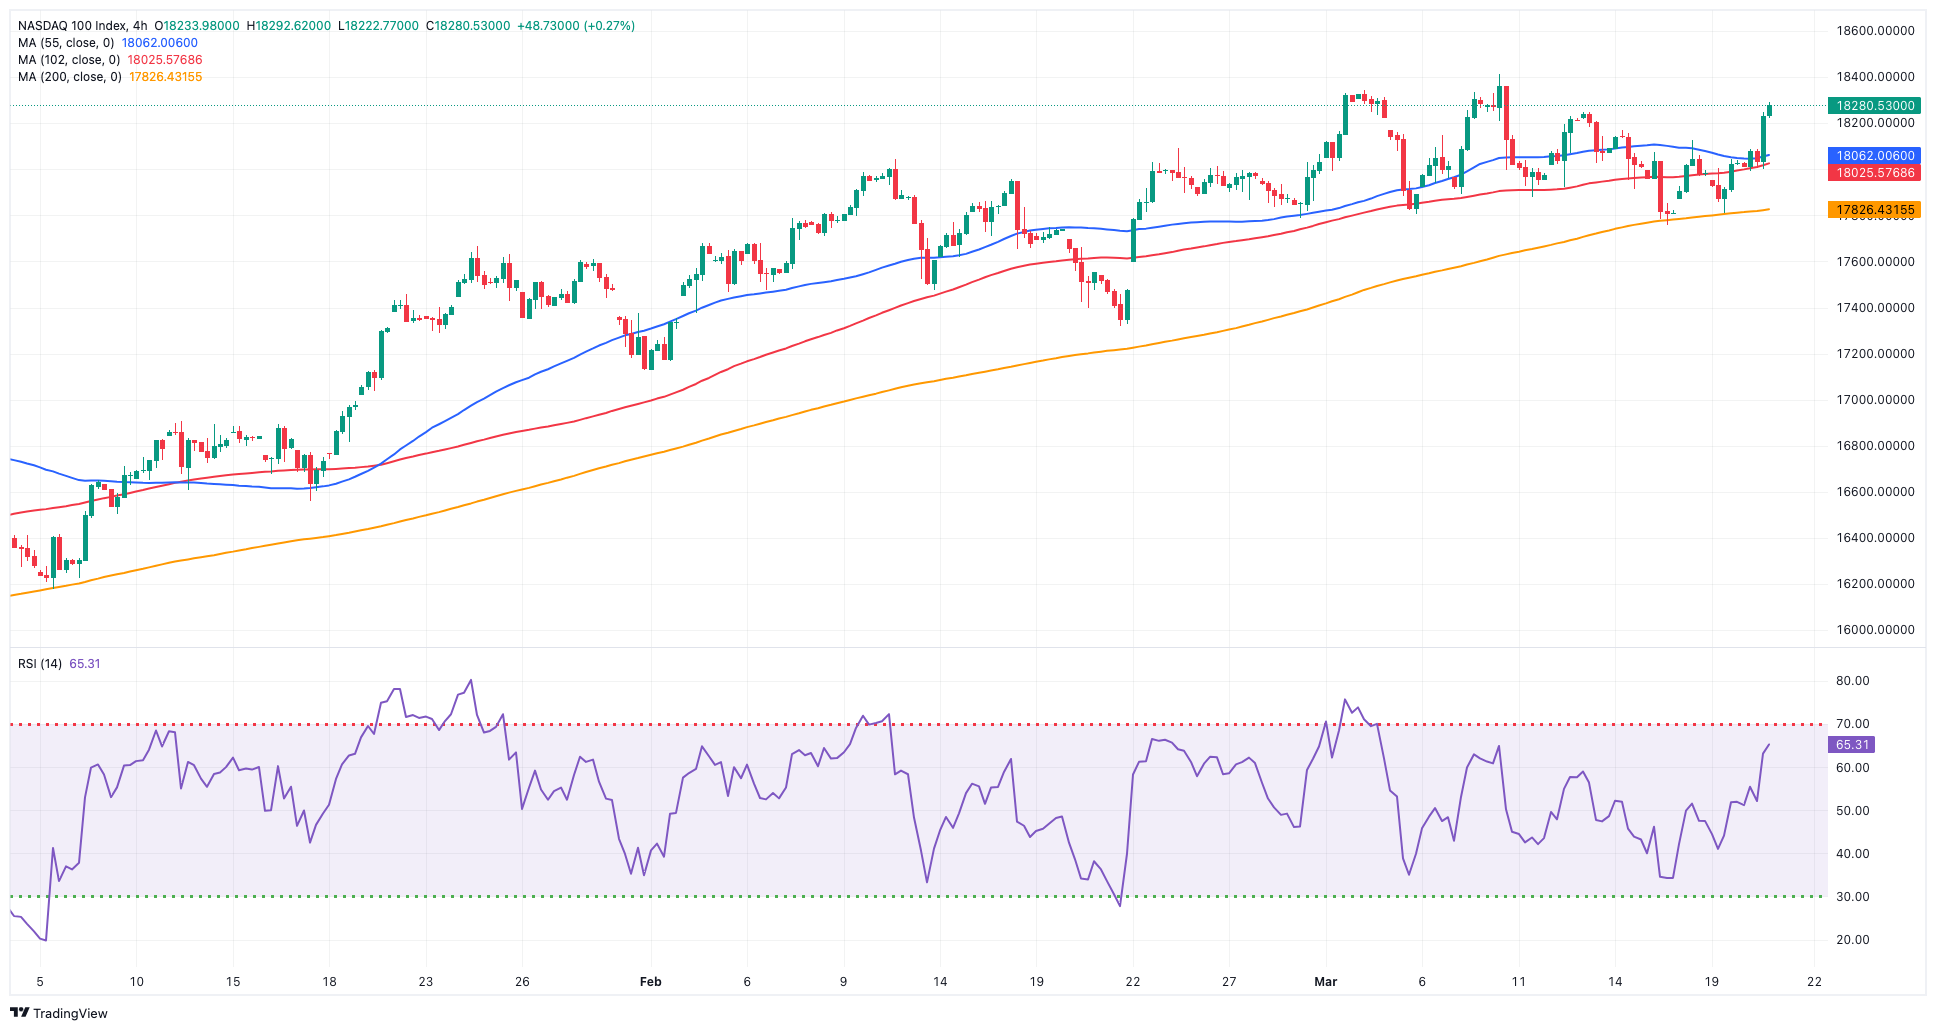
NASDAQ
Further optimism in the US tech sector helped the Nasdaq 100 index clinch its third consecutive daily advance, this time revisiting the 18,200 zone on Wednesday.
Further upside in the index came in line with the broad-based bullish sentiment in the rest of the US markets after the FOMC gathering saw the Fed leaving its rates unchanged, as expected, while Chair Powell surprised market participants with a dovish tilt at his press conference.
The sell-off in the greenback in tandem with lower US yields further bolstered the rebound in the Nasdaq 100.
Further gains could force the Nasdaq 100 to test its all-time high of 18,416 (March 8). Just the opposite, the index is expected to find transitory support at the 55-day SMA of 17,543 before sliding to weekly lows of 17,319 (February 21) and 17,128 (January 31). Once the latter is crossed, the index may target the 2024 low of 16,249 (January 5), which comes ahead of the critical 200-day SMA of 15,936 and the December 2023 low of 15,695 (December 4). Additional losses from here could test the October 2023 bottom of 14,058 (October 26), which comes before the April 2023 low of 12,724 (April 25) and the March 2023 low of 11,695 (March 13). Down from here emerges the 2023 low of 10,696 (January 3). The daily RSI advanced near 58.
Top Gainers: DoorDash, The Trade Desk, PDD Holdings DRC
Top Losers: Sirius XM, Moderna, AMD
Resistance levels: 18,249 18,416 (4H chart)
Support levels: 17,764 17,319 17,128 (4H chart)
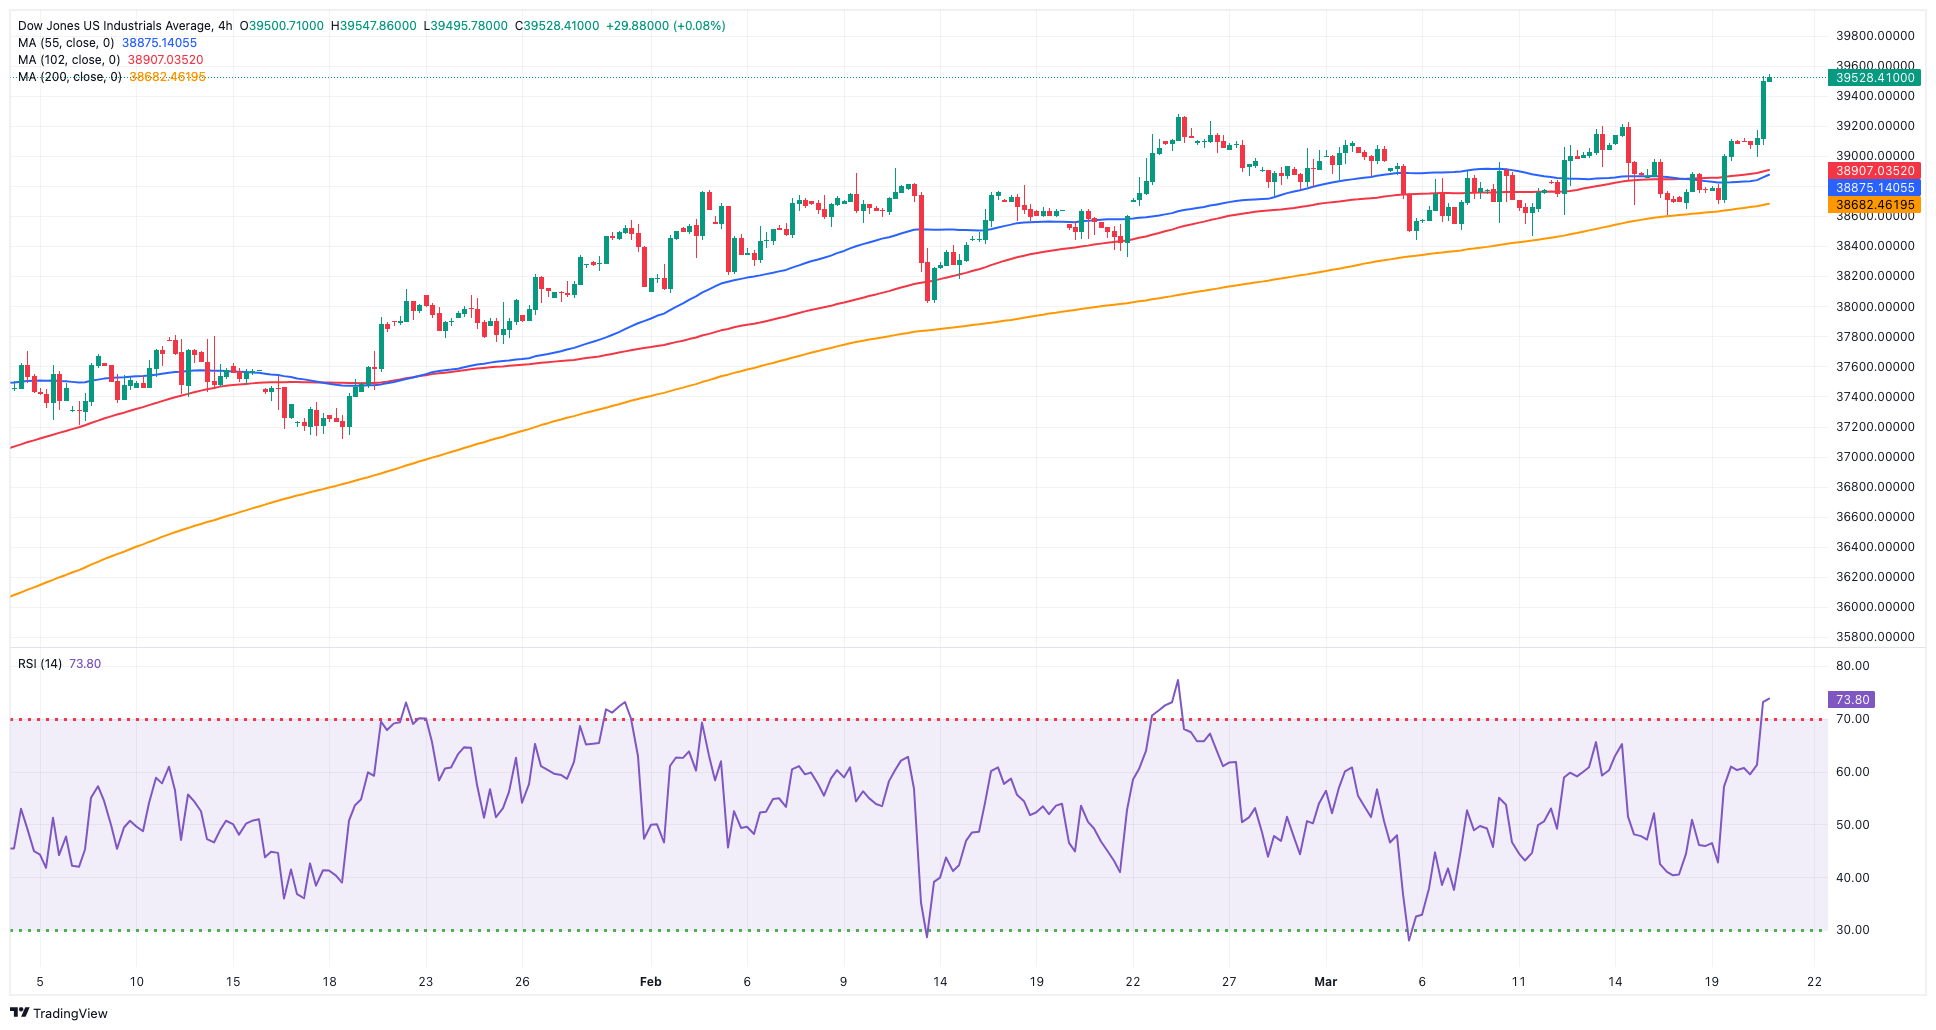
DOW JONES
The US stock benchmark Dow Jones edged to a new all-time high past the 39,500 level on Wednesday.
The strong uptick in US equities came after the Fed left its interest rates unchanged, while the Committee sees three rate cuts this year. In addition, Chair Powell delivered a bearish tone at his press conference, boosting further investors’ sentiment.
At present, the most probable scenario is a rate cut in June, with CME Group's FedWatch Tool indicating a 62% likelihood of a 25 bps reduction at the bank's meeting scheduled for June 12.
All in all, the Dow Jones advanced 1.03% to 39,512, the S&P 500 rose 0.89% to 5,224, and the tech-heavy Nasdaq Composite gained 1.17% to 16,357.
Further increases might propel the Dow Jones to a record high of 39,529 (March 20). Alternatively, the 55-day SMA of 38,397 provides temporary support, followed by the 2024 low of 37,122 (January 18) and the weekly low of 37,073 (December 20, 2023). If the index falls below this level, it may reach the preliminary 100-day SMA at 37,107 before to the 200-day SMA at 35,709. The weekly low of 33,859 (November 7, 2023) is next, followed by the October 2023 low of 32,327 (October 27) and the 2023 bottom of 31,429 (March 15). The daily RSI rose past 67.
Top Performers: Boeing, Dow, American Express
Worst Performers: Chevron, J&J, Procter&Gamble
Resistance levels: 39,529 (4H chart)
Support levels: 38,471 38,039 37,122 (4H chart)
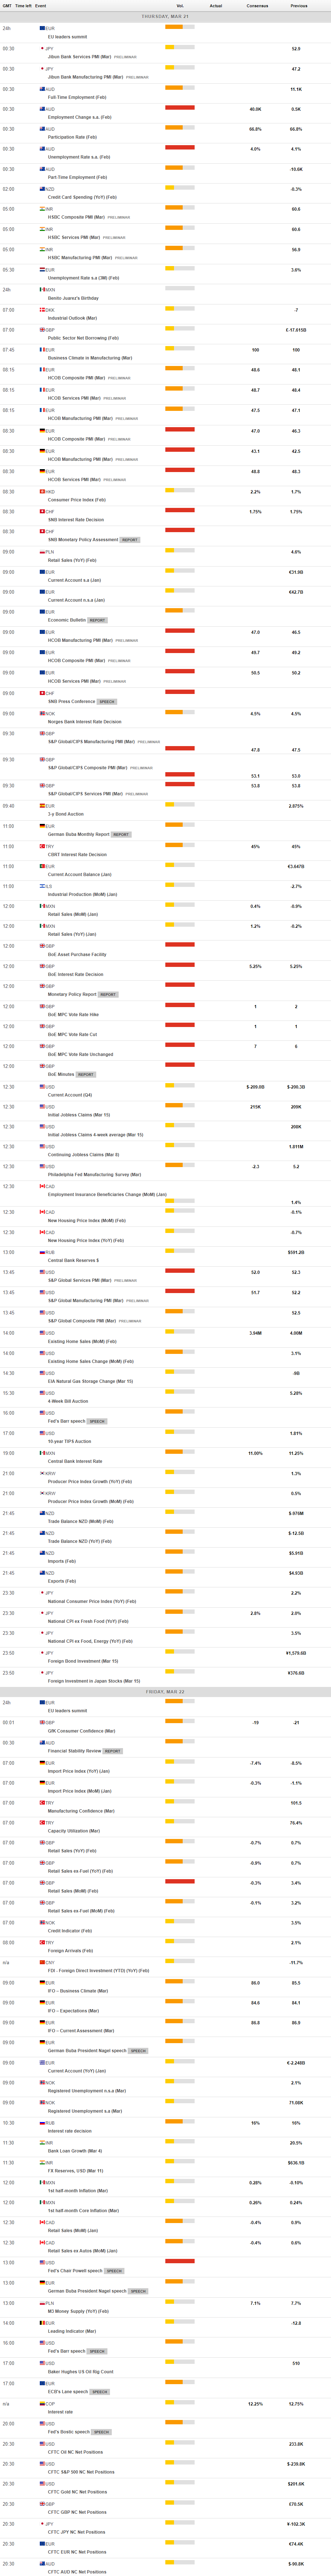
MACROECONOMIC EVENTS
All Information & Updates provided by:

All information relating to the financial markets available on this page has been prepared and issued by FXStreet (Forexstreet SL, Spain, Reg: B62498233) on the basis of publicly available information and all information believed to be reliable and does not conflict with Kuwaiti local laws, and all necessary care has been taken to before the company to ensure that the facts mentioned are correct from the source.
NCM Investment nor any of its directors or employees shall in any way be held responsible for the contents of this news, and the information contained on this page is intended only to provide clients with publicly available information and should not be construed as investment advice, report or analysis and/or constitute an offer or invitation to buy or sell financial instruments of any kind.
RISK WARNING: Forex and CFDs are highly risky leveraged products, as losses can exceed deposits. Please ensure you understand all the risks and take independent advice if necessary. NCM will segregate the clients based on the criteria of the regulator and its bylaws. NCM does not provide any advisory service; the material published does not constitute advice or a recommendation for a transaction in any financial instrument. NCM accepts no responsibility for any use of the content presented and any consequences of that use. Anyone acting on the information provided does so at their own risk.