
- Contact Us:
-

-

-

-


Daily Market Updates
22 Mar 2024
EURUSD
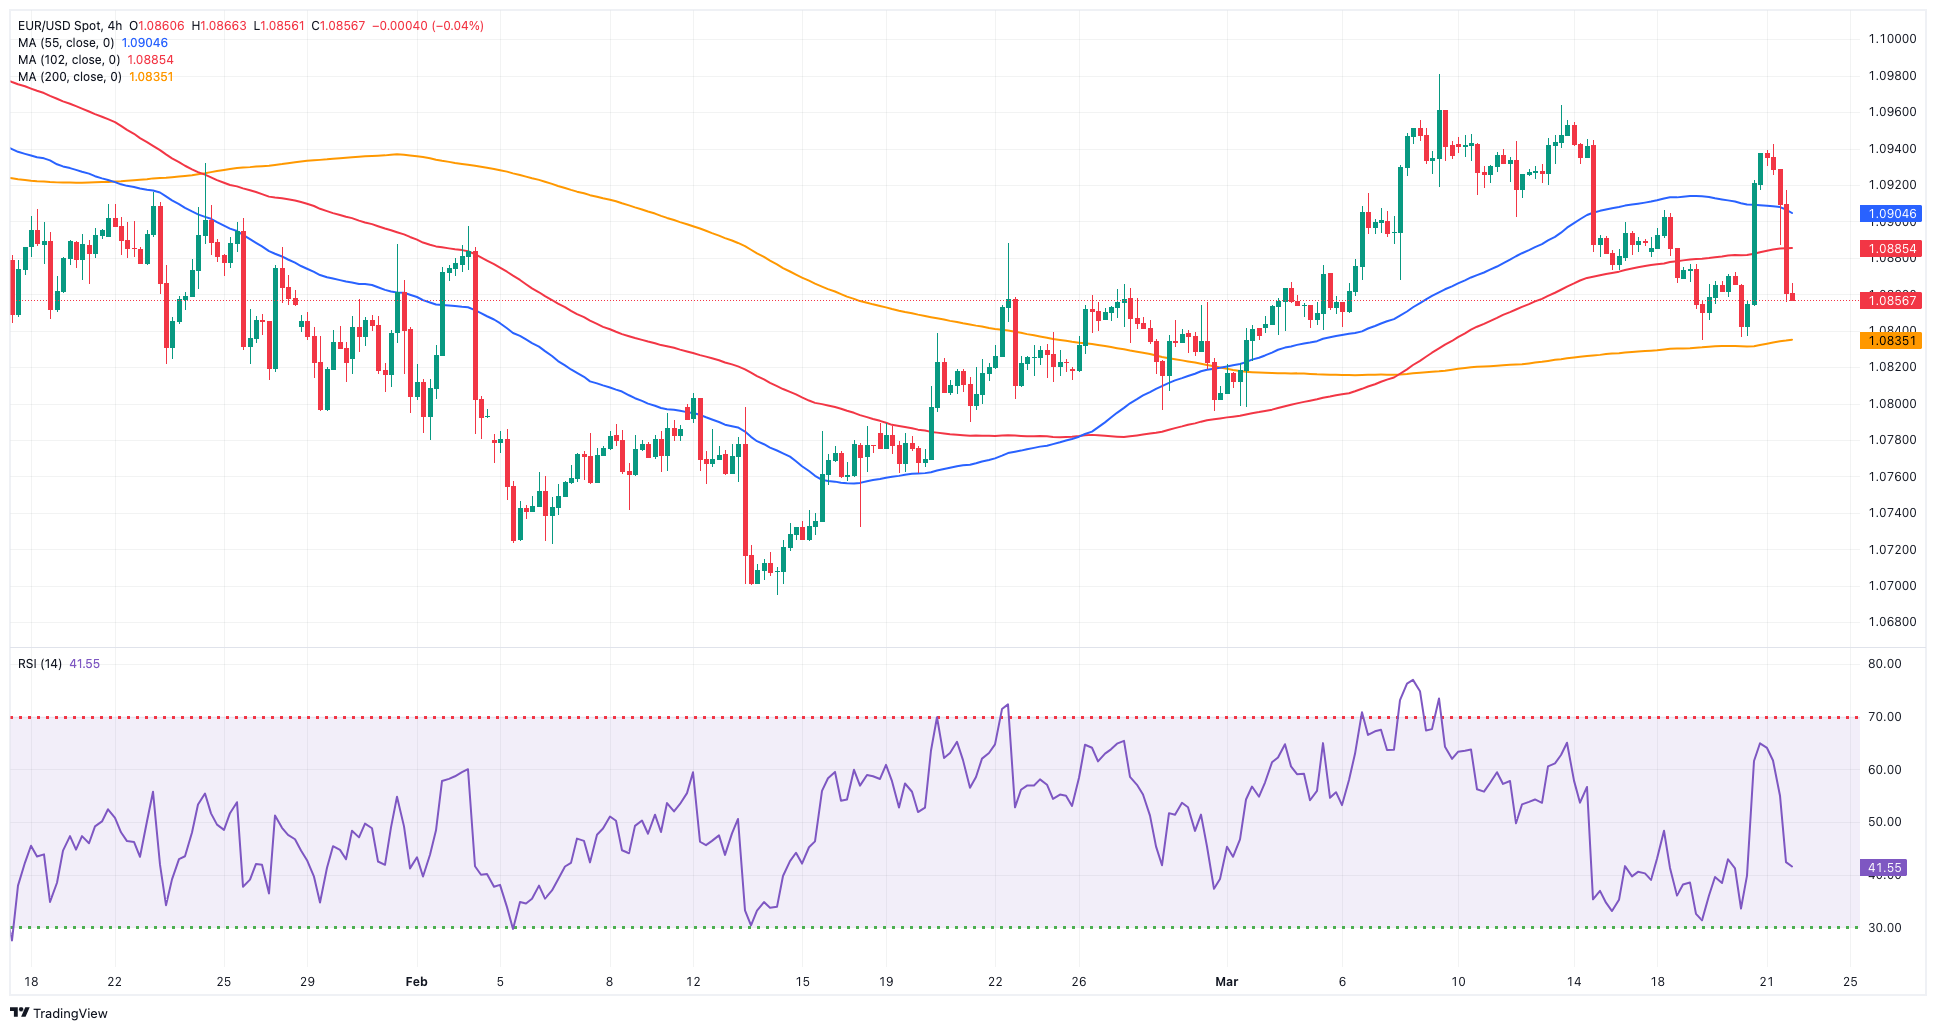
EUR/USD came under renewed downside pressure and rapidly faded the Fed-driven marked advance past 1.0900 the figure on Thursday.
It is worth recalling that the sharp sell-off in the dollar was fuelled by the dovish tone from Chair Powell at his press conference on Wednesday. He stated that it would be fitting to commence easing "at some juncture this year” and remarked that no determinations had been reached regarding the deceleration of the balance sheet runoff, yet he indicated that it would be suitable to moderate the pace "quite promptly."
In fact, the resumption of the selling pressure in the pair came in response to the decent bounce in the greenback as market participants continued to assess the latest FOMC event, while discouraging prints from flash PMIs in the euro region also kept the sentiment subdued.
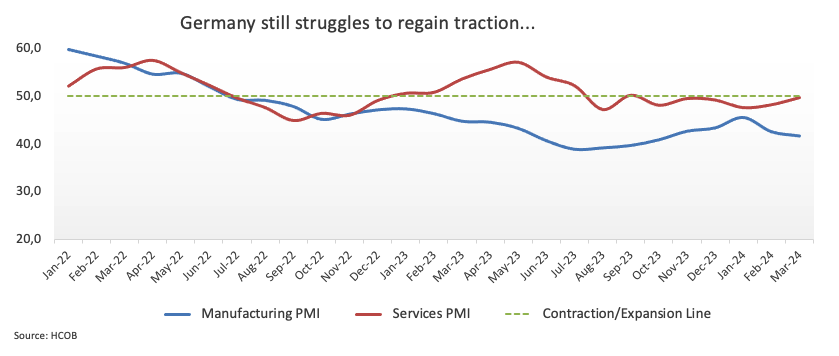
Data-wise, in the region, advanced Manufacturing and Services PMI for the month of March came in at 41.6 and 49, respectively, in Germany, and 45.7 and 51.1 in the broader euro bloc.
Across the ocean, Initial Jobless Claims increased by 210K in the week to March 16, and the Philly Fed Manufacturing Index came in at 3.2 in March. In addition, the preliminary March Manufacturing and Services PMI turned up at 52.5 and 51.7, respectively. Finally, Existing Home Sales rose by 9.5% in February, and the CB Leading Index increased by 0.1% in the same month.
If losses continue, EUR/USD may dispute the 200-day SMA at 1.0838 ahead of the weekly low of 1.0795 (February 29), which is previous to the 2024 low of 1.0694 (February 14). A further drop might reach the weekly low of 1.0495 (October 13, 2023), ahead of the 2023 bottom of 1.0448 (October 3) and the round milestone of 1.0400. Instead, the initial resistance level is the March high of 1.0981 (March 8), seconded by the weekly top of 1.0998 (January 5, 2011) and the psychological 1.1000 barrier. The breakout of this zone may open the way for a challenge to the December 2023 peak of 1.1139 (December 27), which is still supported by the 200-week SMA of 1.1148 and occurs before the 2023 high of 1.1275 (July 18). The daily RSI dropped to around 51.
Resistance levels: 1.0942 1.0963 1.0981 (4H chart)
Support levels: 1.0834 1.0795 1.0694 (4H chart)
USDJPY
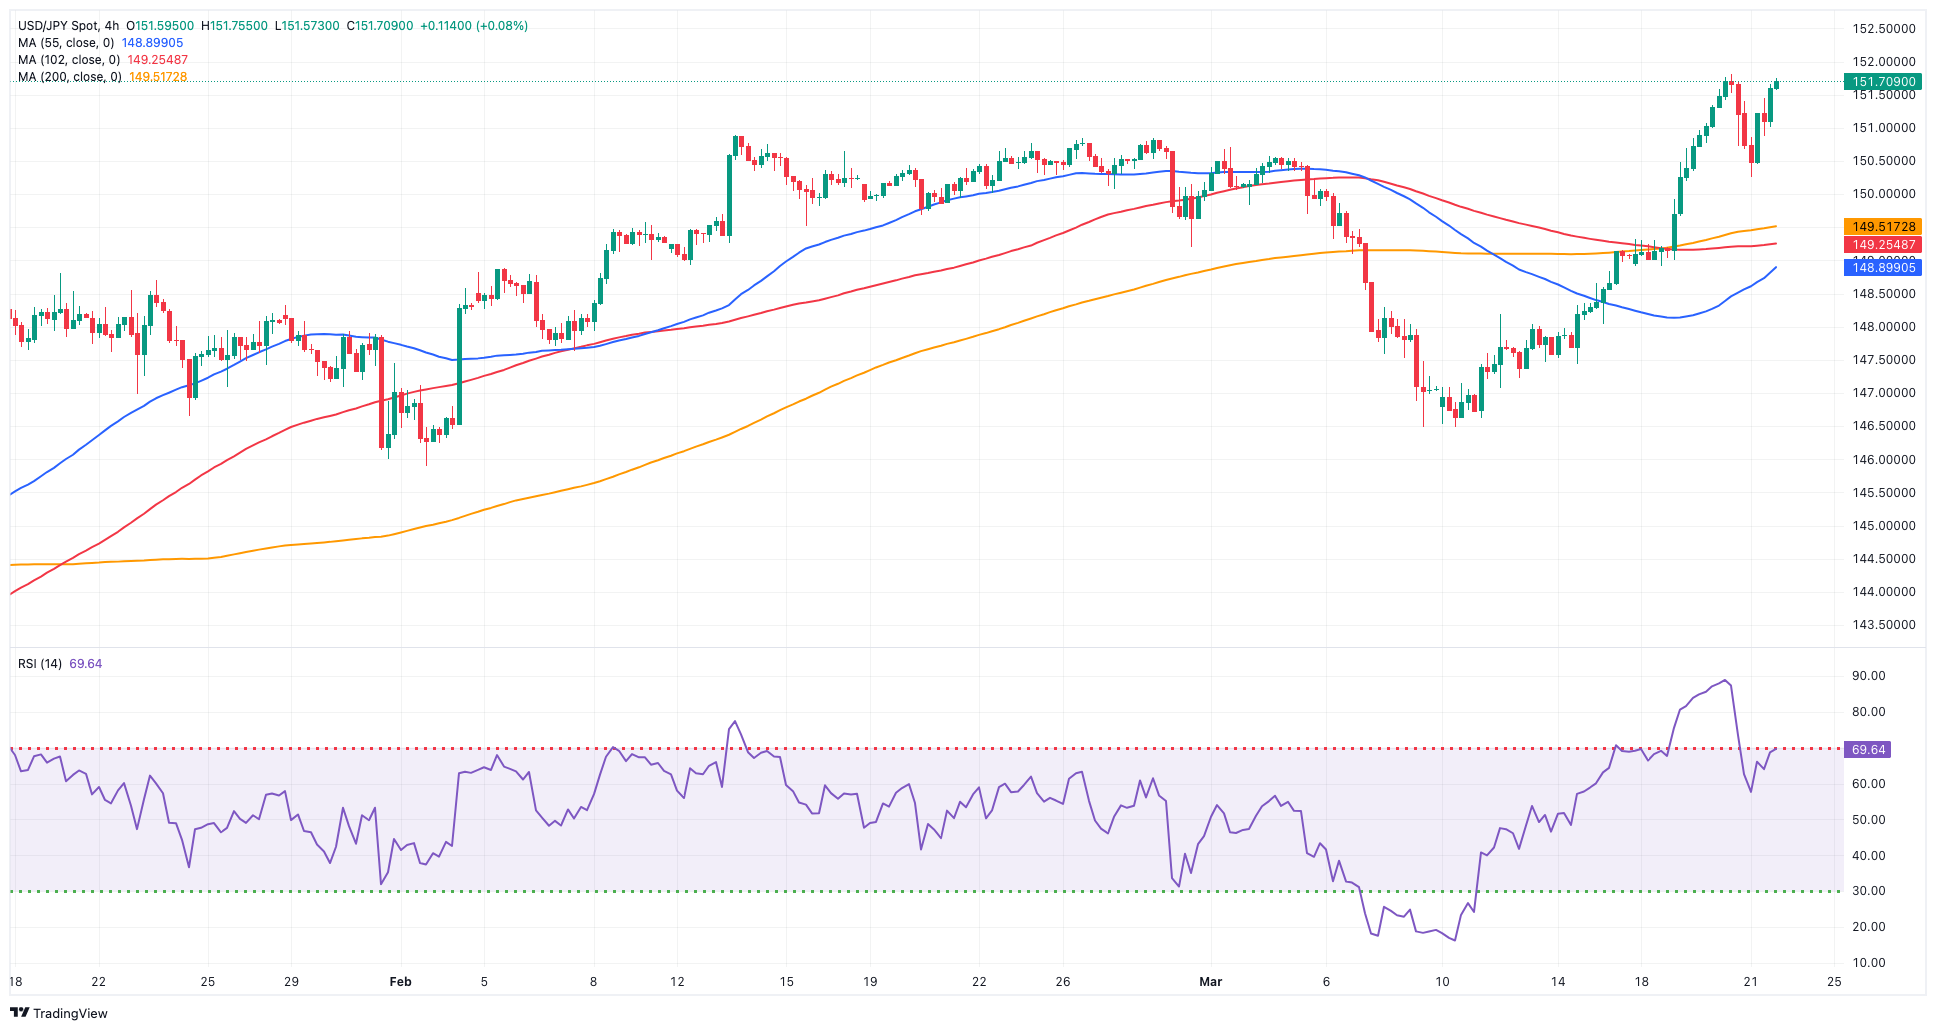
The march north in USD/JPY remained unabated so far on Thursday.
Indeed, spot clinched its eighth consecutive session of gains, maintaining its trade beyond the 151.00 mark, always on the back of persistent selling pressure hitting the Japanese yen.
In fact, the Japanese currency kept its bearish note unchanged as market participants continued to assess the latest BoJ meeting.
Still around the BoJ, reports indicated that the bank is contemplating the possibility of the next hike occurring in either July or October, with an unnamed BoJ official affirming that "additional hikes are certainly being considered". The primary reason behind the yen's depreciation following the bank’s lift-off was largely attributed to its dovish forward guidance. Consequently, it would be logical for the BoJ to endeavour to manage expectations of market tightening to help bolster the yen.
Additionally, Governor Ueda emphasized that delaying the normalization of the policy rate would necessitate "very rapid and significant rate hikes." Ueda also reiterated the commitment to maintaining accommodative financial conditions for the foreseeable future and clarified that the BoJ currently has no plans to divest its stock of JGBs.
In Japan, the Reuters Tankan Index improved to 10 in March, while the trade deficit narrowed to ¥379.4B in February.
USD/JPY is currently striving for a 2024 high of 151.81 (March 20), just ahead of the 2023 top of 151.90 (November 13). Further up, the 2022 peak of 151.94 (October 21) comes before the round figure of 152.00. Just the opposite, the initial support level is set at March's low of 146.47 (March 8), which is strengthened by the vicinity of the crucial 200-day SMA (146.58). The breach of this zone may result in a return to the February low of 145.89 (February 1), prior to the December 2023 low of 140.24 (December 28), the round number 140.00 and the July low of 137.23 (July 14). The everyday RSI increased to the boundaries of 67.
Resistance levels: 151.81 151.90 151.94 (4H chart)
Support levels: 150.26 149.50 148.91 (4H chart)
GBPUSD
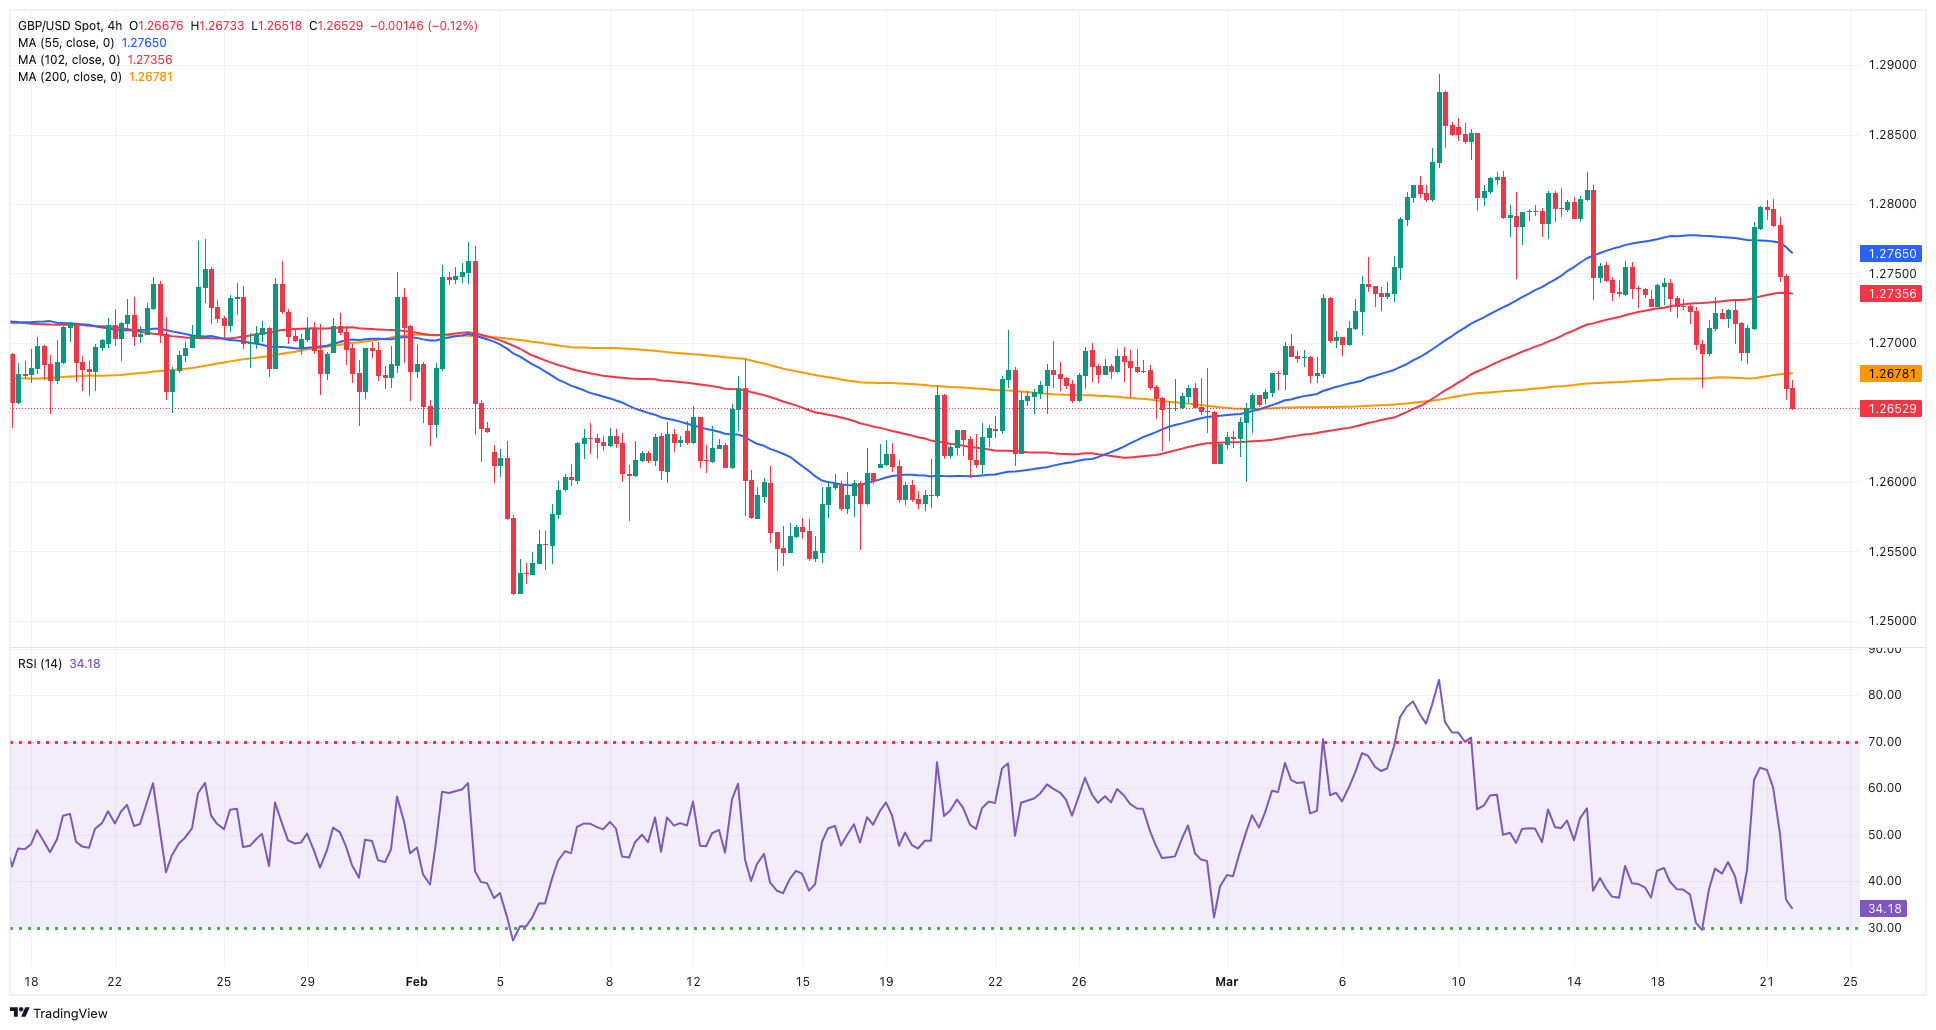
GBP/USD came under renewed downside pressure just after revisiting the 1.2800 region, shedding more than a cent and breaking below the 1.2700 support on the back of mixed data, the BoE event, and the stronger dollar.
Indeed, the dollar resumed its uptrend and set aside Wednesday’s hiccup in response to the dovish message from Chair Powell, while discouraging prints from the advanced UK Services PMI also added to the sour mood around the quid.
Back to the BoE, the central bank kept its policy rate unchanged at 5.25% as widely anticipated, while Governor A. Bailey contended that while the bank hasn’t reached the juncture where interest rate cuts are feasible, there is progress being made in the right direction.
In the wake of the BoE gathering, 10-year gilt yields retreated below 4.0%, while markets started pencilling in 75 bps of rate cuts this year.
Across the Channel, the preliminary Manufacturing and Services PMIs came in at 49.9 and 53.4 for the current month, while Public Sector Net Borrowing shrank to £7.477B in February.
The weekly low of 1.2667 (March 19) comes before the preliminary 100-day SMA at 1.2625, which is followed by the March low of 1.2599 (March 1) and the critical 200-day SMA at 1.2592. The breakdown of this zone may put the 2024 low of 1.2518 (February 5) back on the radar, before the December 2023 low of 1.2500 (December 13). A deeper retracement should not find major support until the weekly low of 1.2187 (November 10, 2023), followed by the October 2023 low of 1.2037 and the main 1.2000 barrier. In the opposite direction, the next upward block is the 2024 high of 1.2893 (March 8), ahead of the weekly top of 1.2995 (July 27, 2023), all before the critical 1.3000 yardstick. The day-to-day RSI dropped below 46.
Resistance levels: 1.2803 1.2823 1.2893 (4H chart)
Support levels: 1.2667 1.2599 1.2579 (4H chart)
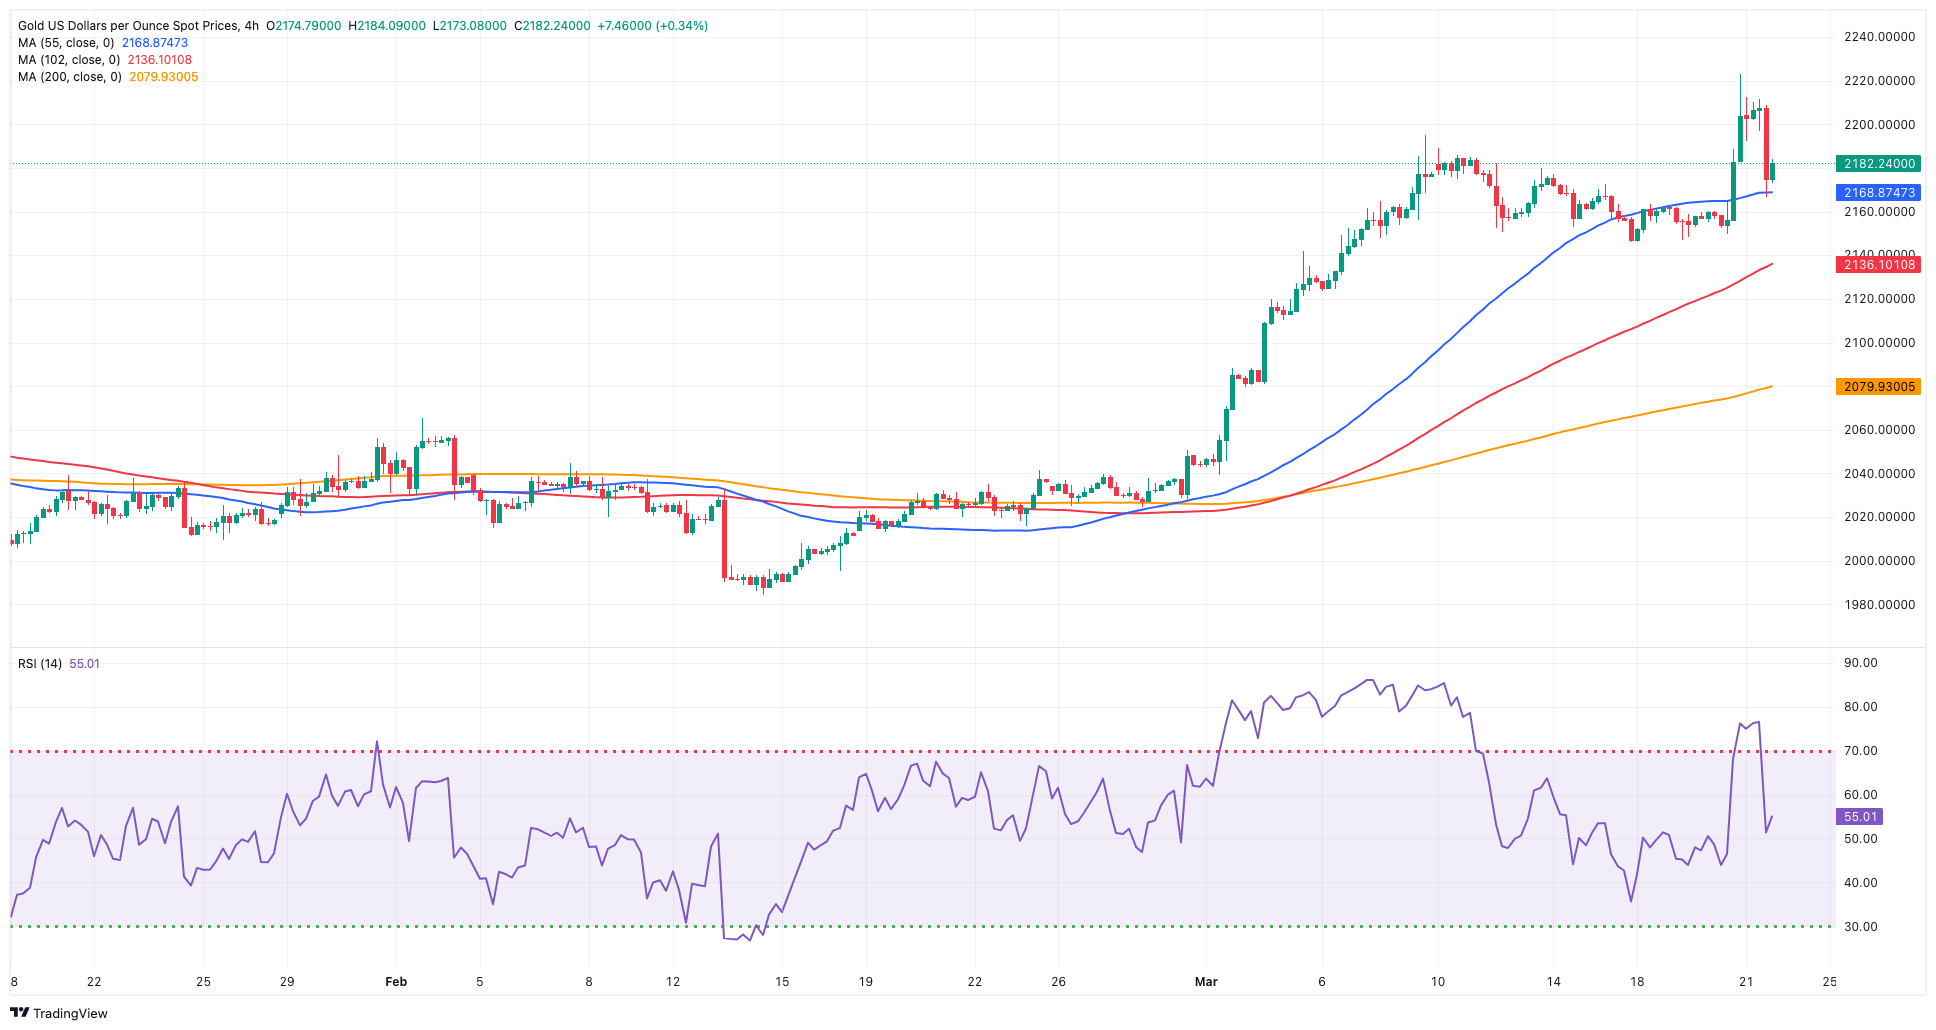
GOLD
Despite hitting an all-time peak around the $2,200 mark per troy ounce late on Wednesday, the yellow metal came under some renewed downside pressure on Thursday.
In fact, the robust pick-up in demand for the greenback in combination with a modest uptick in US yields on the short end and the belly of the curve seemed to have weighed on traders’ sentiment, pushing prices lower.
Moving forward, the dynamics around the Federal Reserve and the timing of the start of its easing cycle should dictate the price action around bullion in the next few months.
Gold surged to an all-time high of $2,222 (March 20). The 55-day and 100-day SMAs of $2,062 and $2,039, respectively, should provide interim contention, followed by the 2024 low of $1,984 (February 14) and the crucial 200-day SMA of $1,982. Once the latter is cleared, a potential visit to the December 2023 low of $1,973 could start shaping up ahead of the November 2023 low of $1,931. The breakdown of this region may cause the yellow metal to test its October 2023 low of $1,810, prior to the 2023 low of $1,804 and the critical $1,800 conflict zone.
Resistance levels: $2,222 (4H chart)
Support levels: $2,146 $2,139 $2,080 (4H chart)
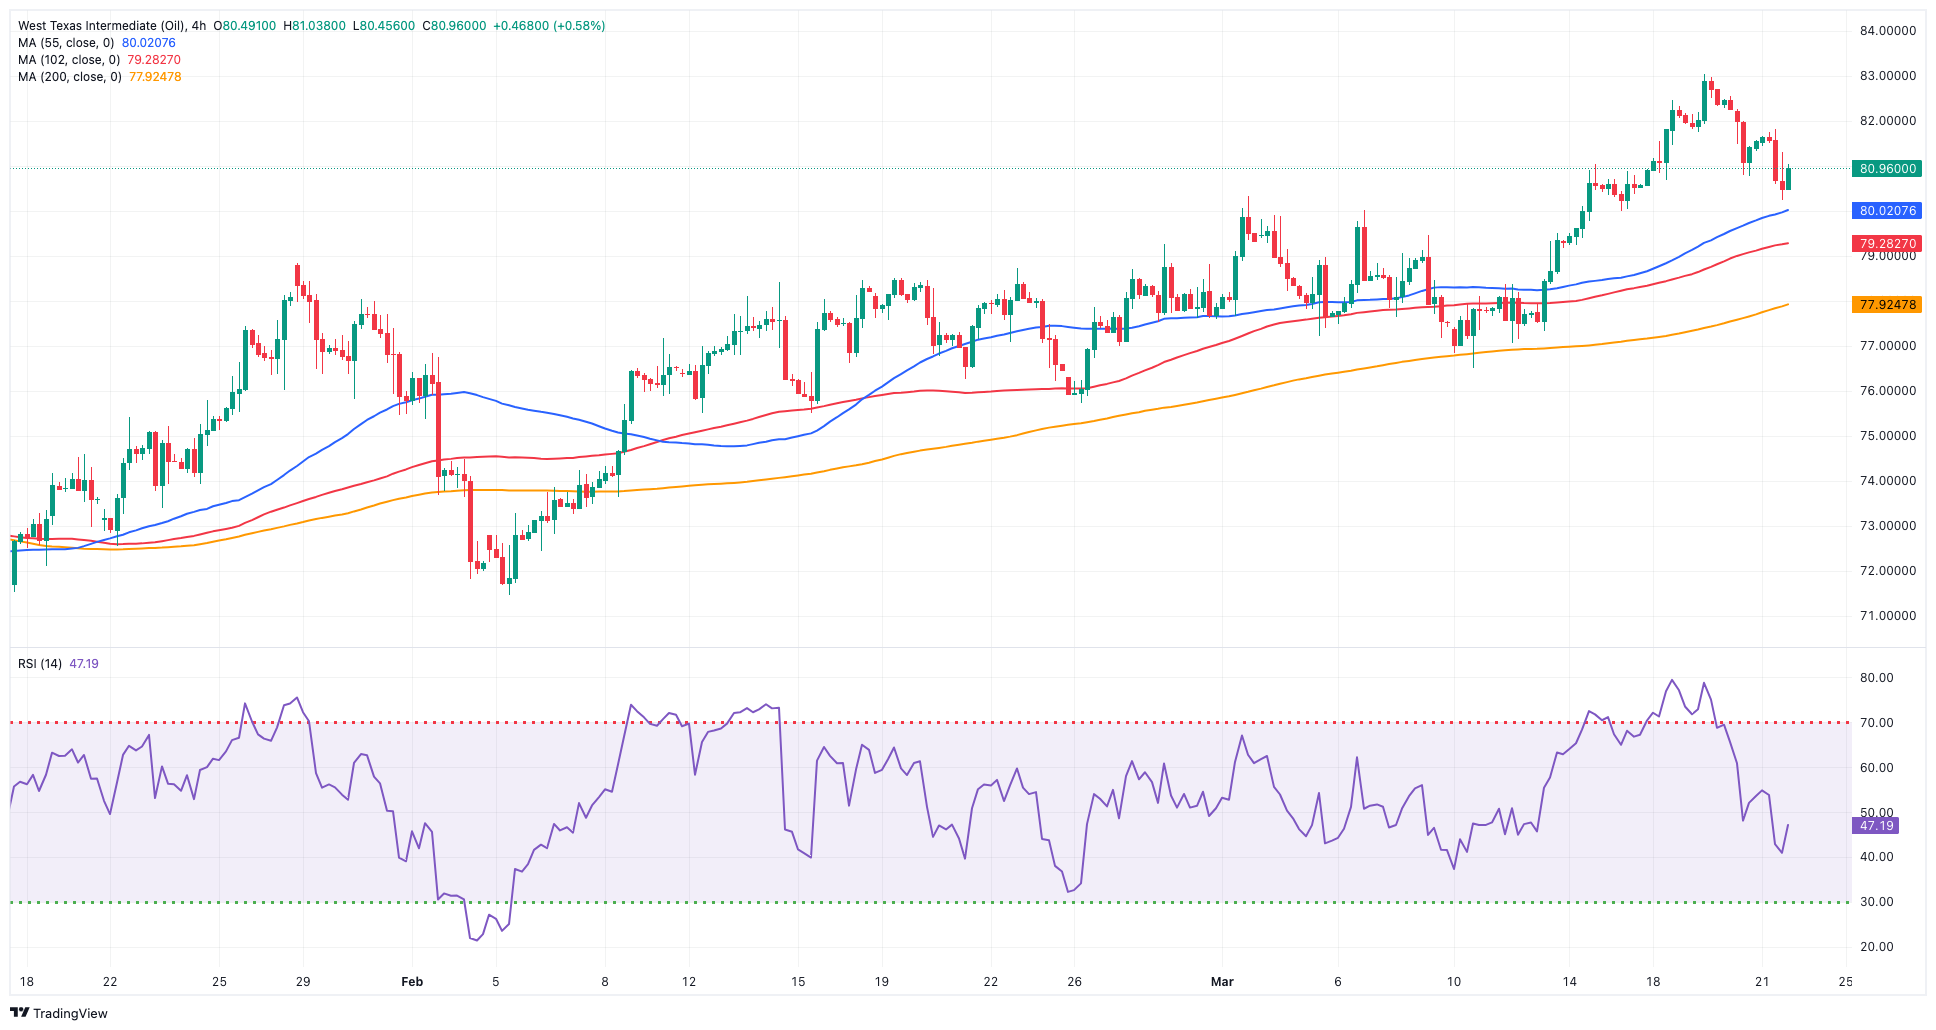
CRUDE WTI
WTI prices retreated for the second session in a row on Thursday, further extending the rejection from recent 2024 tops just past the $83.00 mark per barrel (March 19).
Further losses in crude oil prices came in response to the confirmation that the US has introduced a UN resolution advocating for a ceasefire in the Israel-Hamas conflict, which would facilitate the release of 40 Israeli hostages in exchange for the liberation of numerous Palestinians who are currently held in Israeli prisons.
In addition, despite gasoline inventories declining for a seventh consecutive week according to the latest EIA’s report (-3.310M barrels), gasoline product supply—a proxy for demand—dipped below 9M barrels, indicating that gasoline markets, which had supported a recent rally in prices, may have been overextended.
On the bright side for prices, however, emerged the assaults by Ukraine on Russian refineries, which further incentivized investors to engage in crude oil trading at elevated prices, considering the possibility that these attacks might impact global petroleum reserves. Extended interruptions could compel Russian producers to curtail supply in case they encounter obstacles in exporting crude oil and face limitations in storage capacity.
The next upward test for WTI is the 2024 peak of $83.09 (March 19), which comes before the weekly high of $89.83 (October 18, 2023) and the 2023 top of $94.99 (September 28, 2023). Further north, the weekly peak of $97.65 (August 30) precedes the psychological $100.00 barrier. On the other hand, the 200-day SMA provides first support around $78.49, prior to the February low of $71.43 (February 5). Extra losses underscore the significant $70.00 milestone ahead of the 2024 low of $69.31 (January 3).
Resistance levels: $83.09 $83.56 $85.85 (4H chart)
Support levels: $80.33 $76.76 $75.81 (4H chart)
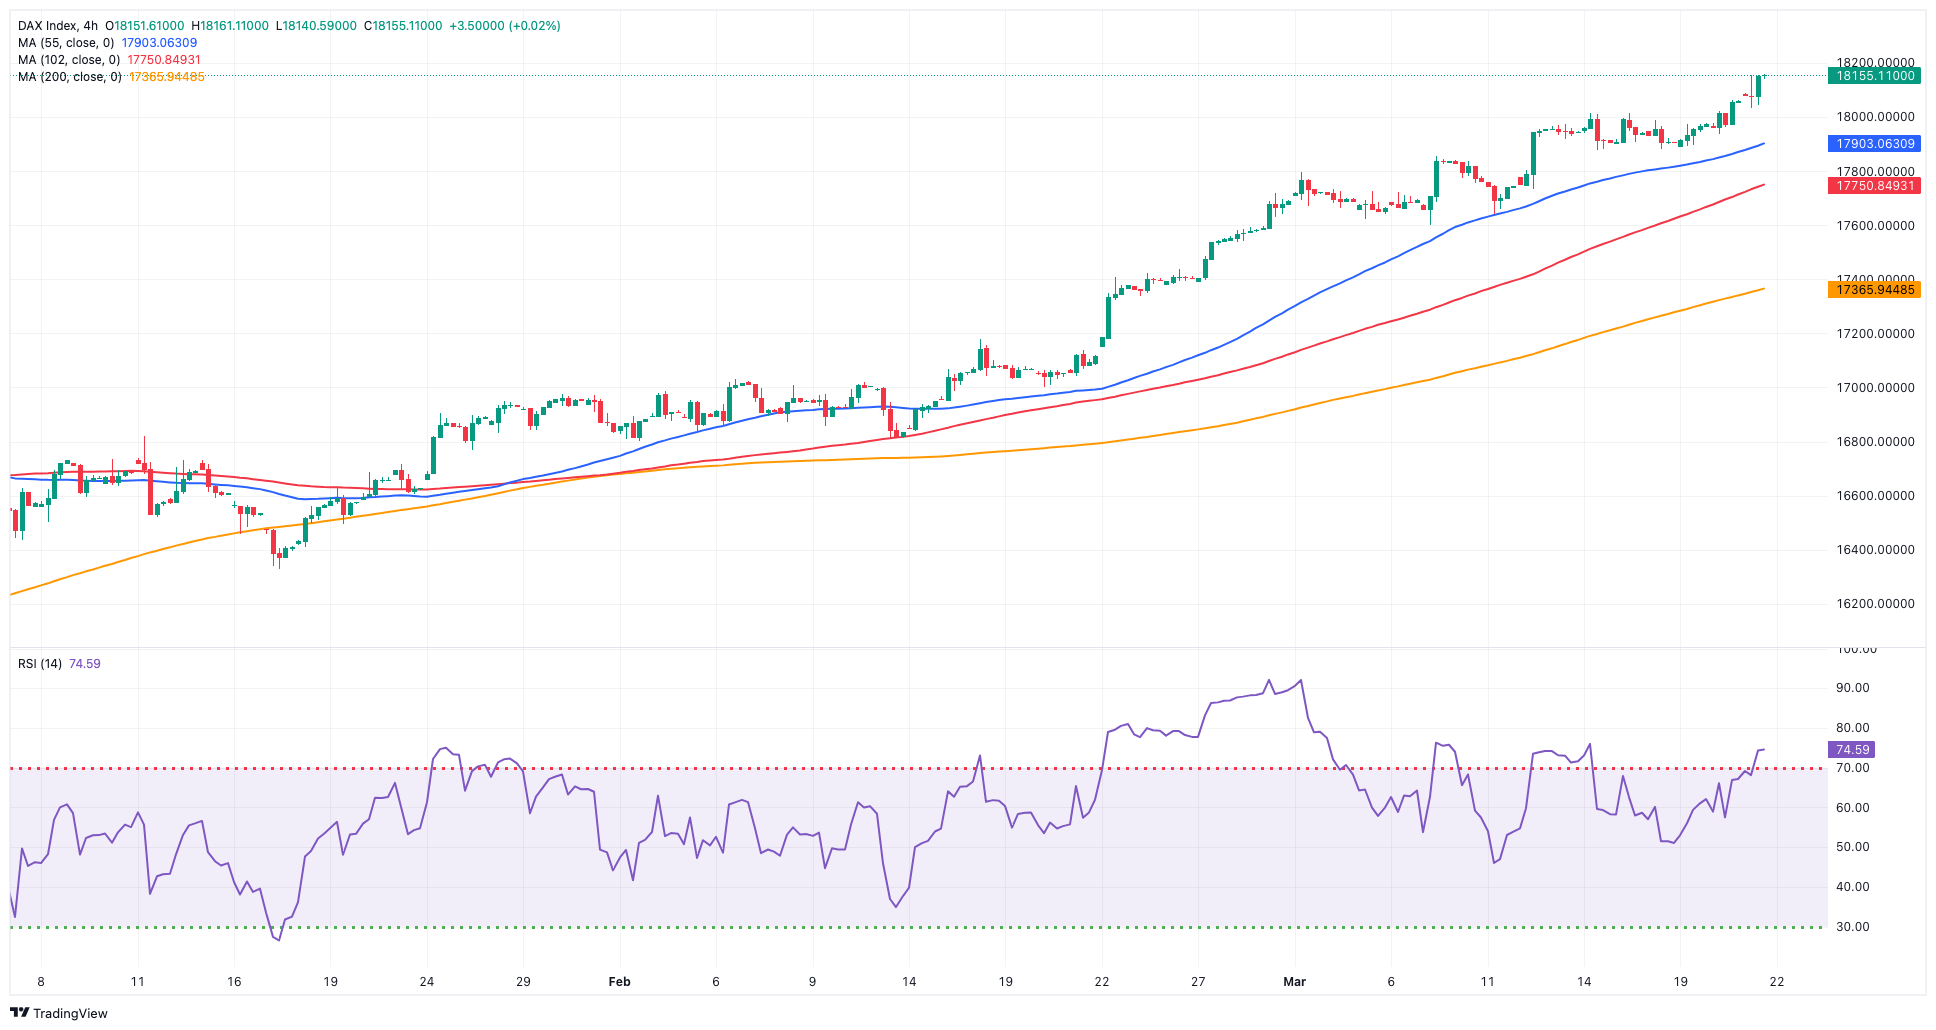
GER40
German equities advanced further and lifted the benchmark DAX40 to an all-time high near the 18,200 zone on Thursday.
Extra gains in the index came amidst the generalized optimism in global markets after the Fed kept rates unchanged and opened the door to three rate cuts this year at its event on Wednesday.
In addition, the BoE maintained its policy rate intact as expected on Thursday, signalling the likelihood of interest rate cuts in the medium term.
Also contributing to the upbeat mood were mixed prints from the advanced PMIs in the region, where the Services sector remained on a firm note when compared with the Manufacturing activity.
In the meantime, the 10-year bund yields remained on the defensive and near 2.40%.
The DAX40's next level of resistance is its record high of 18,179 (March 21). Having said that, the 55-day SMA around 17,193 might supply some minor support till the February low of 16,821 (February 1). A drop below this level might push the index below the 2024 low of 16,345 (January 17), which is ahead of the critical 200-day SMA at 16,213. Once the latter is passed, a challenge to the weekly low of 15,915 (November 28) may appear, followed by the October low of 14,630 (October 23) and the 2023 bottom of 14,458 (March 20). The daily RSI crept up above 81, indicating that the market remained severely overbought.
Best Performers: Siemens Energy AG, Heidelbergcement, SAP
Worst Performers: MTU Aero, Continental AG, Hannover Rueck SE
Resistance levels: 18,178 (4H chart)
Support levels: 17,823 17,619 17,487 (4H chart)
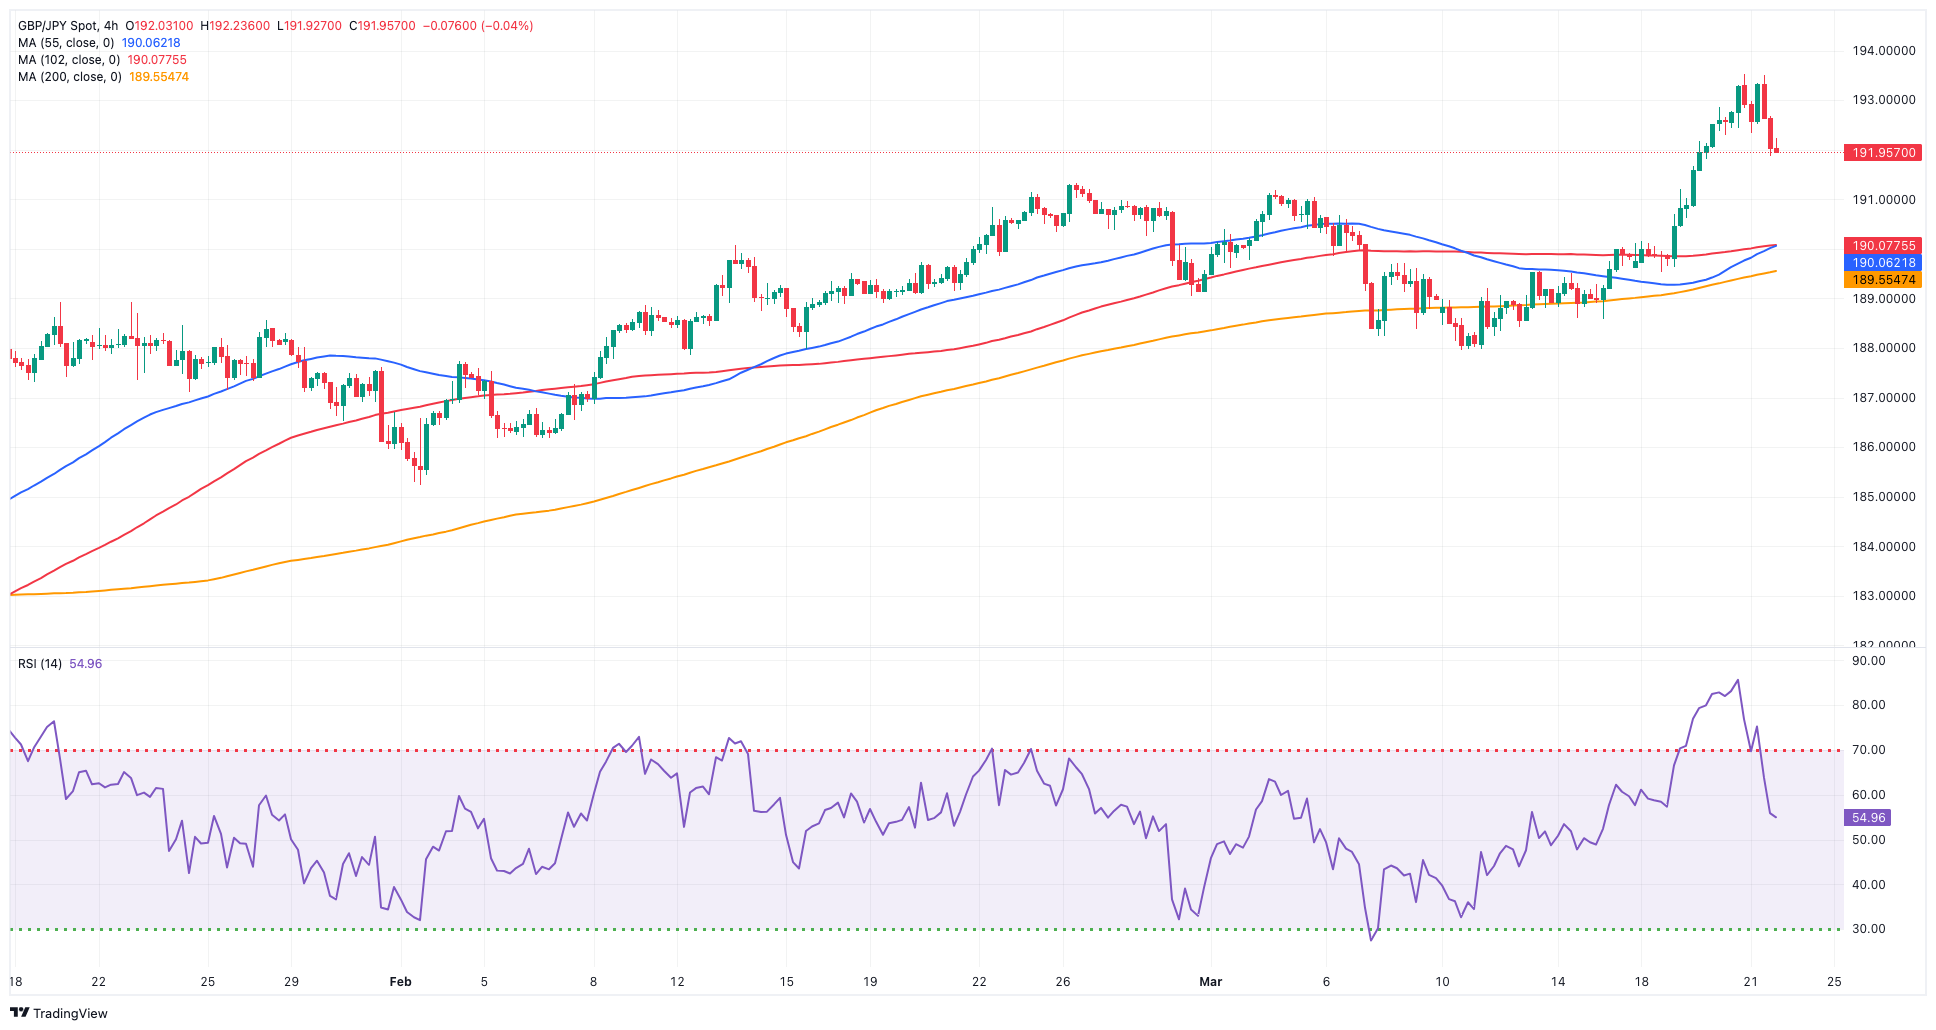
GBPJPY
The intense sell-off in the British pound offset any extra depreciation of the Japanese yen and sparked a corrective knee-jerk in GBP/JPY back to the sub-192.00 region on Thursday.
Indeed, while investors further assessed the latest BoJ event, the context of a strong dollar weighed on the quid along with the dovish hold from the BoE at its meeting on Thursday.
In the meantime, the cross retreated for the first time after seven straight sessions of gains, including a yearly high around 193.50 recorded on March 20.
The 2024 high of 193.53 (March 20) comes before the August 2015 top of 195.28 (August 18) and the record peak of 195.88 (June 24, 2015). On the flip side, there is transitory support at the 55-day SMA at 188.48, which precedes the March low of 187.96 (March 11), and the 100-day SMA at 186.51. A breach of the latter might result in a test of the February low of 185.22 (February 1), ahead of the more critical 200-day SMA at 184.57. A deeper regression might return to the December 2023 low of 178.33 (December 14), which anticipates the October 2023 low of 178.03 and the July 2023 low of 176.30. The daily RSI dropped to the vicinity of 62.
Resistance levels: 193.53 195.28 195.88 (4H chart)
Support levels: 189.53 187.96 186.44 (4H chart)
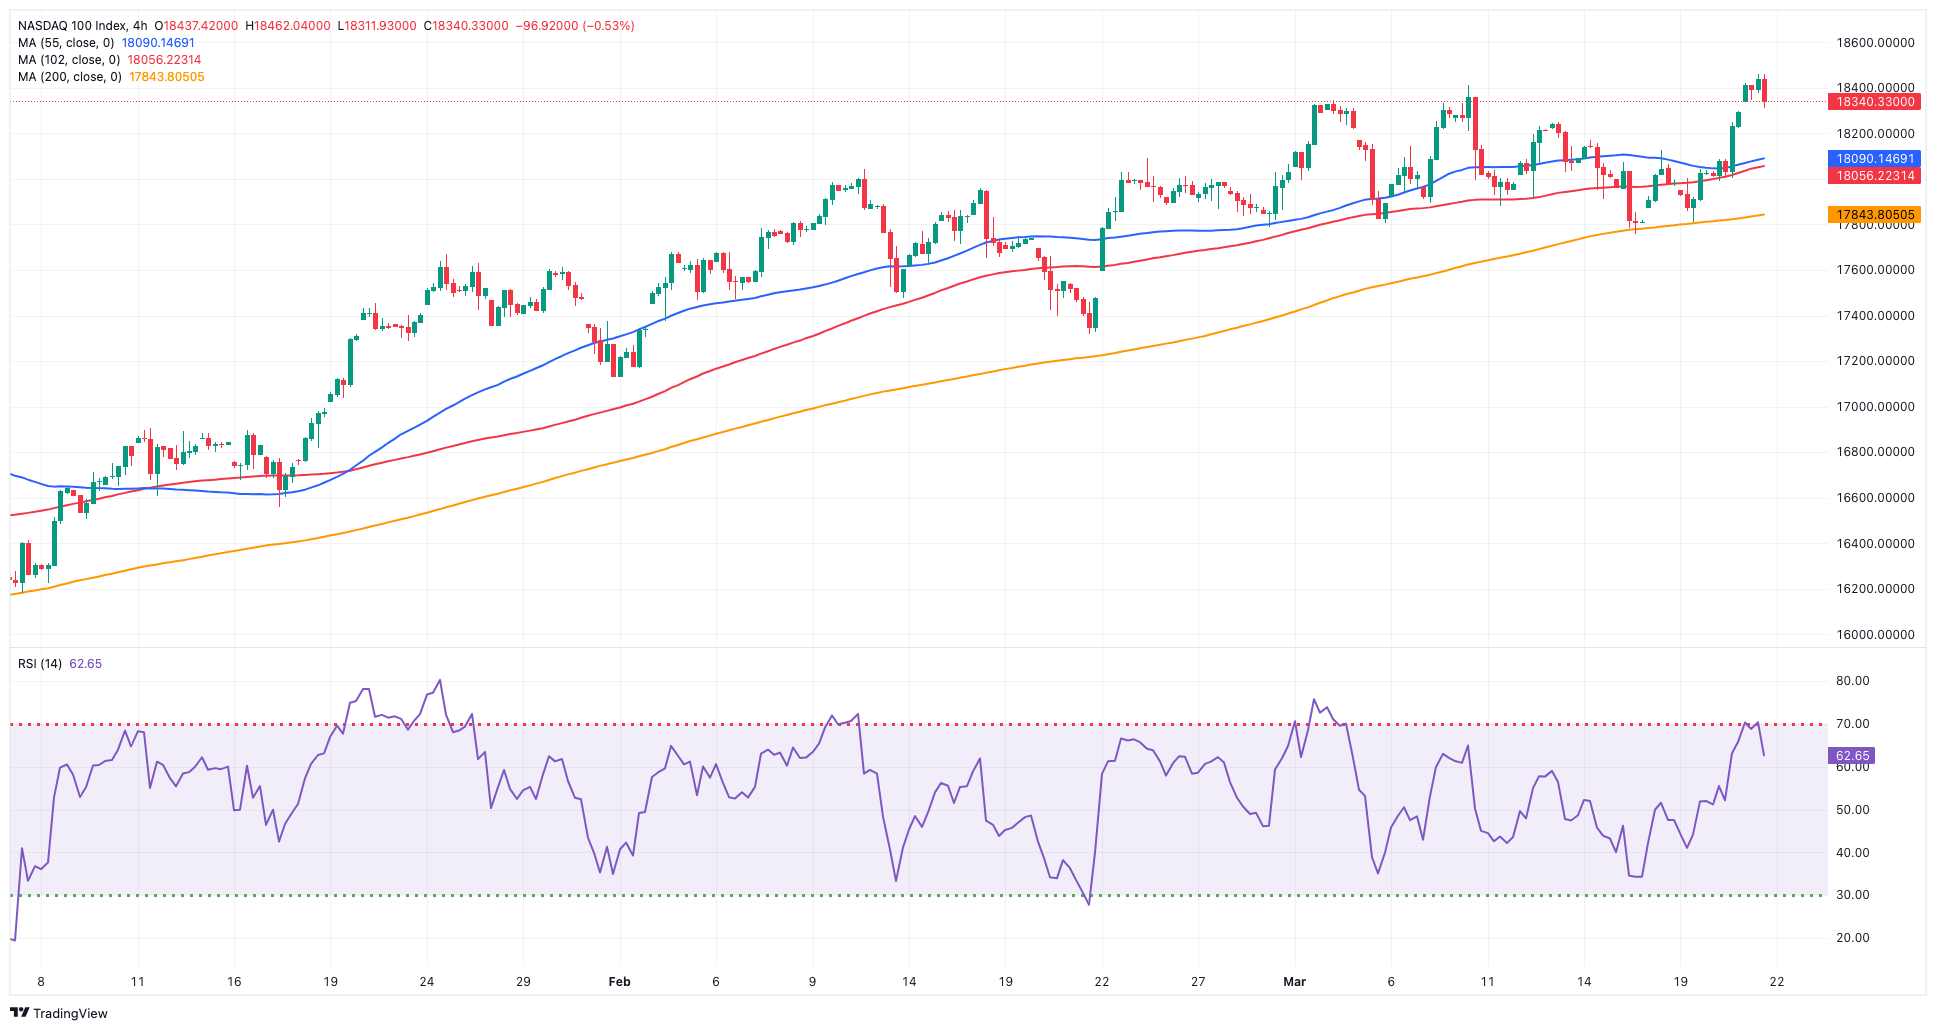
NASDAQ
The key tech index Nasdaq 100 rose for the fourth session in a row on Thursday, this time advancing to an all-time high near the 18,500 zone.
In line with the rest of its US peers, the tech benchmark index traded amidst rising optimism as investors continued to assess the prospects of three interest rate cuts by the Fed this year, as per the latest FOMC event.
In addition, the uptick in the index was bolstered by chip stocks surging after Micron Technology provided an optimistic forecast.
Also on the positives for the Nasdaq 100 appeared the mixed tone in US yields across the curve.
Further advances might push the Nasdaq 100 above its all-time high of 18,416 (March 8). In the opposite direction, the index is predicted to find temporary support at the 55-day SMA of 17,543, before falling to weekly lows of 17,319 (February 21) and 17,128 (January 31). Once the latter is crossed, the index may move towards the 2024 low of 16,249 (January 5), which is ahead of the crucial 200-day SMA of 15,936 and the December 2023 low of 15,695 (December 4). Additional losses from here may test the October 2023 bottom of 14,058 (October 26), which precedes the April 2023 low of 12,724 (April 25) and the March 2023 low of 11,695 (March 13). Down from here comes the 2023 low of 10,696 (January).
Top Gainers: Micron, Broadcom, Take-Two
Top Losers: PDD Holdings DRC, Apple, Cognizant A
Resistance levels: 18,464 (4H chart)
Support levels: 17,764 17,319 17,128 (4H chart)
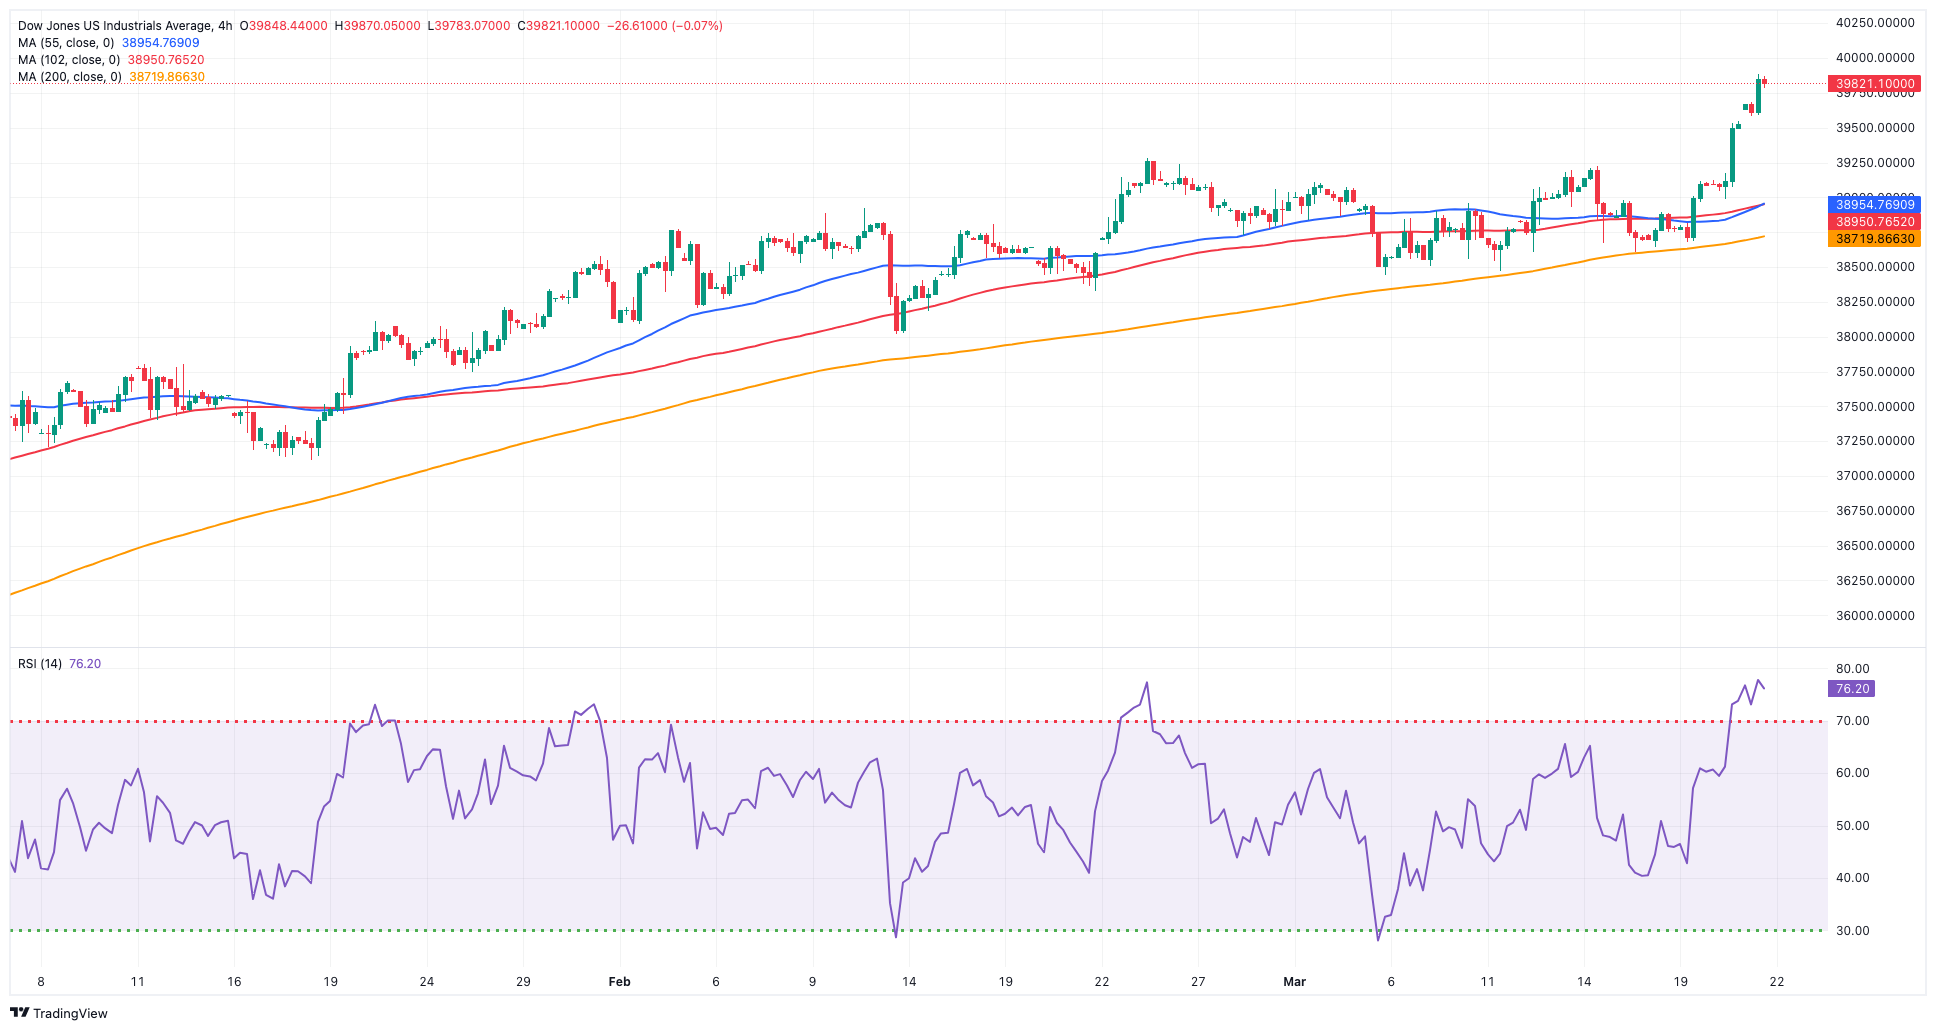
DOW JONES
There was no respite to the upside momentum in US equities on Thursday.
That said, the Dow Jones clinched a record high in levels just shy of the key 40,000 mark, fuelled by the increasing optimism post-FOMC gathering, as investors now see the central bank reducing its rates three times this year.
Adding to the upbeat sentiment, the labour market remained healthy, as per diminishing weekly Initial Jobless Claims, while the manufacturing gauge tracked by the Philly Fed surpassed estimates in March and Existing Home Sales expanded by nearly 10% in February from a month earlier.
Overall, the Dow Jones gained 0.78% to 39,822, the S&P 500 advanced 0.44% to 5,247, and the tech-focused Nasdaq Composite rose by 0.23% to 16,405.
Further gains might boost the Dow Jones to a record high of 39,889 (March 21). Conversely, the 55-day SMA of 38,441 serves as temporary support, followed by the 2024 low of 37,122 (January 18) and the weekly low of 37,073 (December 20, 2023). If the index falls below this level, it may hit the preliminary 100-day SMA at 37,181 before reaching the 200-day SMA at 35,742. The weekly low of 33,859 (November 7, 2023) comes next, followed by the October 2023 low of 32,327 (October 27) and the 2023 bottom of 31,429 (March 15). The daily RSI soared past 70, entering the overbought region.
Top Performers: Goldman Sachs, Home Depot, Caterpillar
Worst Performers: Apple, Dow, IBM
Resistance levels: 39,889 (4H chart)
Support levels: 38,875 38,457 38,039 (4H chart)
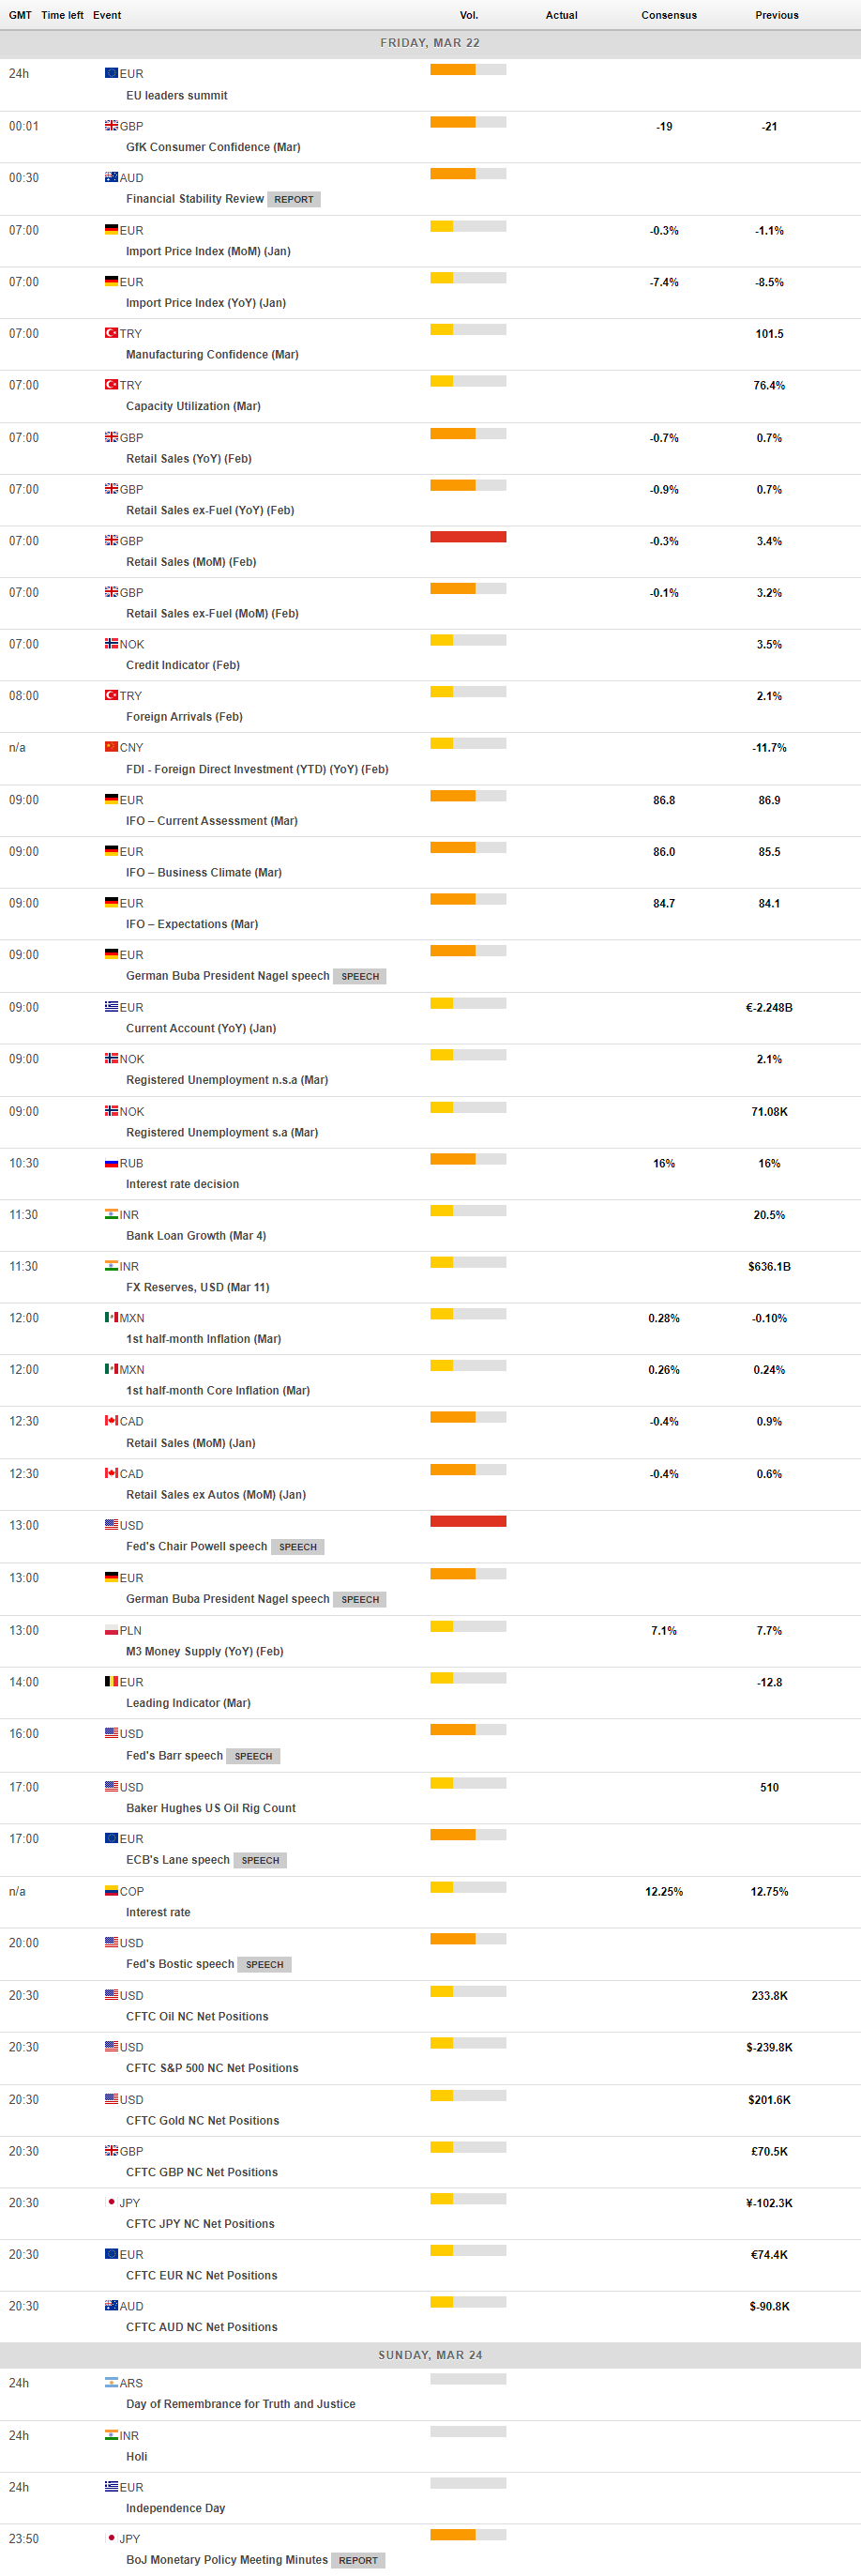
MACROECONOMIC EVENTS
All Information & Updates provided by:

All information relating to the financial markets available on this page has been prepared and issued by FXStreet (Forexstreet SL, Spain, Reg: B62498233) on the basis of publicly available information and all information believed to be reliable and does not conflict with Kuwaiti local laws, and all necessary care has been taken to before the company to ensure that the facts mentioned are correct from the source.
NCM Investment nor any of its directors or employees shall in any way be held responsible for the contents of this news, and the information contained on this page is intended only to provide clients with publicly available information and should not be construed as investment advice, report or analysis and/or constitute an offer or invitation to buy or sell financial instruments of any kind.
RISK WARNING: Forex and CFDs are highly risky leveraged products, as losses can exceed deposits. Please ensure you understand all the risks and take independent advice if necessary. NCM will segregate the clients based on the criteria of the regulator and its bylaws. NCM does not provide any advisory service; the material published does not constitute advice or a recommendation for a transaction in any financial instrument. NCM accepts no responsibility for any use of the content presented and any consequences of that use. Anyone acting on the information provided does so at their own risk.