
- Contact Us:
-

-

-

-


Daily Market Updates
25 Mar 2024
EURUSD
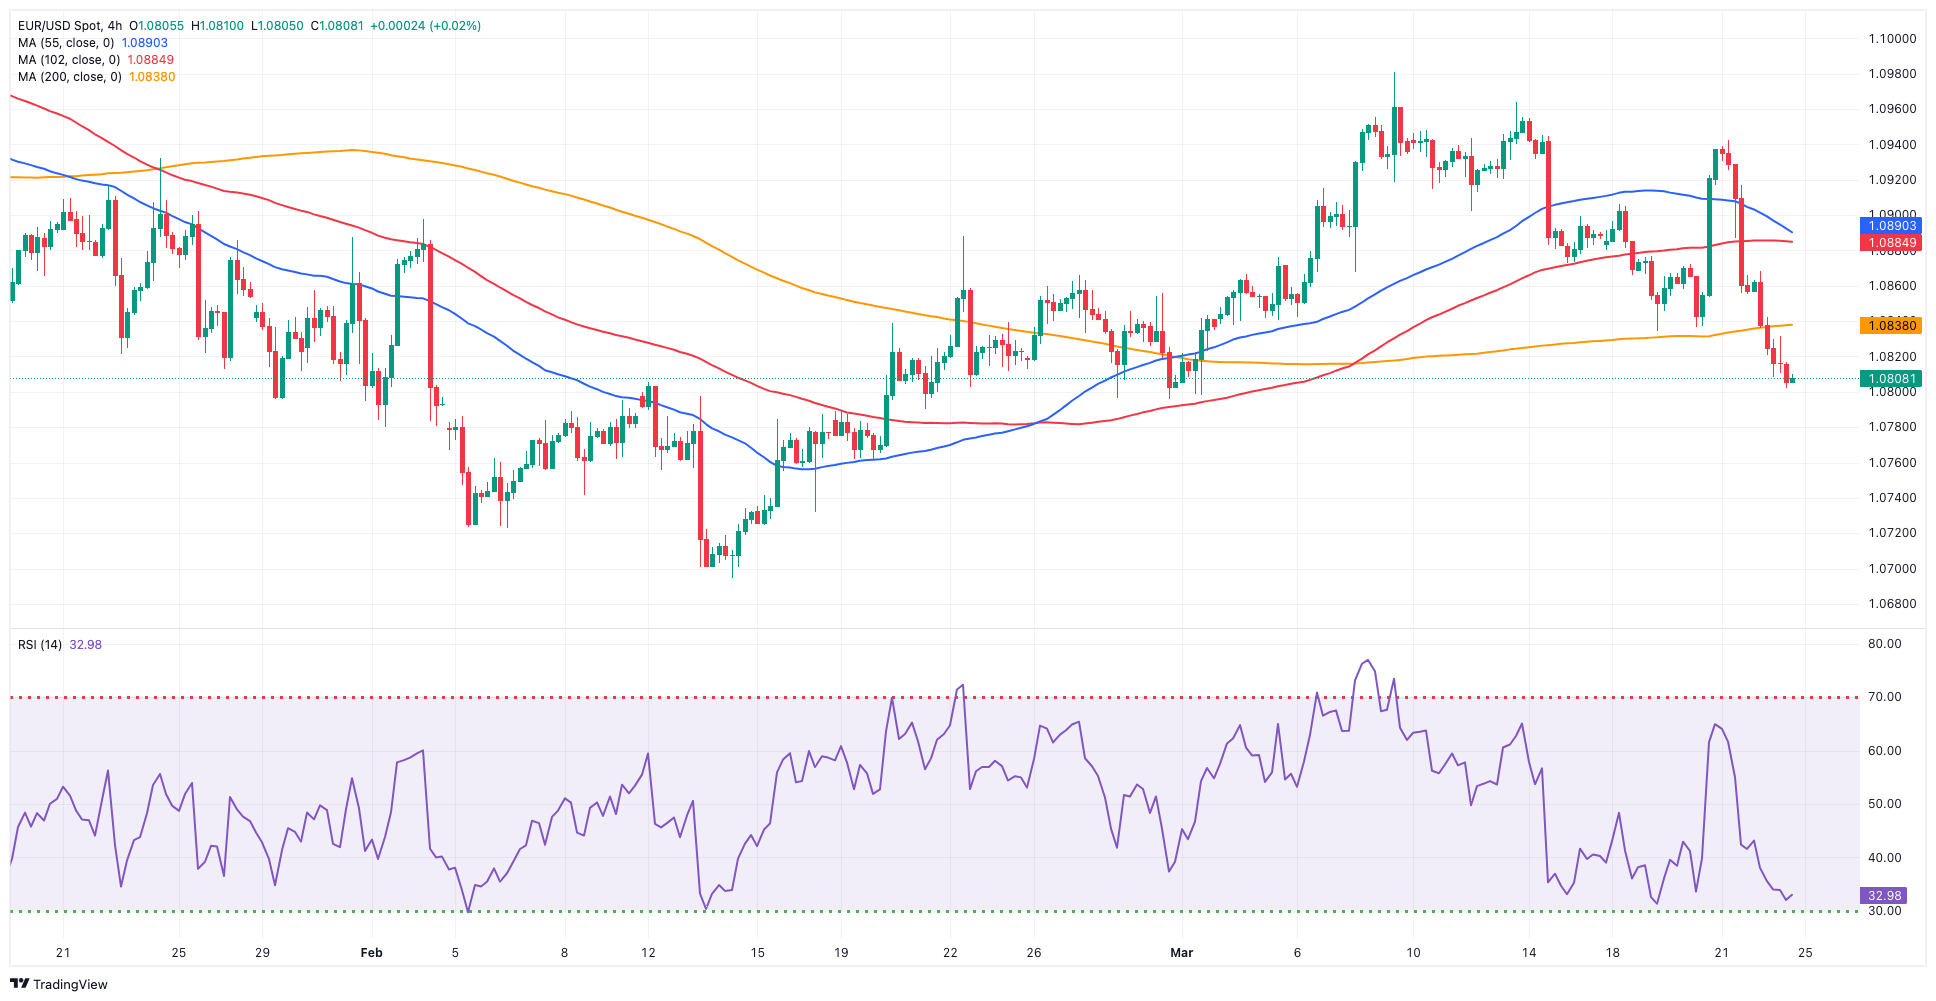
Another solid session saw the greenback intensify its strong bid bias and lift the USD Index (DXY) to new five-week highs near 104.50 on Friday. The dollar’s optimism in the second half of the week came despite further weakness in US yields across various maturity periods while investors kept assessing the latest FOMC gathering.
By the same token, EUR/USD came all the way down and put the 1.00800 support to the test, clinching three-week lows and breaking below the critical 200-day SMA at 1.0838.
Back to monetary policy, market participants continued to favour a rate cut by the Fed in June and two extra cuts later in the year, while the ECB and the BoE are seen starting their easing cycles at some point in the summer.
Still around the ECB, its President Lagarde reiterated that inflation is expected to extend its downtrend, while board member Nagel also advocated for a June cut, Holzmann argued that the central bank might not cut rates at all this year, and Centeno stressed that the inflationary process is flirting with its end.
In the euro docket, the Business Climate in Germany improved to 87.8 in March, according to the IFO institute.
If losses continue, EUR/USD may test the March low of 1.0797 (March 1) ahead of the 2024 low of 1.0694 (February 14). A deeper retracement might expose the weekly low of 1.0495 (October 13, 2023), prior to the 2023 low of 1.0448 (October 3) and the round milestone of 1.0400. Instead, the first resistance level is the March high of 1.0981 (March 8), followed by the weekly top of 1.0998 (January 5, 2011) and the psychological 1.1000 barrier. The breakout of this zone may lead to a challenge to the December 2023 peak of 1.1139 (December 27), which is still supported by the 200-week SMA of 1.1148 and comes before the 2023 high of 1.1275 (July 18). The daily RSI collapsed below 42.
Resistance levels: 1.0942 1.0963 1.0981 (4H chart)
Support levels: 1.0801 1.0795 1.0694 (4H chart)
USDJPY
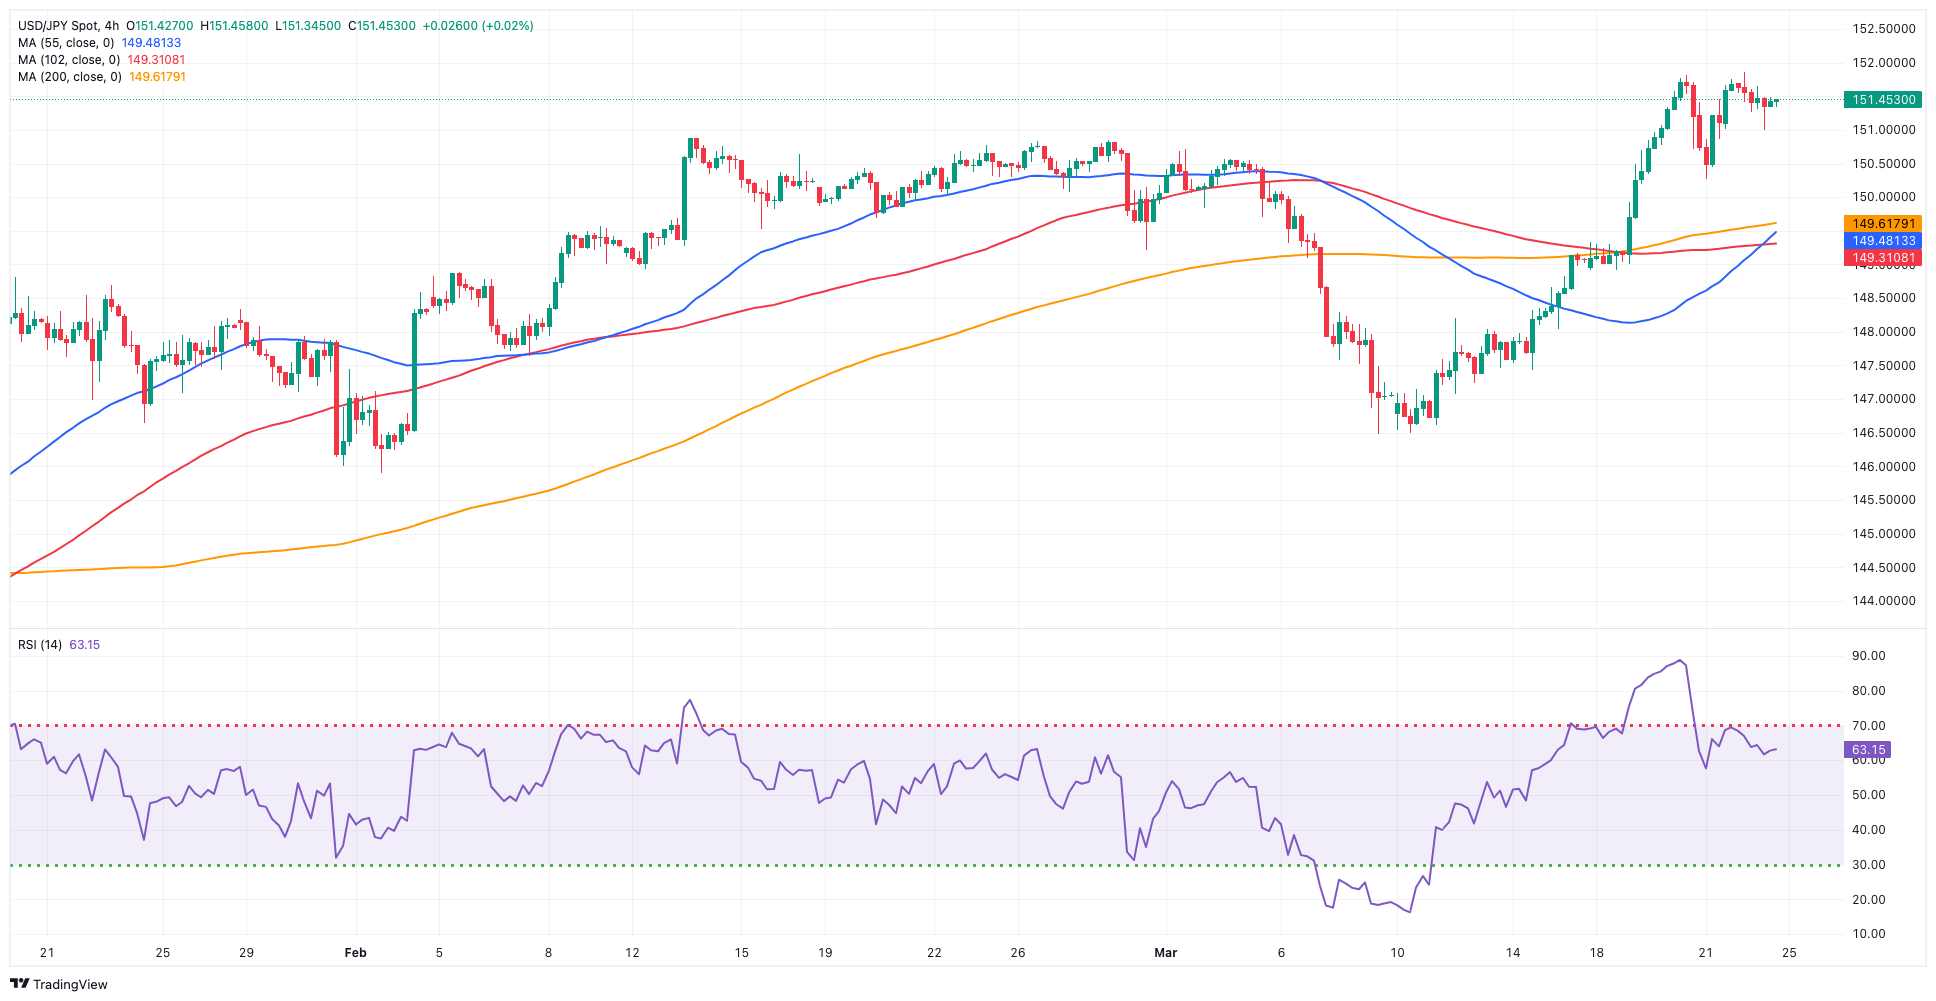
USD/JPY ended its first session of losses after eight consecutive daily advances on Friday, as the earlier move to fresh YTD highs did not progress.
In fact, some profit-taking mood, raising fears of FX intervention (as the pair gets closer to 152.00), and lower US yields across the board all seem to have lent some breathing space to the Japanese yen at the end of the week.
Regarding the risk of intervention, finmin Suzuki cautioned that he is closely monitoring currency fluctuations with great concern.
In the Japanese docket, the Inflation Rate rose by 2.8% in the year to February, the Core Inflation Rate increased by 2.8% YoY, and the Inflation Rate Ex-Food and Energy gained 3.2% vs. the same month in 2023. Finally, Foreign Bond Investment contracted by ¥803.9B in the week to March 16.
USD/JPY is currently aiming for a 2024 high of 151.86 (March 20), just above the 2023 high of 151.90 (November 13). Further higher, the 2022 peak of 151.94 (October 21) precedes the round figure of 152.00. On the contrary, the initial support level is placed at March's low of 146.47 (March 8), which is bolstered by the proximity of the critical 200-day SMA (146.58). A breach of this zone may result in a return to the February low of 145.89 (February 1), which preceded the December 2023 low of 140.24 (December 28), the round number 140.00, and the July low of 137.23 (July 14). The daily RSI climbed to around 67.
Resistance levels: 151.86 151.90 151.94 (4H chart)
Support levels: 150.26 149.60 148.91 (4H chart)
GBPUSD
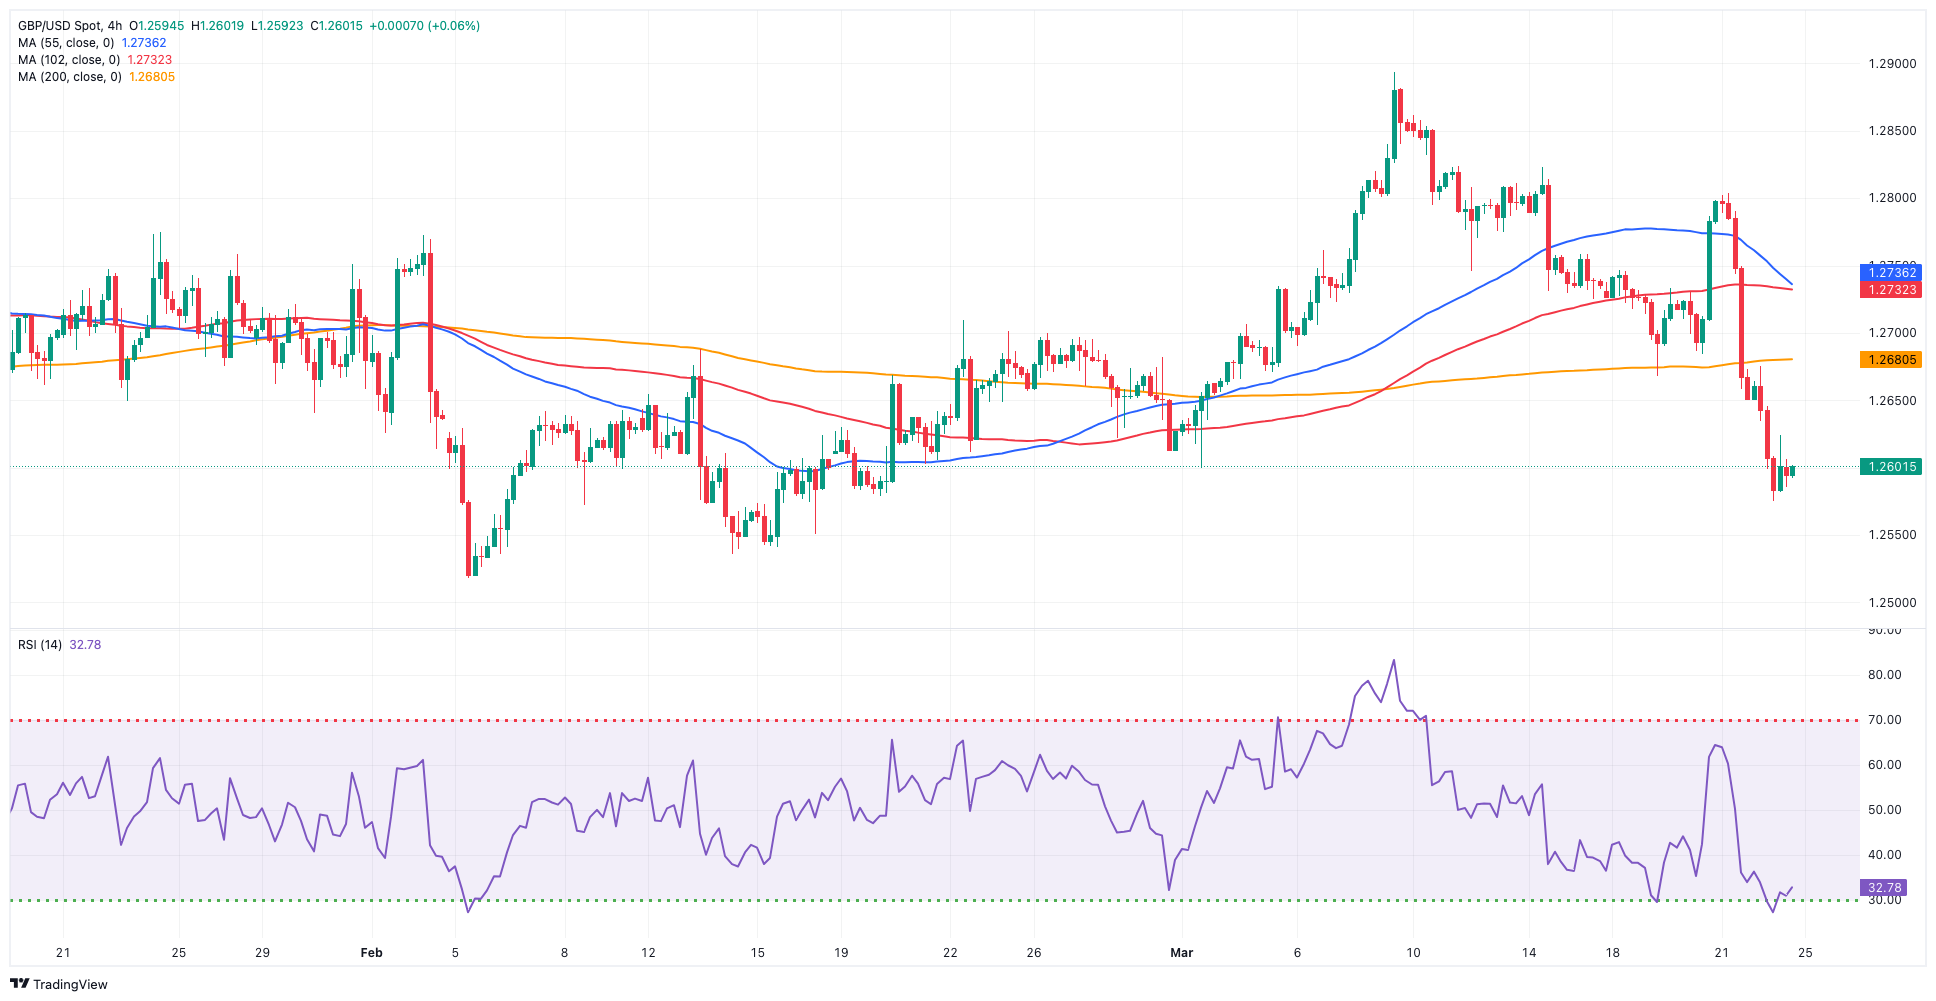
The generalized sell-off in the risk-related universe favoured further weakness in the British pound, dragging GBP/USD to test the vicinity of 1.2570, or monthly lows, just to recover some balance afterwards and end the session around 1.2600 the figure.
The sharp pullback in Cable seen in the second half of the week came in response to increased bets on the BoE’s rate cut earlier than anticipated, particularly after investors assessed the lower-than-expected UK CPI prints during February.
Furthermore, the quid failed to spark any reaction after UK Retail Sales surprised to the upside in February. On this headline, Retail Sales contracted by 0.4% over the last twelve months, and core sales shrank by 0.5% from a year earlier. In addition, Gfk’s Consumer Confidence held steady at -21 in March.
In the UK money market, 10-year gilt yields flirted with monthly lows near 3.90%.
The March low of 1.2575 (March 22) comes before the 2024 low of 1.2518 (February 5) and the December 2023 low of 1.2500 (December 13). A deeper retracement should not find major support until the weekly low of 1.2187 (November 10, 2023), followed by the October 2023 low of 1.2037 and the main 1.2000 barrier. In the opposite direction, the next upward block is the 2024 high of 1.2893 (March 8), ahead of the weekly top of 1.2995 (July 27, 2023), all before the critical 1.3000 yardstick. The day-to-day RSI dropped to around 39.
Resistance levels: 1.2679 1.2803 1.2823 (4H chart)
Support levels: 1.2575 1.2535 1.2518 (4H chart)
GOLD
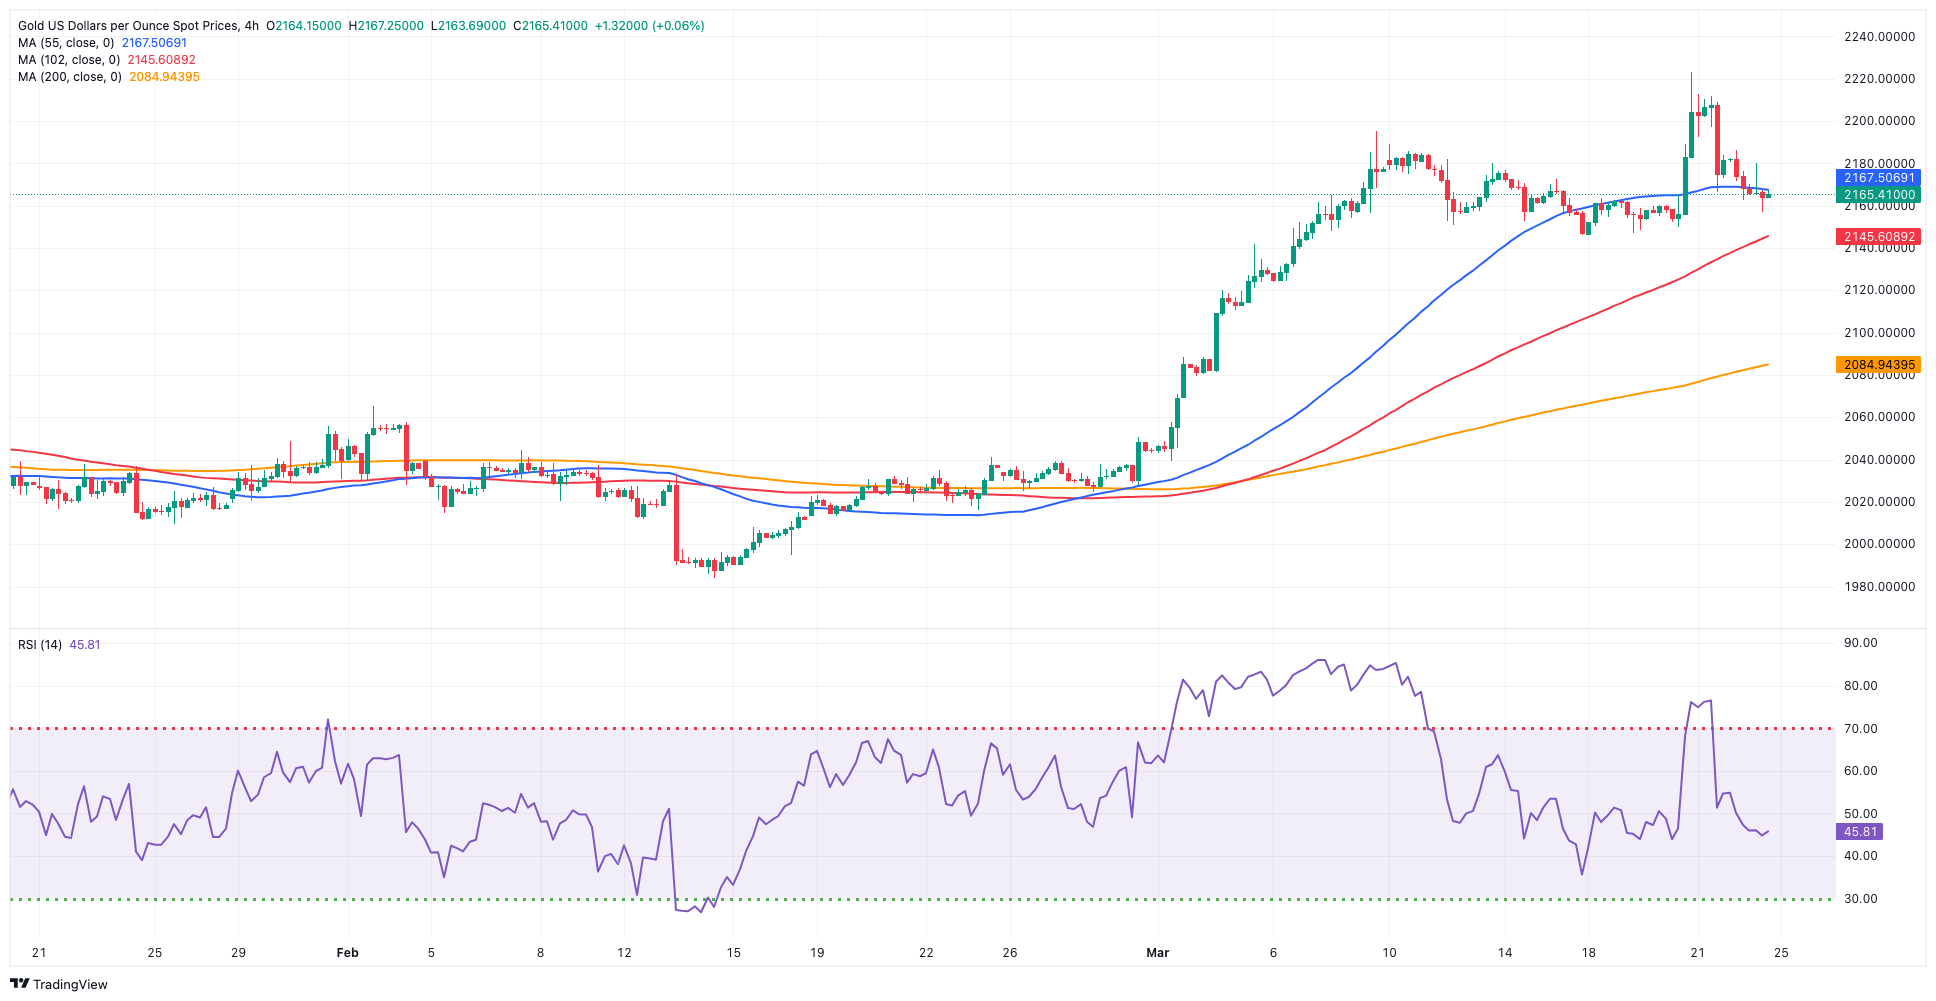
Gold prices edged lower for the second straight session at the end of the week, extending the rejection from Thursday’s all-time high around the $2,220 mark per troy ounce.
The intense move higher in the greenback in combination with somewhat diminishing geopolitical concerns in the Middle East appear to have underpinned further selling pressure in the precious metal on Friday, while the downtick in US yields kind of mitigated the decline.
In the forthcoming sessions, the release of significant US data, such as the PCE-measured inflation, along with developments concerning the Fed, will likely have their say in the price movement of bullion in the upcoming weeks.
Gold hit an all-time high of $2,222 on March 21. Having said that, the 55-day and 100-day SMAs of $2,064 and $2,041, respectively, could give some temporary support, followed by the 2024 low of $1,984 (February 14) and the critical 200-day SMA of $1,983. Once the latter is cleared, a possible visit to the December 2023 low of $1,973 might begin ahead of the November 2023 low of $1,931. The breakdown of this region might bring the yellow metal to test its October 2023 bottom of $1,810, which comes before the 2023 low of $1,804 and the important $1,800 conflict zone.
Resistance levels: $2,222 (4H chart)
Support levels: $2,147 $2,139 $2,080 (4H chart)
CRUDE WTI
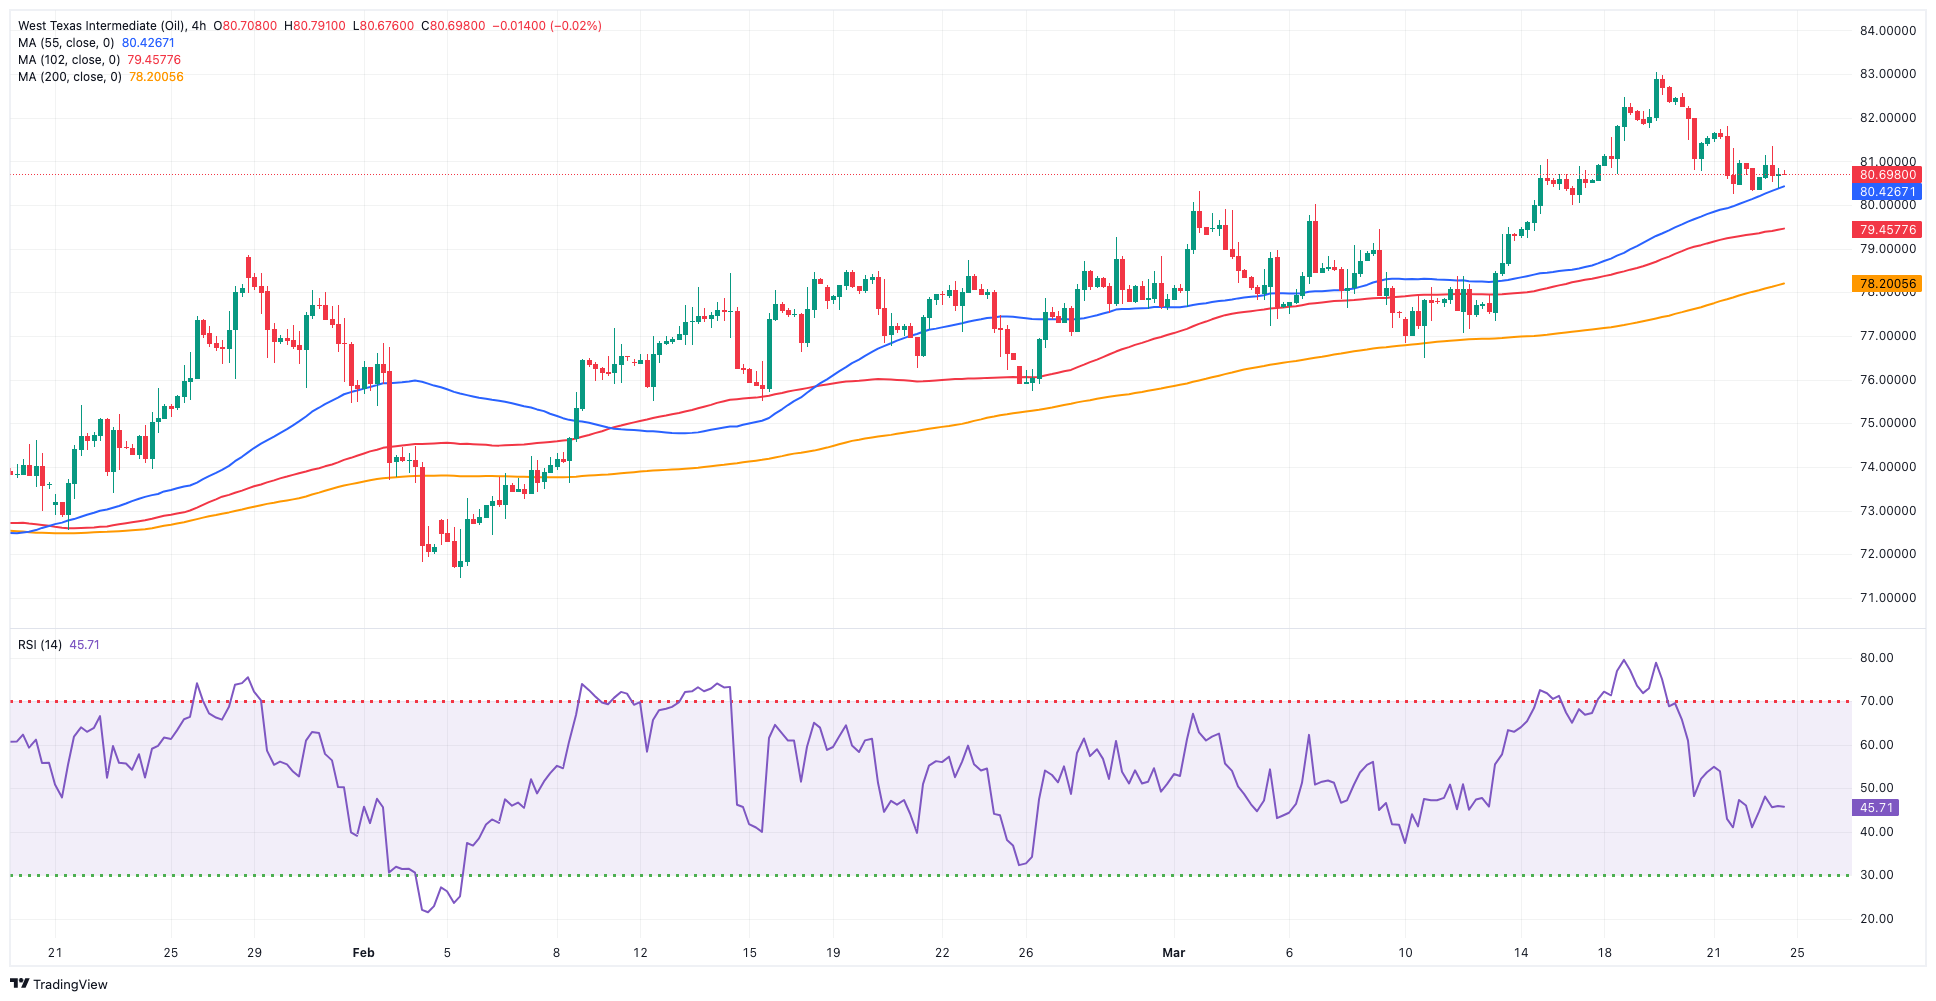
Prices of WTI extended their leg lower for the third session in a row on Friday, although they managed to remain above the key $80.00 mark per barrel.
Further progress towards a ceasefire in the Israel-Hamas conflict bolstered another session dominated by the selling impetus around crude oil, while the persistent rebound in the greenback also added to the sour mood among traders.
Limiting the downside, however, driller Baker Hugues reported a drop of 1 oil rig count in the week to March 22, taking the US total oil rigs to 509, while geopolitical jitters picked up around the Russia-Ukraine war.
The next upward challenge for WTI is the 2024 peak of $83.09 (March 19), which precedes the weekly high of $89.83 (October 18, 2023) and the 2023 top of $94.99 (September 28, 2023). Further north, the weekly peak of $97.65 (August 30) comes before the psychological $100.00 barrier. On the flip side, the 200-day SMA provides first support around $78.55, prior to the February low of $71.43 (February 5). Extra losses highlight the important $70.00 milestone ahead of the 2024 bottom of $69.31 (January 3).
Resistance levels: $83.09 $83.56 $85.85 (4H chart)
Support levels: $80.27 $76.76 $75.81 (4H chart)
GER40
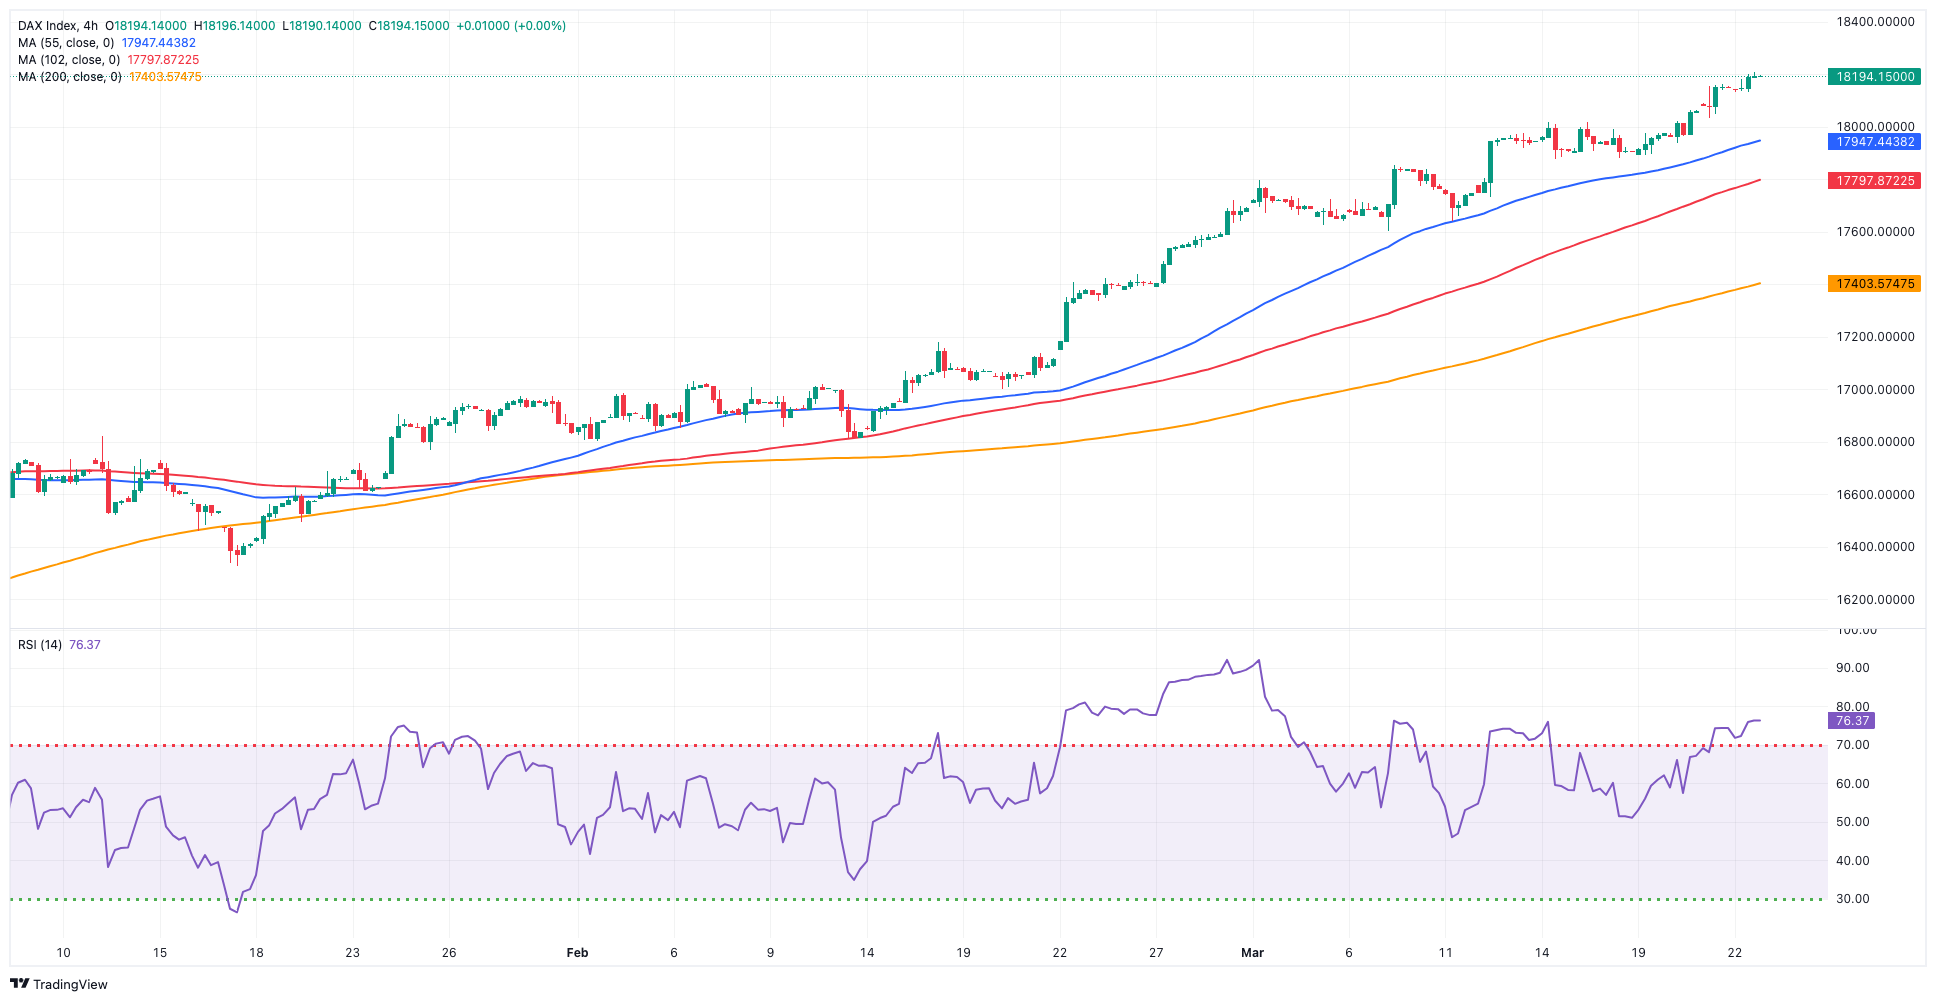
European equities ended the week mostly in the positive territory, with the German reference DAX40 reaching a record top around 18,220 zone.
Additional increases in the index occurred amid widespread optimism in global markets following the Fed’s decision to maintain interest rates unchanged and signal the possibility of three rate cuts later this year during its event on Wednesday, while ECB officials also favoured the start of the bank’s easing cycle in June.
Still around the ECB President Lagarde informed EU leaders assembled in Brussels that the inflation rate in the eurozone is expected to continue declining, while economic growth is anticipated to commence an upward trend this year.
Contributing to the optimistic atmosphere, Germany Business Climate tracked by the IFO institute improved in March.
Meanwhile, in the fixed-income space, the 10-year bund yields retreated to multi-session lows near 2.30%.
The DAX40's next level of resistance is the record high of 18,225 (March 22). Having said that, the 55-day SMA at 17,222 may provide some moderate support till the February low of 16,821 (February 1). A dip below this level might take the index below the 2024 low of 16,345 (January 17), which is ahead of the crucial 200-day SMA at 16,223. Once the latter is overcome, a challenge to the weekly low of 15,915 (November 28) may emerge, followed by the October low of 14,630 (October 23) and the 2023 low of 14,458 (March 20). The daily RSI climbed past 81, indicating that the market remained extremely overbought.
Best Performers: Siemens Energy AG, Sartorius AG VZO, Zalando SE
Worst Performers: Infineon, Munich Re Group, Hannover Rueck SE
Resistance levels: 18,225 (4H chart)
Support levels: 17,862 17,619 17,525 (4H chart)
GBPJPY
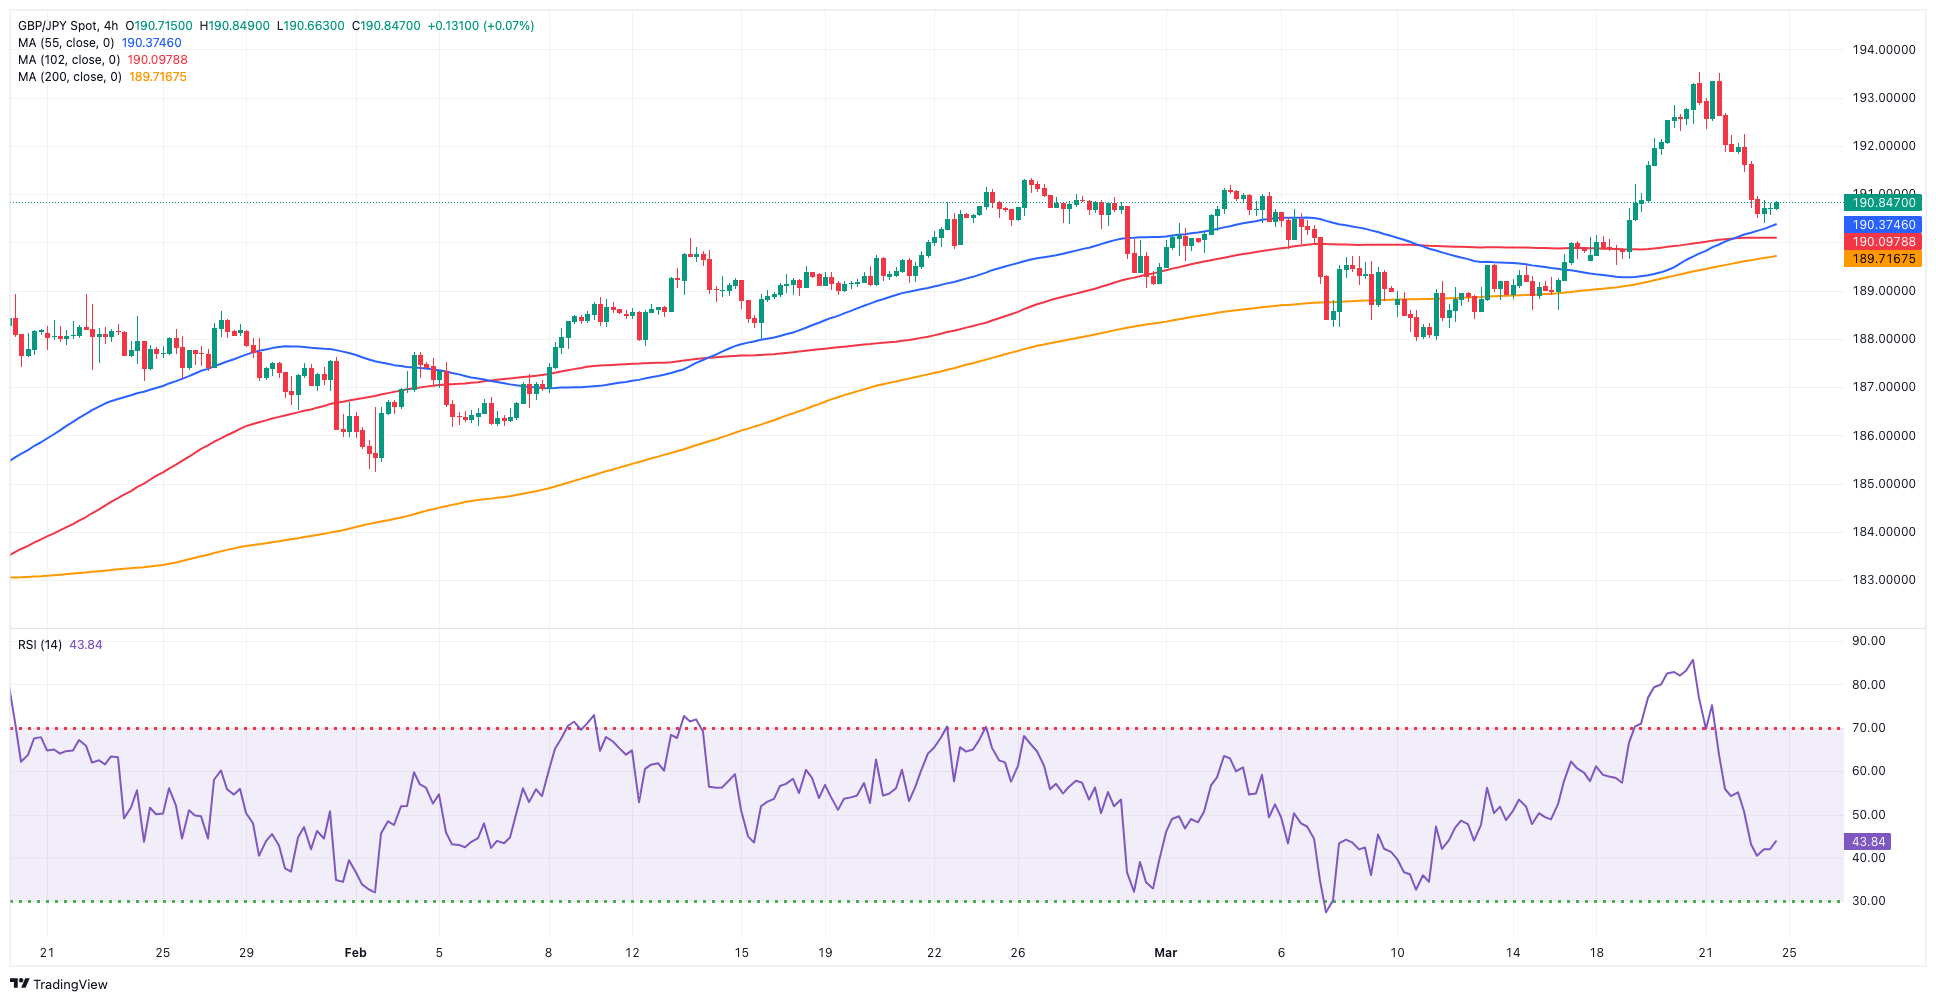
GBP/JPY added to Thursday’s decline and maintained the bearish fashion intact in the latter part of the week.
In fact, the cross dropped to three-day lows near 190.40, where some decent support seems to have emerged on the back of the sharp pullback in the British pound, while modest gains in the Japanese yen also contributed to the daily knee-jerk.
The 2024 high of 193.53 (March 20) precedes the August 2015 top of 195.28 (August 18) and the record peak of 195.88 (June 24, 2015). On the other hand, there is temporary support at the 55-day SMA at 188.60, which comes ahead of the March low of 187.96 (March 11), and the 100-day SMA at 186.58. A breach of the latter might result in a test of the February low of 185.22 (February 1), prior to the more important 200-day SMA at 184.64. A deeper decline may put the December 2023 low of 178.33 (December 14) back on the radar ahead of the October 2023 low of 178.03 and the July 2023 low of 176.30. The daily RSI decreased to the sub-55 zone.
Resistance levels: 193.53 195.28 195.88 (4H chart)
Support levels: 190.39 189.69 187.98 (4H chart)
NASDAQ
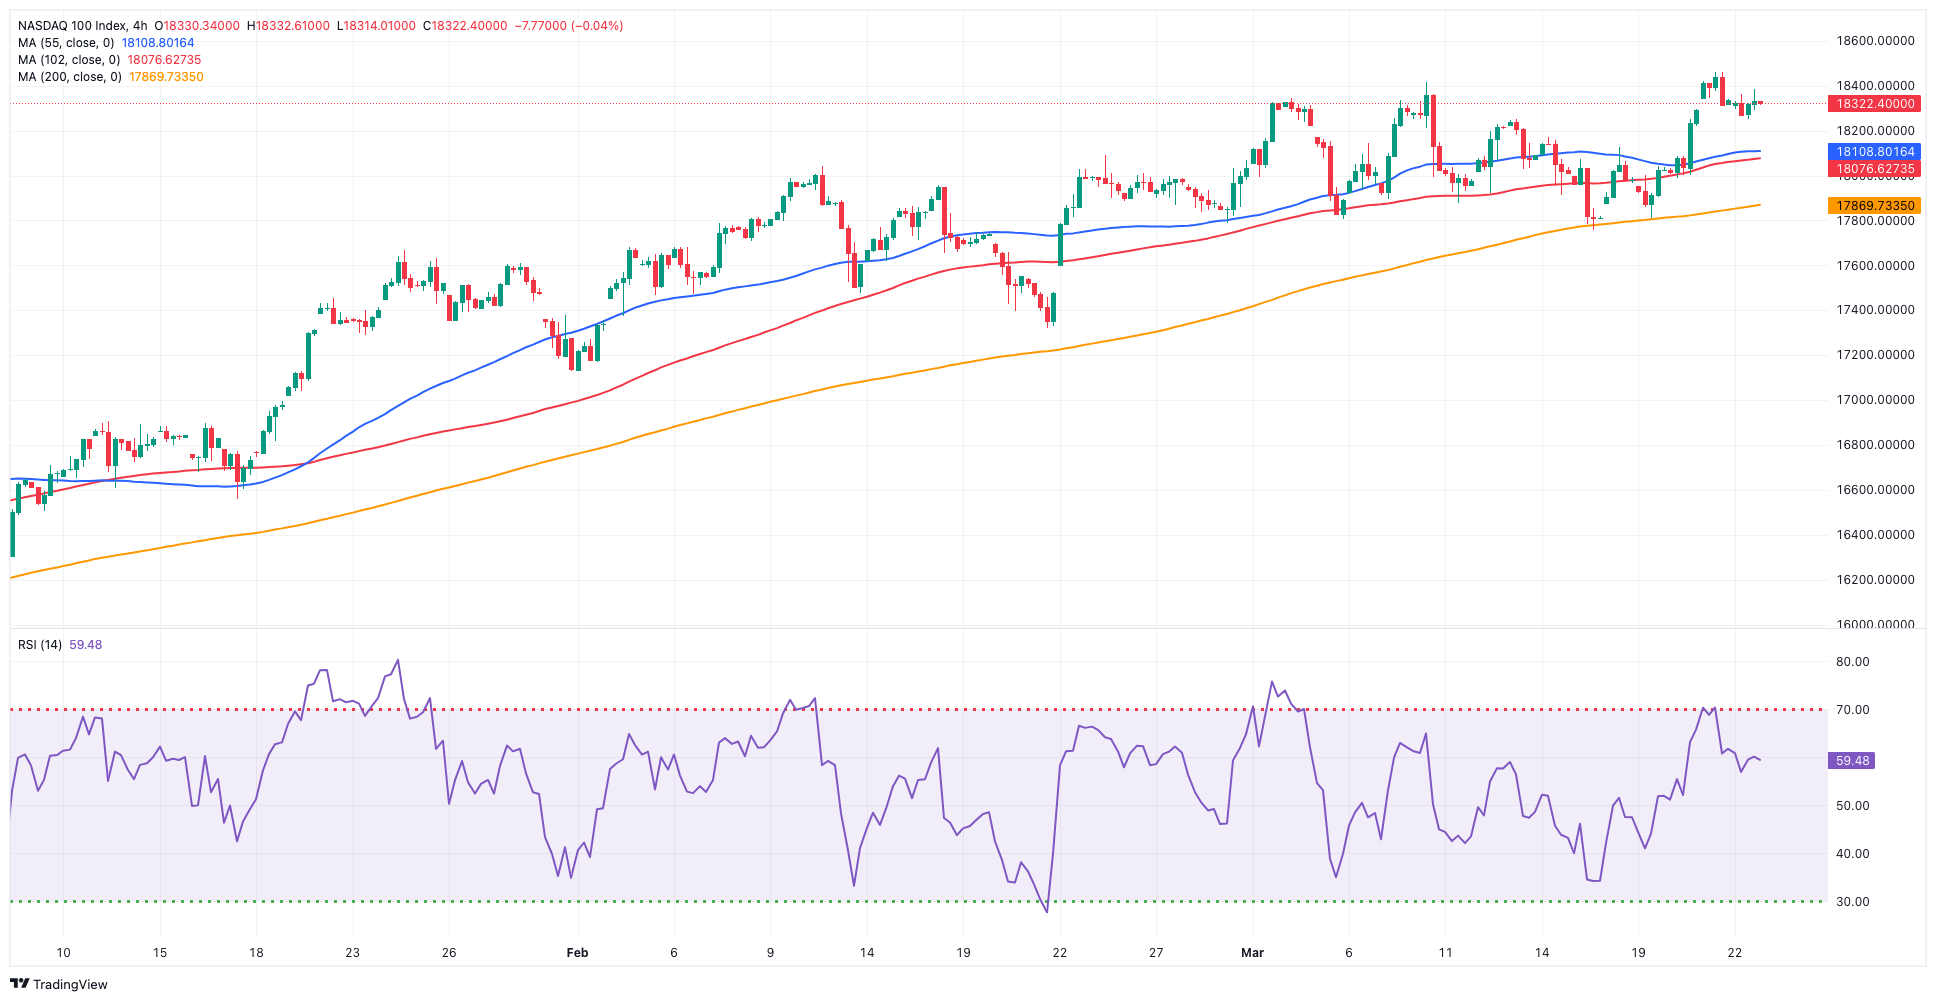
Another positive session saw the tech benchmark Nasdaq 100 trade at shouting distance from the recent all-time highs near the 18,500 zone on Friday.
Extra gains in the US tech sector remained bolstered by rising prospects that the Fed might start easing its monetary conditions in June, when a 25 bps rate cut is seen around 67%, according to CME Group’s FedWatch Tool.
Also adding to the bullish development in the index was the generalized weakness in US yields across different time frames.
Further gains might lift the Nasdaq 100 over its all-time high of 18,464 (March 21). The other way around, the index is expected to find transitory support at the 55-day SMA of 17,611, before sliding to weekly lows of 17,319 (February 21) and 17,128 (January 31). Once the latter is passed, the index may fall to the 2024 low of 16,249 (January 5), which is ahead of the critical 200-day SMA of 15,975 and the December 2023 low of 15,695 (December 4). Additional losses from here could test the October 2023 level of 14,058 (October 26), which comes before the April 2023 low of 12,724 (April 25). Down from here aligns the March 2023 low of 11,695 (March 13) followed by the lowest point in 2023 of 10,696 (January 6). The RSI on the daily chart improved to the 60 region.
Top Gainers: NVIDIA, Constellation Energy, Alphabet A
Top Losers: Lululemon Athletica, Warner Bros Discovery, Atlassian Corp Plc
Resistance levels: 18,464 (4H chart)
Support levels: 17,764 17,319 17,128 (4H chart)
DOW JONES
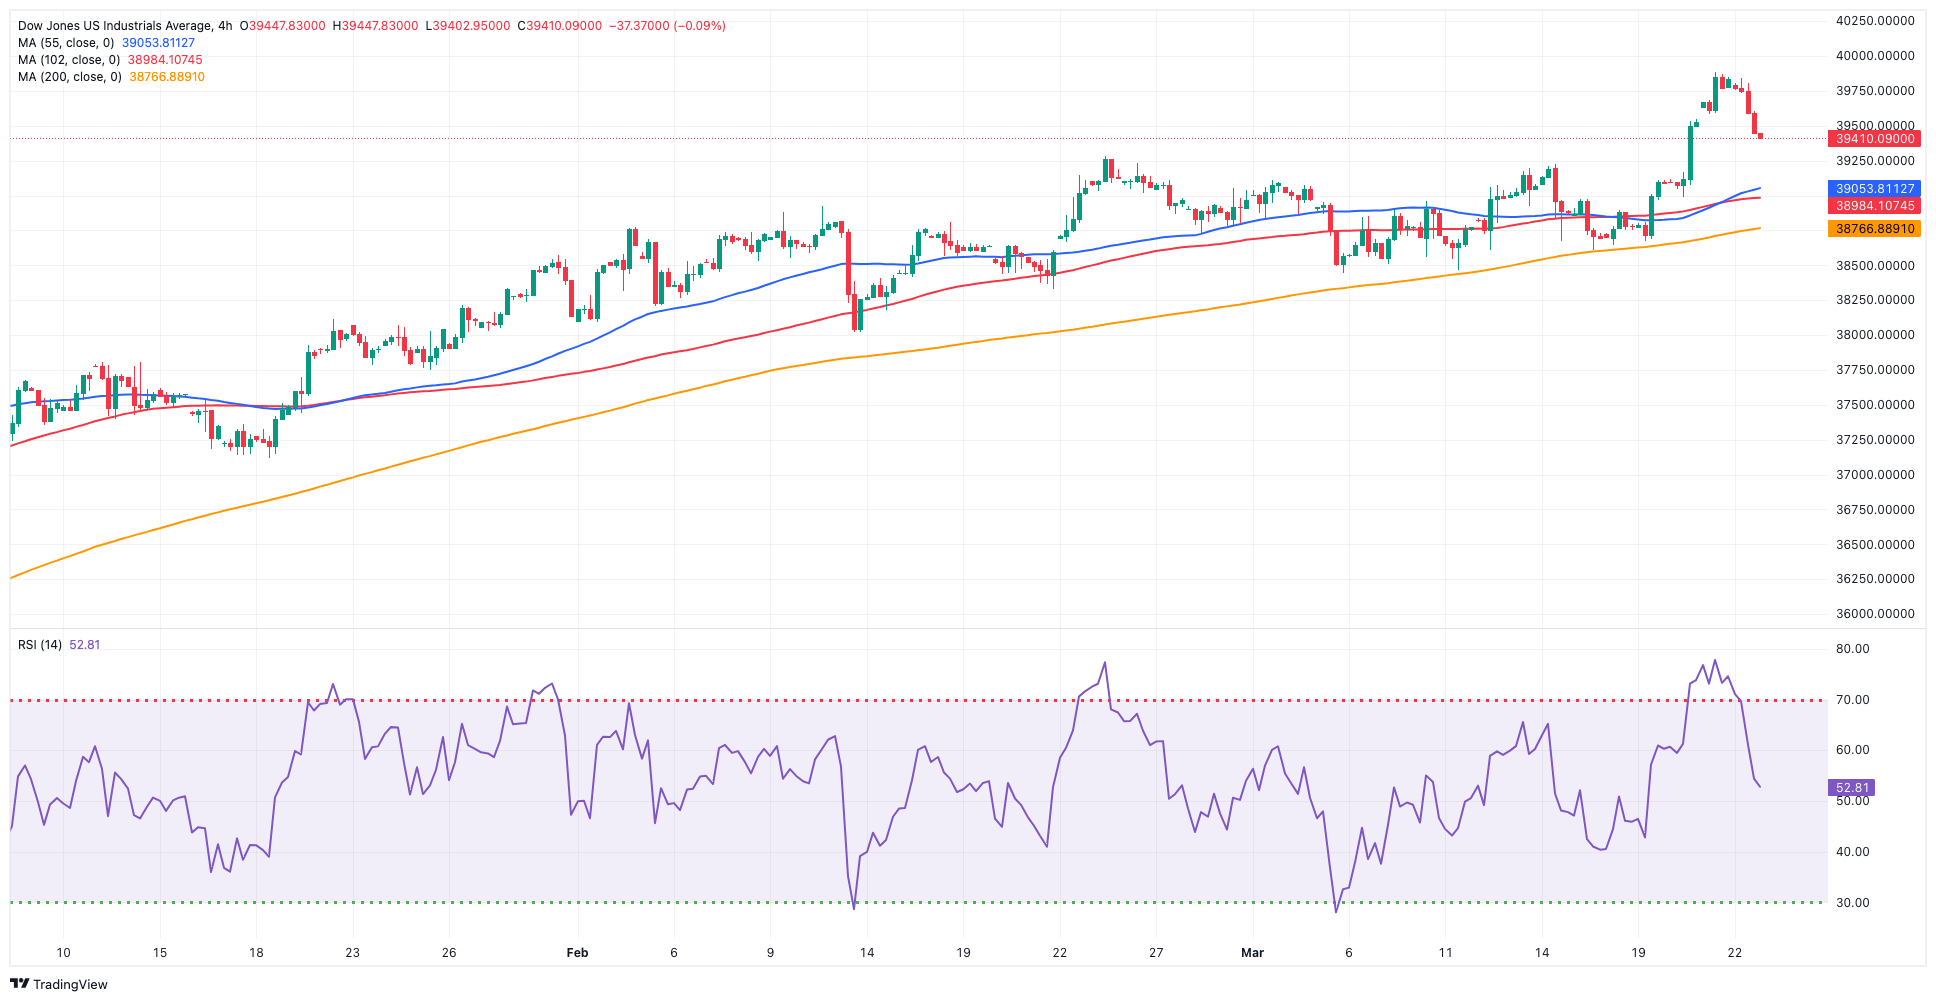
Friday saw a pause in the rally of the US stock reference Dow Jones, even though it clinched its strongest week of 2024 thus far on the back of speculation that the Fed may have the capacity to implement interest rate cuts in June.
In fact, the index retreated markedly after flirting with the key 40,000 mark in the previous session, as investors seem to have taken a breather amidst the strong resumption of the risk-off mood via the robust performance of the greenback as well as further assessment of the latest FOMC event.
Also collaborating with the daily pullback in the Dow, Atlanta Fed R. Bostic revised his forecast, stating that he anticipates only one 25 bps interest rate cut this year instead of the two he previously projected. He cited persistent inflation and stronger-than-expected economic data as the reasons for this adjustment.
At the end of the week, the Dow Jones retreated 0.77% to 39,475, the S&P 500 dropped 0.14% to 5,5234, and the tech-centric Nasdaq Composite advanced 0.16% to 16,428.
Further increases might propel the Dow Jones to its record high of 39,889 (March 21). Conversely, the 55-day SMA of 38,477 provides temporary support, followed by the 2024 low of 37,122 (January 18) and the weekly low of 37,073 (December 20, 2023). If the index falls below this level, it may test the preliminary 100-day SMA at 37,251 before reaching the 200-day SMA at 35,772. The weekly low of 33,859 (November 7, 2023) is next, followed by the October 2023 low of 32,327 (October 27) and the 2023 bottom of 31,429 (March 15). The daily RSI slipped back below the 62 level.
Top Performers: Boeing, Apple, Amazon.com
Worst Performers: Nike, Visa A, Caterpillar
Resistance levels: 39,889 (4H chart)
Support levels: 38,555 38,457 38,039 (4H chart)
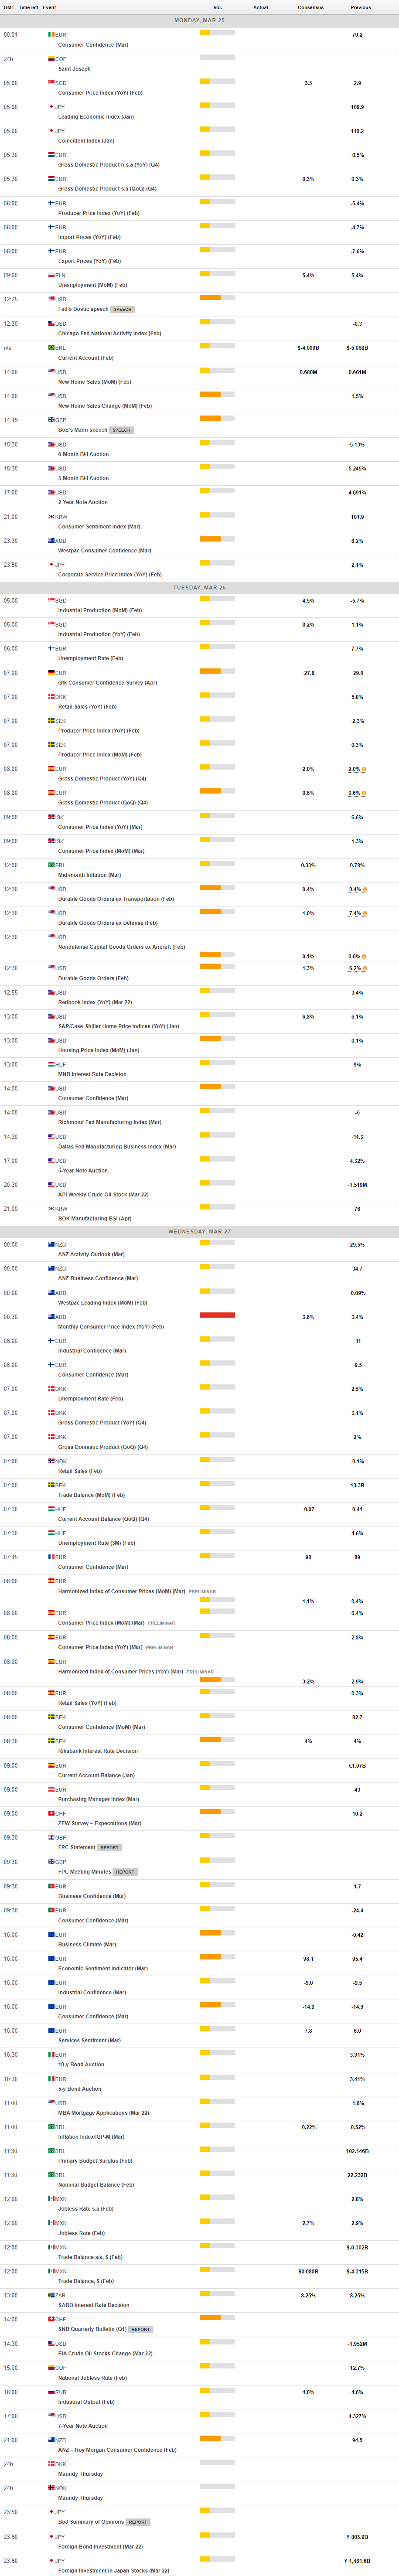
MACROECONOMIC EVENTS
All Information & Updates provided by:

All information relating to the financial markets available on this page has been prepared and issued by FXStreet (Forexstreet SL, Spain, Reg: B62498233) on the basis of publicly available information and all information believed to be reliable and does not conflict with Kuwaiti local laws, and all necessary care has been taken to before the company to ensure that the facts mentioned are correct from the source.
NCM Investment nor any of its directors or employees shall in any way be held responsible for the contents of this news, and the information contained on this page is intended only to provide clients with publicly available information and should not be construed as investment advice, report or analysis and/or constitute an offer or invitation to buy or sell financial instruments of any kind.
RISK WARNING: Forex and CFDs are highly risky leveraged products, as losses can exceed deposits. Please ensure you understand all the risks and take independent advice if necessary. NCM will segregate the clients based on the criteria of the regulator and its bylaws. NCM does not provide any advisory service; the material published does not constitute advice or a recommendation for a transaction in any financial instrument. NCM accepts no responsibility for any use of the content presented and any consequences of that use. Anyone acting on the information provided does so at their own risk.