
- Contact Us:
-

-

-

-


Daily Market Updates
26 Mar 2024
EURUSD
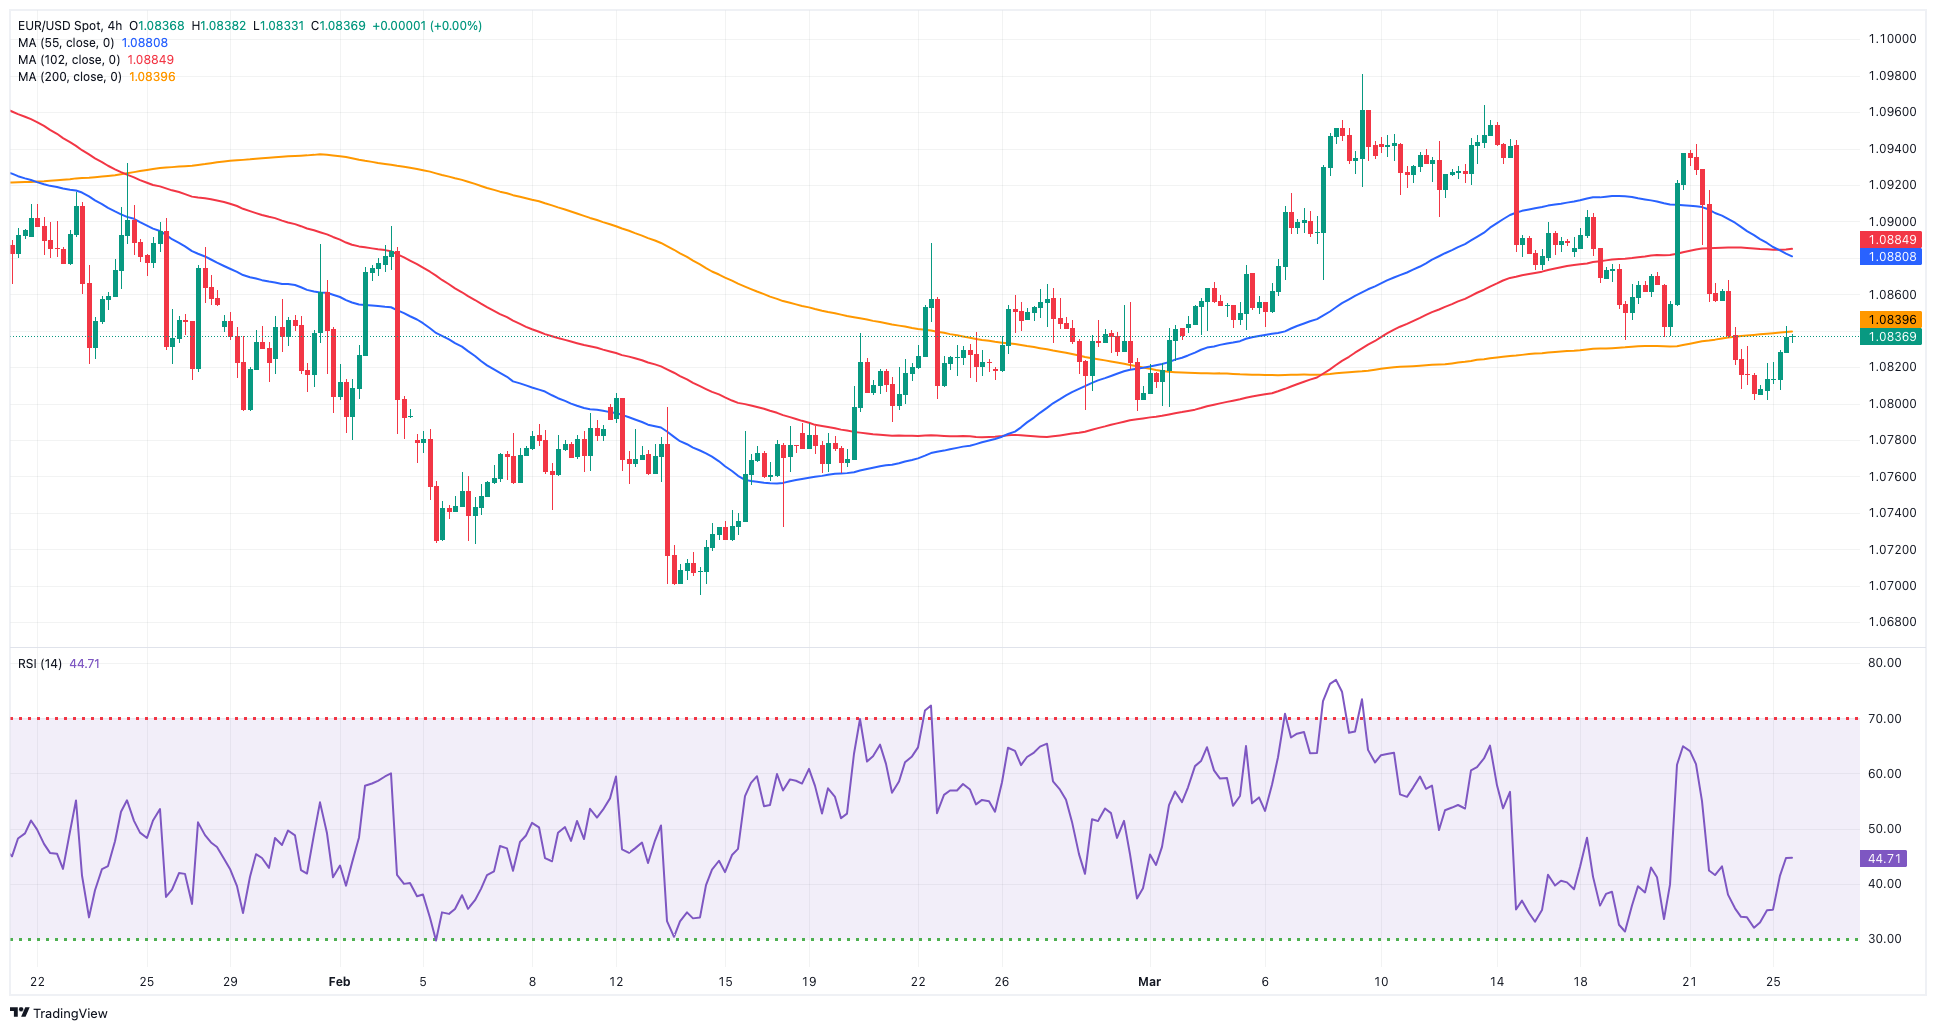
The negative start to the week of the greenback allowed EUR/USD to regain some composure and bounce off the area of monthly lows near 1.0800 on Monday.
On the USD side, the USD Index (DXY) reversed two consecutive daily advances and abandoned the area of recent multi-week highs near 104.50 (March 22) amidst the prevailing risk-on mood and increasing US yields across the curve.
By the same token, EUR/USD came all the way down and put the 1.00800 support to the test, clinching three-week lows and breaking below the critical 200-day SMA at 1.0838.
Regarding monetary policy, market participants continued to anticipate a rate cut by the Fed in June along with two additional reductions later in the year, while the ECB is viewed as potentially initiating its easing cycle at some point during the summer months.
From the Fed’s backyard, Atlanta Fed R. Bostic reiterated his anticipation of only one interest rate decrease this year, while aiming to mitigate any potential market turbulence stemming from the balance-sheet reduction. His colleague A. Goolsbee (Chicago) emphasized the necessity of observing a decline in inflation. The primary enigma regarding inflation revolves around the housing sector. He added that the decision to implement three cuts in 2024 aligns with my own perspective. Finally, FOMC Governor L. Cook cautioned that initiating cuts prematurely might solidify inflationary pressures. She advocated for a cautious strategy in gradually easing policy, aiming to achieve sustainable inflation around 2% while also safeguarding a robust labor market.
Data-wise, in the US, the Chicago Fed National Activity Index improved to 0.05 in February, and New Home Sale contracted by 0.3% MoM (or 0.662M units) in February.
If losses continue, EUR/USD may target the March low of 1.0797 (March 1) before falling to its 2024 bottom of 1.0694 (February 14). A deeper decline might disclose the weekly low of 1.0495 (October 13, 2023), which precedes the 2023 low of 1.0448 (October 3) and the round milestone of 1.0400. Instead, the first resistance level is the March high of 1.0981 (March 8), followed by the weekly high of 1.0998 (January 5, 2011) and the psychological 1.1000 mark. The breakout of this zone may pose a challenge to the December 2023 top of 1.1139 (December 27), which is still supported by the 200-week SMA of 1.1148 and occurs before the 2023 peak of 1.1275 (July 18). The daily RSI rose above 45.
Resistance levels: 1.0942 1.0963 1.0981 (4H chart)
Support levels: 1.0801 1.0795 1.0694 (4H chart)
USDJPY
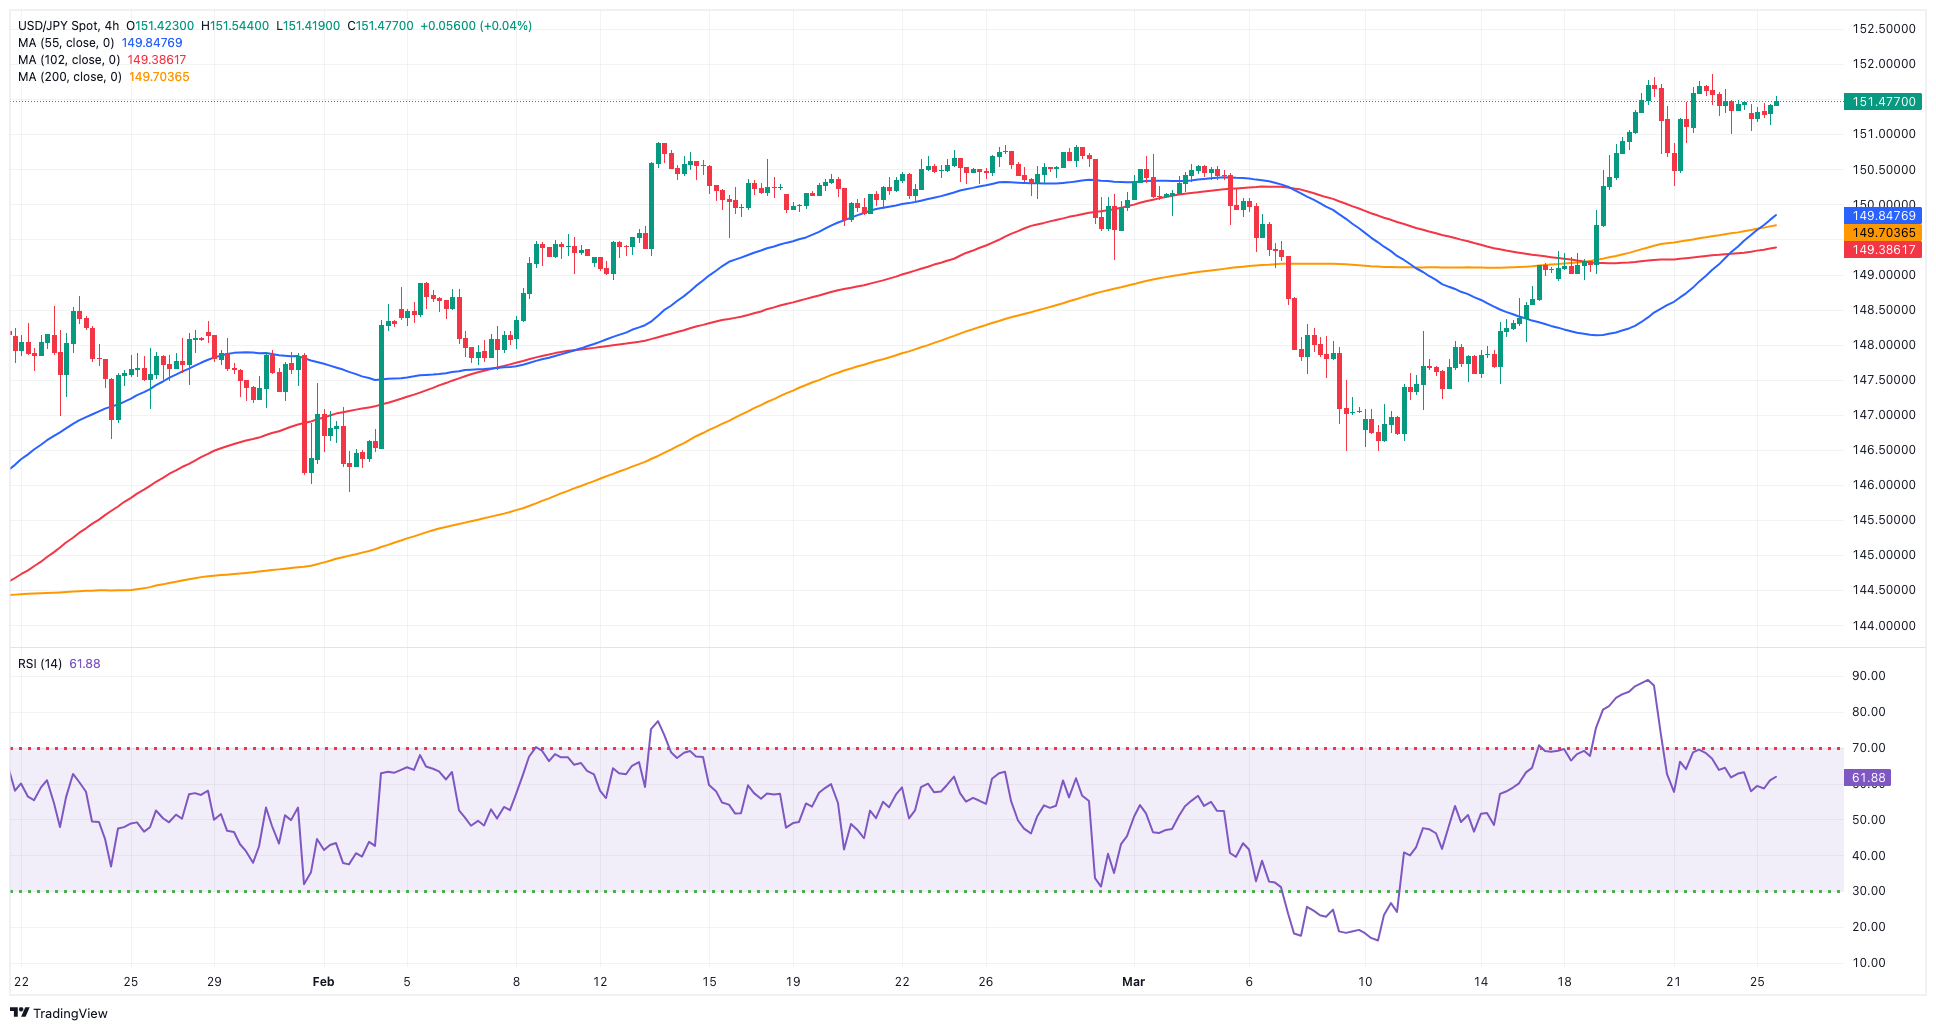
USD/JPY traded in an inconclusive fashion on Monday following the modest pullback seen at the end of the previous week. Despite the lack of direction, spot managed well to maintain the trade in the upper end of the recent range above the 151.00 mark.
Price action in the pair came along with some renewed selling pressure in the greenback and a decent rebound in US yields across different time frames vs. a small retracement in JGP 10-year yields.
In the meantime, as the pair approaches the 152.00 level, Vice Finance Minister for International Affairs, Kanda, cautioned that "the current depreciation of the yen is inconsistent with underlying economic principles and is evidently fueled by speculative activities," further stating, "we are prepared to intervene to address excessive fluctuations, with all options on the table."
The BoJ released its Minutes, where it is gradually approaching a tightening phase, with board members acknowledging the opportunity to adjust monetary policy and acknowledging the likelihood of maintaining supportive financial conditions despite measures like ending negative interest rate policy.
Other than the BoJ Minutes, the Japanese docket saw the final Coincident Index and Leading Economic Index at 112.1 and 109.5 for the month of January.
USD/JPY is currently aiming for a 2024 high of 151.86 (March 20), which comes just before the 2023 top of 151.90 (November 13). Further up, the 2022 peak of 151.94 (October 21) anticipates the round figure of 152.00. On the contrary, the initial support level is set at March's low of 146.47 (March 8), which is strengthened by the vicinity of the key 200-day SMA. A breakdown of this zone might result in a return to the February low of 145.89 (February 1) prior to the December 2023 low of 140.24 (December 28), the round number 140.00, and the July low of 137.23 (July 14). The daily RSI looked stable near 65.
Resistance levels: 151.86 151.90 151.94 (4H chart)
Support levels: 150.26 149.69 148.91 (4H chart)
GBPUSD
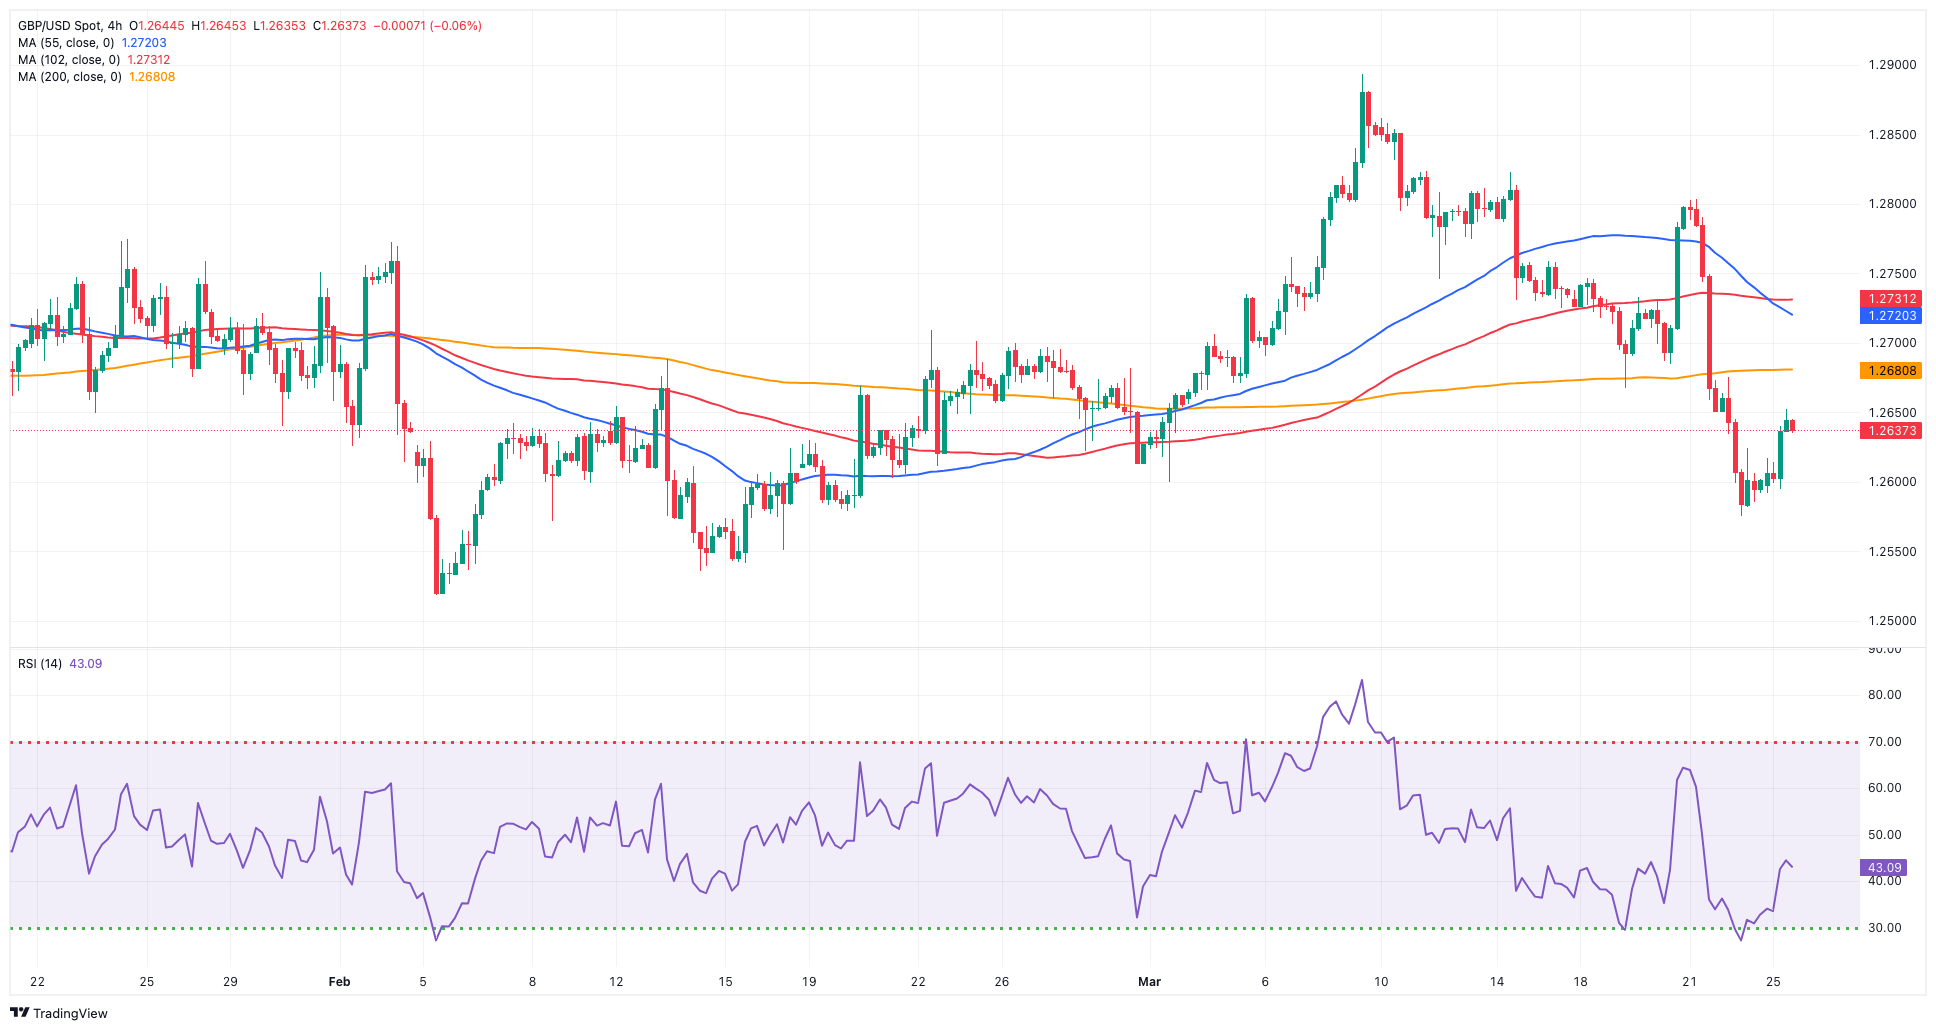
In line with the positive kickstart to the new trading week in the risk complex, GBP/USD managed to reclaim the area beyond 1.2600 the figure, setting aside two straight daily pullbacks at the same time.
In addition, Cable left behind the key 200-day SMA (1.2591), leaving the door open to the continuation of the rebound on the short-term horizon.
On the monetary policy front, market anticipations regarding the BoE have shifted following its recent dovish stance. Currently, the market indicates a probability of over 80% for a cut at its June 20 gathering, a significant increase from the 50% probability observed at the beginning of last week.
In the UK debt market, 10-year gilt yields reversed several sessions in the red ground and rose to the 4.0% neighbourhood.
The loss of the March low of 1.2575 (March 22) should pave the way for a move to the 2024 low of 1.2518 (February 5) ahead of the December 2023 low of 1.2500 (December 13). A deeper retracement would not find significant support until the weekly low of 1.2187 (November 10, 2023), followed by the October 2023 low of 1.2037 and the main 1.2000 barrier. In the opposite direction, the next upward barrier is the 2024 peak of 1.2893 (March 8), followed by the weekly high of 1.2995 (July 27, 2023), all before to the important 1.3000 yardstick. The day-to-day RSI bounced past 43.
Resistance levels: 1.2679 1.2803 1.2823 (4H chart)
Support levels: 1.2575 1.2535 1.2518 (4H chart)
GOLD
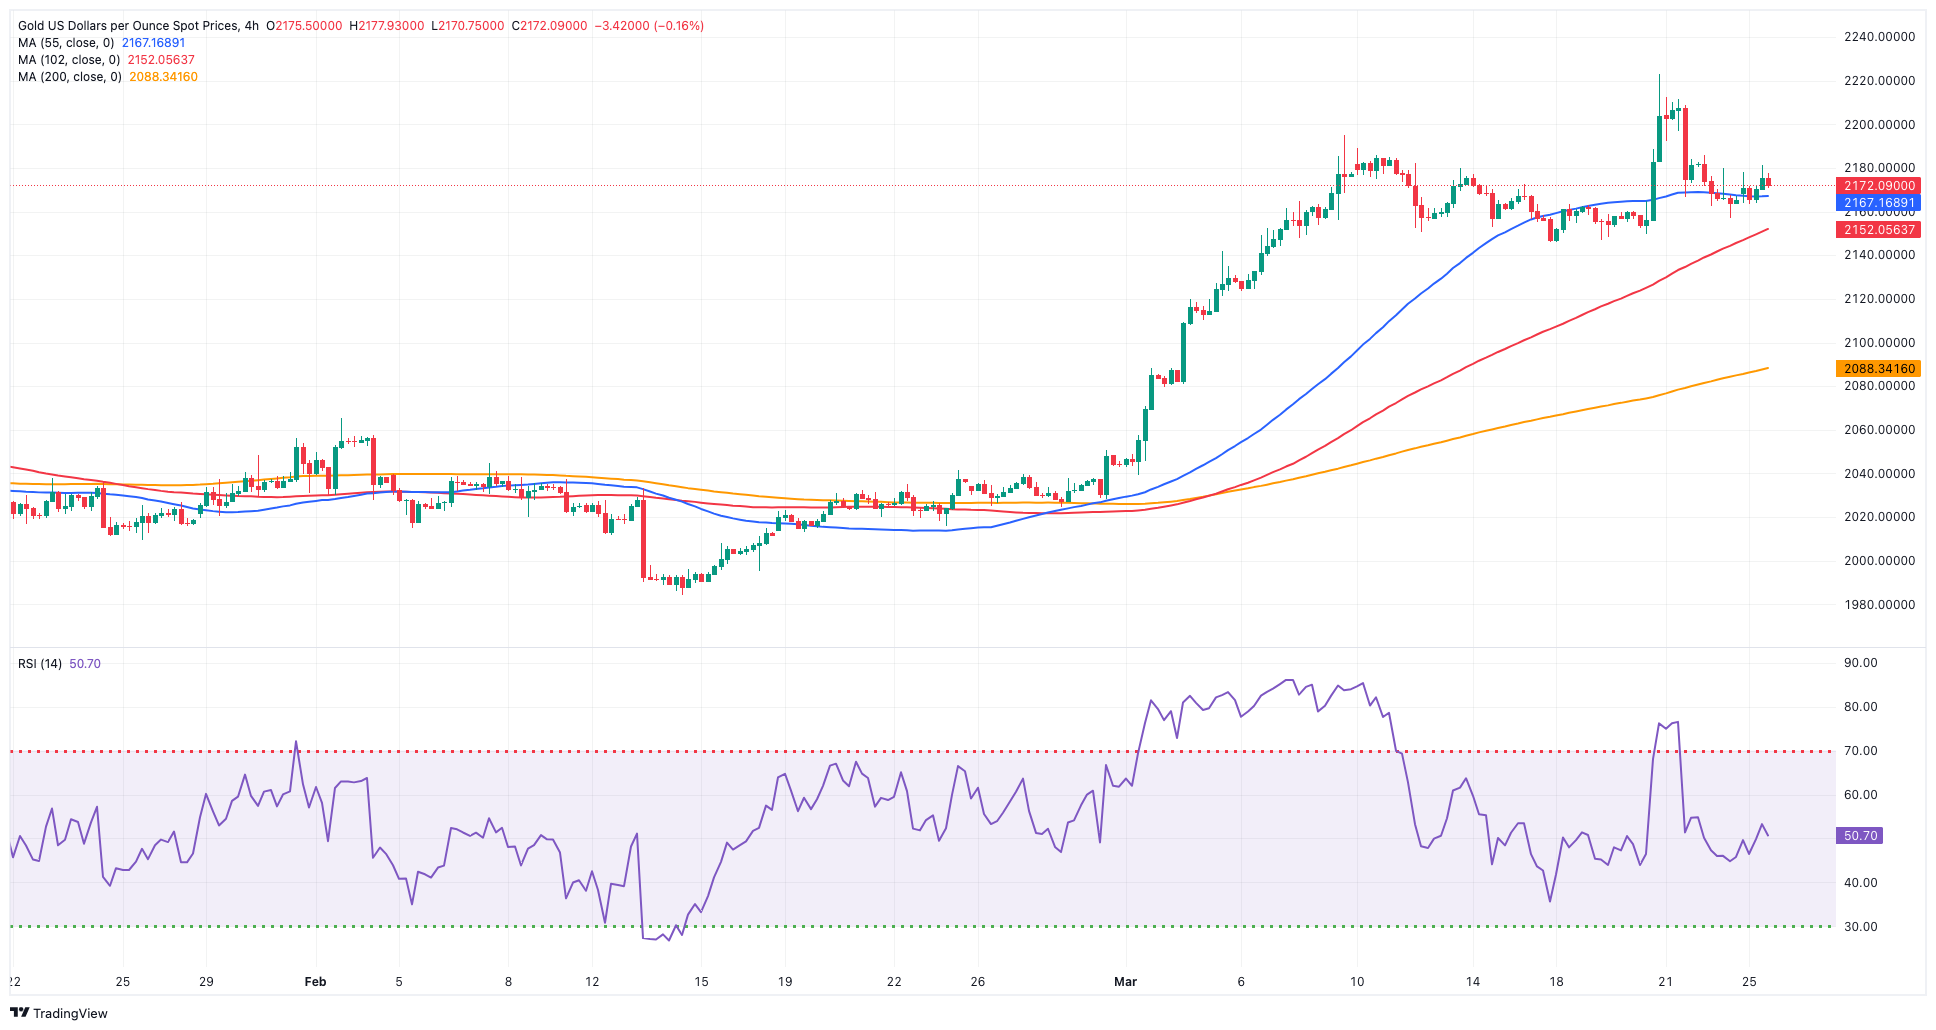
Prices of the yellow metal started the week on the positive foot, reversing two daily drops in a row and refocusing on the upside.
Despite the prevailing appetite for riskier assets and higher US yields across the curve, bullion managed to advance modestly, almost exclusively, on the back of further selling in the greenback.
In the upcoming sessions, the unveiling of notable US data, including PCE-measured inflation, coupled with updates regarding the Fed, are expected to influence the price trajectory of the precious metal.
Gold reached an all-time high of $2,222 on March 21. On the downside, the 55-day and 100-day SMAs of $2,067 and $2,043, respectively, may provide some temporary support, followed by the 2024 low of $1,984 (February 14), which coincides with the key 200-day SMA. Once the latter is resolved, a possible visit to the December 2023 low of $1,973 may commence before the November 2023 low of $1,931. The breakdown of this region may cause the yellow metal to test its October 2023 low of $1,810, which precedes the 2023 low of $1,804 and the critical $1,800 conflict zone.
Resistance levels: $2,222 (4H chart)
Support levels: $2,146 $2,088 $2,028 (4H chart)
CRUDE WTI
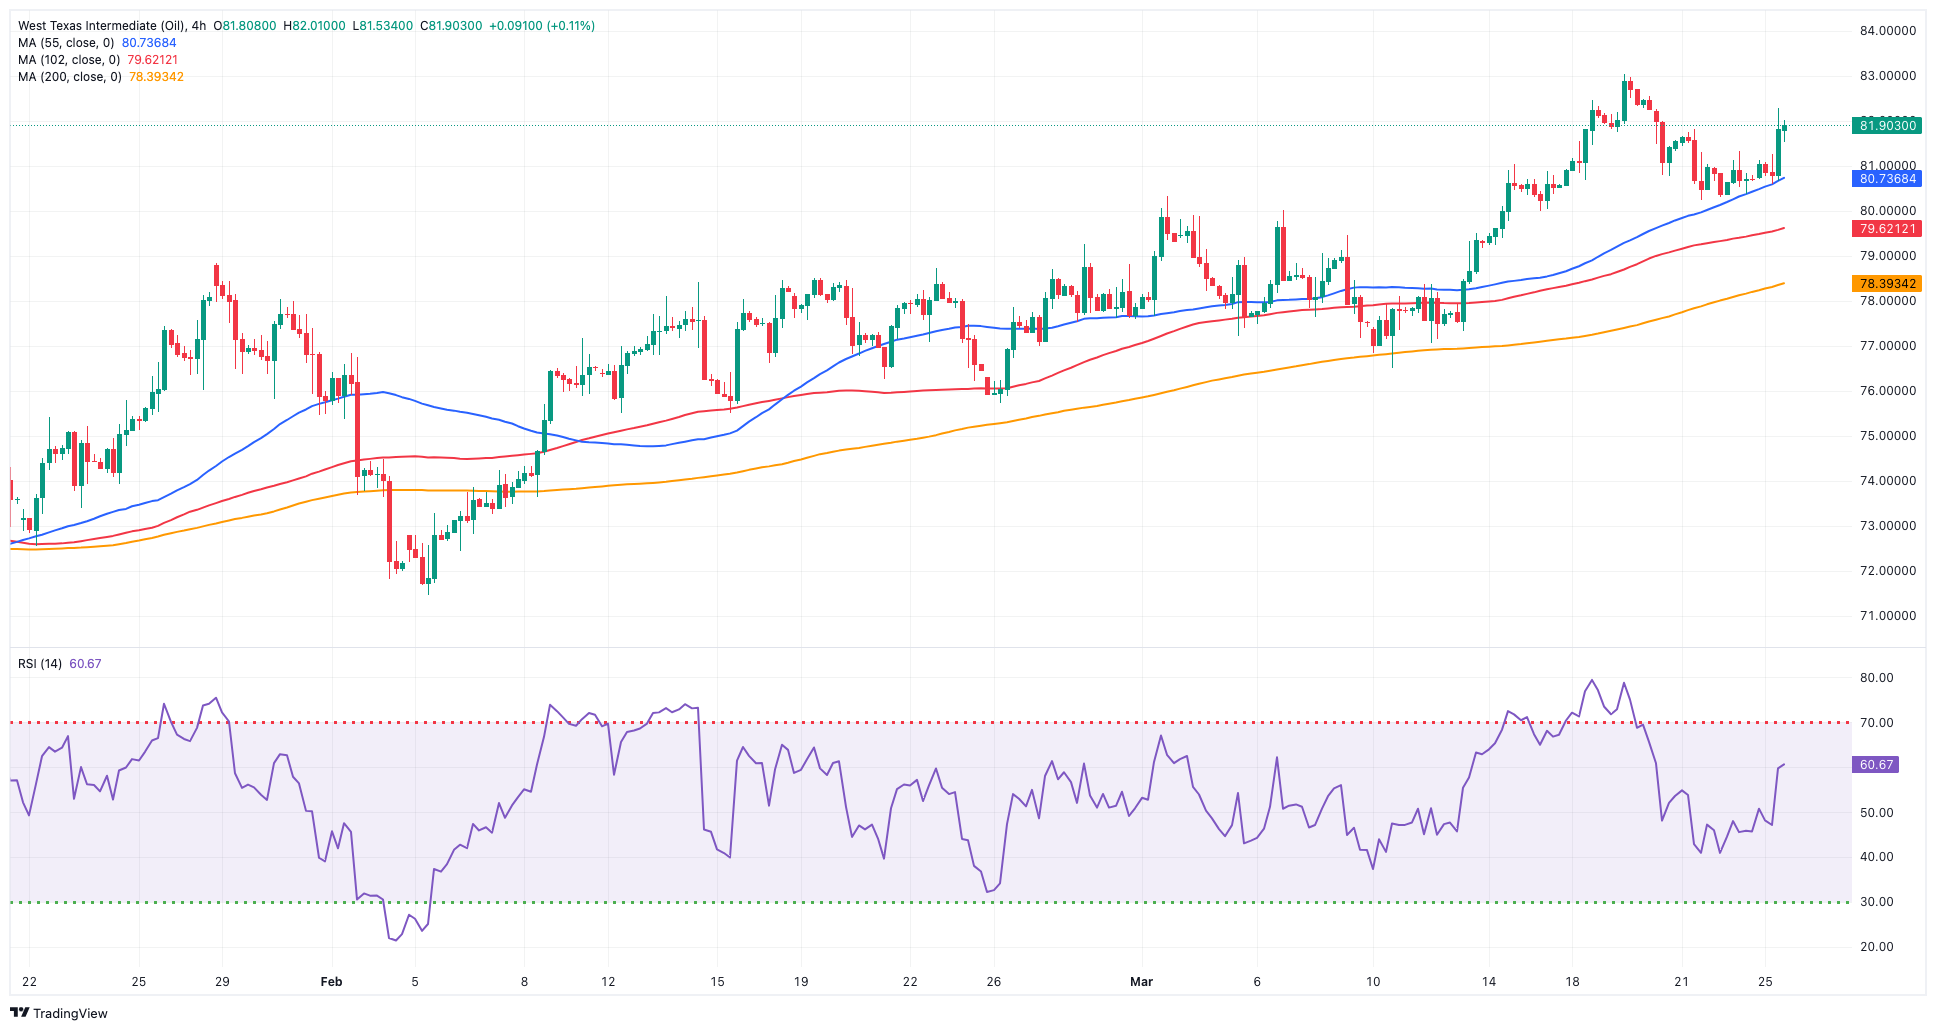
An auspicious start of the week saw WTI prices rise past the $82.00 mark per barrel, adding to Friday’s uptick.
Further gains in the commodity came after Moscow instructed companies to decrease oil production in the second quarter to achieve a target output of 9 mbpd by the end of June, aligning with the country’s commitments to the OPEC+ producer alliance.
Also adding to supply concerns emerged the rising uncertainty in the geopolitical scenario as well as the dwindling chances of a ceasefire in the Israel-Hamas conflict, at least in the very near term.
Later in the week, the usual weekly reports on US crude oil supplies by the API and the EIA will take centre stage on Tuesday and Wednesday, respectively.
The next upward challenge for WTI is the 2024 peak of $83.09 (March 19), which precedes the weekly high of $89.83 (October 18, 2023) and the 2023 top of $94.99 (September 28, 2023). Further north, the weekly peak of $97.65 (August 30) precedes the psychological $100.00 barrier. On the flip side, the 200-day SMA provides first support around $78.61, prior to the February low of $71.43 (February 5). Extra losses underscore the significant $70.00 milestone ahead of the 2024 low of $69.31 (January 3).
Resistance levels: $82.43 $83.09 $83.56 (4H chart)
Support levels: $80.27 $78.57 $76.76 (4H chart)
GER40
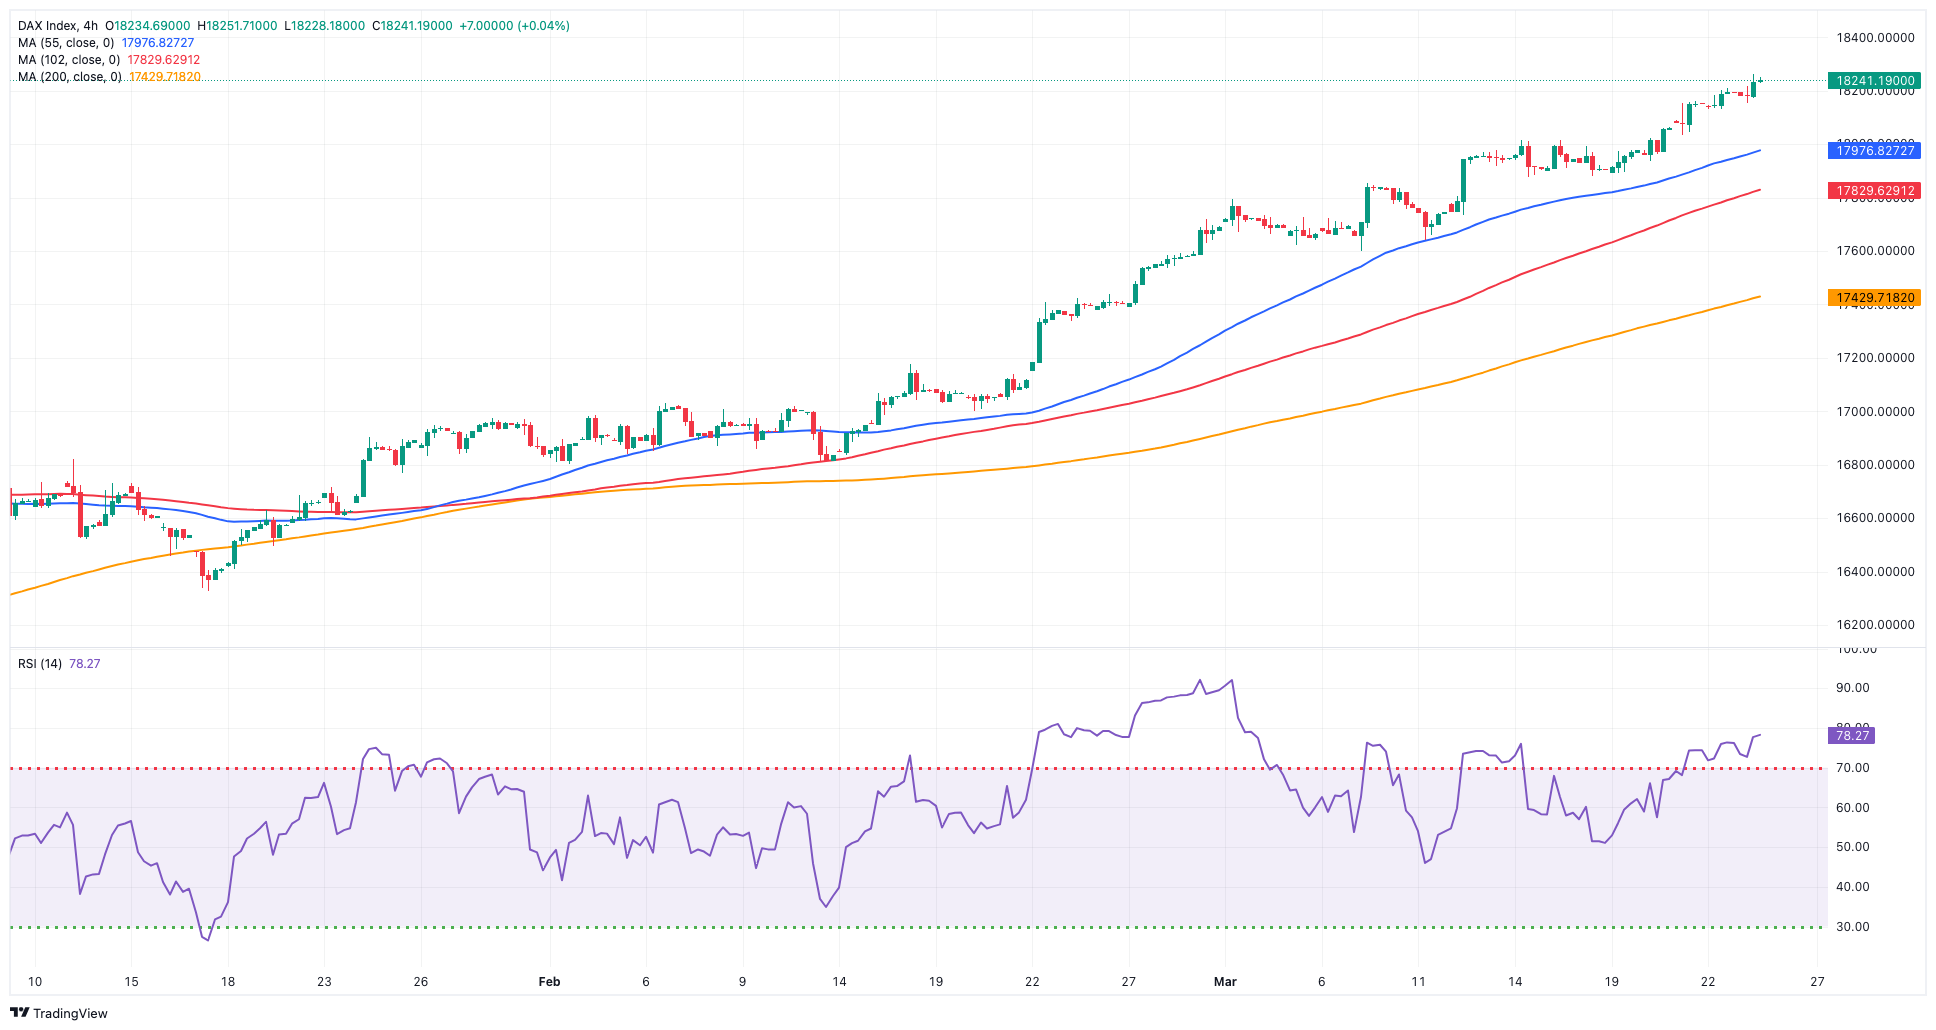
Germany’s stock reference DAX40 maintained its recent optimism well in place, advancing for the fifth consecutive session and clinching an all-time high just below the 18,300 yardstick on Monday.
Further gains in the index came on the back of the generalized view that major central banks should start their easing cycles later in the year in the context of persistent disinflationary pressures.
Indeed, last week, the FED reaffirmed its forecast of reducing interest rates by 75 bps by the year's end, while the BoE indicated that the economy was moving towards potential rate cuts, and in a surprising move, the SNB lowered borrowing costs by 25 bps, catching markets off guard.
In the meantime, 10-year bund yields approached 2.40%, reversing at the same time four sessions of losses.
The DAX40's next level of resistance is the record high of 18,285 (March 25). Having said that, the 55-day SMA at 17,250 should provide some mild support till the February low of 16,821 (February 1). A drop below this level might push the index below the 2024 low of 16,345 (January 17), which is ahead of the critical 200-day SMA at 16,233. Once the latter is overcome, the weekly low of 15,915 (November 28) may be challenged, followed by the October low of 14,630 (October 23) and the 2023 low of 14,458 (March 20). The daily RSI rose to the boundaries of 83, indicating that the market remained severely overbought.
Best Performers: Henkel VZO, BMW ST, Zalando SE
Worst Performers: Sartorius AG VZO, Dr Ing hc F Porsche Prf, Merck
Resistance levels: 18,285 (4H chart)
Support levels: 17,898 17,619 17,525 (4H chart)
GBPJPY
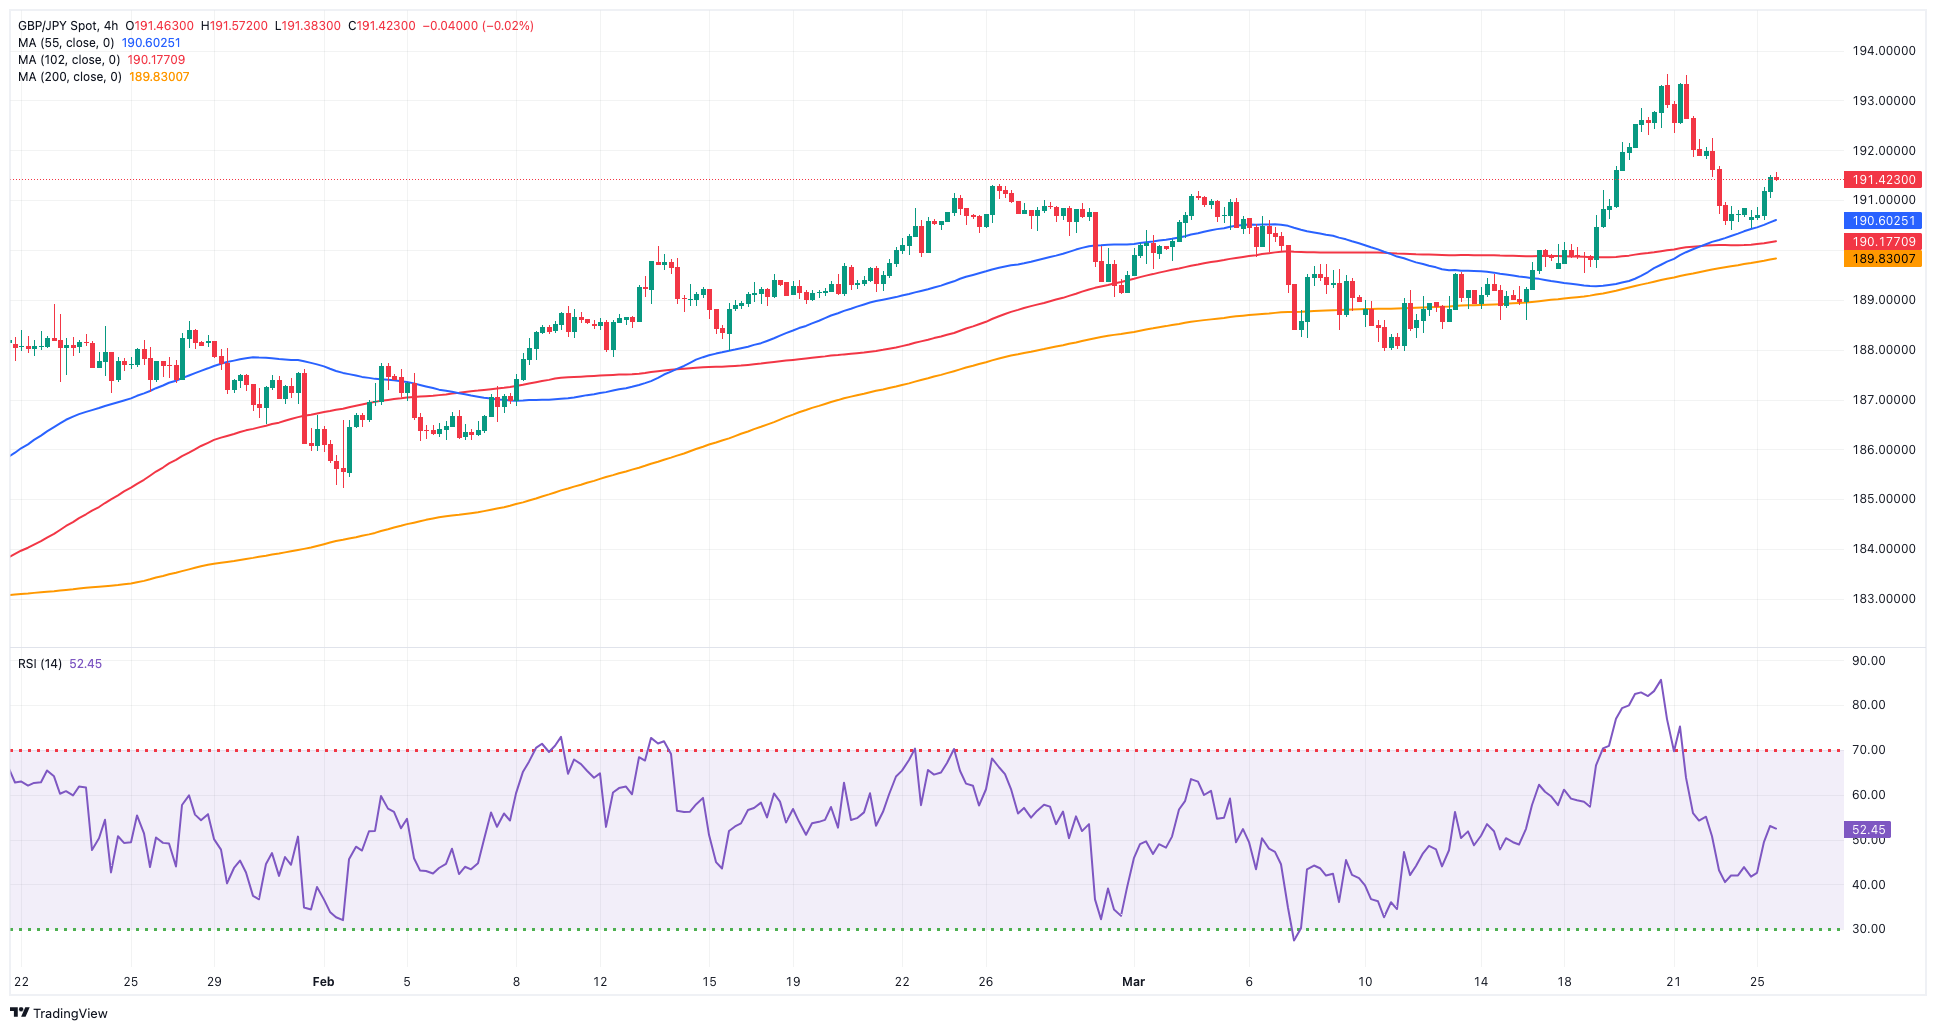
The dominating appetite for the risk-linked space lent support to the rebound in GBP/JPY on Monday.
In fact, the cross set aside two consecutive daily declines and printed decent gains at the beginning of the week, reclaiming the 191.50 zone after bottoming out near 190.30 towards the end of the previous week.
The resumption of the bid bias in the British pound and some vacillating price action around the Japanese currency were enough to spark a promising start to the new trading week in GBP/JPY.
Immediately to the upside for GBP/JPY comes the 2024 top of 193.53 (March 20) ahead of the August 2015 peak of 195.28 (August 18) and the record high of 195.88 (June 24, 2015). Having said that, there is temporary support at the 55-day SMA at 188.74, prior to the March low of 187.96 (March 11), and the 100-day SMA at 186.66. A breach of the latter might result in a test of the February low of 185.22 (February 1), which comes before the crucial 200-day SMA at 184.70. A deeper slide may bring the December 2023 bottom of 178.33 (December 14) back to the forefront, ahead of the October 2023 low of 178.03 and the July 2023 low of 176.30. The daily RSI bounced past the 57 level.
Resistance levels: 191.54 193.53 195.28 (4H chart)
Support levels: 190.39 189.54 187.98 (4H chart)
NASDAQ
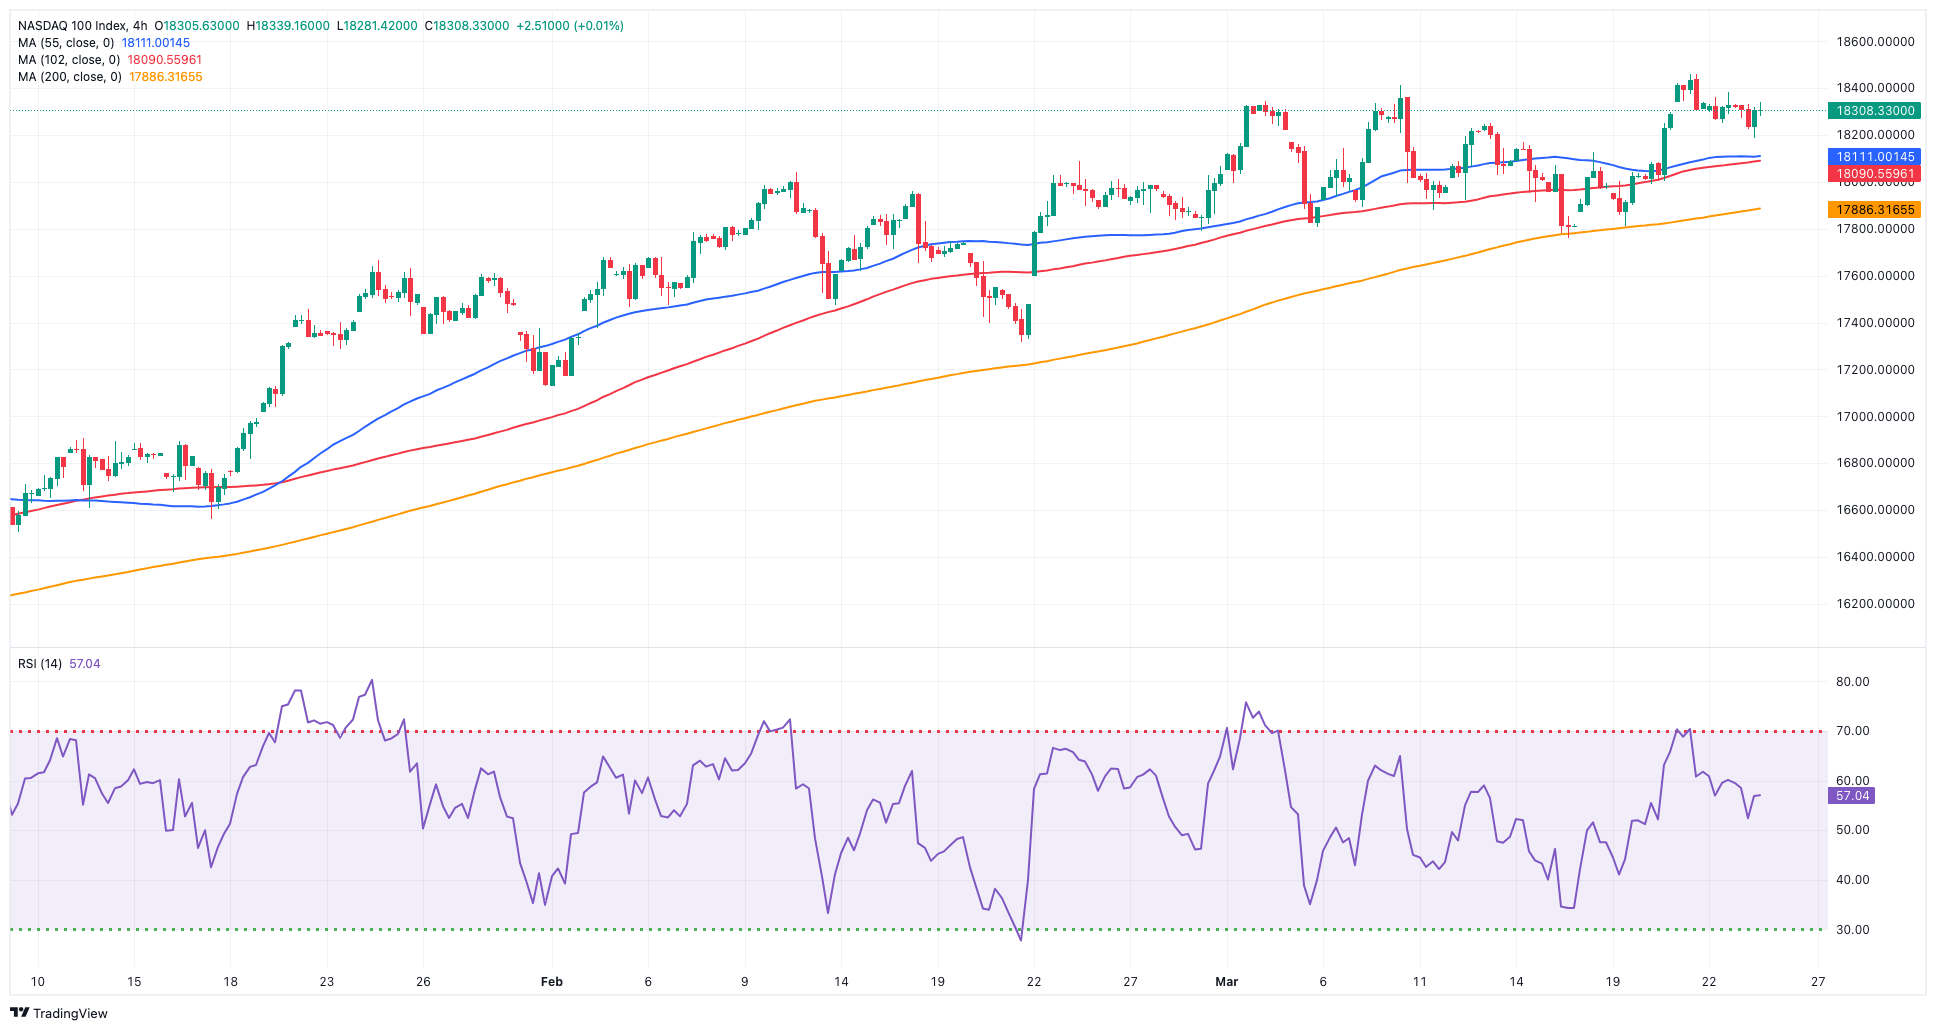
The tech benchmark Nasdaq 100 saw its first session of losses of the last six, moving in line with the broader pause observed in the rest of the US markets at the beginning of a new trading week.
In fact, the selling pressure resurged among market participants on Monday amidst marked losses in the greenback and the decent rebound in US yields across various maturity periods, while expectations of an interest rate cut by the Fed in June remained steady.
Further advances might encourage the Nasdaq 100 to dispute its all-time high of 18,464 (March 21). The other way around, the index is predicted to find provisional support at the 55-day SMA of 17,648, before falling to weekly lows of 17,319 (February 21) and 17,128 (January 31). Once the latter is breached, the index may fall to the 2024 low of 16,249 (January 5), ahead of the key 200-day SMA of 15,995 and the December 2023 low of 15,695 (December 4). Additional losses from here might test the October 2023 level of 14,058 (October 26), before the April 2023 low of 12,724 (April 25) and the March 2023 low of 11,695 (March 13). The everyday RSI settled around the 60 region.
Top Gainers: Micron, Constellation Energy, DexCom
Top Losers: Take-Two, Lululemon Athletica, PDD Holdings DRC
Resistance levels: 18,464 (4H chart)
Support levels: 17,764 17,319 17,128 (4H chart)
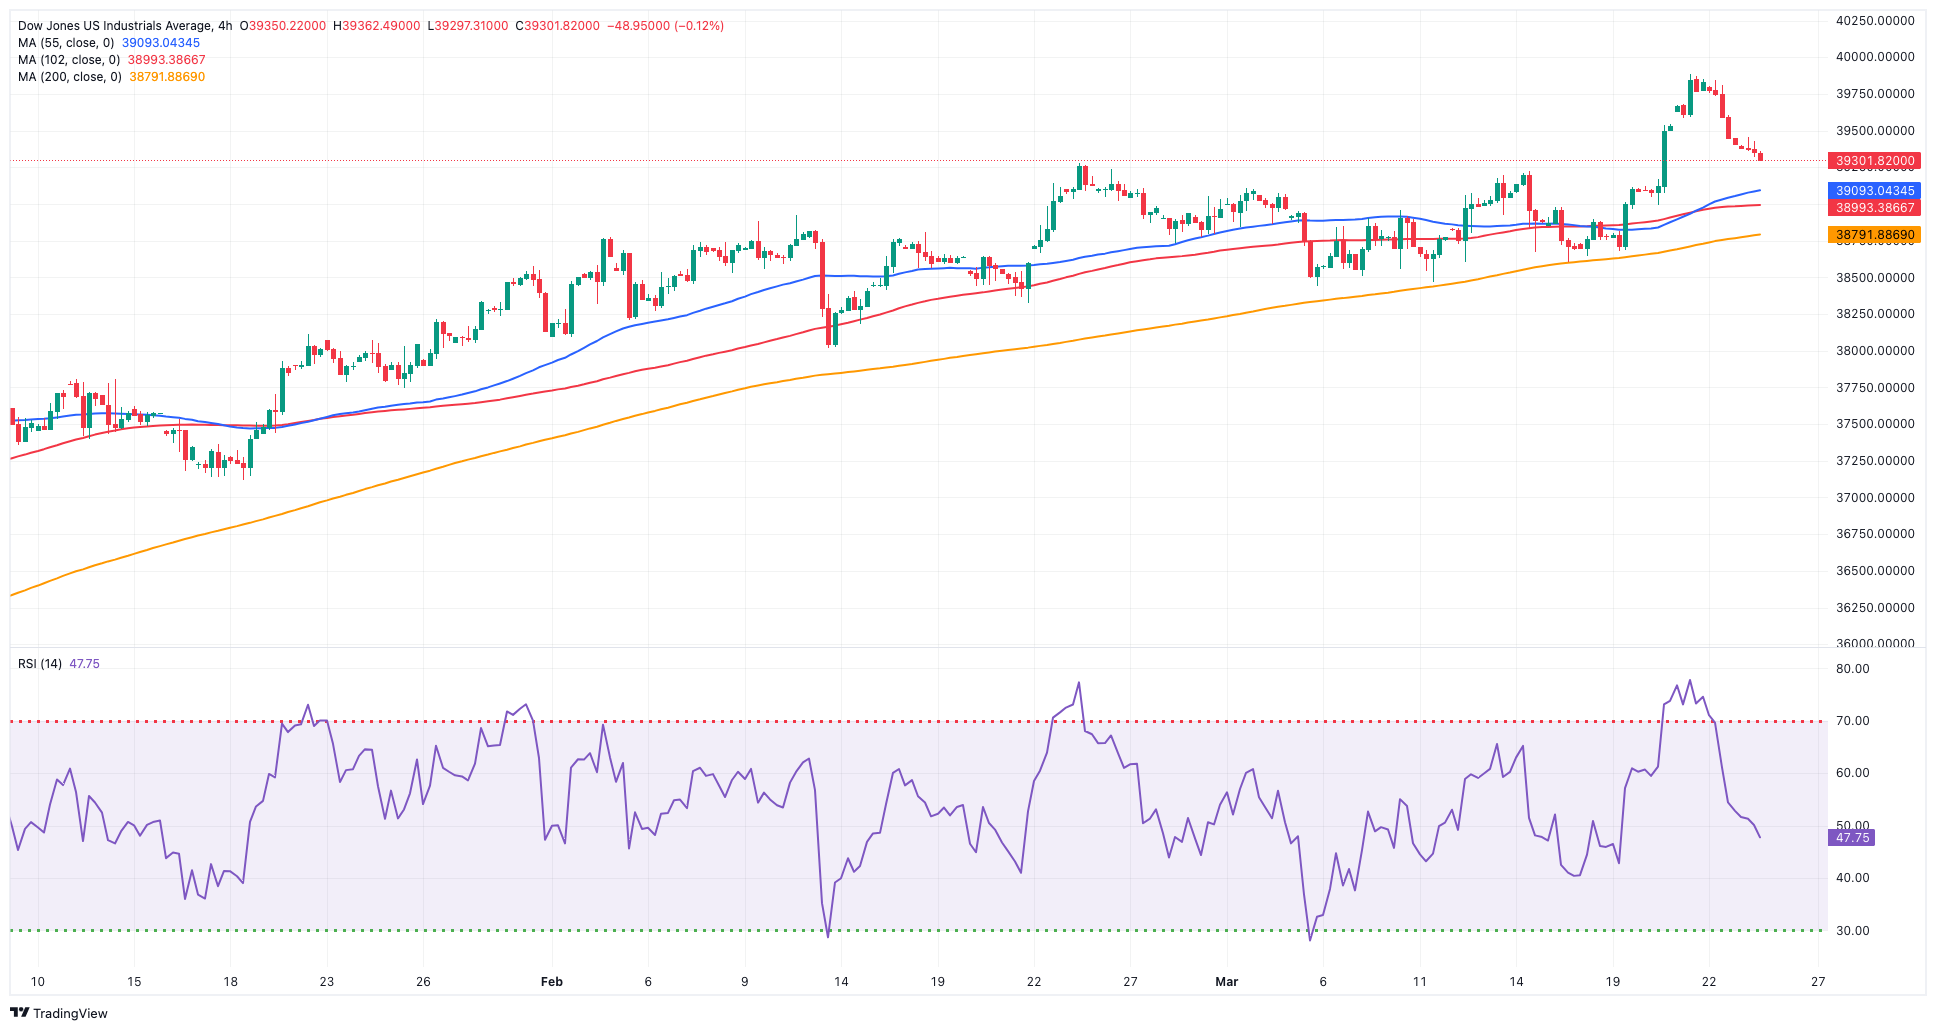
DOW JONES
The upside bias in US equities tracked by the Dow Jones extended their pause and added to Friday’s losses at the beginning of the week.
The knee-jerk in the Dow came in response to the broad-based wait-and-see mode from investors in light of the recent sharp advance and ahead of the release of US inflation data measured by the PCE towards the end of the week.
In addition, A. Goolsbee (Chicago) stated on Monday that he had planned for three rate cuts within the year, while FOMC L. Cook emphasized the importance of caution in the central bank's decision-making process regarding the timing of interest rate reductions.
At the beginning of the week, the Dow Jones dropped 0.37% to 39,332, the S&P 500 retreated 0.14% to 5,226, and the tech-oriented Nasdaq Composite gained 0.03% to 16,433.
Further gains might boost the Dow Jones to a record high of 39,889 (March 21). The 55-day SMA of 38,511 offers temporary support, followed by the 2024 low of 37,122 (January 18) and the weekly low of 37,073 (December 20, 2023). If the index falls below this level, it may confront the preliminary 100-day SMA at 37,315 before receding to the 200-day SMA at 35,800. The weekly low of 33,859 (November 7, 2023) comes next, followed by the October 2023 low of 32,327 (October 27) and the 2023 bottom of 31,429 (March 15). The daily RSI dropped to the 58 zone.
Top Performers: Walt Disney, Boeing, Chevron
Worst Performers: McDonald’s, Home Depot, Intel
Resistance levels: 39,889 (4H chart)
Support levels: 38,589 38,457 38,039 (4H chart)
MACROECONOMIC EVENTS

All Information & Updates provided by:

All information relating to the financial markets available on this page has been prepared and issued by FXStreet (Forexstreet SL, Spain, Reg: B62498233) on the basis of publicly available information and all information believed to be reliable and does not conflict with Kuwaiti local laws, and all necessary care has been taken to before the company to ensure that the facts mentioned are correct from the source.
NCM Investment nor any of its directors or employees shall in any way be held responsible for the contents of this news, and the information contained on this page is intended only to provide clients with publicly available information and should not be construed as investment advice, report or analysis and/or constitute an offer or invitation to buy or sell financial instruments of any kind.
RISK WARNING: Forex and CFDs are highly risky leveraged products, as losses can exceed deposits. Please ensure you understand all the risks and take independent advice if necessary. NCM will segregate the clients based on the criteria of the regulator and its bylaws. NCM does not provide any advisory service; the material published does not constitute advice or a recommendation for a transaction in any financial instrument. NCM accepts no responsibility for any use of the content presented and any consequences of that use. Anyone acting on the information provided does so at their own risk.