
- Contact Us:
-

-

-

-


Daily Market Updates
27 Mar 2024
EURUSD
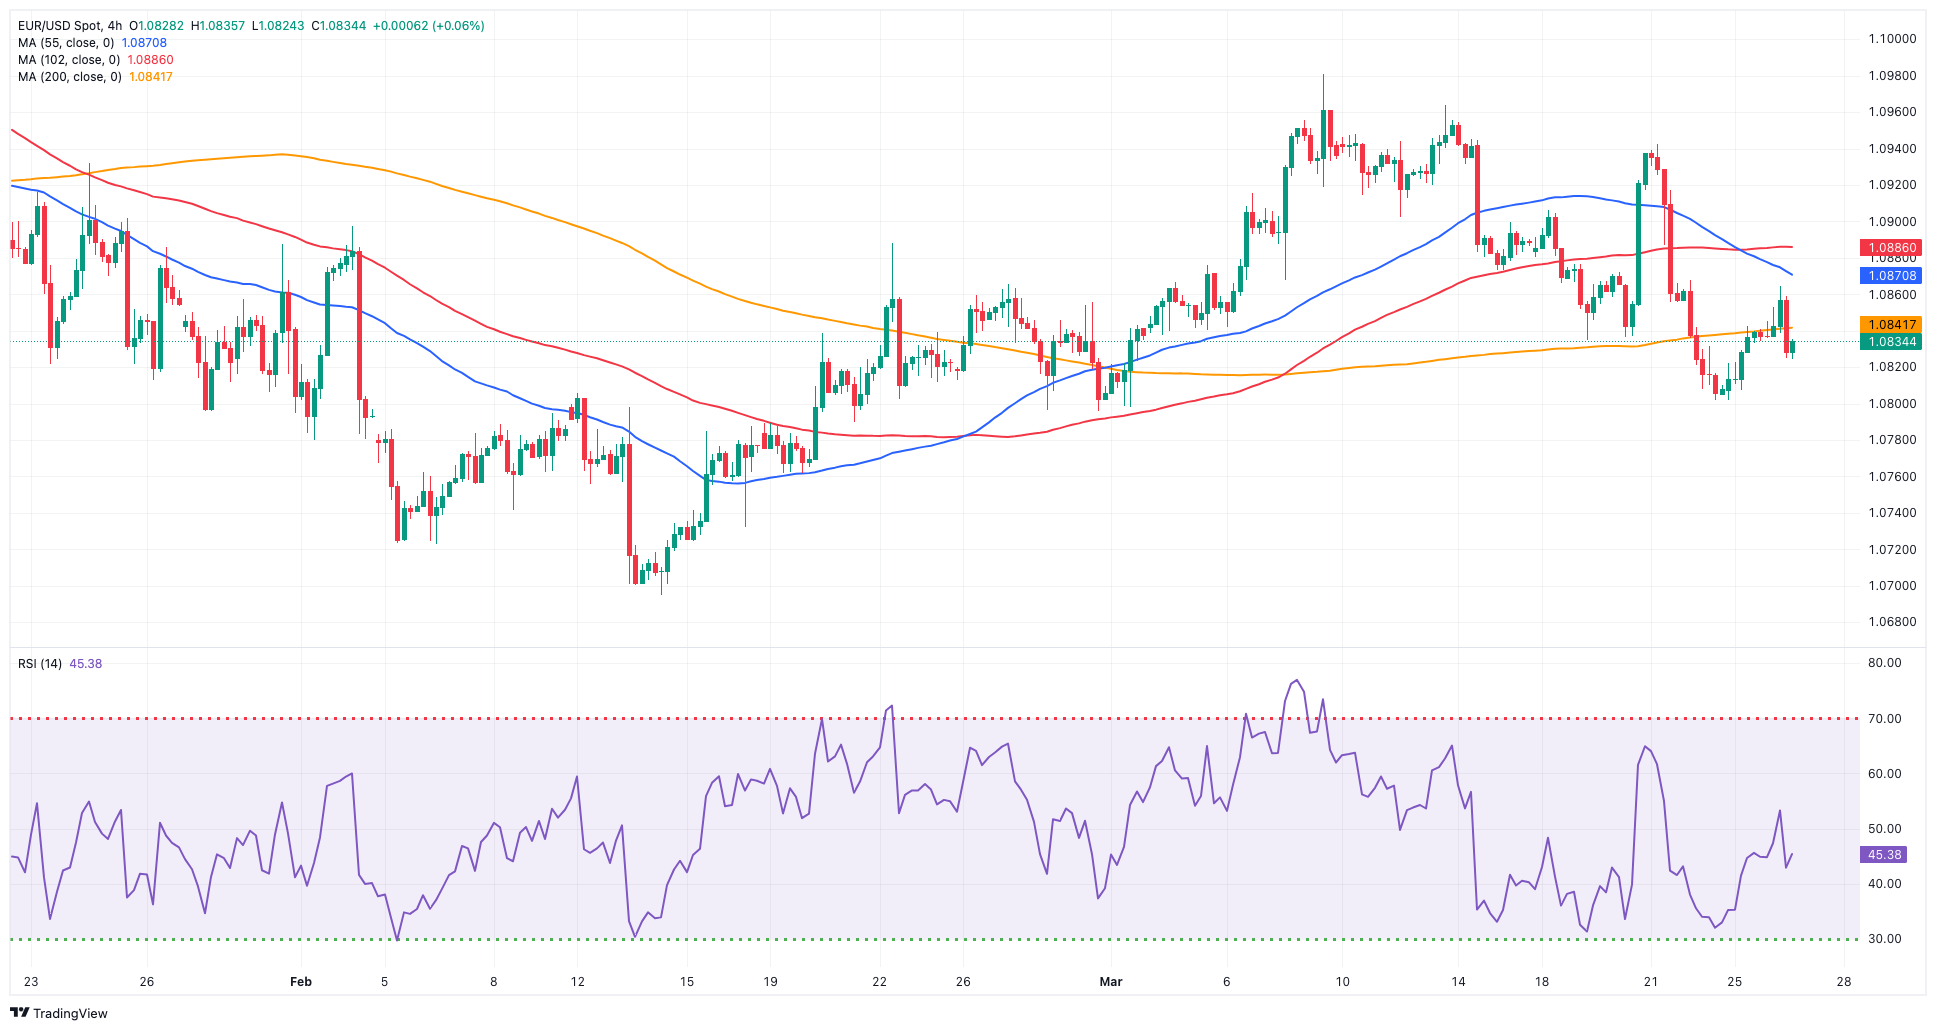
In line with the rest of the FX universe, EUR/USD traded in quite an inconclusive fashion, maintaining its business around the 1.0830-1.0840 region amidst humble losses on turnaround Tuesday.
The greenback followed suit and advanced marginally on the day, hovering around the 104.30 zone against the backdrop of the negative mood in US yields across the curve.
Concerning monetary policy, market observers maintained expectations of a Fed rate cut in June, followed by two more reductions later in the year. Meanwhile, the ECB is seen as possibly beginning its easing measures at some stage during the summer.
On the latter, board member Muller argued the ECB is approaching the point where it can start reducing rates, while his colleague Stournaras noted that there seems to be consensus for a rate cut in June.
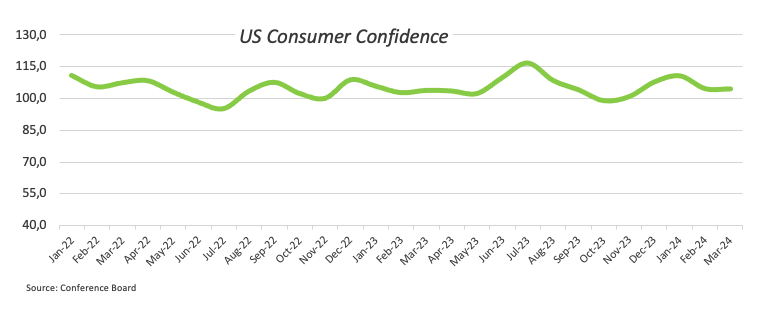
In the meantime, the pair practically ignored data releases after Consumer Confidence in Germany improved to -27.4 in April, according to GfK, and US Consumer Confidence measured by the Conference Board fell short of expectations at 104.7 for the current month. Additionally, in the US, the FHFA House Price Index contracted by 0.1% MoM in January, and Durable Goods Orders expanded more than estimated by a monthly 1.4% in February.
Further recover could prompt EUR/USD to revisit the March high of 1.0981 (March 8), ahead of the weekly top of 1.0998 (January 5, 2011) and the psychological 1.1000 barrier. The breakout of this zone may put a strain on the December 2023 peak of 1.1139 (December 27), which is still supported by the 200-week SMA of 1.1146 and comes before the 2023 high of 1.1275 (July 18). On the downside, extra losses may reach the March low of 1.0797 (March 1) before sliding to the 2024 low of 1.0694 (February 14). A deeper slide could reveal the weekly low of 1.0495 (October 13, 2023), which comes before the 2023 low of 1.0448 (October 3) and the round milestone of 1.0400. The daily RSI dropped slightly to the proximity of 46.
Resistance levels: 1.0864 1.0942 1.0963 (4H chart)
Support levels: 1.0801 1.0795 1.0694 (4H chart)
USDJPY
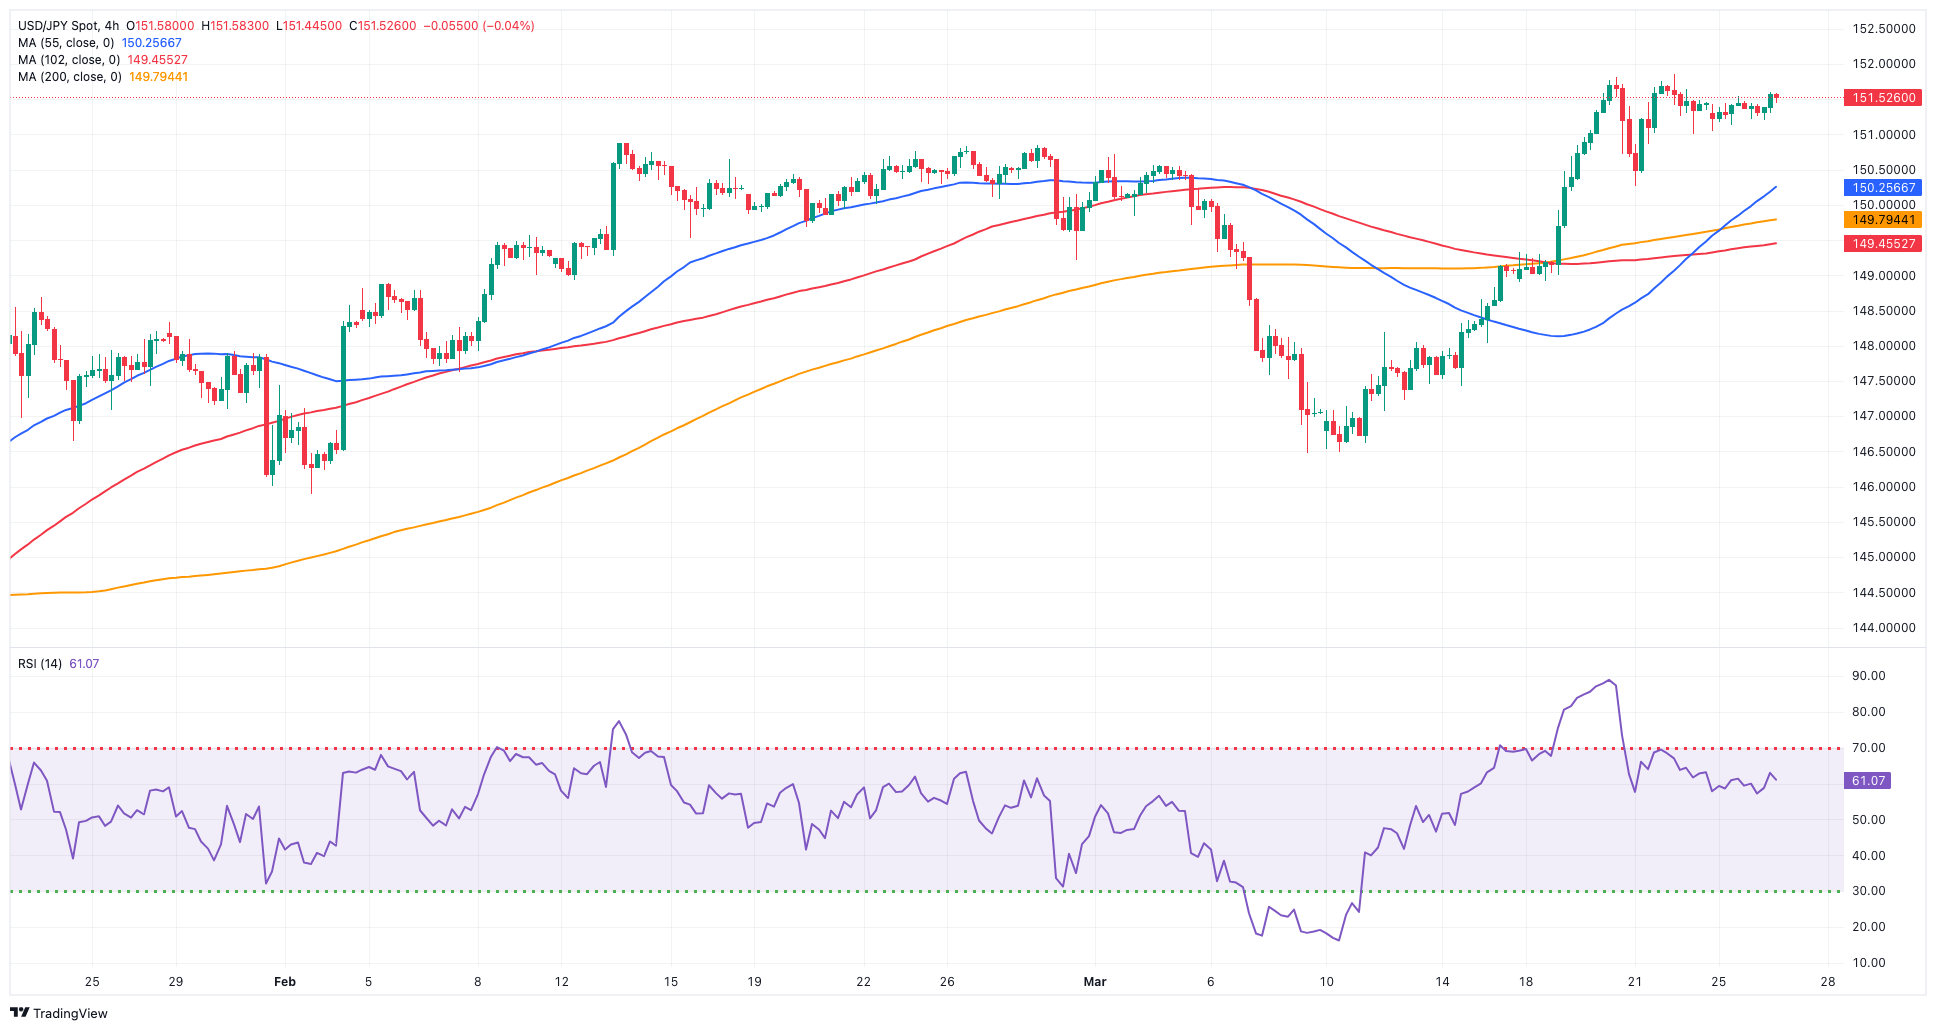
USD/JPY extended its consolidative phase, maintaining its trade north of the 151.00 barrier on Tuesday.
In fact, spot traded with modest gains near 151.50 on the back of the equally absence of volatility in the greenback, while US yields saw a small pullback in the short end of the curve vs. humble advances in the belly and the long end.
In the Japanese money market, JGB 10-year yields kept the range-bound theme near 0.74%.
Meanwhile, investors remained prudent, as a potential move to the 152.00 barrier could trigger an intervention by the government. On this, Finance Minister Suzuki cautioned that the government is closely monitoring currency fluctuations with a heightened sense of urgency and remains open to all possible measures to address excessive movements in the foreign exchange market. His comments fell in line with Monday’s views of Vice Finance Minister for International Affairs, Kanda, after he expressed concern, cautioning that the ongoing devaluation of the yen contradicts fundamental economic principles and is evidently driven by speculative actions.
The Japanese docket was empty on Tuesday.
USD/JPY faces its immediate up-barrier at the 2024 high of 151.86 (March 20), just ahead of the 2023 top of 151.90 (November 13). Further up, the 2022 peak of 151.94 (October 21) anticipates the round figure of 152.00. On the contrary, the key 200-day SMA at 146.73 emerges as the initial support prior to the March low of 146.47 (March 8). A breakdown of this zone might result in a return to the February low of 145.89 (February 1), which precedes the December 2023 low of 140.24 (December 28), the round number 140.00, and the July low of 137.23 (July 14). The daily RSI seems constant above 65.
Resistance levels: 151.86 151.90 151.94 (4H chart)
Support levels: 150.26 149.78 148.91 (4H chart)
GBPUSD
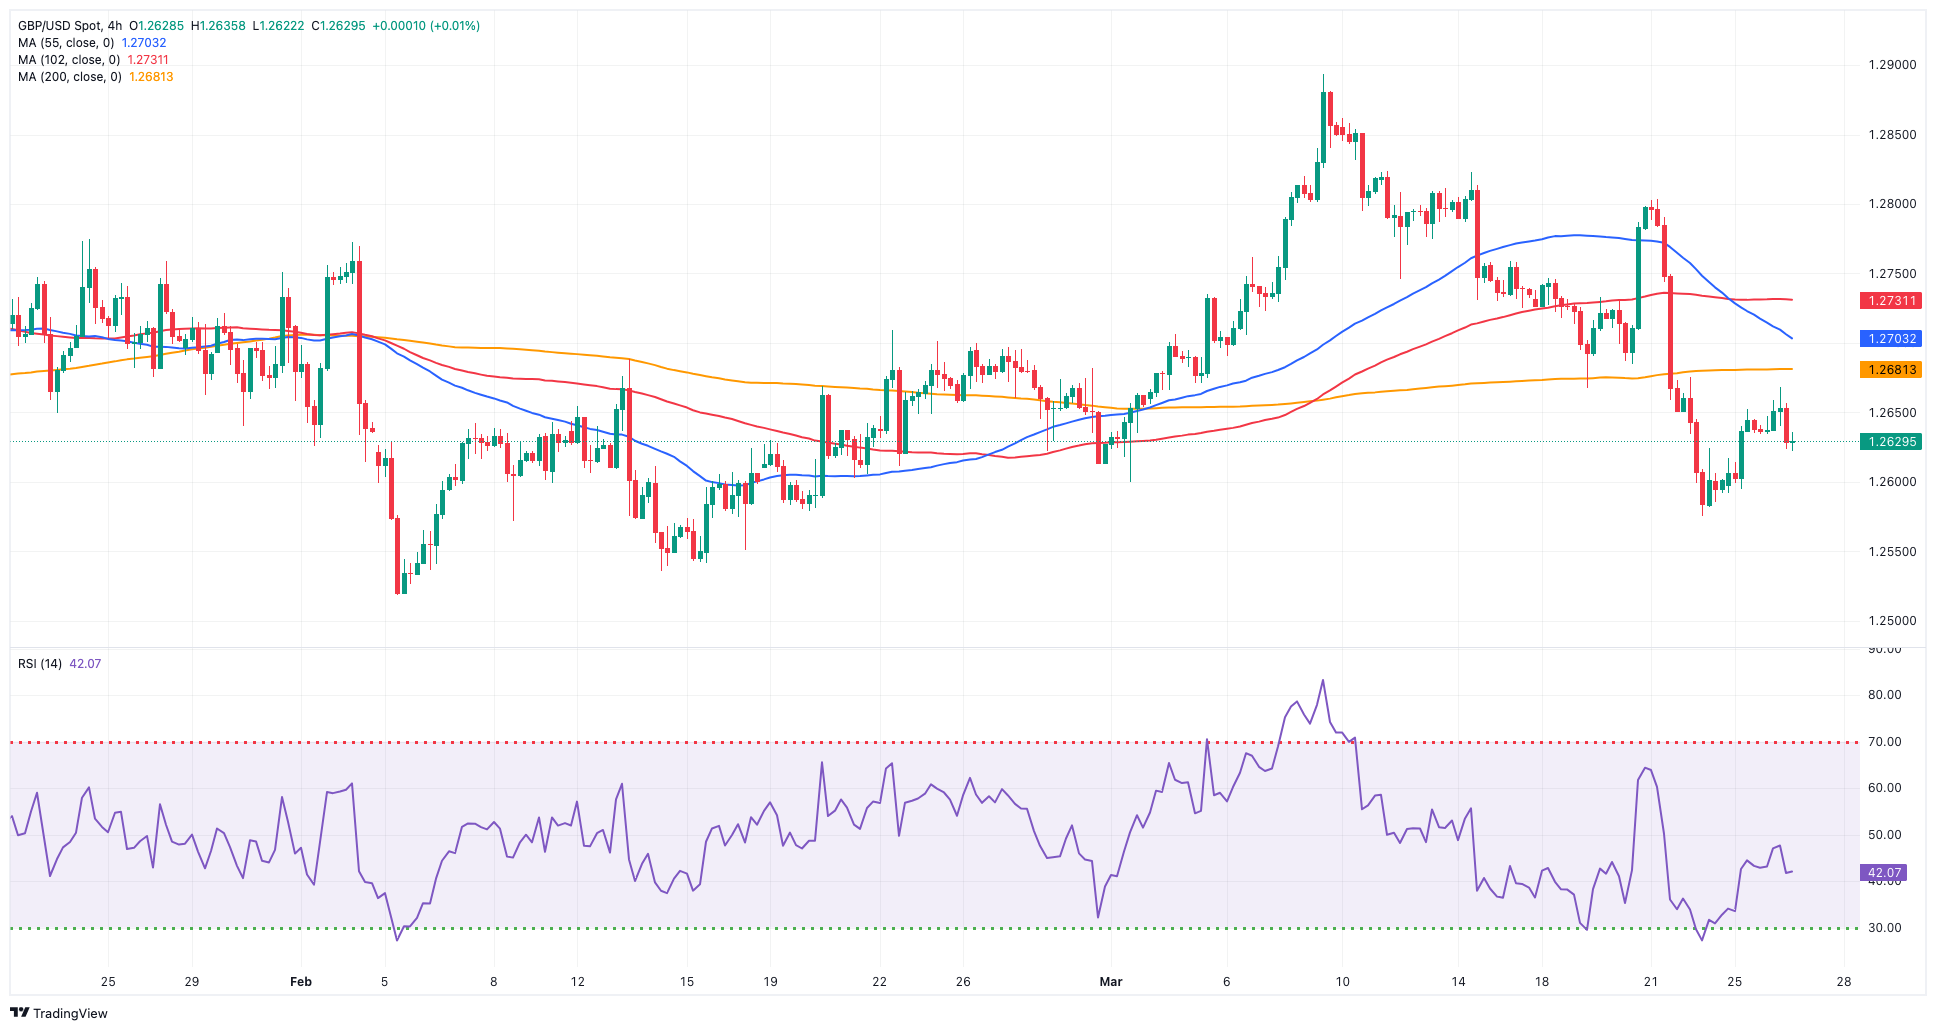
Alternating risk appetite trends prompted GBP/USD to trade marginally on the back foot near 1.2630 on Tuesday.
The scarce volatility in Cable followed the equally vacillating mood in the broader risk complex and the US dollar, while US yields performed on a mixed note and UK 10-year gilt yields dropped slightly.
From the BoE, hawk member C. Mann expressed her belief that there has been a significant relaxation in monetary policy since the vote last week, and she suggests that markets may be overly complacent about the anticipated duration of the BoE’s overall stance on interest rates. It is worth noting that Mann recently aligned with the majority of the MPC members who opted to maintain the bank rate at 5.25%, its highest level since 2008. Previously, she had voted in favour of an increase to 5.5%.
There were no data releases across the Channel on Tuesday.
The loss of the March low of 1.2575 (March 22) should open the way for a move to the 2024 low of 1.2518 (February 5) and the December 2023 low of 1.2500 (December 13). A deeper retracement would not find major support until the weekly low of 1.2187 (November 10, 2023), followed by the October 2023 low of 1.2037 and the main 1.2000 resistance level. In the other direction, the next upward barrier is the 2024 top of 1.2893 (March 8), followed by the weekly high of 1.2995 (July 27, 2023), all before reaching the critical 1.3000 mark. The day-to-day RSI rose above 43.
Resistance levels: 1.2679 1.2803 1.2823 (4H chart)
Support levels: 1.2575 1.2535 1.2518 (4H chart)
GOLD
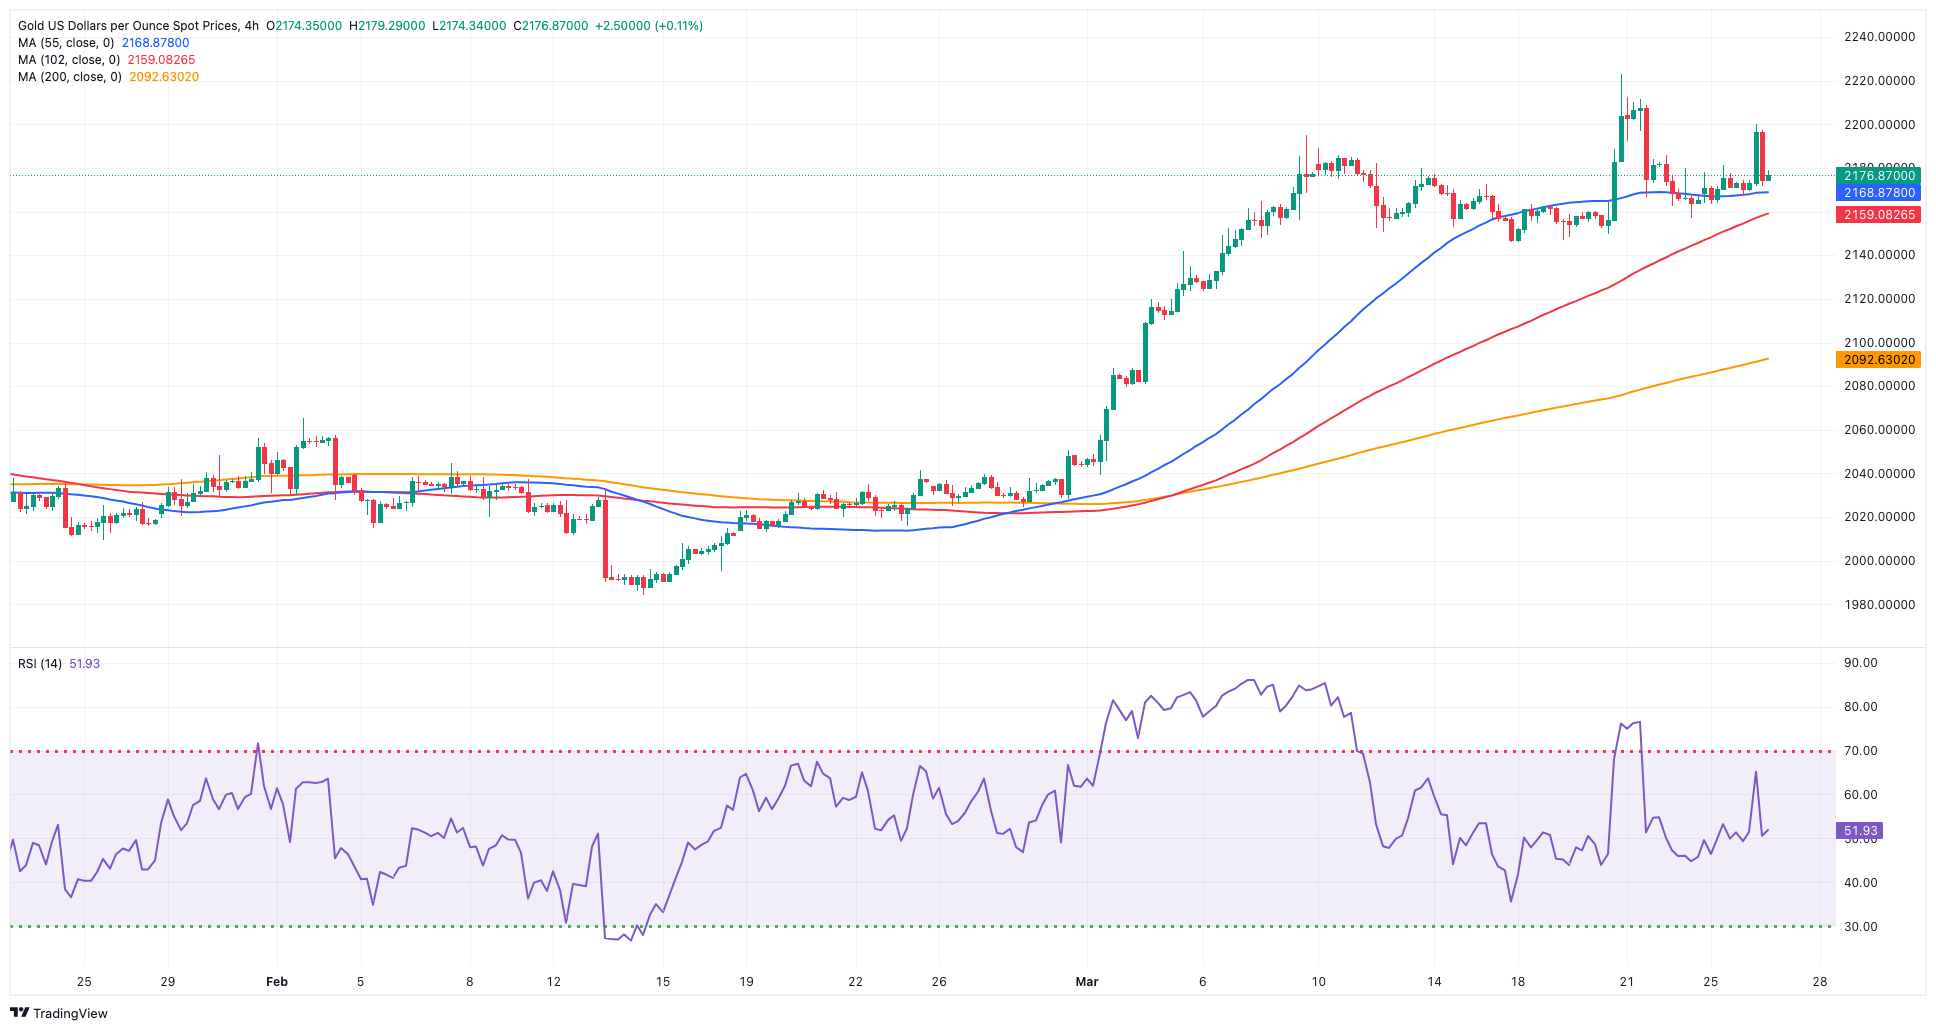
Gold prices added to the promising start of the week and advanced to three-day highs around $2,200 per troy ounce on Tuesday.
That earlier uptick, however, ran out of steam on the back of the small bounce in the greenback, while the corrective decline in US yields across the board and the inconclusive risk trend seem to have limited the downside.
In the meantime, prices of the yellow metal remain bolstered by sustained physical demand from Chinese households and central bank purchases, particularly by the PBoC, which continues to provide support for gold as it steadily builds its reserves.
During the upcoming sessions, bullion is expected to closely monitor the release of significant US data, such as inflation measured by the PCE, along with updates concerning the Fed’s plans to reduce its interest rate.
Immediately to the upside for Gold aligns the weekly top of $2,200 (March 26) ahead of the all-time peak of $2,222 (March 21). On the downside, the weekly low of $2,146 (March 18) comes first prior to the provisional 55-day and 100-day SMAs of $2,069 and $2,045, respectively. Further south comes the 2024 low of $1,984 (February 14), which appears reinforced by the crucial 200-day SMA ($1,985). Once the latter is addressed, a possible visit to the December 2023 low of $1,973 might begin before the November 2023 low of $1,931. The breakdown in this region might bring the yellow metal to test its October 2023 bottom of $1,810, which comes before the 2023 low of $1,804 and the important $1,800 conflict zone.
Resistance levels: $2,200 $2,222 (4H chart)
Support levels: $2,157 $2,146 $2,092 (4H chart)
CRUDE WTI
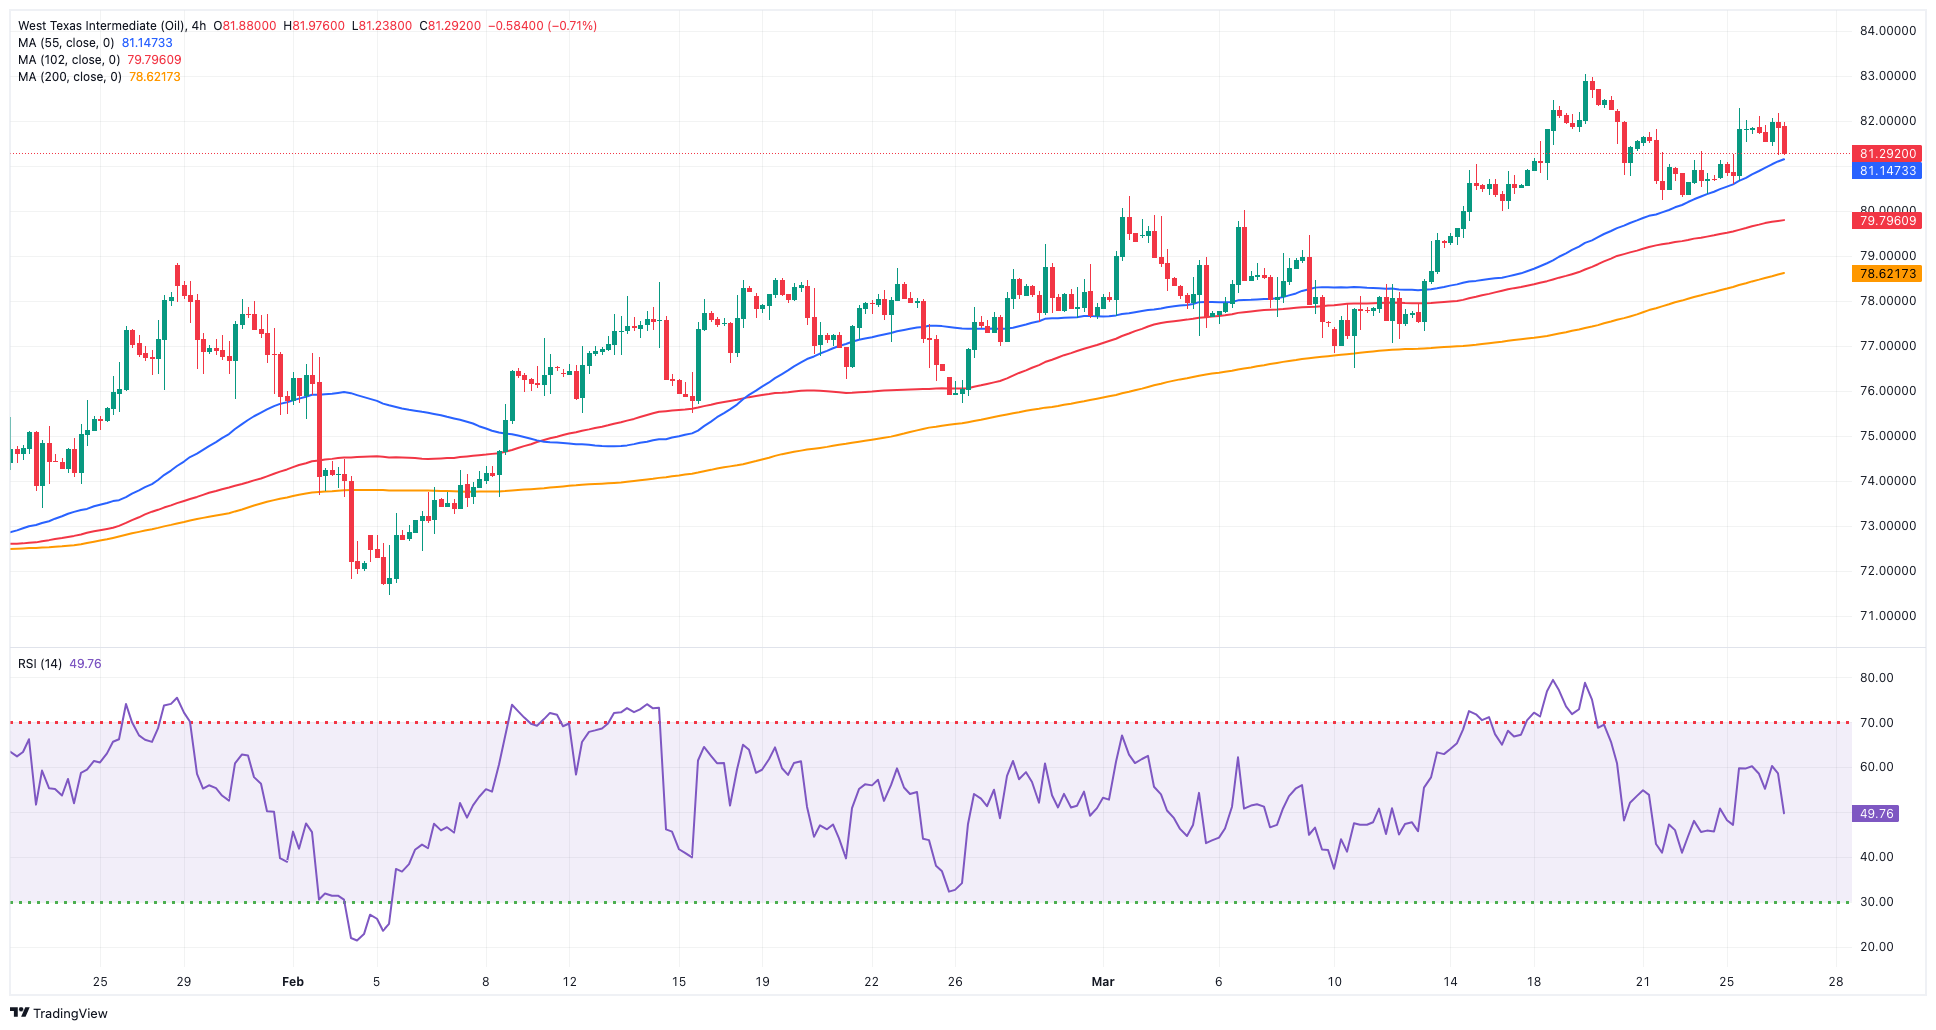
Prices of WTI remained steady around the $82.00 region per barrel against the backdrop of the broad-based lack of volatility in the global markets.
In the meantime, traders continued to follow the impact of recent attacks on Russian refineries in the context of the Russia-Ukraine war, while the unabated crisis in the Red Sea also bolstered prices, along with diminishing bets on a ceasefire in the Israel-Hamas conflict.
According to news from the OPEC+, the cartel is not expected to implement any modifications to its oil output policy until a complete ministerial meeting takes place in June. It is worth recalling that the OPEC+ has announced that it will convene an online joint ministerial monitoring committee meeting (JMMC) on April 3 to assess the current state of the oil market and evaluate the compliance of OPEC members with the agreed-upon production cuts.
The next upward challenge for WTI is the 2024 peak of $83.09 (March 19), which comes before the weekly high of $89.83 (October 18, 2023) and the 2023 top of $94.99 (September 28, 2023). Further north, the weekly peak of $97.65 (August 30) aligns before the psychological $100.00 barrier. On the flip side, the 200-day SMA provides first support at $78.66, ahead of the February low of $71.43 (February 5). Extra losses highlight the important $70.00 milestone ahead of the 2024 bottom of $69.31 (January 3).
Resistance levels: $82.43 $83.09 $83.56 (4H chart)
Support levels: $80.27 $78.81 $76.76 (4H chart)
GER40
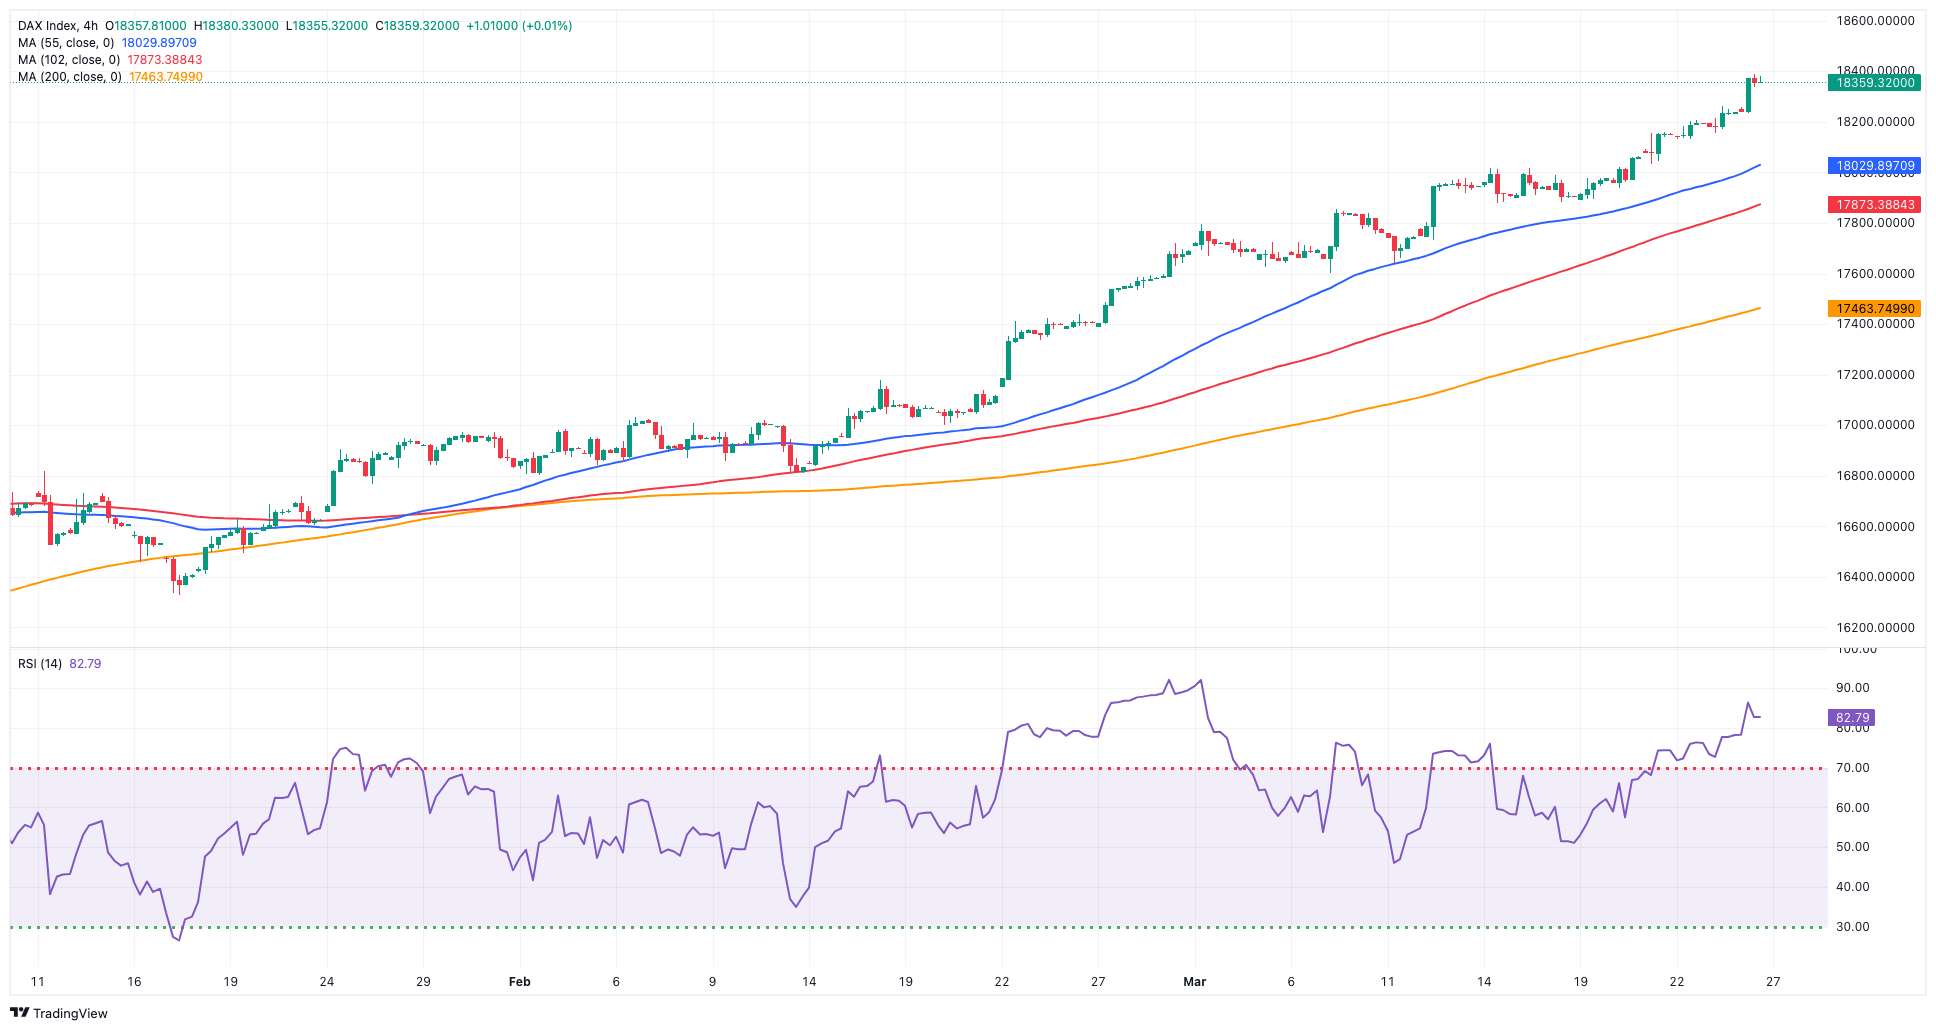
The German stock reference, the DAX40, clinched an all-time high near the 18,500 zone on Tuesday, extending its positive streak for six sessions in a row.
Additional increases in the index were driven by the widespread belief that major central banks ought to initiate their easing cycles later in the year due to ongoing disinflationary pressures, while the strong performance of the financial sector contributed to the upward momentum.
So far, bets on a 25-bps rate cut by the ECB at its June meeting hover around 60%.
Collaborating with the daily gains, GfK’s Consumer Confidence in the country improved a tad for the month of March.
The DAX40's next point of resistance is the record high of 18,411 (March 26). Having said that, the 55-day SMA at 17,281 should provide transitory contention until the February low of 16,821 (February 1). A dip below this level might take the index below the 2024 low of 16,345 (January 17), which is ahead of the crucial 200-day SMA at 16,243. Once the latter is defeated, the weekly low of 15,915 (November 28) may be tested, followed by the October low of 14,630 (October 23) and the 2023 low of 14,458 (March 20). The daily RSI increased past 83, indicating that the market remained significantly overbought.
Best Performers: Rheinmetall AG, Vonovia, Bayer
Worst Performers: Qiagen, Symrise AG, Covestro
Resistance levels: 18,411 (4H chart)
Support levels: 17,938 17,619 17,525 (4H chart)
GBPJPY
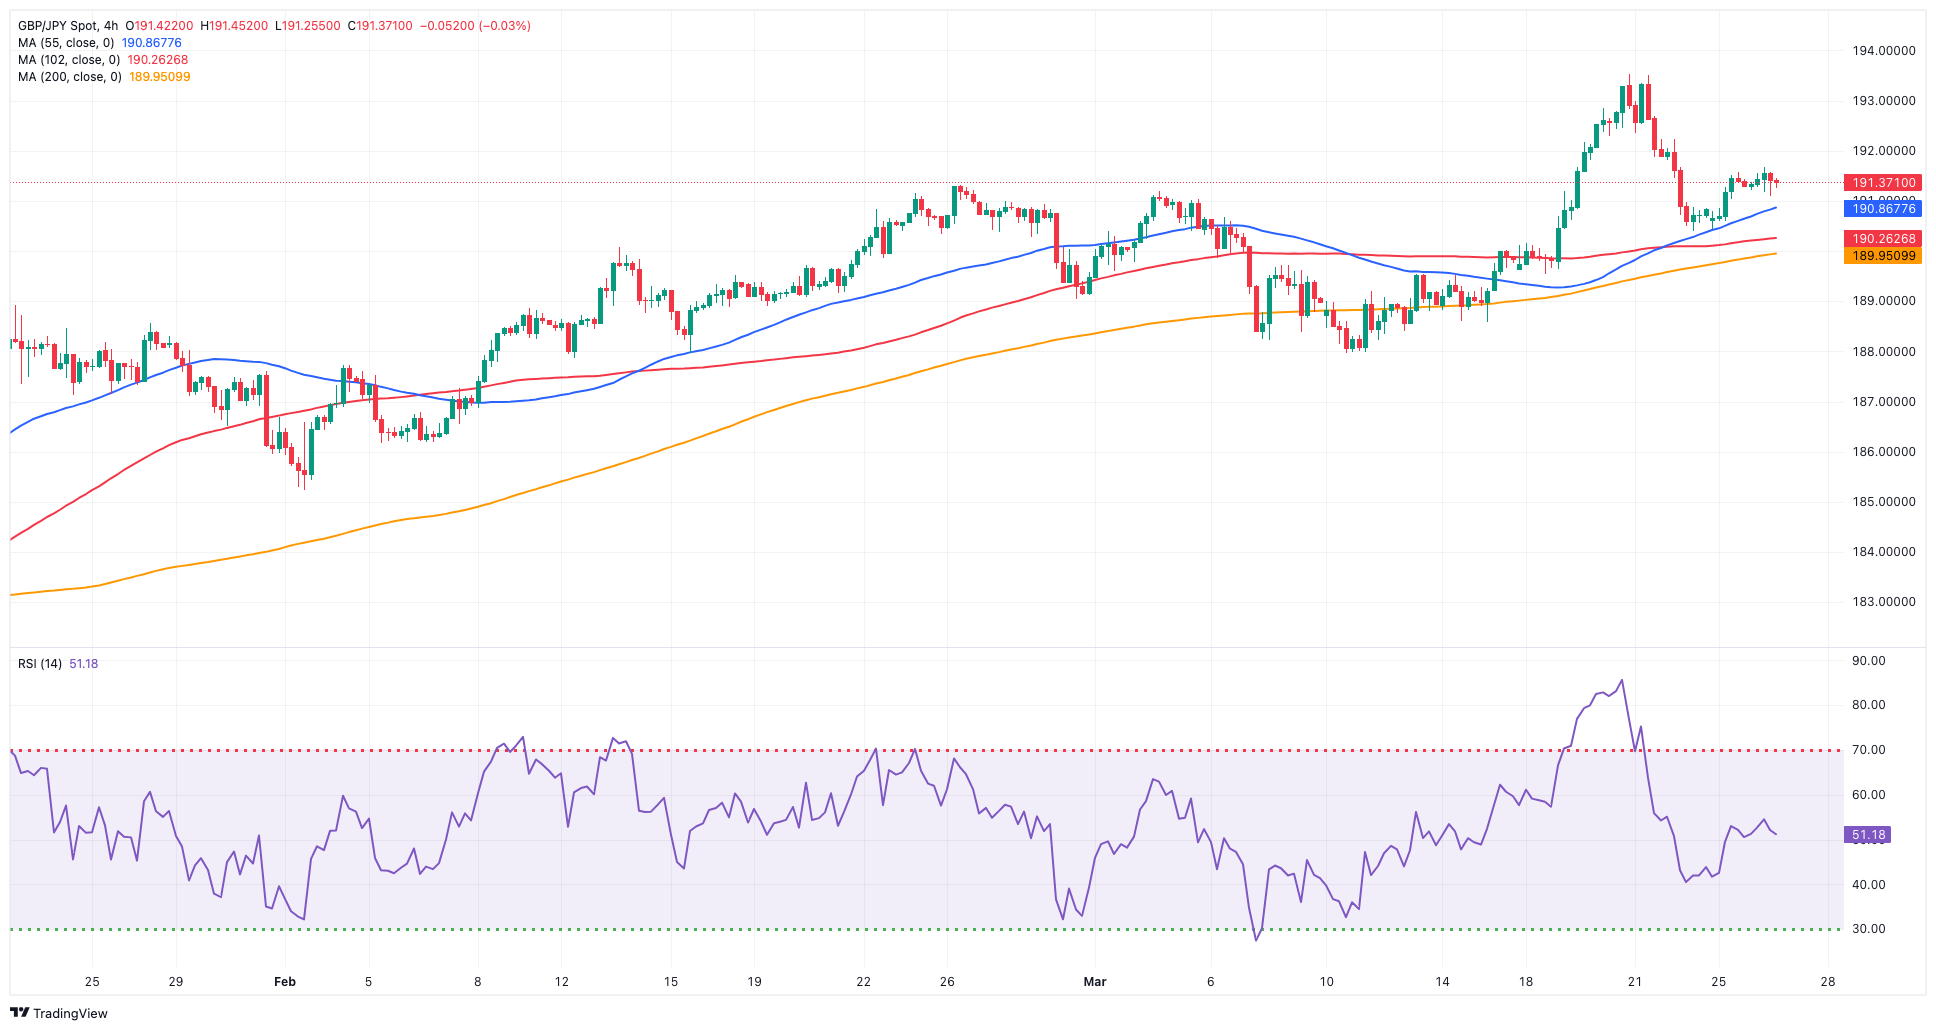
GBP/JPY navigated a narrow range around the 191.40 zone on Tuesday.
The lack of traction in the cross mirrored the performance of the rest of the global markets in the context of rising prudence ahead of key US data releases later in the week.
In addition, further depreciation in the Japanese currency remained under the microscope amidst FX intervention concerns, while alternating trends in the risk appetite barely affected the quid.
The 2024 top of 193.53 (March 20) comes ahead of the August 2015 peak of 195.28 (August 18) and the record high of 195.88 (June 24, 2015). Instead, there is temporary support at the 55-day SMA at 188.88, which precedes the March low of 187.96 (March 11), as well as the 100-day SMA at 186.72. A breakdown of the latter might prompt a test of the February low of 185.22 (February 1) to emerge on the horizon prior to the critical 200-day SMA at 184.74. A deeper decline might bring the December 2023 low of 178.33 (December 14) back into focus, ahead of the October 2023 low of 178.03 and the July 2023 low of 176.30. The everyday RSI rebounded a tad past 57.
Resistance levels: 191.67 193.53 195.28 (4H chart)
Support levels: 190.39 189.54 187.98 (4H chart)
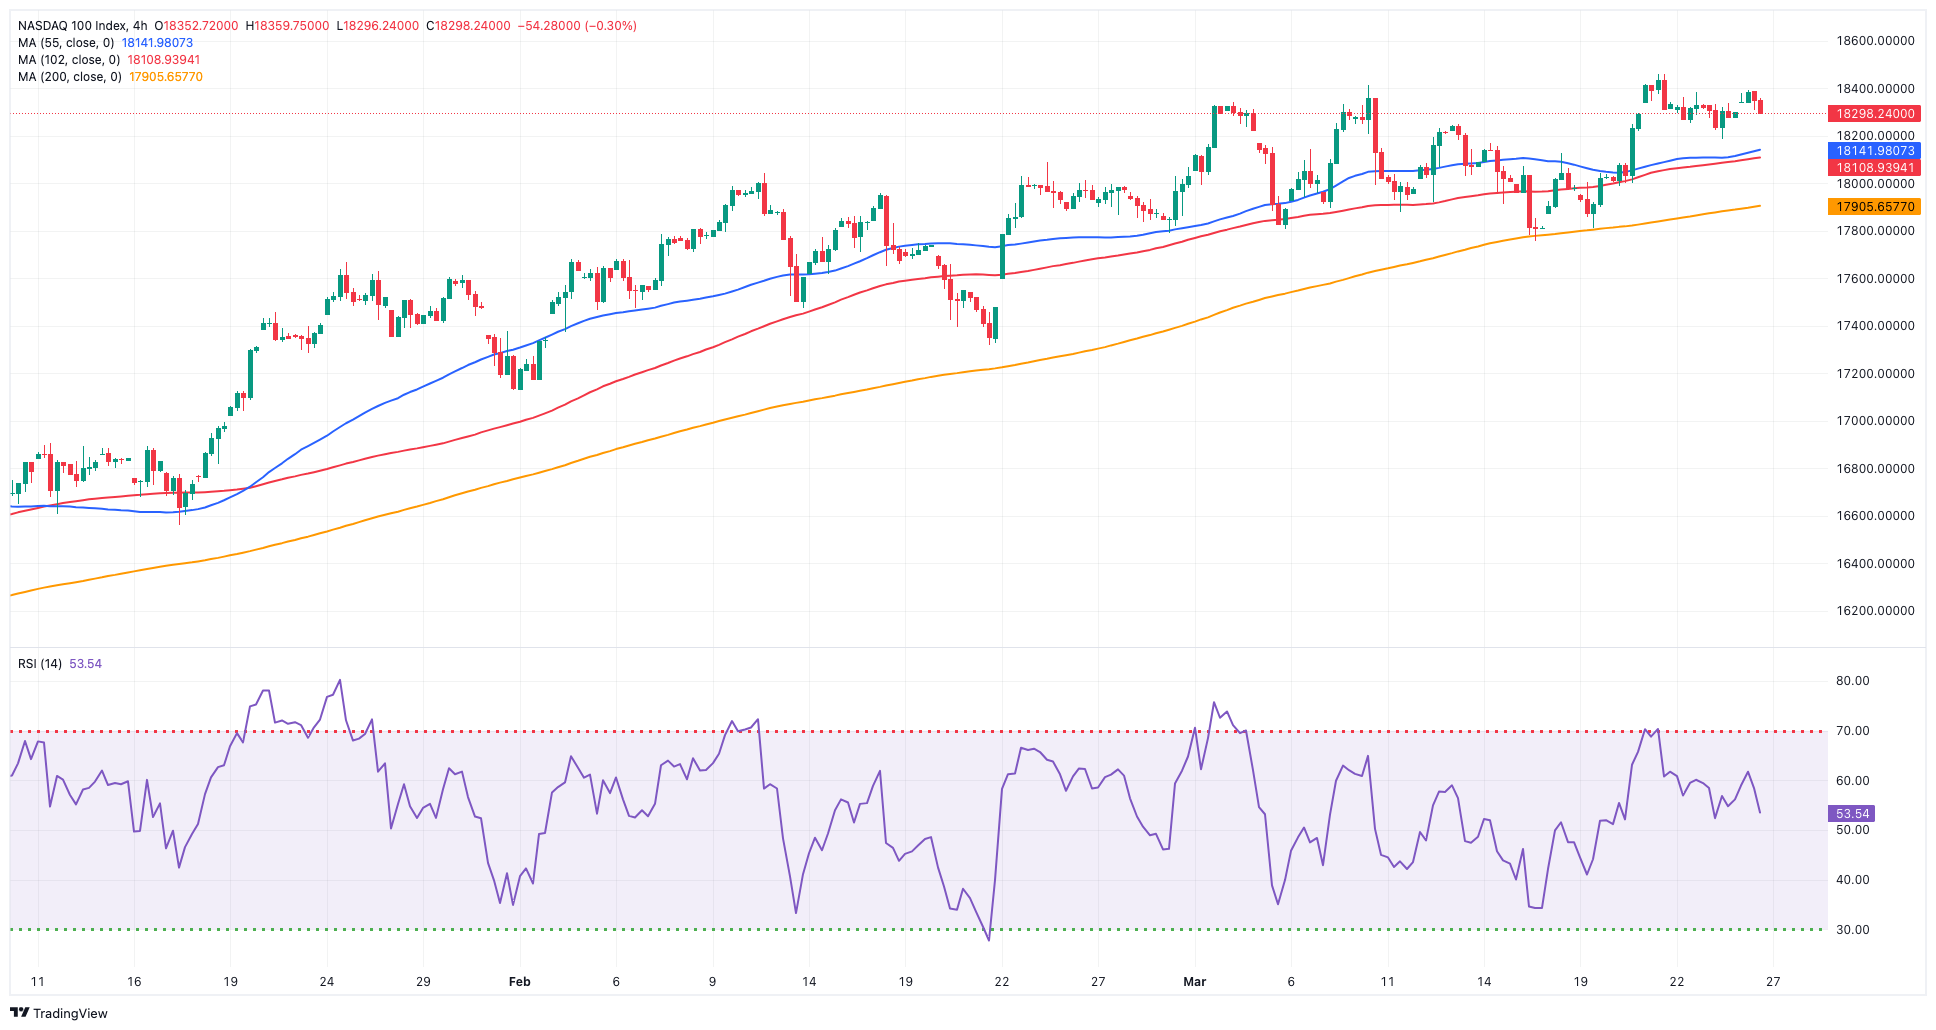
NASDAQ
The US tech sector regained its smile on turnaround Tuesday, prompting the benchmark Nasdaq 100 to rapidly fade Monday’s pullback and refocus on the upside.
In the meantime, chipmakers led the way, while the bearish note from US yields across the curve also contributed to the daily uptick in the index amidst a slight advance in the greenback.
So far, some consolidative mood is expected to kick in as markets approach the publication of US PCE towards the end of the week and amidst the Easter holidays.
Further gains could push the Nasdaq 100 to challenge its all-time high of 18,464 (March 21). The other way around, the index is expected to find temporary support at the 55-day SMA of 17,684, before sliding to weekly lows of 17,319 (February 21) and 17,128 (January 31). If the latter is crossed, the index could fall to its 2024 low of 16,249 (January 5), ahead of the critical 200-day SMA of 16,014 prior to the December 2023 low of 15,695 (December 4). Additional losses from here may test the October 2023 level of 14,058 (October 26), before the April 2023 low of 12,724 (April 25) and the March 2023 low of 11,695 (March 13). The daily RSI rebounded tepidly above 59.
Top Gainers: Marvell, Tesla, Micron
Top Losers: Biogen, Moderna, CSX
Resistance levels: 18,464 (4H chart)
Support levels: 17,764 17,319 17,128 (4H chart)
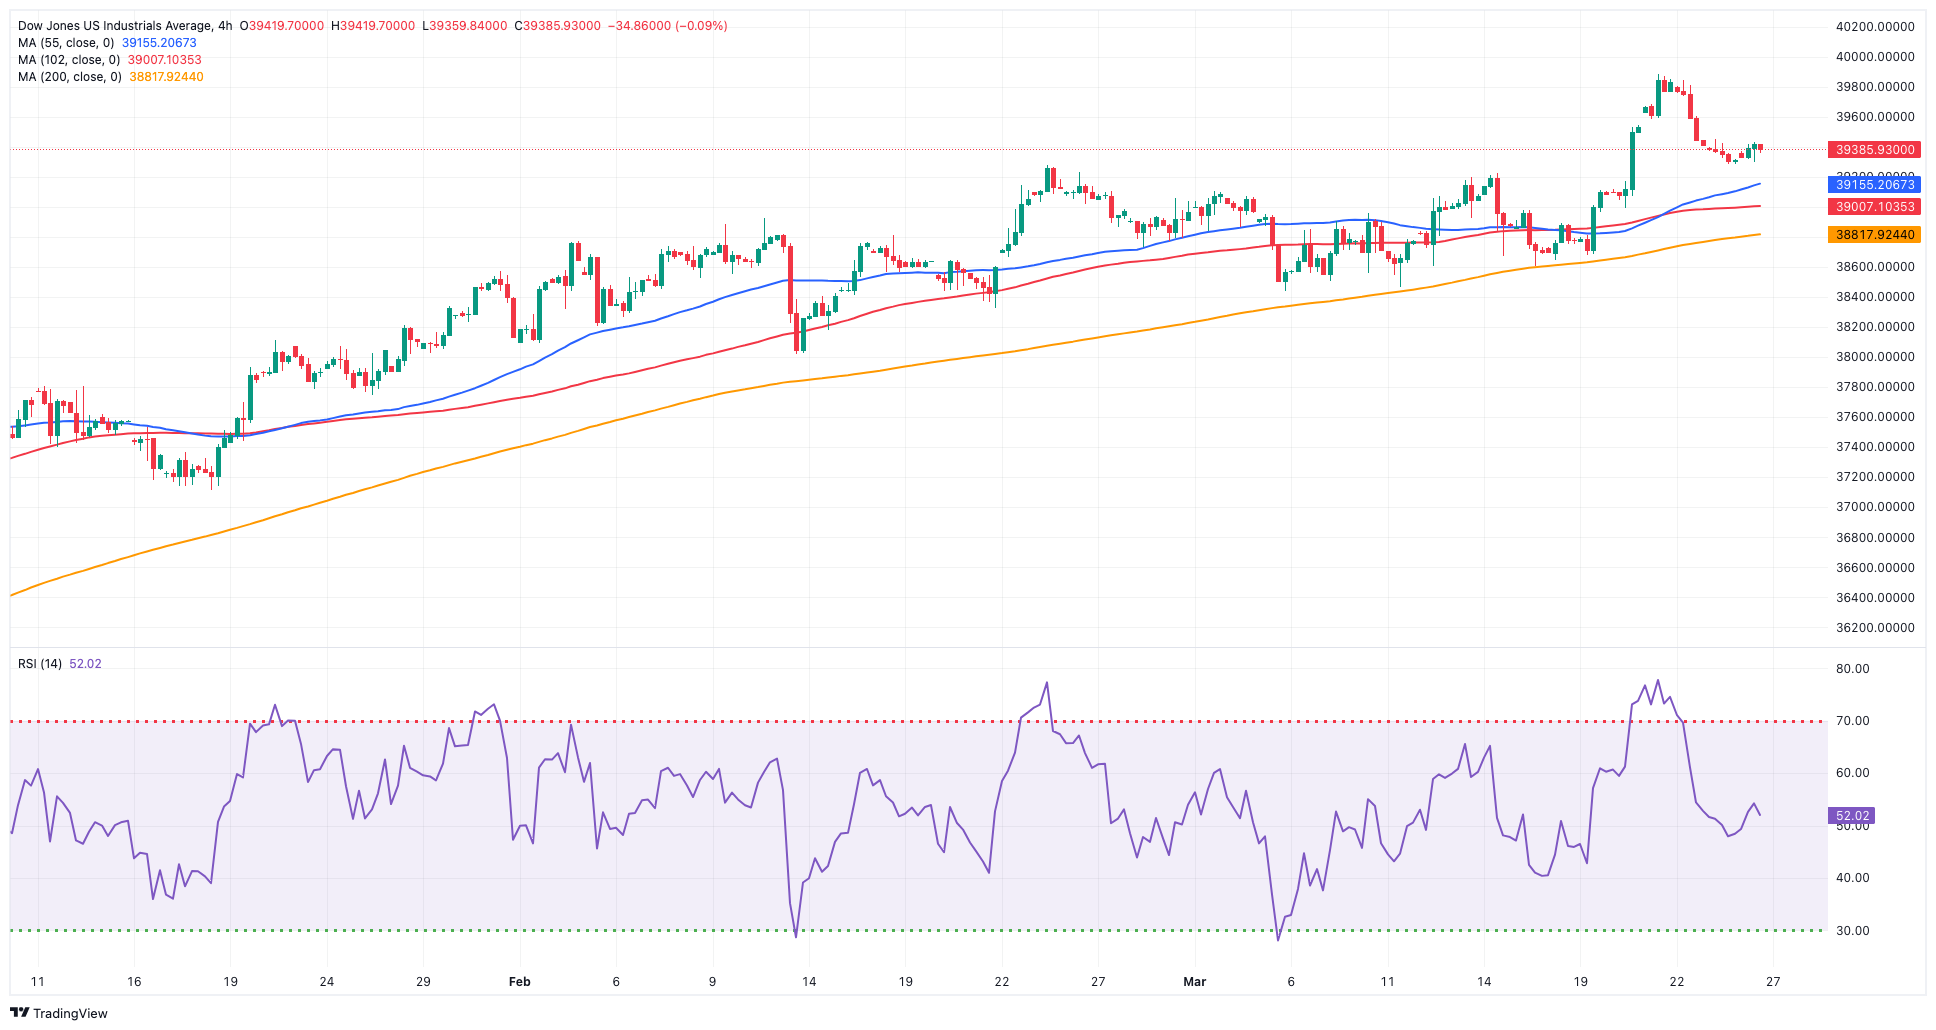
DOW JONES
US stocks measured by the reference Dow Jones managed to edge higher and set aside two daily drops in a row on Tuesday, regaining the uptrend and revisiting the 38,400 region.
The Dow’s rebound came on the back of the strong performance of growth-oriented equities, while market participants continued to look for the release of US inflation data, this time tracked by the PCE, and their impact on the Fed’s plans to start its easing cycle.
On Monday, some Fed officials (Goolsbee, Bostic, and Cook) stated their ongoing belief that US inflation would be alleviated, yet they acknowledged a heightened sense of caution surrounding the discussion.
On Tuesday, the Dow Jones gained 0.20% to 39,393, the S&P 500 rose 0.21% to 5,228, and the tech-heavy Nasdaq Composite advanced 0.25% to 16,425.
Further increases might propel the Dow Jones to its record high of 39,889 (March 21). The 55-day SMA at 38,546 provides temporary support, followed by the 2024 low of 37,122 (January 18) and the weekly low of 37,073 (December 20, 2023). If the index falls below this level, it may hit the preliminary 100-day SMA at 37,378 before falling to the 200-day SMA at 35,828. The weekly low of 33,859 (November 7, 2023) is next, ahead of the October 2023 low of 32,327 (October 27) and the 2023 bottom of 31,429 (March 15). The daily RSI bounced past the 59 level.
Top Performers: Honeywell, UnitedHealth, JPMorgan
Worst Performers: Boeing, 3M, Nike
Resistance levels: 39,889 (4H chart)
Support levels: 38,625 38,457 38,039 (4H chart)
MACROECONOMIC EVENTS

All Information & Updates provided by:

All information relating to the financial markets available on this page has been prepared and issued by FXStreet (Forexstreet SL, Spain, Reg: B62498233) on the basis of publicly available information and all information believed to be reliable and does not conflict with Kuwaiti local laws, and all necessary care has been taken to before the company to ensure that the facts mentioned are correct from the source.
NCM Investment nor any of its directors or employees shall in any way be held responsible for the contents of this news, and the information contained on this page is intended only to provide clients with publicly available information and should not be construed as investment advice, report or analysis and/or constitute an offer or invitation to buy or sell financial instruments of any kind.
RISK WARNING: Forex and CFDs are highly risky leveraged products, as losses can exceed deposits. Please ensure you understand all the risks and take independent advice if necessary. NCM will segregate the clients based on the criteria of the regulator and its bylaws. NCM does not provide any advisory service; the material published does not constitute advice or a recommendation for a transaction in any financial instrument. NCM accepts no responsibility for any use of the content presented and any consequences of that use. Anyone acting on the information provided does so at their own risk.