
- Contact Us:
-

-

-

-


Daily Market Updates
28 Mar 2024
EURUSD
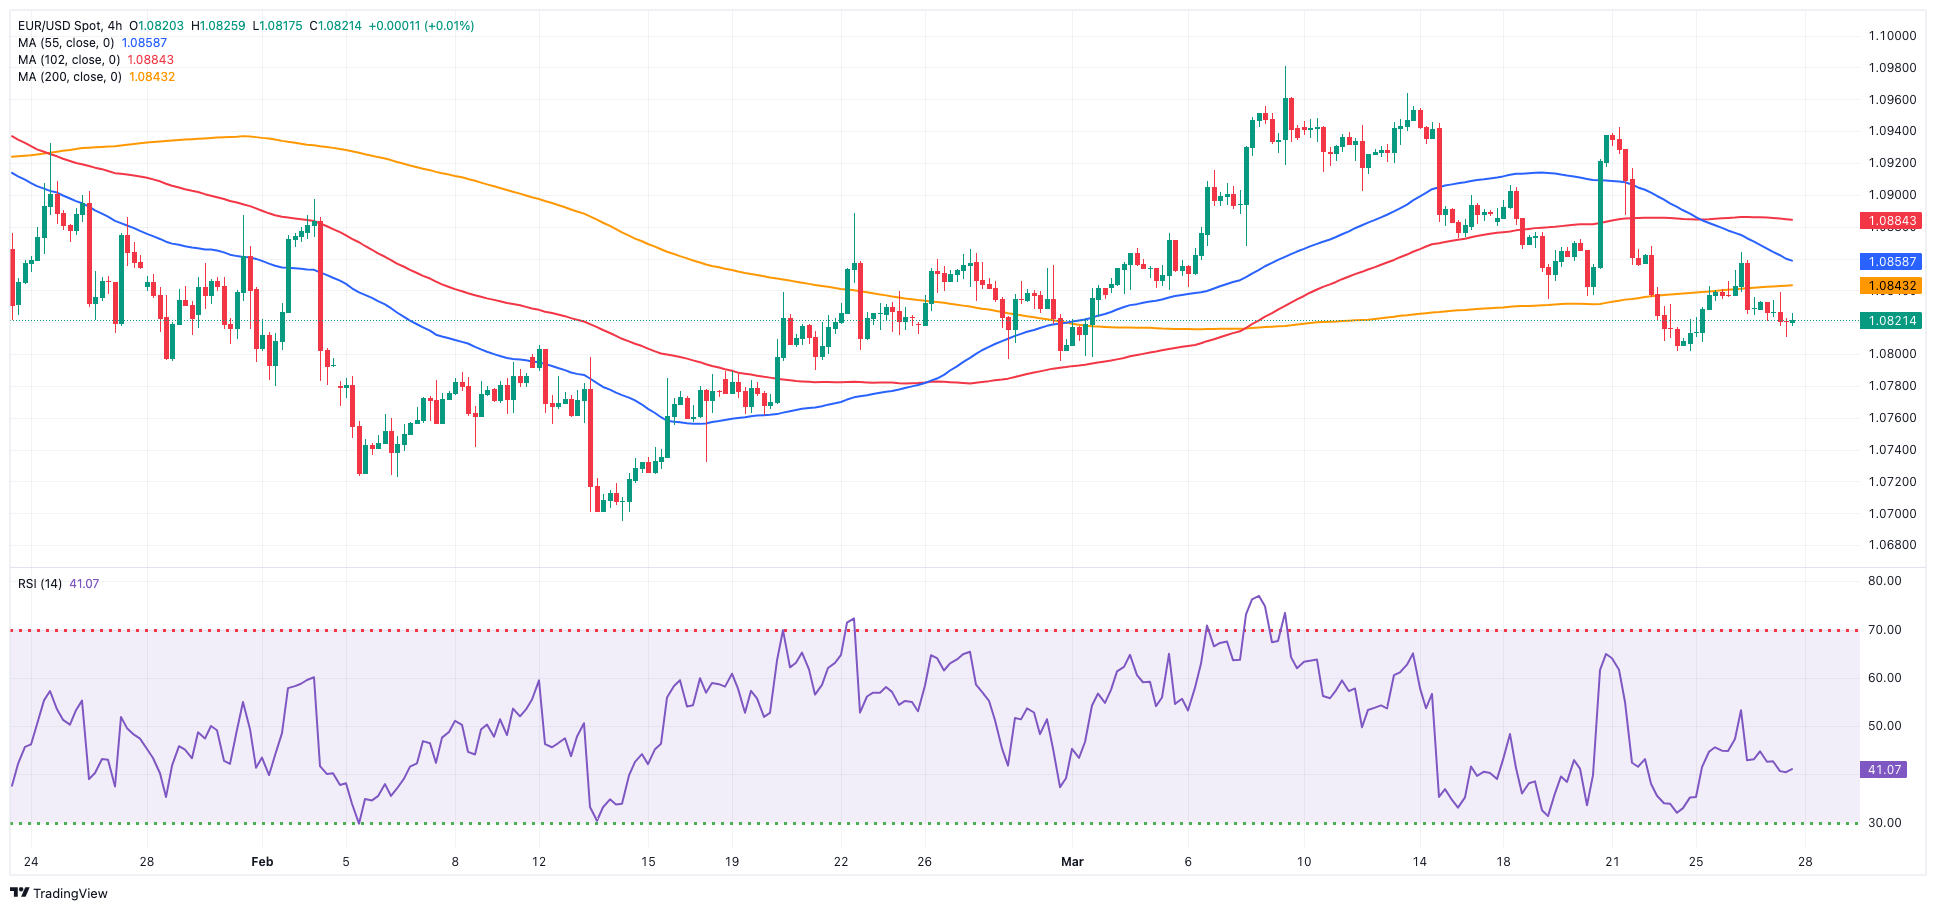
Another positive session of the greenback kept the price action in the risk complex subdued, prompting EUR/USD to retreat to two-day lows around 1.0815.
That said, the USD Index (DXY) added to Tuesday’s gains and managed to retest the 104.40-104.45 band against the backdrop of further weakness in US yields across various maturity periods.
Regarding monetary policy, market analysts continue to anticipate a potential interest rate cut by the Fed in June, followed by two additional reductions later in the year. In the case of the ECB, there is speculation that they may commence their easing measures at some point during the summer.
On the latter, ECB’s board member Cipollone mentioned earlier in the session that the moderation of wages in the Eurozone provides backing for the argument in favour of a rate cut. He further emphasized that even after the rate cut, ECB policy would remain highly restrictive.
Back to the euro docket, final prints of the European Commission’s Consumer Confidence came in at -14.9 in March, followed by the Economic Sentiment at 96.3 and the Industrial Sentiment at -8.8.
In the US, Mortgage Applications contracted by 0.7% in the week to March 22, according to MBA.
Further downside in EUR/USD could initially reach the March low of 1.0797 (March 1) before falling to the 2024 low of 1.0694 (February 14). A deeper drop may show the weekly low of 1.0495 (October 13, 2023), which precedes the 2023 low of 1.0448 (October 3) and the round milestone of 1.0400. Instead, the initial up-barrier comes at the March top of 1.0981 (March 8), prior to the weekly peak of 1.0998 (January 5, 2011) and the psychological 1.1000 barrier. The breakout of this zone may put pressure on the December 2023 high of 1.1139 (December 27), which is still supported by the 200-week SMA of 1.1146 and occurs before the 2023 top of 1.1275 (July 18). The daily RSI receded to the vicinity of 44.
Resistance levels: 1.0864 1.0942 1.0963 (4H chart)
Support levels: 1.0801 1.0795 1.0694 (4H chart)
USDJPY
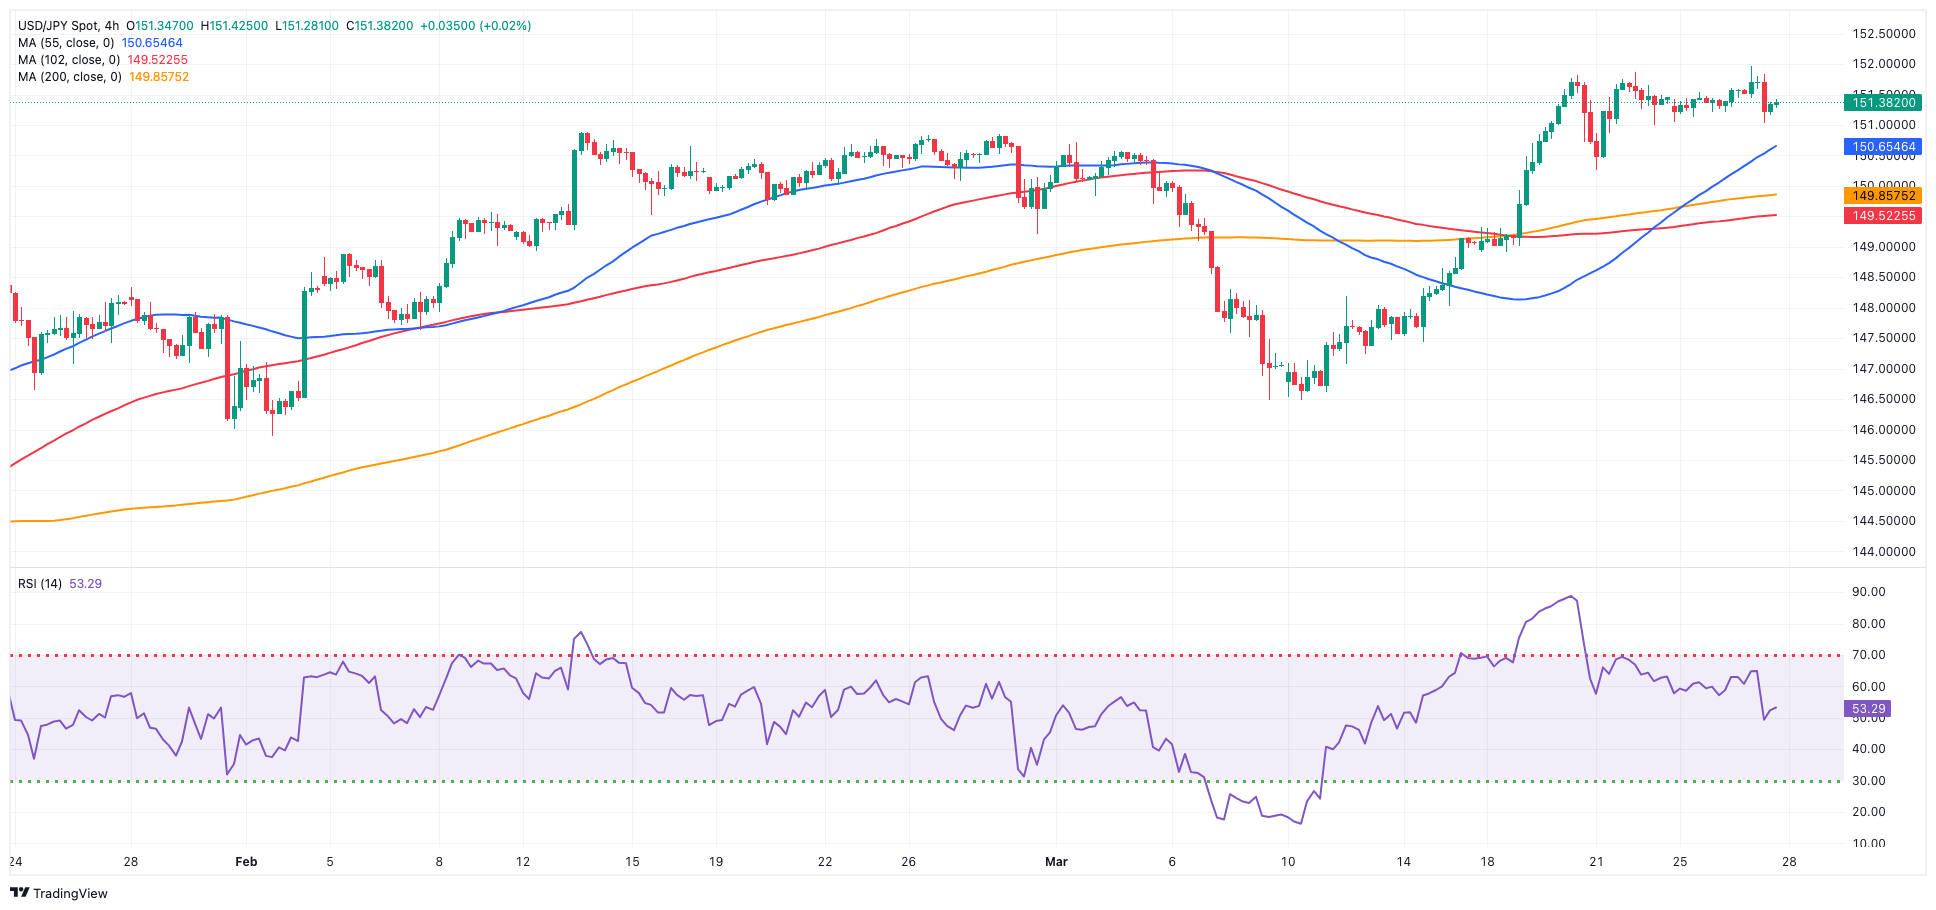
USD/JPY rose to a new high in levels not seen since 1990, just pips below the 152.00 hurdle on Wednesday, just to give away those gains afterwards and end the session in red territory.
Price action around the pair came amidst another decent advance in the greenback and a small retracement in US yields across the curve.
The focus, however, was on a meeting involving the Ministry of Finance, the BoJ, and the Financial Services Agency. Following the event, Vice Minister of International Affairs Kanda held a press briefing where he stated that the recent weakening of the yen cannot be considered aligned with the underlying economic principles, and it is evident that speculative activities are fueling the yen's decline. He emphasized the authorities' readiness to take appropriate action against excessive currency movements, keeping all options on the table.
Echoing similar sentiments, Finance Minister Suzuki had previously cautioned that the authorities are monitoring market movements with a high sense of urgency. He reiterated the government's willingness to take bold measures against excessive currency fluctuations without ruling out any options.
Still around the BoJ, member Tamura advocated for a gradual yet consistent approach to policy normalization, adding that the likelihood of a significant overshoot in inflation is minimal.
USD/JPY faces an immediate upward barrier at the 2024 high of 151.97 (March 27), ahead of the round figure of 152.00. On the contrary, the pair is expected to meet provisional support at the 55-day and 100-day SMAs at 148.98 and 147.66, respectively, all prior to the crucial 200-day SMA at 146.78 and the March low of 146.47 (March 8). A breakdown of this zone might lead to a return to the February low of 145.89 (February 1), which comes before the December 2023 low of 140.24 (December 28), the round number 140.00, and the July low of 137.23 (July 14). The daily RSI slips back to the 63 area.
Resistance levels: 151.97 155.80 160.25 (4H chart)
Support levels: 151.02 150.26 149.78 (4H chart)
GBPUSD
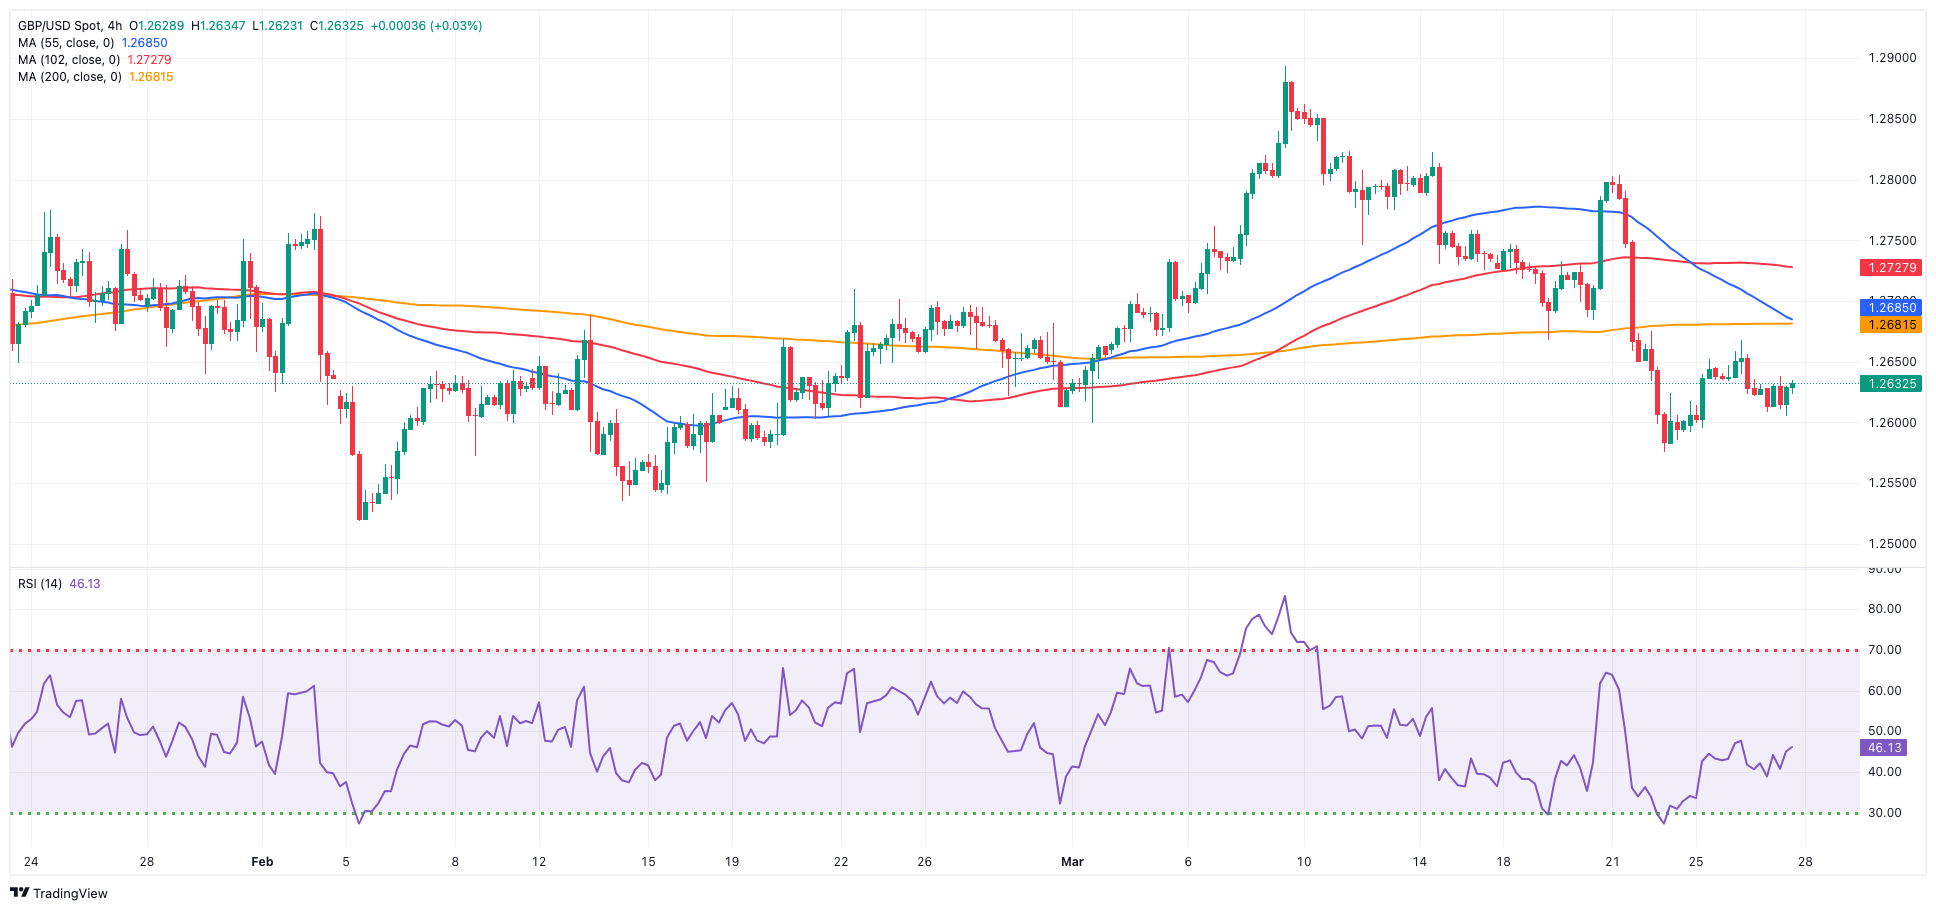
GBP/USD challenged the 1.2600 neighbourhood, or two-day lows, before returning to the positive session on Wednesday.
In fact, further gains in the dollar sustained an initial decline in Cable against the backdrop of the broad-based bearish stance in the risk-linked galaxy, while diminishing UK 10-year gilt yields added to Tuesday’s retracement further south of 4.0%.
From the BoE, it is worth recalling that BoE hawk member C. Mann indicated on Tuesday that markets might be too relaxed regarding the expected duration of the BoE's general position on interest rates.
The UK calendar was empty on Wednesday.
The loss of the March low of 1.2575 (March 22) should pave the way for a move towards the 2024 low of 1.2518 (February 5) and the December 2023 low of 1.2500 (December 13). A deeper retracement would not find significant support until the weekly low of 1.2187 (November 10, 2023), which is followed by the October 2023 low of 1.2037 and the main 1.2000 resistance level. In the opposite direction, the next upward barrier is the 2024 peak of 1.2893 (March 8), followed by the weekly high of 1.2995 (July 27, 2023), all before hitting the important 1.3000 level. The day-to-day RSI advanced marginally past the 43 level.
Resistance levels: 1.2680 1.2803 1.2823 (4H chart)
Support levels: 1.2575 1.2535 1.2518 (4H chart)
GOLD
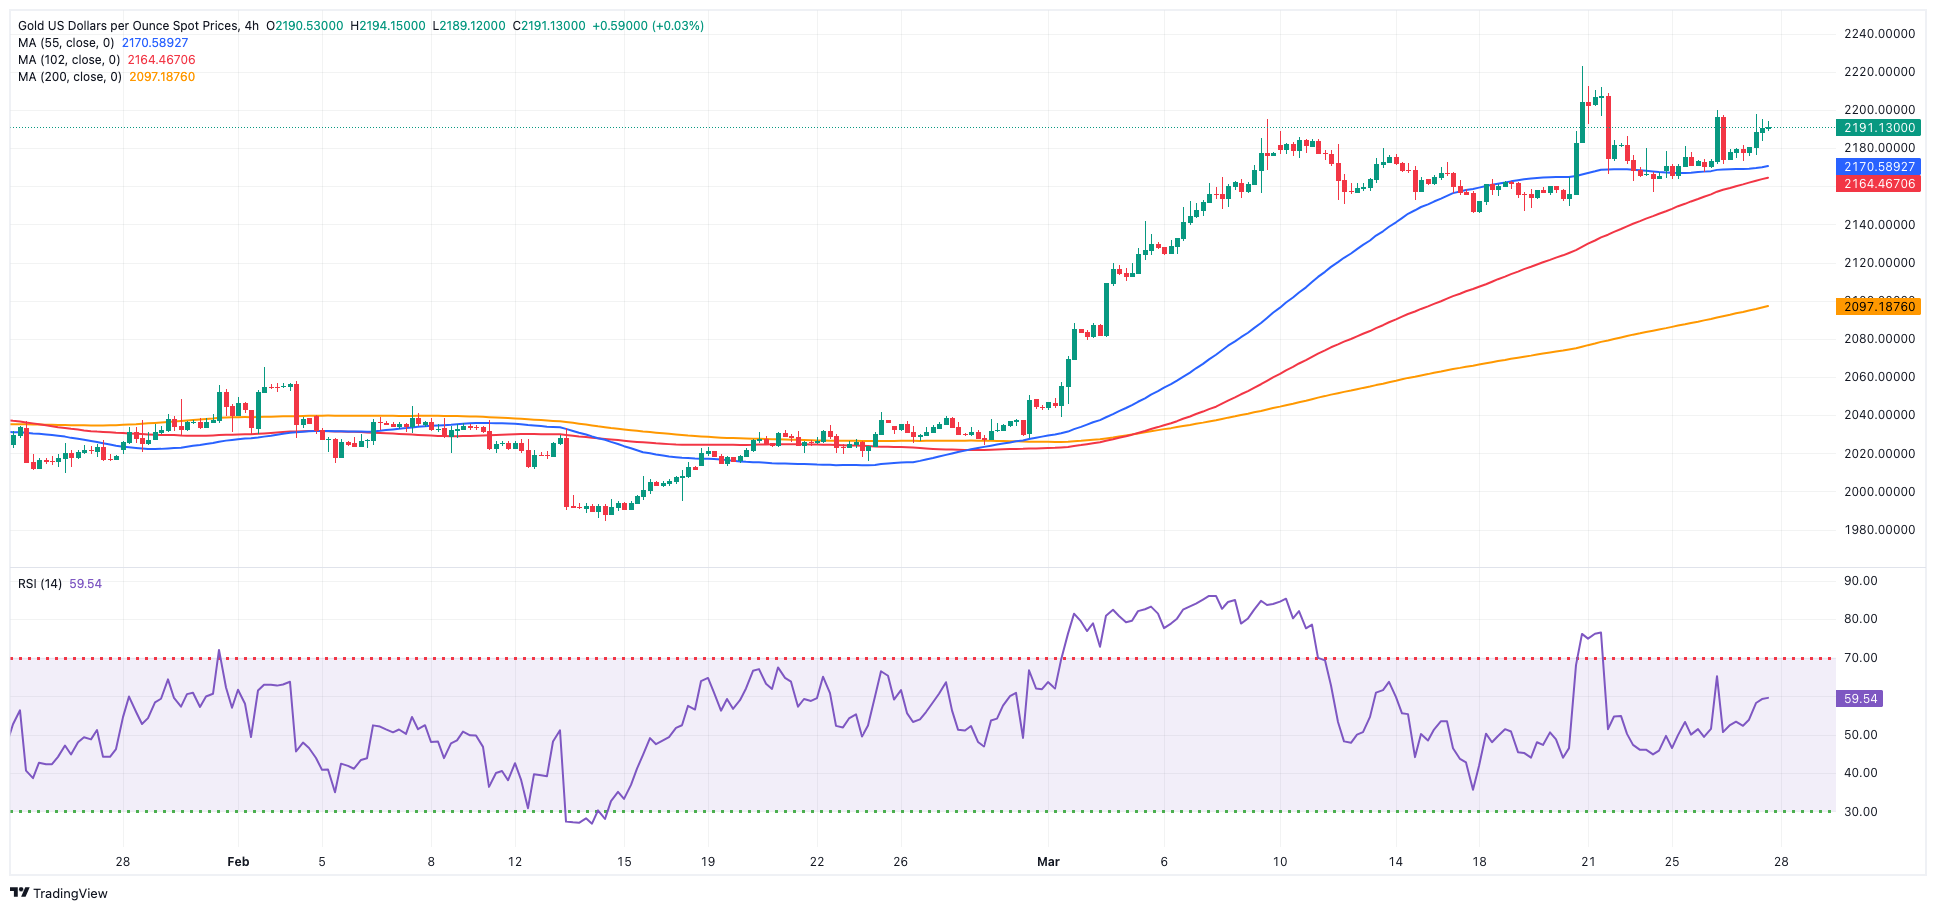
Prices of Gold clinched their third consecutive daily gain and approached the key $2,200 region per troy ounce on Wednesday.
The move higher in the precious metal came on the back of further gains in the greenback and another negative day in US yields across the curve as investors continued to anticipate US inflation data, which could provide new insights into the timing of the Fed’s monetary policy easing.
Further strength also followed news that central banks persist in reporting sustained gold acquisitions, motivated by their aim to diversify their currency reserves. This trend counterbalances the decline in investment demand, primarily influenced by expectations of US rate cuts.
On another front, India's gold imports are expected to plummet by over 90% in March compared to the previous month as banks reduce imports due to decreased demand following record-high prices.
Immediately to the upside for Gold comes the weekly top of $2,200 (March 26) ahead of the all-time peak of $2,222 (March 21). On the downside, the weekly low of $2,146 (March 18) comes ahead of the preliminary 55-day and 100-day SMAs of $2,072 and $2,047, respectively. Further south is the 2024 low of $1,984 (February 14), which appears to be supported by the critical 200-day SMA ($1,986). Once the latter is resolved, a possible visit to the December 2023 low of $1,973 may commence before the November 2023 low of $1,931. The failure in this region may cause the yellow metal to test its October 2023 low of $1,810, which precedes the 2023 low of $1,804 and the crucial $1,800 conflict zone.
Resistance levels: $2,200 $2,222 (4H chart)
Support levels: $2,157 $2,146 $2,096 (4H chart)
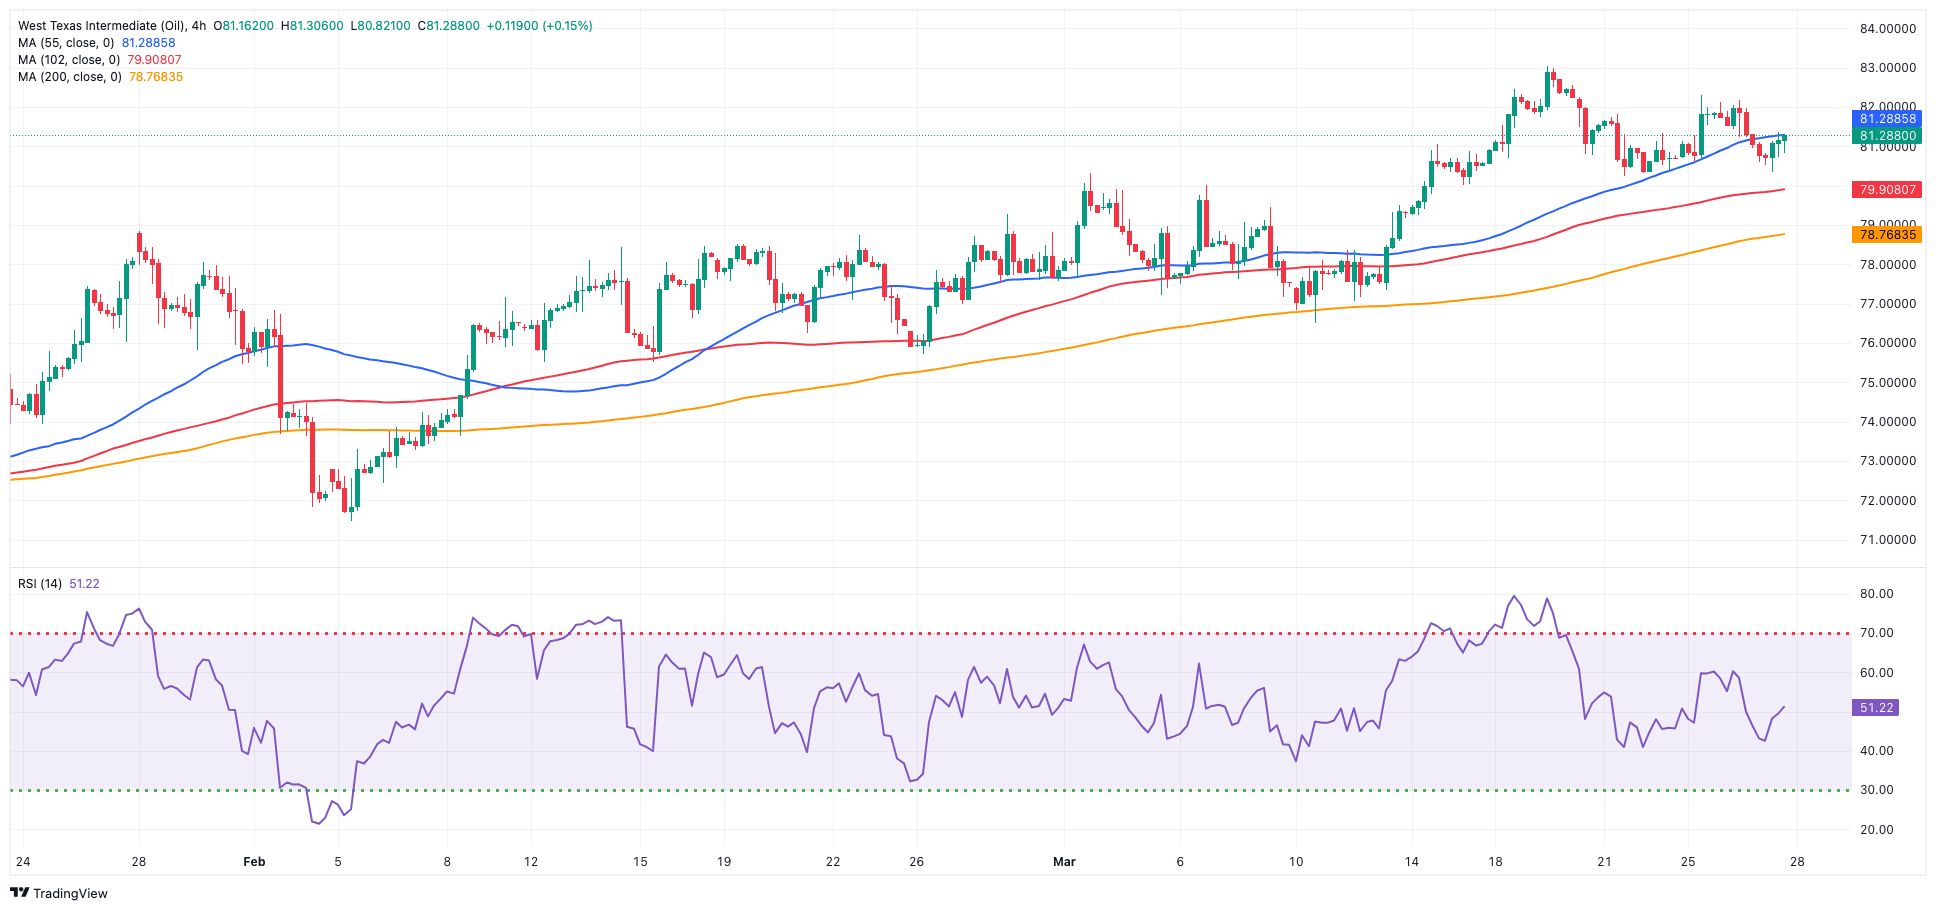
CRUDE WTI
WTI prices exchanged gains with losses, remaining in the sub-$82.00 region per barrel on Wednesday.
In fact, the larger-than-expected weekly build in US crude oil inventories weighed on the commodity and contributed to the sour sentiment among traders.
On the latter, the EIA reported that US crude oil inventories increased by 3.165M barrels in the week to March 22, while supplies at Cushing went up by 2.107M barrels, Weekly Distillate Stocks shrank by 1.185M barrels, and gasoline stockpiles rose by 1.2999M barrels.
Further downside pressure in crude oil came from the persistent bullish bias in the greenback ahead of the publication of US inflation figures tracked by the PCE later in the week.
On another front, OPEC+ plans to delay any changes to its oil output policy until a full ministerial meeting in June, with an online joint ministerial monitoring committee meeting scheduled for April 3, to assess the oil market's condition and review OPEC members' compliance with production cuts.
The next upward challenge for WTI is the 2024 peak of $83.09 (March 19), which precedes the weekly high of $89.83 (October 18, 2023) and the 2023 peak of $94.99 (September 28, 2023). Further north, the weekly top of $97.65 (August 30) aligns just before the psychological $100.00 barrier. On the flip side, the 200-day SMA offers provisional support at $78.71, prior to the February low of $71.43 (February 5). Extra losses could target the significant $70.00 milestone ahead of the 2024 low of $69.31 (January 3).
Resistance levels: $82.43 $83.09 $83.56 (4H chart)
Support levels: $80.51 $78.94 $76.76 (4H chart)
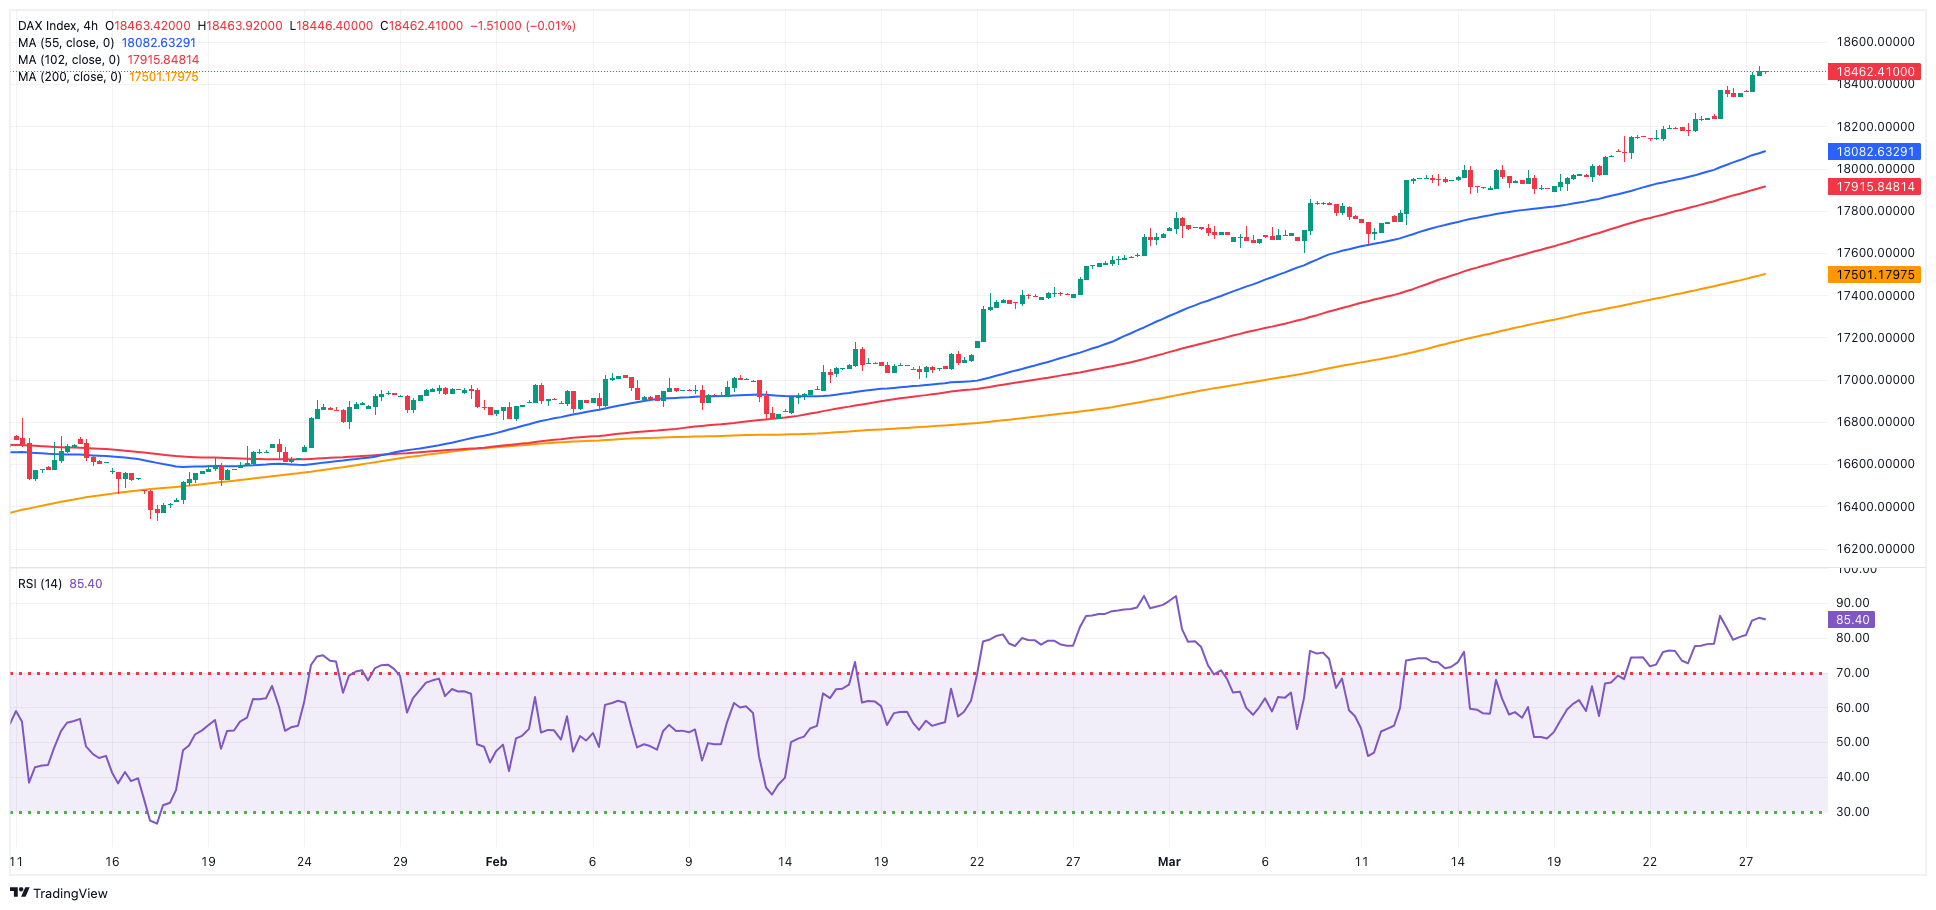
GER40
Another day, another record high in Germany’s benchmark DAX40.
In fact, the index reached an all-time top past the 18,500 level on Wednesday, always amidst scarce volatility and thin trade conditions due to the imminent Easter holidays.
Further rises in the index were propelled by the prevalent belief that major central banks should commence their easing cycles later in the year, prompted by persistent disinflationary pressures.
Additionally, investors remained hopeful that a positive print from US PCE (due on Friday) reinforces the Fed’s idea to start its easing cycle as soon as at its June 12 event.
In the German bond market, in the meantime, 10-year bund yields dropped to multi-session lows in the sub-2.30% zone.
The DAX40's next level of resistance is the record high of 18,511 (March 27). Having said that, the 55-day SMA at 17,314 should provide temporary contention till the February low of 16,821 (February 1). A drop below this level might push the index below the 2024 low of 16,345 (January 17), which is ahead of the critical 200-day SMA at 16,254. After the latter is defeated, the weekly low of 15,915 (November 28) may be tested, followed by the October low of 14,630 (October 23) and the 2023 low of 14,458 (March 20). The daily RSI rose past 86, indicating that the market remained severely overbought.
Best Performers: Zalando SE, Bayer, Deutsche Bank AG
Worst Performers: Rheinmetall AG, Sartorius AG VZO, Vonovia
Resistance levels: 18,511 (4H chart)
Support levels: 17,978 17,619 17,525 (4H chart)
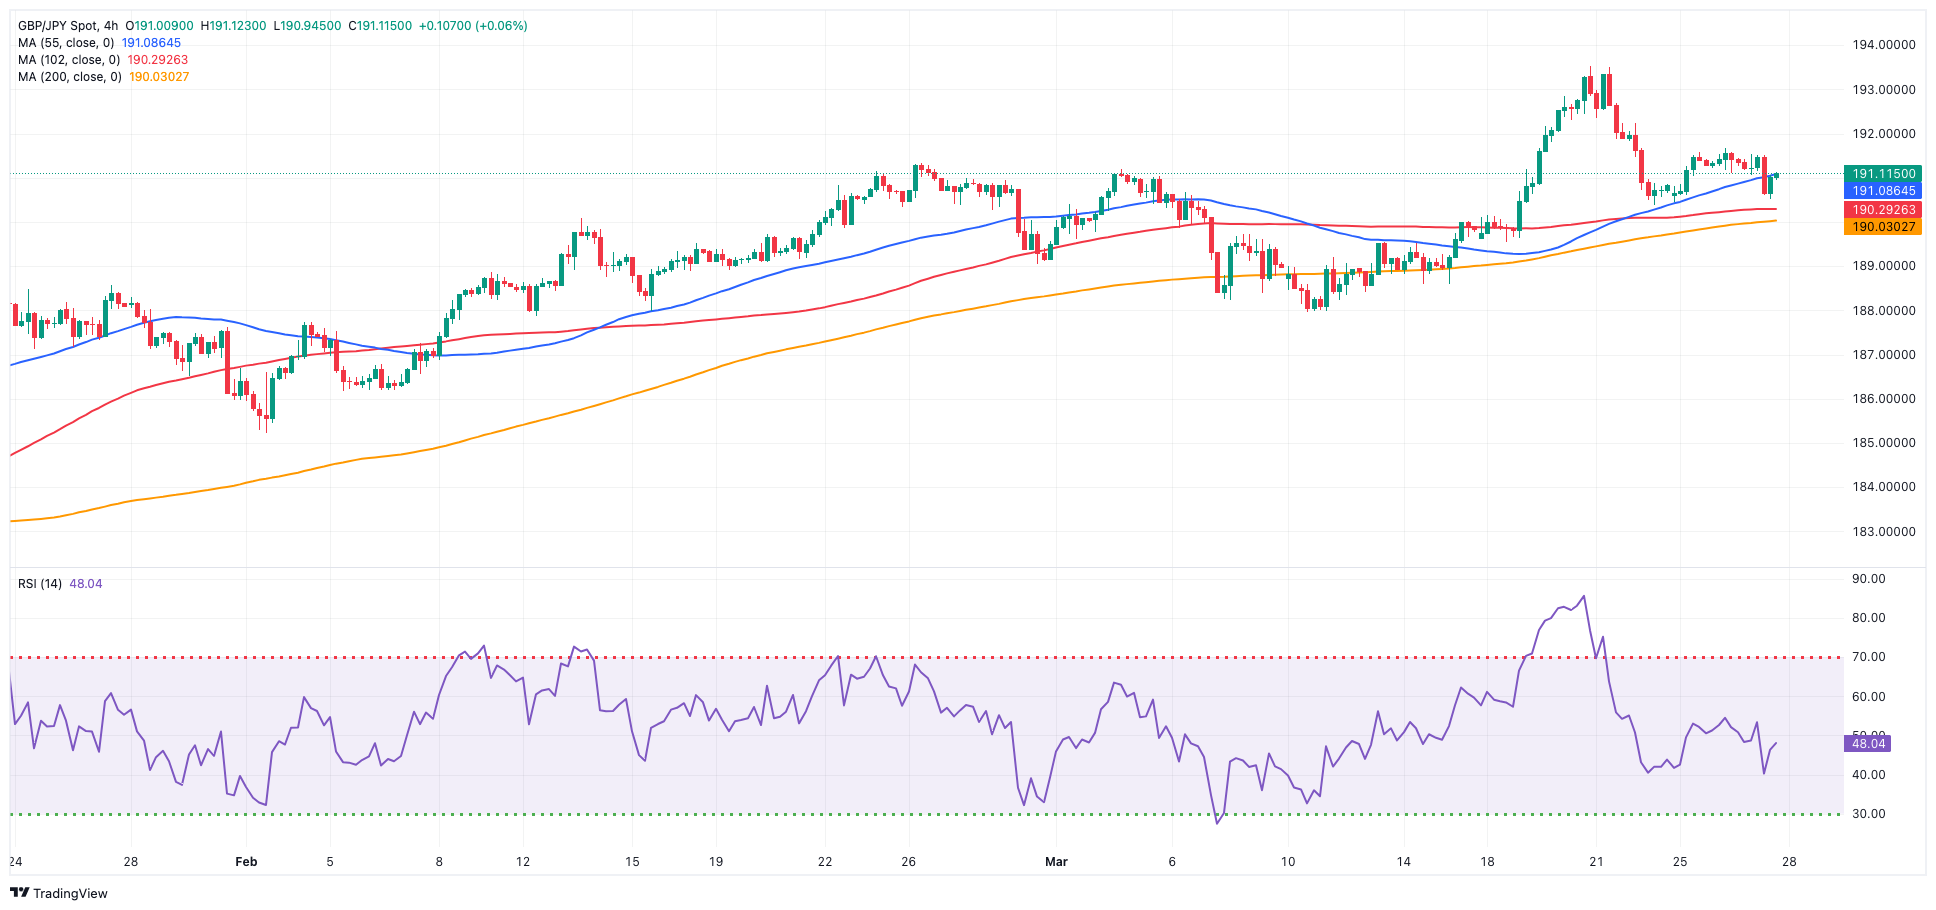
GBPJPY
GBP/JPY resumed the downside after two consecutive daily advances on Wednesday.
The prevailing risk-off context maintained the cross under pressure amidst dollar gains, while comments from the Japanese government and BoJ officials encouraged the yen to gather some traction, always against the backdrop of FX intervention chatter.
If bulls regain the upper hand, GBP/JPY might confront the 2024 top of 193.53 (March 20) before the August 2015 peak of 195.28 (August 18) and the record high of 195.88 (June 24, 2015). In the opposite direction, there is transitory support at the 55-day SMA at 188.97, which precedes the March low of 187.96 (March 11), and the 100-day SMA at 186.78. Once the latter is cleared, the cross could test the February low of 185.22 (February 1), which is just ahead of the crucial 200-day SMA at 184.79. A deeper retracement might bring the December 2023 low of 178.33 (December 14) back into focus, ahead of the October 2023 low of 178.03 and the July 2023 low of 176.30. The daily RSI deflated to the sub-54 zone.
Resistance levels: 191.67 193.53 195.28 (4H chart)
Support levels: 190.34 189.54 187.98 (4H chart)
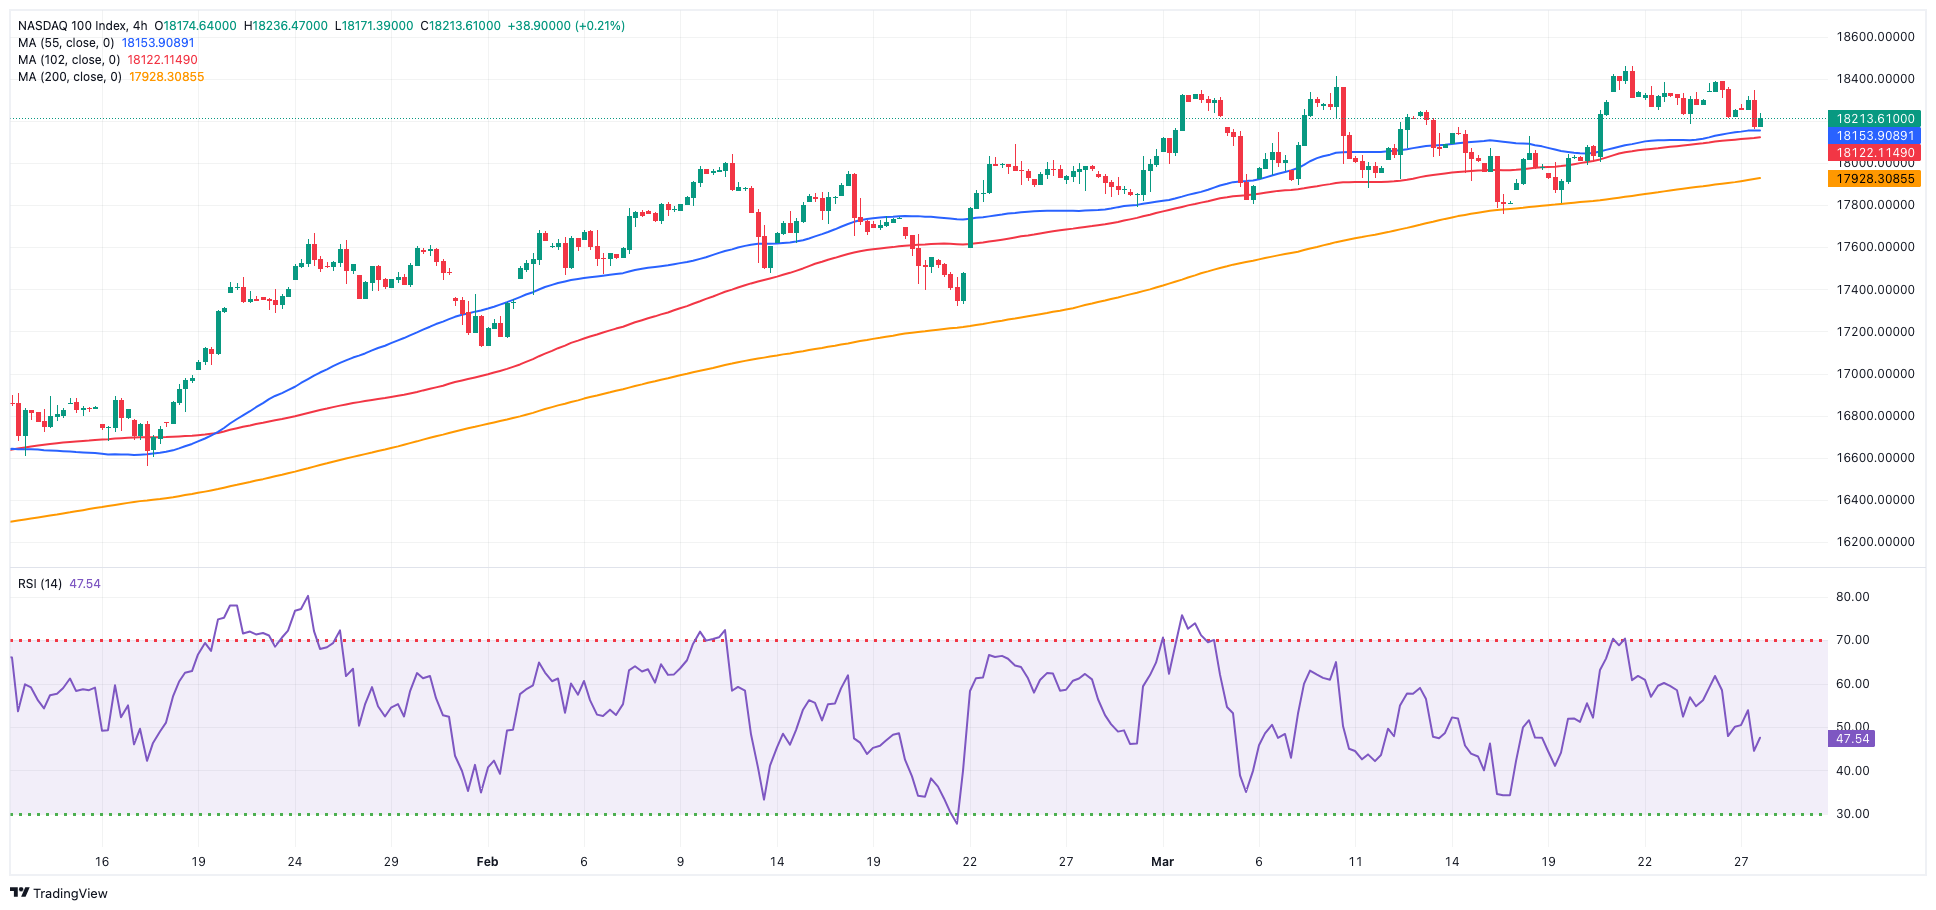
NASDAQ
The US tech sector traded in a vacillating fashion on Wednesday.
Indeed, the reference Nasdaq 100 kept the irresolute price action against the backdrop of alternating sentiment among market participants and the persevering bid bias in the greenback.
Exerting downward pressure in the index emerged the negative session of chip maker NVIDIA as well as other growth-focused stocks.
Further advances might take the Nasdaq 100 towards its all-time high of 18,464 (March 21). Alternatively, the index is likely to find temporary support at the 55-day SMA of 17,710, before weekly lows of 17,319 (February 21) and 17,128 (January 31). If the latter is passed, the index may fall to its 2024 low of 16,249 (January 5), ahead of the key 200-day SMA of 16,032 and the December 2023 low of 15,695 (December 4). Additional losses from here might test the October 2023 level of 14,058 (October 26), before the April 2023 low of 12,724 (April 25) and the March 2023 low of 11,695 (March 13). The daily RSI looked stable near 55.
Top Gainers: Cintas, Marvell, Microchip
Top Losers: PDD Holdings DRC, NVIDIA, Workday
Resistance levels: 18,464 (4H chart)
Support levels: 17,764 17,319 17,128 (4H chart)
DOW JONES
US equities traded with decent gains amidst the resurgence of fresh optimism among market participants, prompting the benchmark Dow Jones to reverse three straight sessions of losses on Wednesday.
Indeed, the index managed to regain composure amidst the generalized lack of volatility as the Easter holidays loomed closer.
Collaborating with the outperformance of the index appeared significant gains in drugmaker Merck, while investors were eagerly awaiting crucial economic data from the PCE (due on March 29). A positive surprise in inflation could potentially temper market optimism regarding early rate cuts.
Furthermore, it is worth noting recent remarks from Fed officials, where they reiterated their ongoing belief that U.S. inflation would moderate, while also acknowledging a heightened level of caution surrounding the topic.
On the whole, the Dow Jones advanced 0.77% to 39,582, the S&P 500 gained 0.37% to 5,222, and the tech-centric Nasdaq Composite rose 0.12% to 16,336.
Further gains might boost the Dow Jones to a record high of 39,889 (March 21). The other way around, the 55-day SMA of 38,578 offers temporary support, seconded by the 2024 low of 37,122 (January 18) and the weekly low of 37,073 (December 20, 2023). If the index falls below this level, it may reach the preliminary 100-day SMA at 37,440 before descending to the 200-day SMA at 35,855. The weekly low of 33,859 (November 7, 2023) comes next, followed by the October 2023 low of 32,327 (October 27) and the 2023 bottom of 31,429 (March 15). The daily RSI climbed to the proximity of 62.
Top Performers: Merck&Co, Intel, Boeing
Worst Performers: Salesforce Inc, Visa A, Microsoft
Resistance levels: 39,889 (4H chart)
Support levels: 38,646 38,457 38,039 (4H chart)
MACROECONOMIC EVENTS
All Information & Updates provided by:

All information relating to the financial markets available on this page has been prepared and issued by FXStreet (Forexstreet SL, Spain, Reg: B62498233) on the basis of publicly available information and all information believed to be reliable and does not conflict with Kuwaiti local laws, and all necessary care has been taken to before the company to ensure that the facts mentioned are correct from the source.
NCM Investment nor any of its directors or employees shall in any way be held responsible for the contents of this news, and the information contained on this page is intended only to provide clients with publicly available information and should not be construed as investment advice, report or analysis and/or constitute an offer or invitation to buy or sell financial instruments of any kind.
RISK WARNING: Forex and CFDs are highly risky leveraged products, as losses can exceed deposits. Please ensure you understand all the risks and take independent advice if necessary. NCM will segregate the clients based on the criteria of the regulator and its bylaws. NCM does not provide any advisory service; the material published does not constitute advice or a recommendation for a transaction in any financial instrument. NCM accepts no responsibility for any use of the content presented and any consequences of that use. Anyone acting on the information provided does so at their own risk.