
- Contact Us:
-

-

-

-


Daily Market Updates
29 Mar 2024
EURUSD
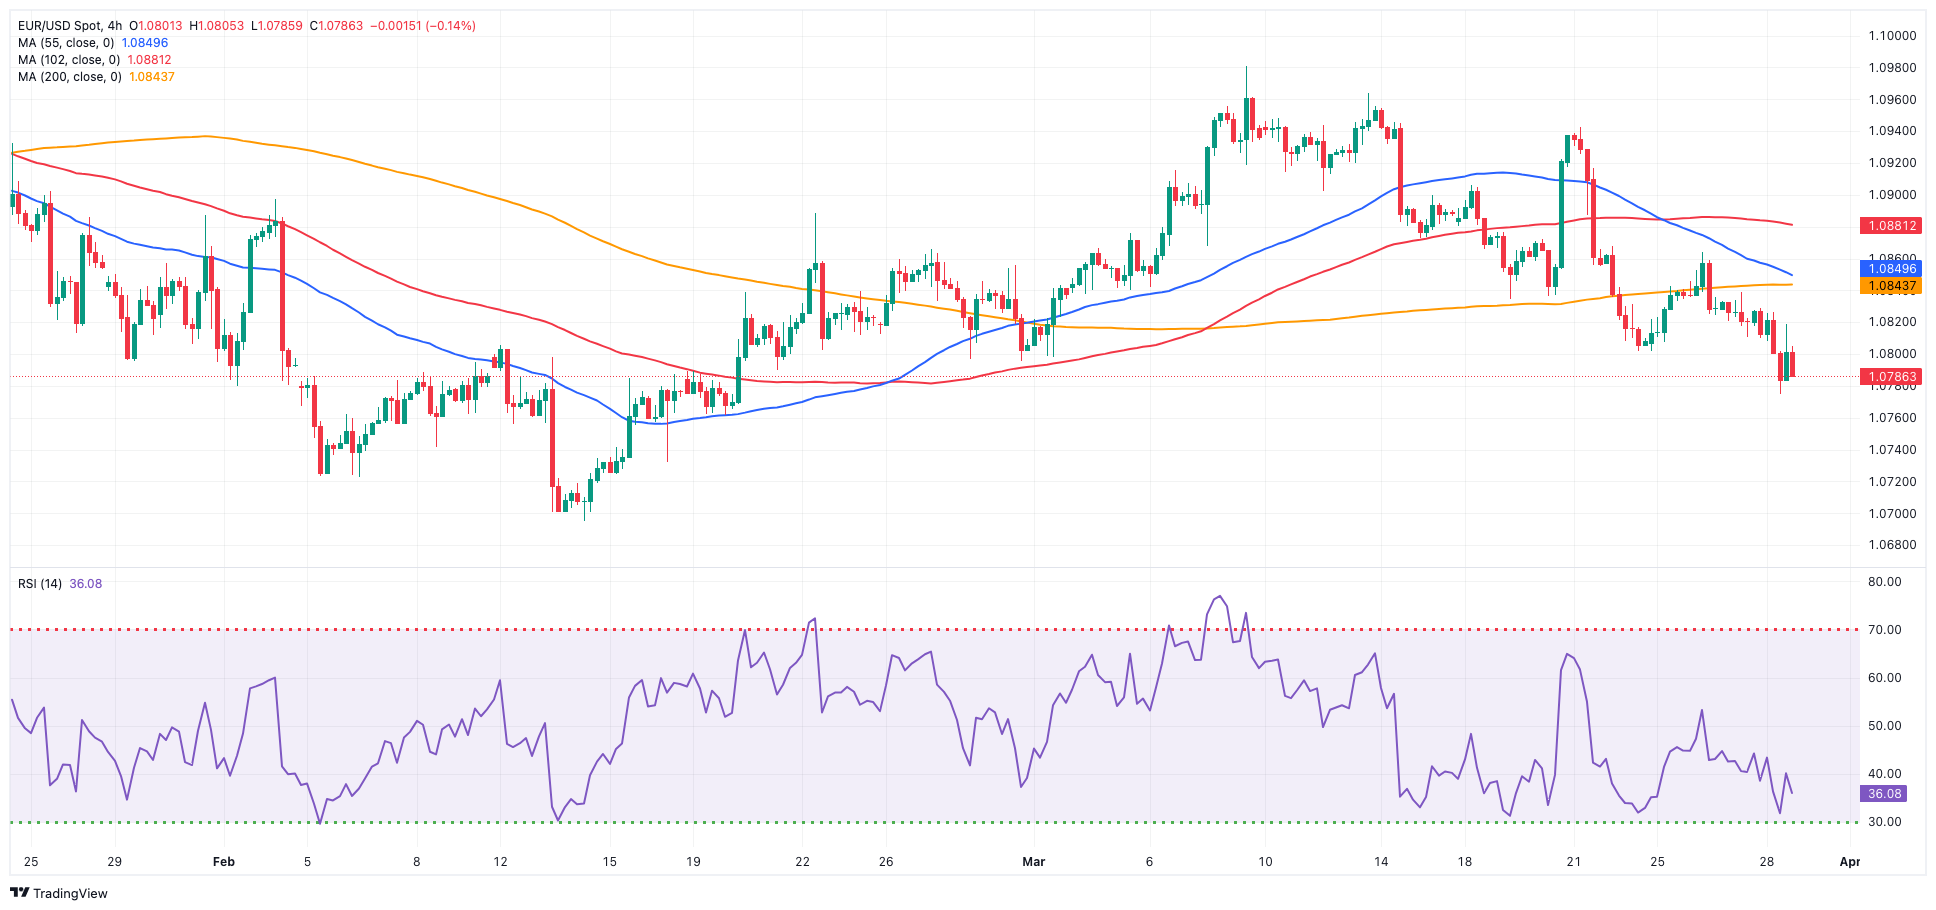
Another solid session for the dollar kept movements in the risk-oriented markets subdued, leading to a retreat in EUR/USD to the sub-1.0800 region, or five-week lows, on Thursday.
Meanwhile, the USD Index (DXY) extended its gains from Wednesday, reaching fresh multi-week tops past 104.70 on the back of hawkish Fedspeak and firmer US data releases, while upticks in the short end and the belly of the US yield curve also underpinned the buck.
Indeed, in a speech delivered at an event held by the Economic Club of New York, FOMC Waller stated that there is currently no urgency to reduce the policy rate. Based on recent data, Waller indicated that it would be wise to maintain the rate at its current restrictive level for a potentially longer period than initially anticipated. This approach aims to support the achievement of sustainable inflation, gradually moving towards the 2% target.
In terms of monetary policy, market analysts continue to predict a potential interest rate reduction by the Federal Reserve in June, followed by two more cuts later in the year. As for the European Central Bank (ECB), speculation suggests they may initiate easing measures sometime during the summer.
In the euro area, Retail Sales in Germany contracted by 2.7% in the year to February, while the Unemployment Change increased by 4Kindividuals and the jobless rate held steady at 5.9% in March.
In the US, the final Q4 GDP Growth Rate expanded by 3.4% and 1.7% QoQ. In addition, Initial Jobless Claims increased by 210K in the week to March 23. Finally, the Michigan Consumer Sentiment improved to 79.4 in March and Pending Home Sales contracted by 7% YoY in February.
EUR/USD might fall further, reaching the March low of 1.0775 (March 28) before falling to the 2024 low of 1.0694 (February 14). A deeper slide may reveal the weekly low of 1.0495 (October 13, 2023), which comes before the 2023 low of 1.0448 (October 3) and the round milestone of 1.0400. Instead, the initial up-barrier occurs at the March high of 1.0981 (March 8), before the weekly peak of 1.0998 (January 5, 2011) and the psychological 1.1000 barrier. The breakout of this zone may put pressure on the December 2023 high of 1.1139 (December 27), which is still supported by the 200-week SMA of 1.1146 and comes before the July 18-2023 high of 1.1275. The daily RSI dropped to the 41 zone.
Resistance levels: 1.0864 1.0942 1.0963 (4H chart)
Support levels: 1.0775 1.0694 1.0656 (4H chart)
USDJPY
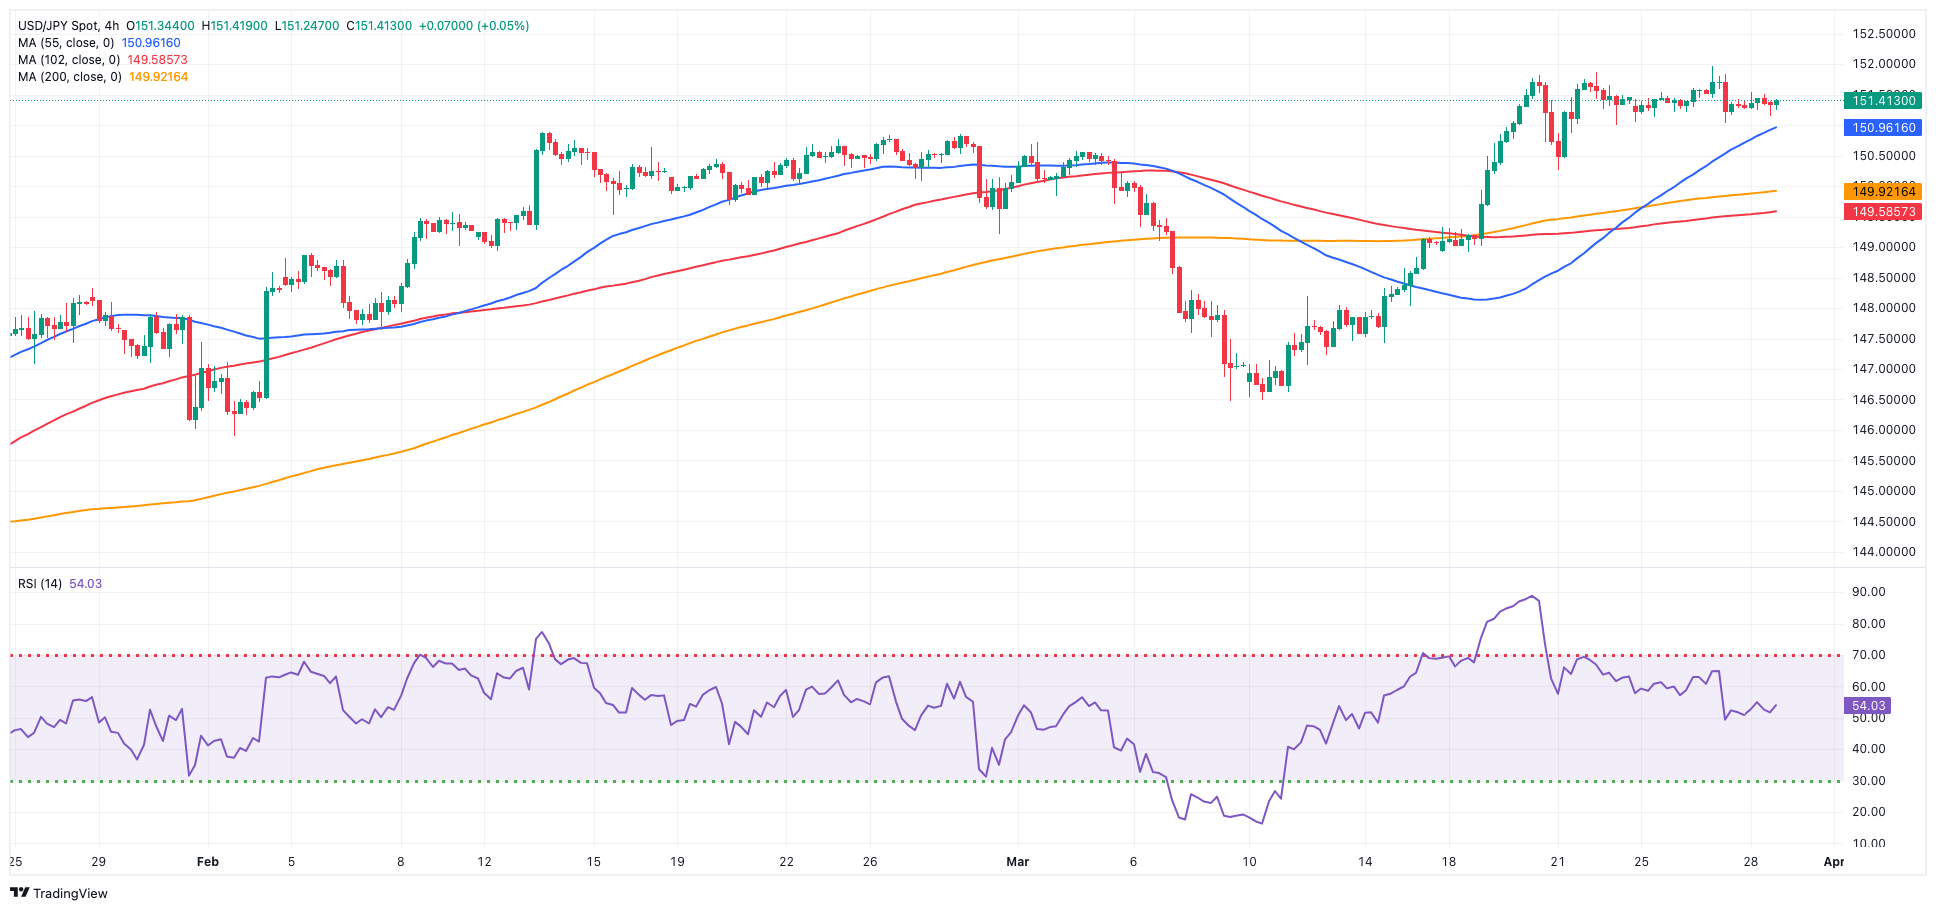
USD/JPY extended its consolidative phase on Maundy Thursday, resuming the uptrend following Wednesday’s pullback after advancing to levels unseen since 1990, reaching just below the 152.00 mark.
The movement in the pair occurred amid another notable uptick in the dollar and a mixed performance of US yields across different time frames.
Meanwhile, investors remained wary over the potential FX intervention, as the pair gets closer to the 152.00 yardstick. It is worth recalling Wednesday’s meeting involving the Ministry of Finance, the BoJ, and the Financial Services Agency. Following the meeting, Vice Minister of International Affairs Kanda conducted a press briefing, where he expressed that the recent depreciation of the yen cannot be justified by underlying economic principles. He highlighted the role of speculative activities in driving down the yen's value and emphasized the authorities' readiness to take appropriate measures against excessive currency movements, leaving all options open.
In Japan, Foreign Bond Investment rose to ¥762.3B in the week to March 23.
USD/JPY faces an immediate upward barrier at the 2024 high of 151.97 (March 27), which is above the round number of 152.00. On the contrary, the pair is projected to find preliminary support around the 55-day and 100-day SMAs of 149.09 and 147.67, respectively, all before the critical 200-day SMA of 146.83 and the March low of 146.47 (March 8). A breakdown of this zone might result in a return to the February low of 145.89 (February 1), which is prior to the December 2023 low of 140.24 (December 28), the round number 140.00, and the July low of 137.23 (July 14). The daily RSI rose a tad above 63.
Resistance levels: 151.97 155.80 160.25 (4H chart)
Support levels: 151.02 150.26 149.78 (4H chart)
GBPUSD
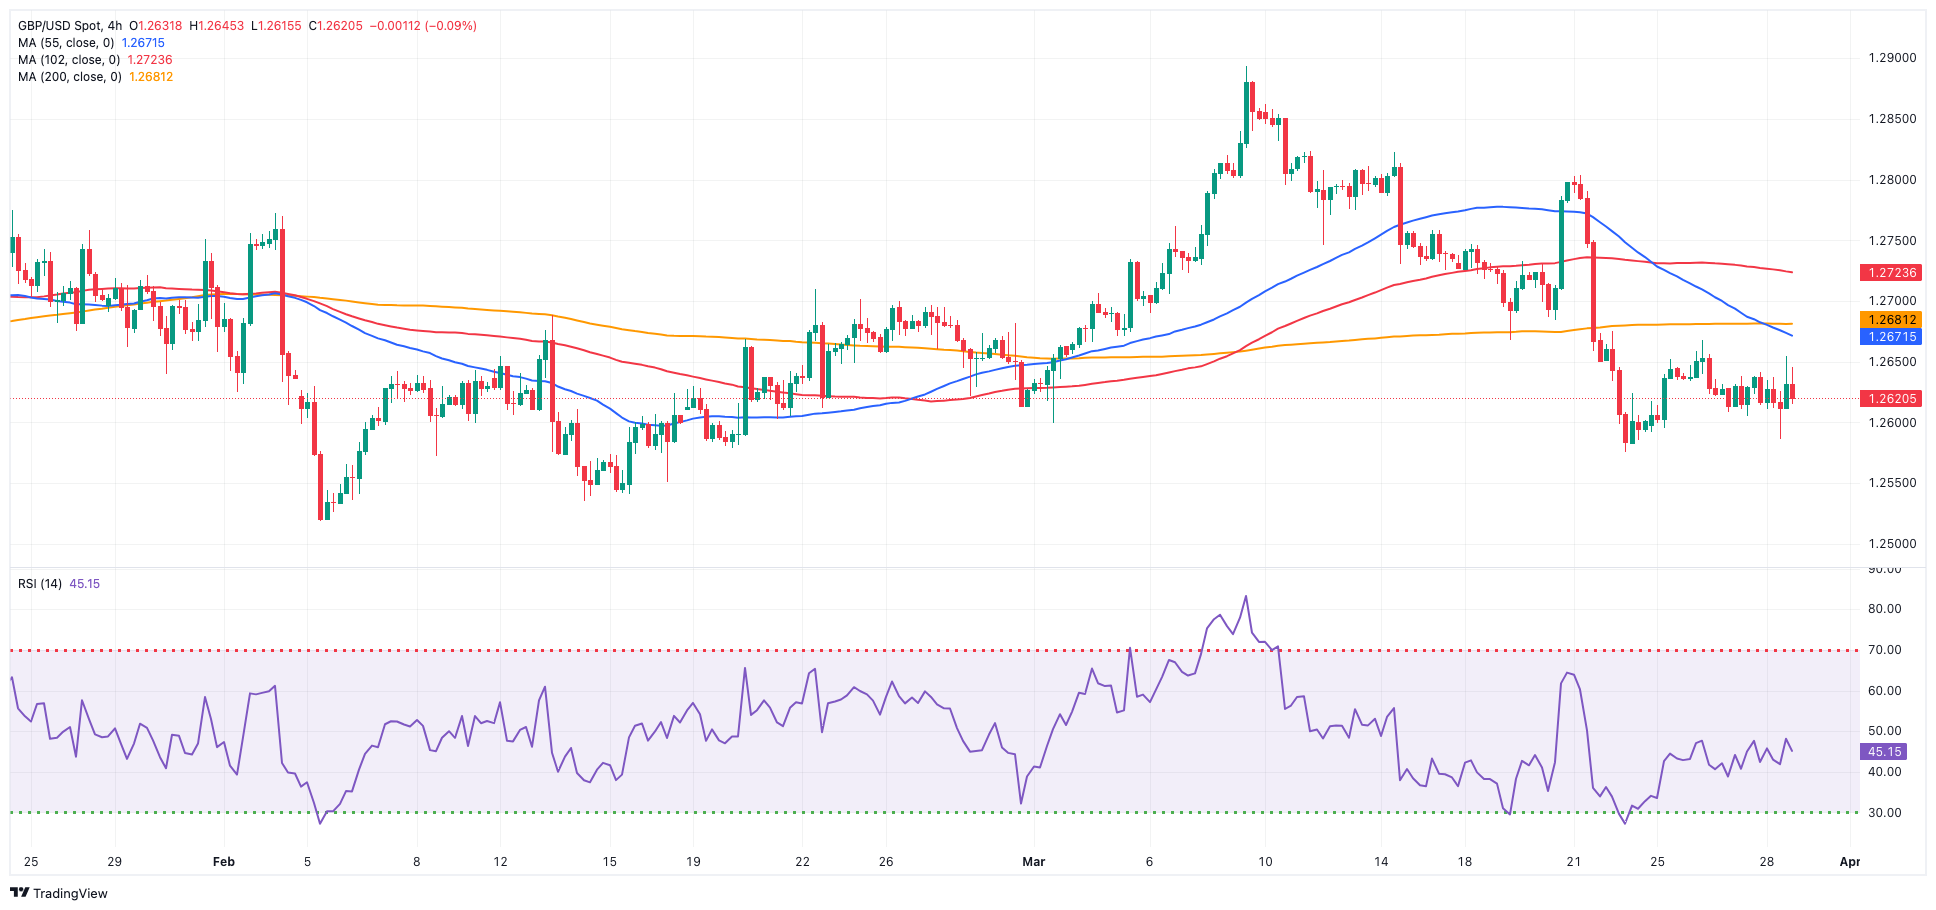
GBP/USD tested the vicinity of the 1.2580 region, an area coincident with the key 200-day SMA, on Thursday, where some initial support seems to have emerged.
In the meantime, the dollar's continued strength led to further losses in Cable, reflecting the prevailing bearish sentiment across risk-associated assets. Contrasting with the downtick in spot, UK 10-year gilt yields rose marginally to the 3.95% area.
Wednesday's UK economic calendar showed the final Q4 GDP Growth Rate contract by 0.2% YoY and 0.3% QoQ.
The loss of the March low of 1.2575 (March 22) should lead to a move towards the 2024 low of 1.2518 (February 5) and the December 2023 low of 1.2500 (December 13). A deeper retracement would not find meaningful support until the weekly low of 1.2187 (November 10, 2023), which is followed by the October 2023 low of 1.2037 and the main 1.2000 resistance line. In the opposite direction, the next upward barrier is the 2024 top of 1.2893 (March 8), followed by the weekly high of 1.2995 (July 27, 2023), before reaching the critical 1.3000 level. The day-to-day RSI dropped a little to 42.
Resistance levels: 1.2680 1.2803 1.2823 (4H chart)
Support levels: 1.2575 1.2535 1.2518 (4H chart)
GOLD
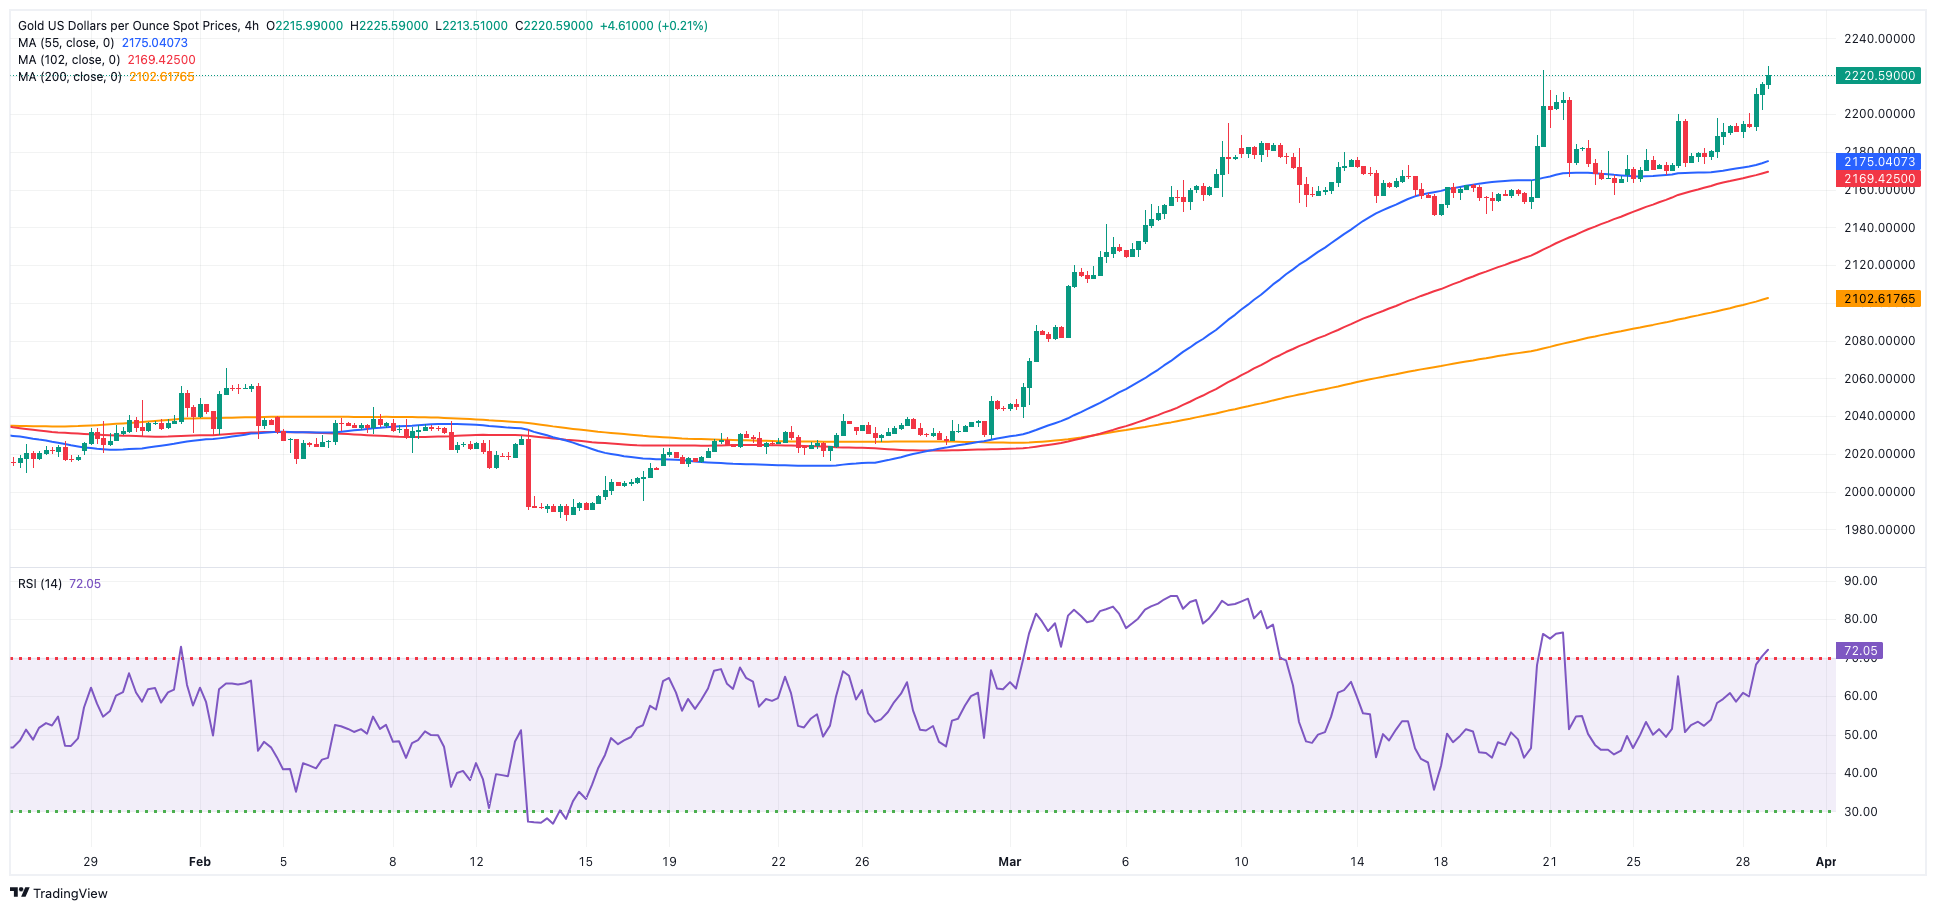
Gold prices secured their fourth consecutive daily increase, printing an all-time high around $2,225 per troy ounce mark on Thursday.
The upward movement in the precious metal was driven despite continued gains in the greenback and another day of mixed US yields across the yield curve, as investors remained focused on upcoming US inflation data tracked by the PCE, which could offer insights into the Fed’s potential timing for monetary policy adjustments.
Further supporting prices, traders may be turning to gold as a safe-haven asset due to the ongoing geopolitical tensions across the globe.
Immediately to the upside for Gold comes the all-time peak of $2,225 (March 28). On the downside, the weekly low of $2,146 (March 18) comes ahead of the preliminary 55-day and 100-day SMAs of $2,076 and $2,049, respectively. Further south is the 2024 low of $1,984 (February 14), which appears to be supported by the critical 200-day SMA ($1,988). Once the latter is resolved, a possible visit to the December 2023 low of $1,973 may commence before the November 2023 low of $1,931. The failure in this region may cause the yellow metal to test its October 2023 low of $1,810, which precedes the 2023 low of $1,804 and the crucial $1,800 conflict zone.
Resistance levels: $2,225 (4H chart)
Support levels: $2,157 $2,146 $2,103 (4H chart)
CRUDE WTI
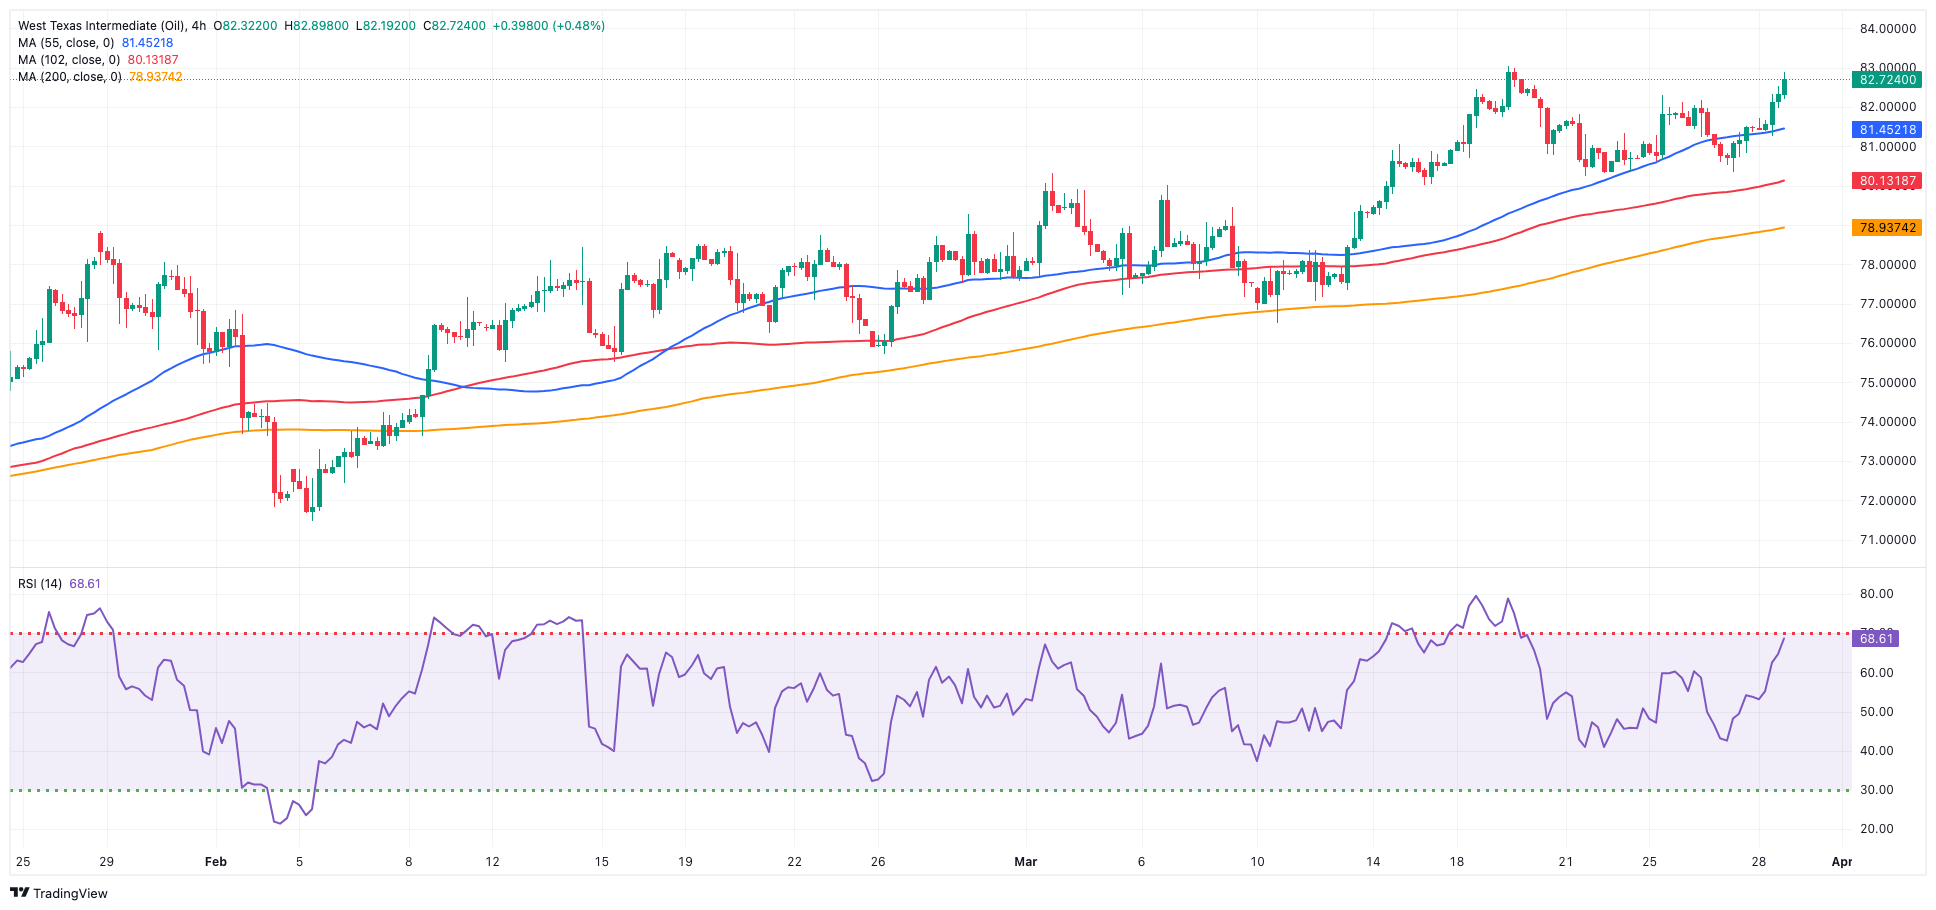
WTI prices rose to fresh peaks in levels last seen in early November around $83.20 per barrel on Thursday.
The move higher in crude oil was underpinned by the resumption of the tight supply narrative, with the OPEC+ producer alliance anticipated to maintain its current production cuts.
In addition, firmer US Q4 GDP data also added to the upbeat tone in the commodity ahead of the release of key US PCE data on Friday.
The next upward challenge for WTI is the 2024 peak of $83.17 (March 28), which comes before the weekly high of $89.83 (October 18, 2023) and the 2023 peak of $94.99 (September 28, 2023). Further north, the weekly high of $97.65 (August 30) is barely under the psychological $100.00 mark. On the other hand, the 200-day SMA provides preliminary support at $78.77, prior to the February low of $71.43 (February 5). Extra losses might push the crucial $70.00 milestone past the 2024 low of $69.31 (January 3).
Resistance levels: $83.17 $83.56 $89.82 (4H chart)
Support levels: $80.51 $78.94 $76.76 (4H chart)
GER40
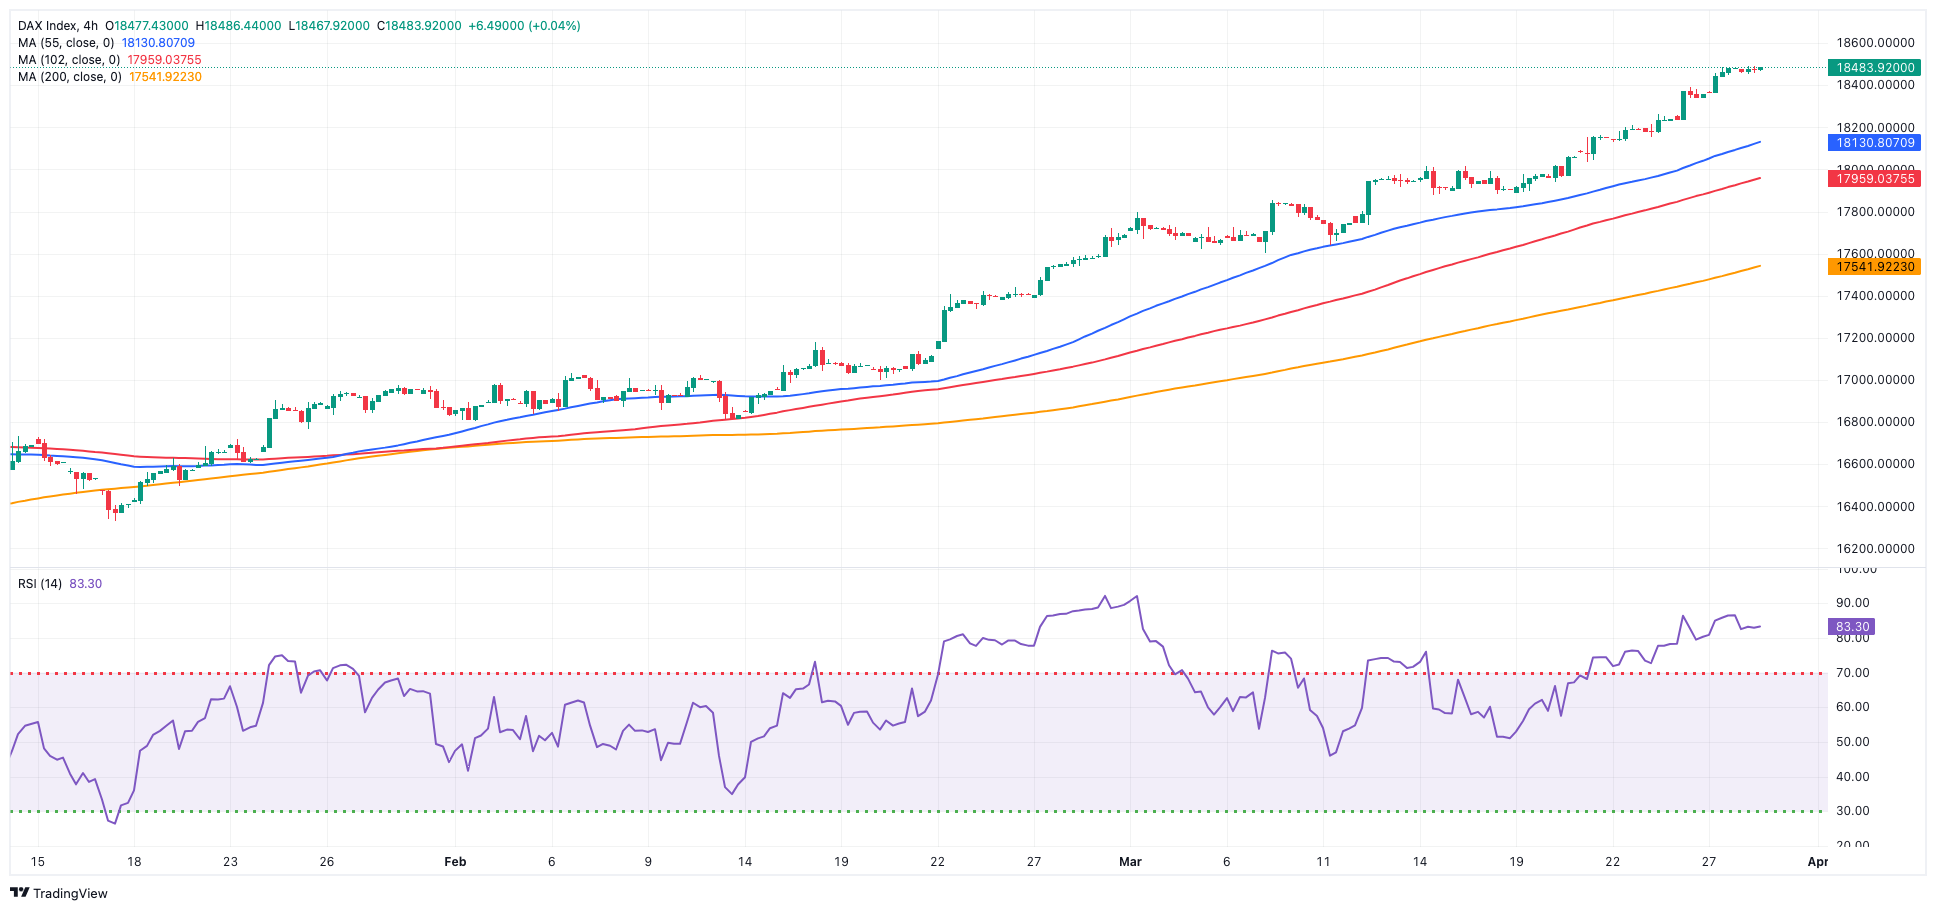
Yet another day, yet another milestone achieved by Germany's benchmark DAX40.
Indeed, on Thursday, the index surged to a historic high beyond the 18,500 mark, amidst minimal volatility and subdued trading activity ahead of the approaching Easter holidays.
The ongoing upward trajectory of the index was fueled by the prevailing expectation that major central banks will initiate their easing measures later in the year, driven by persistent disinflationary pressures.
Furthermore, investors remained optimistic that a positive outcome from the US Personal Consumption Expenditures (PCE) data, scheduled for release on Friday, would bolster the Fed’s inclination to kickstart its easing cycle, potentially as early as its June 12 meeting.
The DAX40's next level of resistance is the record high of 18,513 (March 28). Having said that, the 55-day SMA at 17,349 should provide temporary resistance till the February low of 16,821 (February 1). A loss below this level might take the index below the 2024 low of 16,345 (January 17), which is ahead of the crucial 200-day SMA at 16,265. After the latter is defeated, the weekly low of 15,915 (November 28) might be tested, followed by the October low of 14,630 (October 23) and the 2023 low of 14,458 (March 20). The daily RSI approached 87, indicating that the market remained extremely overbought.
Best Performers: Siemens Energy AG, Merck, Rheinmetall AG
Worst Performers: Deutsche Post, Dr Ing hc F Porsche Prf, Brenntag AG
Resistance levels: 18,511 (4H chart)
Support levels: 17,978 17,619 17,525 (4H chart)
GBPJPY
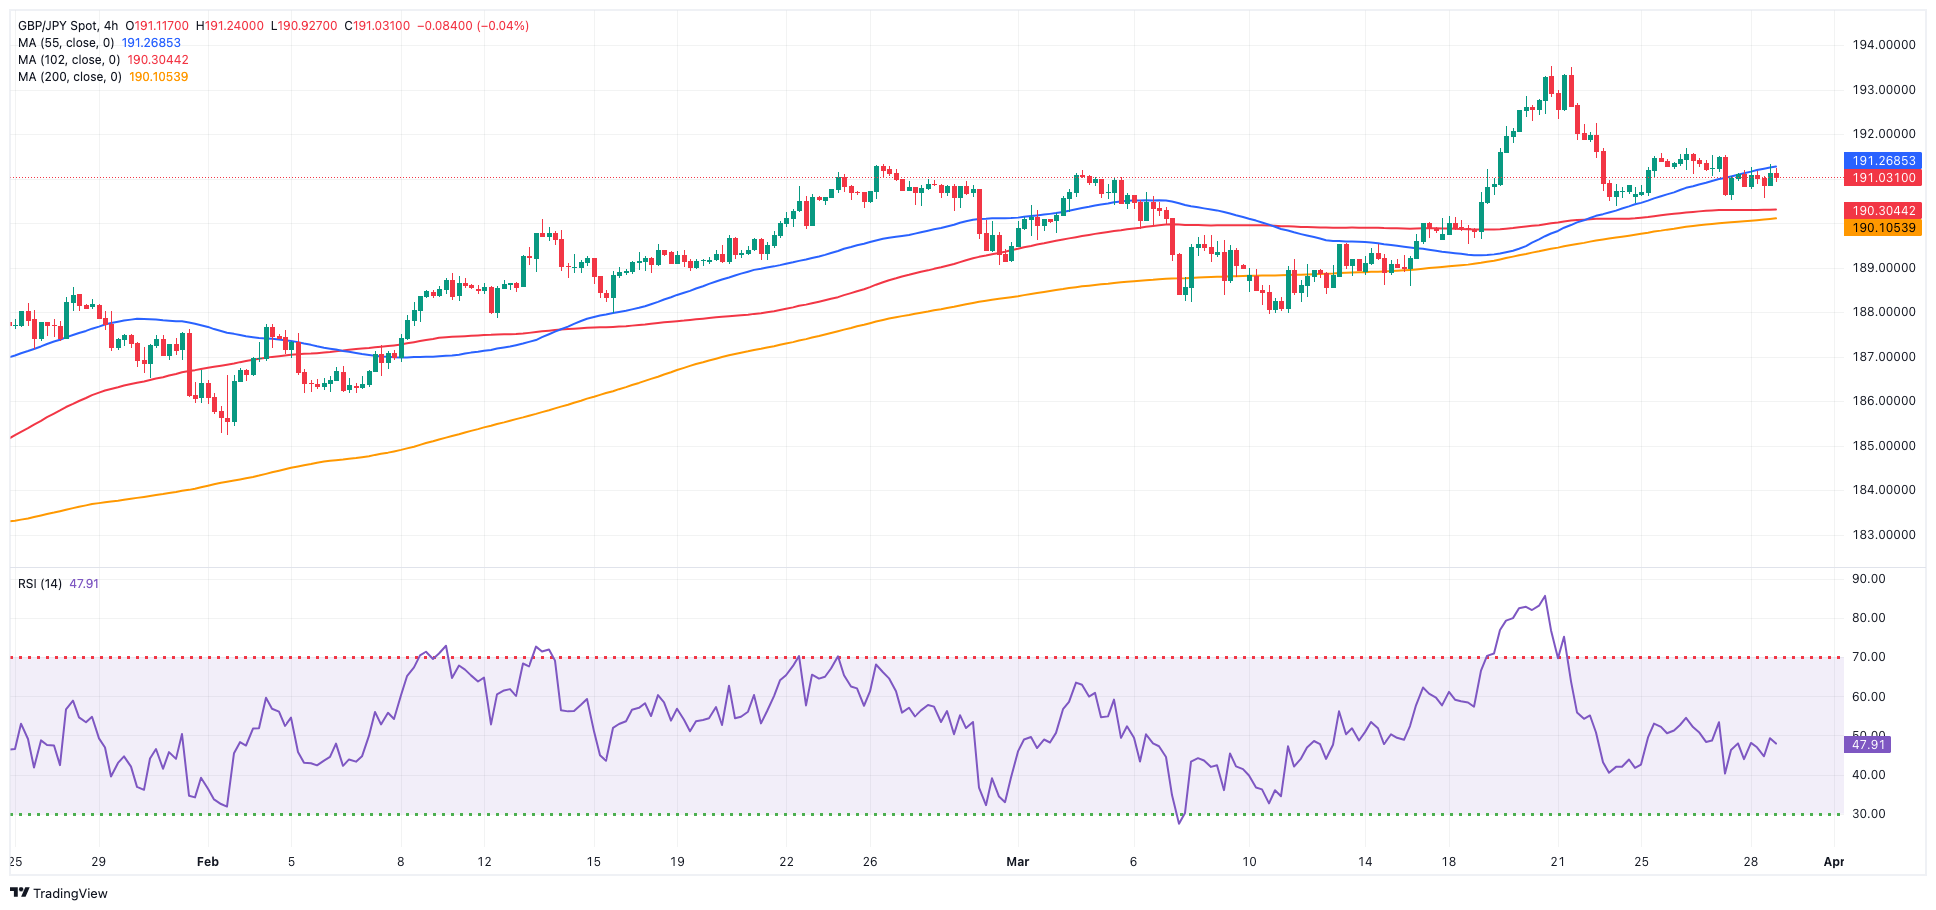
On Thursday, GBP/JPY added to the previous session’s pullback, although it maintained the weekly range unchanged around the 191.00 neighbourhood.
The ongoing risk-off sentiment kept the currency pair under pressure, driven by strengthening in the dollar. Additionally, market participants continued to digest recent statements from Japanese government and BoJ officials, amid ongoing speculation about potential intervention in the FX markets.
If bulls take control, GBP/JPY may face the 2024 high of 193.53 (March 20), before the August 2015 peak of 195.28 (August 18) and the record high of 195.88 (June 24, 2015). In the other direction, the 55-day SMA at 189.08, which precedes the March low of 187.96 (March 11), and the 100-day SMA at 186.84 provide some temporary support. Once the latter is cleared, the cross may challenge the February low of 185.22 (February 1), which is just above the critical 200-day SMA at 184.85. A deeper retracement might bring the December 2023 low of 178.33 (December 14) back into focus, preceding the October 2023 low of 178.03 and the July 2023 low of 176.30. The daily RSI deflated below 55.
Resistance levels: 191.67 193.53 195.28 (4H chart)
Support levels: 190.34 189.54 187.98 (4H chart)
NASDAQ
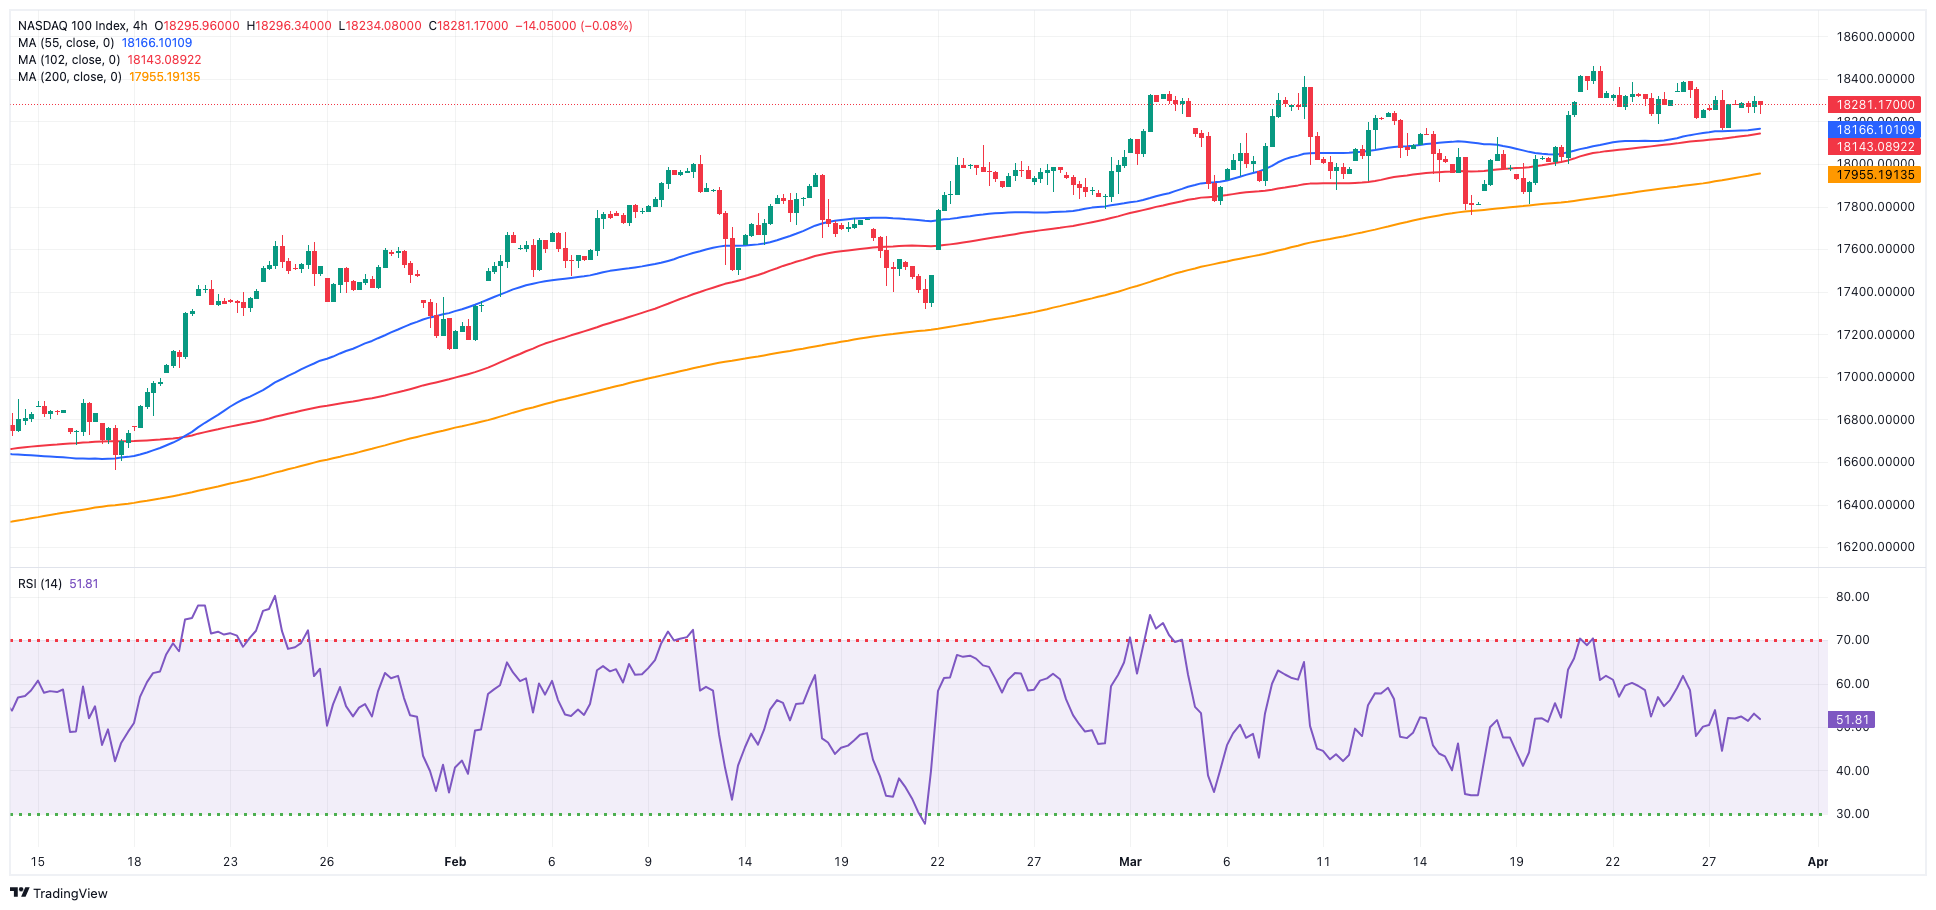
The US technology sector exhibited fluctuating behaviour on Thursday, in line with the rest of its US peers.
Specifically, the Nasdaq 100 index maintained its indecisive price movements amid alternating sentiment among market participants and the persistent bullish trend in the dollar.
On the Fed’s front, FOMC’s Waller remarked that recent underwhelming inflation figures reinforce the argument for the central bank to refrain from lowering its short-term interest rate target immediately. However, he did not dismiss the possibility of rate cuts later in the year.
Further increases might push the Nasdaq 100 above its all-time high of 18,464 (March 21). Alternatively, the index is expected to find temporary support at the 55-day SMA of 17,740, prior to weekly lows of 17,319 (February 21) and 17,128 (January 31). If the latter is overcome, the index could fall to its 2024 low of 16,249 (January 5), ahead of the critical 200-day SMA of 16,049 and the December 2023 low of 15,695 (December 4). Additional losses from here may test the October 2023 level of 14,058 (October 26), before the April 2023 low of 12,724 (April 25) and the March 2023 low of 11,695 (March 13). The daily RSI deflated marginally to the 56 area.
Top Gainers: Walgreen Boots, Old Dominion Freight Line
Top Losers: Moderna, ON Semiconductor, Coca-Cola European
Resistance levels: 18,464 (4H chart)
Support levels: 17,764 17,319 17,128 (4H chart)
DOW JONES
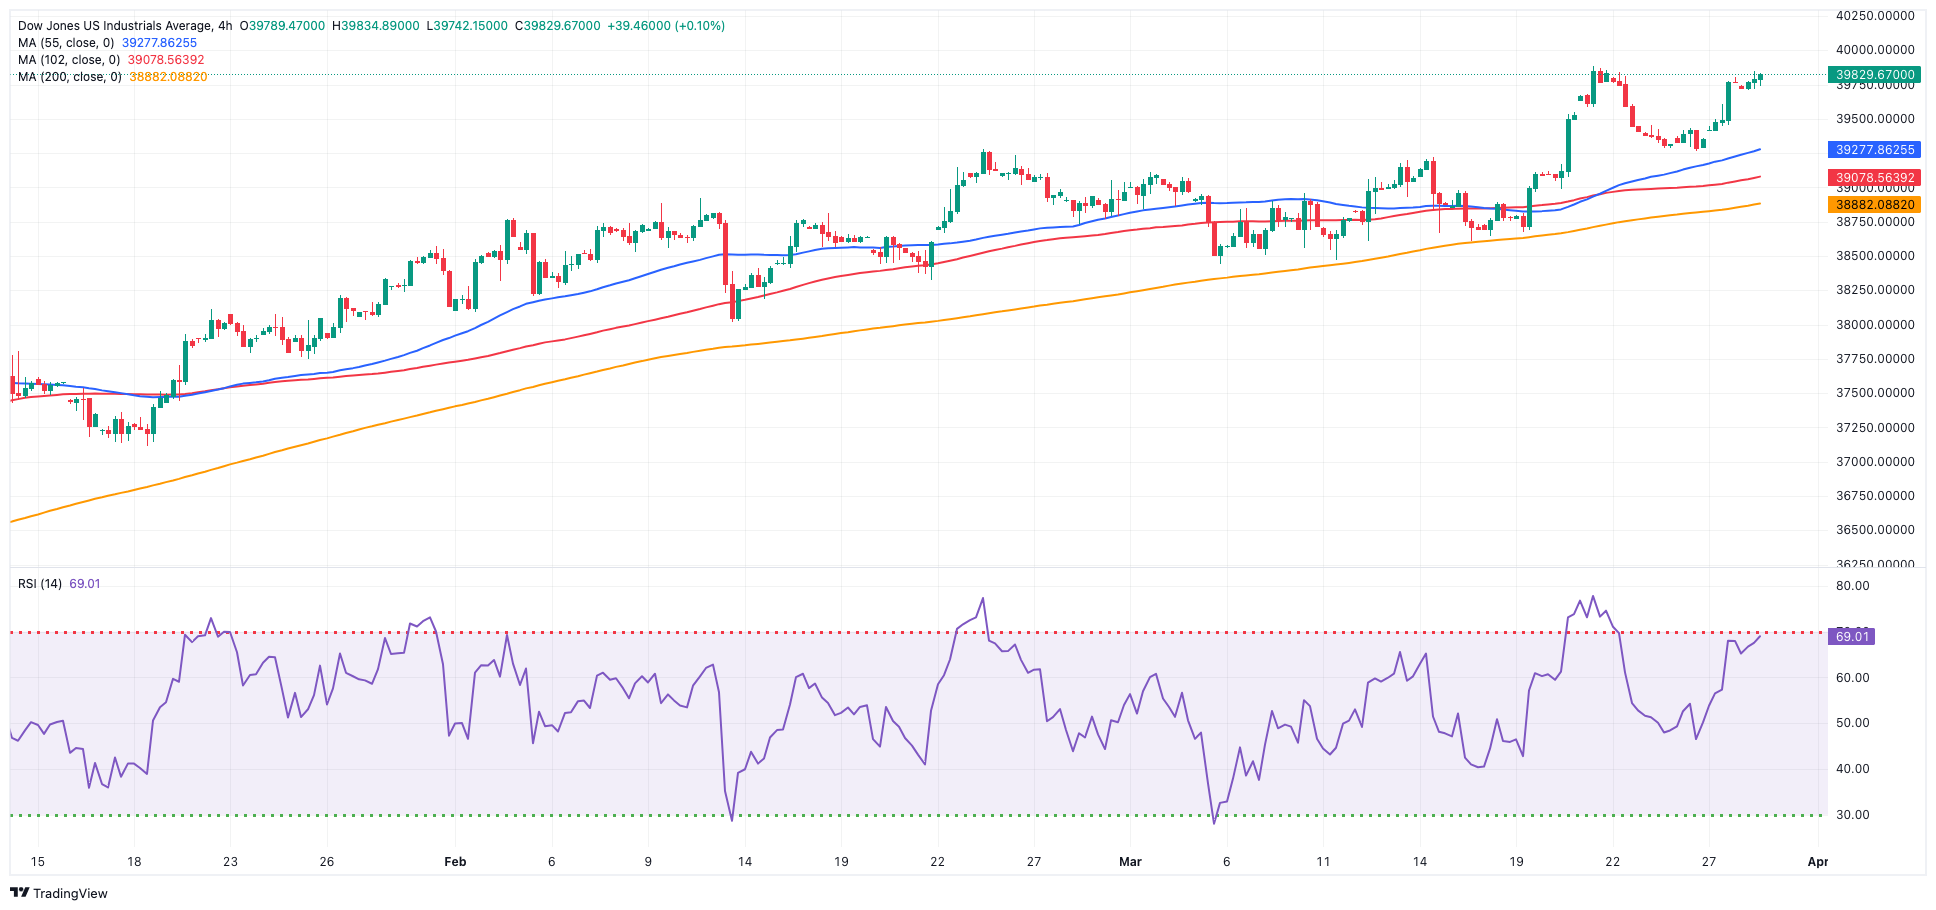
US stocks traded in an inconclusive note, leaving the benchmark Dow Jones in the area close to its recent all-time tops around 39,800 on Thursday.
Price action in the index came in line with the general lack of volatility as the Easter holidays are closer.
Contributing to the index's performance were auspicious data results in the US docket ahead of the release of US PCE on March 29, while expectations over the earnings season also collaborated with the sentiment.
On Thursday, the Dow Jones rose 0.03% to 39,582, the S&P 500 advanced 0.08% to 5,252, and the tech-focused Nasdaq Composite eased 0.12% to 16,378.
The Dow Jones may reach a record high of 39,889 (March 21) if further gains are made. On the other hand, the 55-day SMA of 38,623 provides temporary support, followed by the 2024 low of 37,122 (January 18) and the weekly low of 37,073 (December 20, 2023). If the index falls below this level, it may reach the preliminary 100-day SMA at 37,501 before descending to the 200-day SMA at 35,885. The weekly low of 33,859 (November 7, 2023) comes next, followed by the October 2023 low of 32,327 (October 27). The daily RSI rose past 65.
Top Performers: EM, Walt Disney, Verizon
Worst Performers: Apple, Amgen, Walmart
Resistance levels: 39,889 (4H chart)
Support levels: 38,646 38,457 38,039 (4H chart)
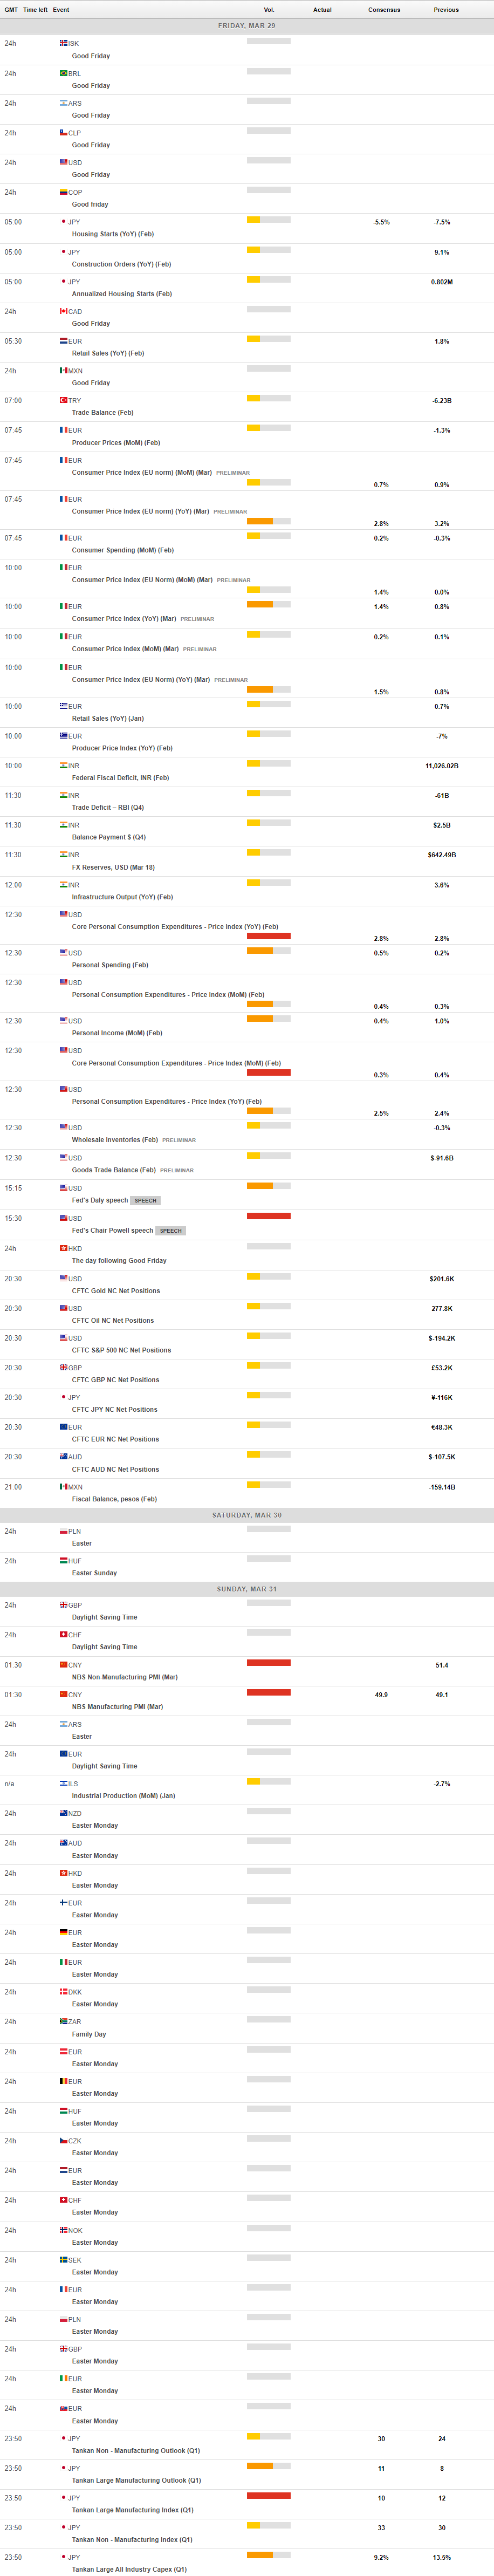
MACROECONOMIC EVENTS
All Information & Updates provided by:

All information relating to the financial markets available on this page has been prepared and issued by FXStreet (Forexstreet SL, Spain, Reg: B62498233) on the basis of publicly available information and all information believed to be reliable and does not conflict with Kuwaiti local laws, and all necessary care has been taken to before the company to ensure that the facts mentioned are correct from the source.
NCM Investment nor any of its directors or employees shall in any way be held responsible for the contents of this news, and the information contained on this page is intended only to provide clients with publicly available information and should not be construed as investment advice, report or analysis and/or constitute an offer or invitation to buy or sell financial instruments of any kind.
RISK WARNING: Forex and CFDs are highly risky leveraged products, as losses can exceed deposits. Please ensure you understand all the risks and take independent advice if necessary. NCM will segregate the clients based on the criteria of the regulator and its bylaws. NCM does not provide any advisory service; the material published does not constitute advice or a recommendation for a transaction in any financial instrument. NCM accepts no responsibility for any use of the content presented and any consequences of that use. Anyone acting on the information provided does so at their own risk.