
- Contact Us:
-

-

-

-


Daily Market Updates
01 Apr 2024
EURUSD
The dollar’s weekly rebound faltered at the end of the week, leaving the USD Index (DXY) slightly in red territory and closing the week with losses for the first time after three consecutive advances.
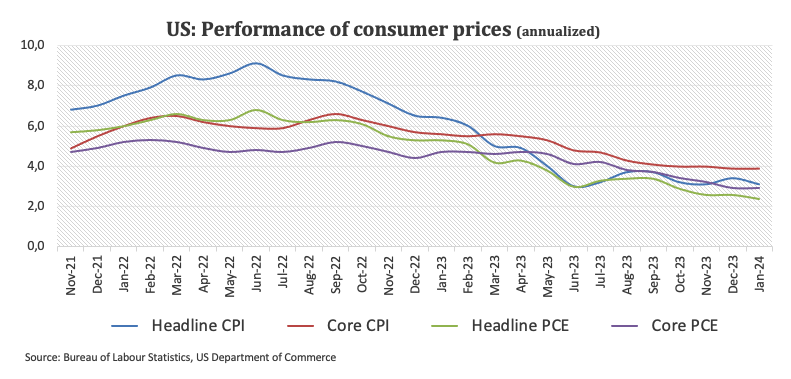
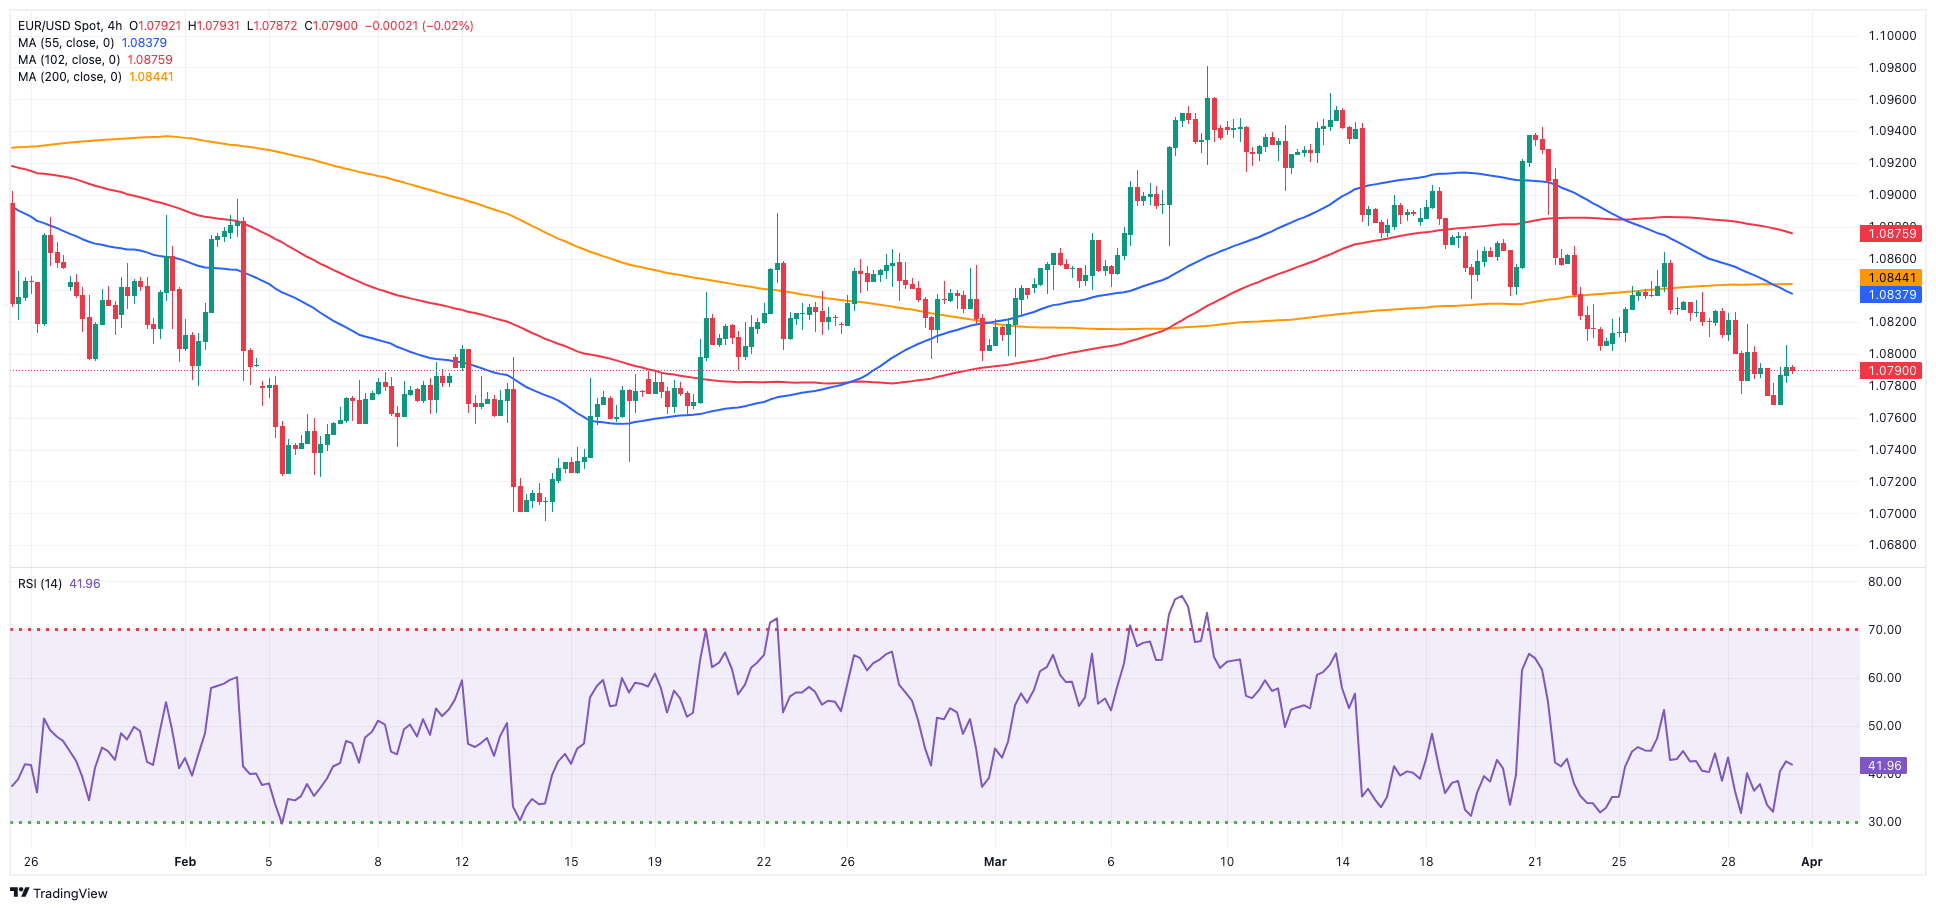
Against that backdrop, EUR/USD managed to bounce off fresh five-week lows near 1.0770, attempting to stabilize in the wake of another sticky US PCE reading.
In fact, US inflation tracked by the headline PCE rose at an annualized 2.5% (from 2.4%), while the Core PCE gained 2.8% over the last twelve months.
Speaking about monetary policy, there were no surprises from Chair Powell at his interview at the Federal Reserve Bank of San Francisco, where he stated his anticipation that future interest rates will be lower than their current levels. However, he clarified that he does not foresee rates dropping to the extremely low levels seen before the COVID-19 pandemic. Powell also expressed his belief that the economy has not been significantly impacted by the current high interest rates.
Additional results in the US calendar showed Advanced Goods Trade Balance showing a $91.84B deficit in February, Personal Income expanding by 0.3% MoM in February, and Personal Spending increasing by 0.8% vs. the previous month.
EUR/USD may decline further, reaching its March low of 1.0767 (March 29) before falling to its 2024 low of 1.0694 (February 14). A deeper drop may show the weekly low of 1.0495 (October 13, 2023), which is prior to the 2023 low of 1.0448 (October 3) and the round milestone of 1.0400. Instead, the initial up-barrier appears at the March high of 1.0981 (March 8), prior to the weekly top of 1.0998 (January 5, 2011) and the psychological 1.1000 barrier. The breakout of this zone may put pressure on the December 2023 peak of 1.1139 (December 27), which is still supported by the 200-week SMA of 1.1146 and is prior to the 2023 high of 1.1275 (July 18). The daily RSI rose marginally past 40.
Resistance levels: 1.0843 1.0864 1.0942 (4H chart)
Support levels: 1.0767 1.0694 1.0656 (4H chart)
USDJPY
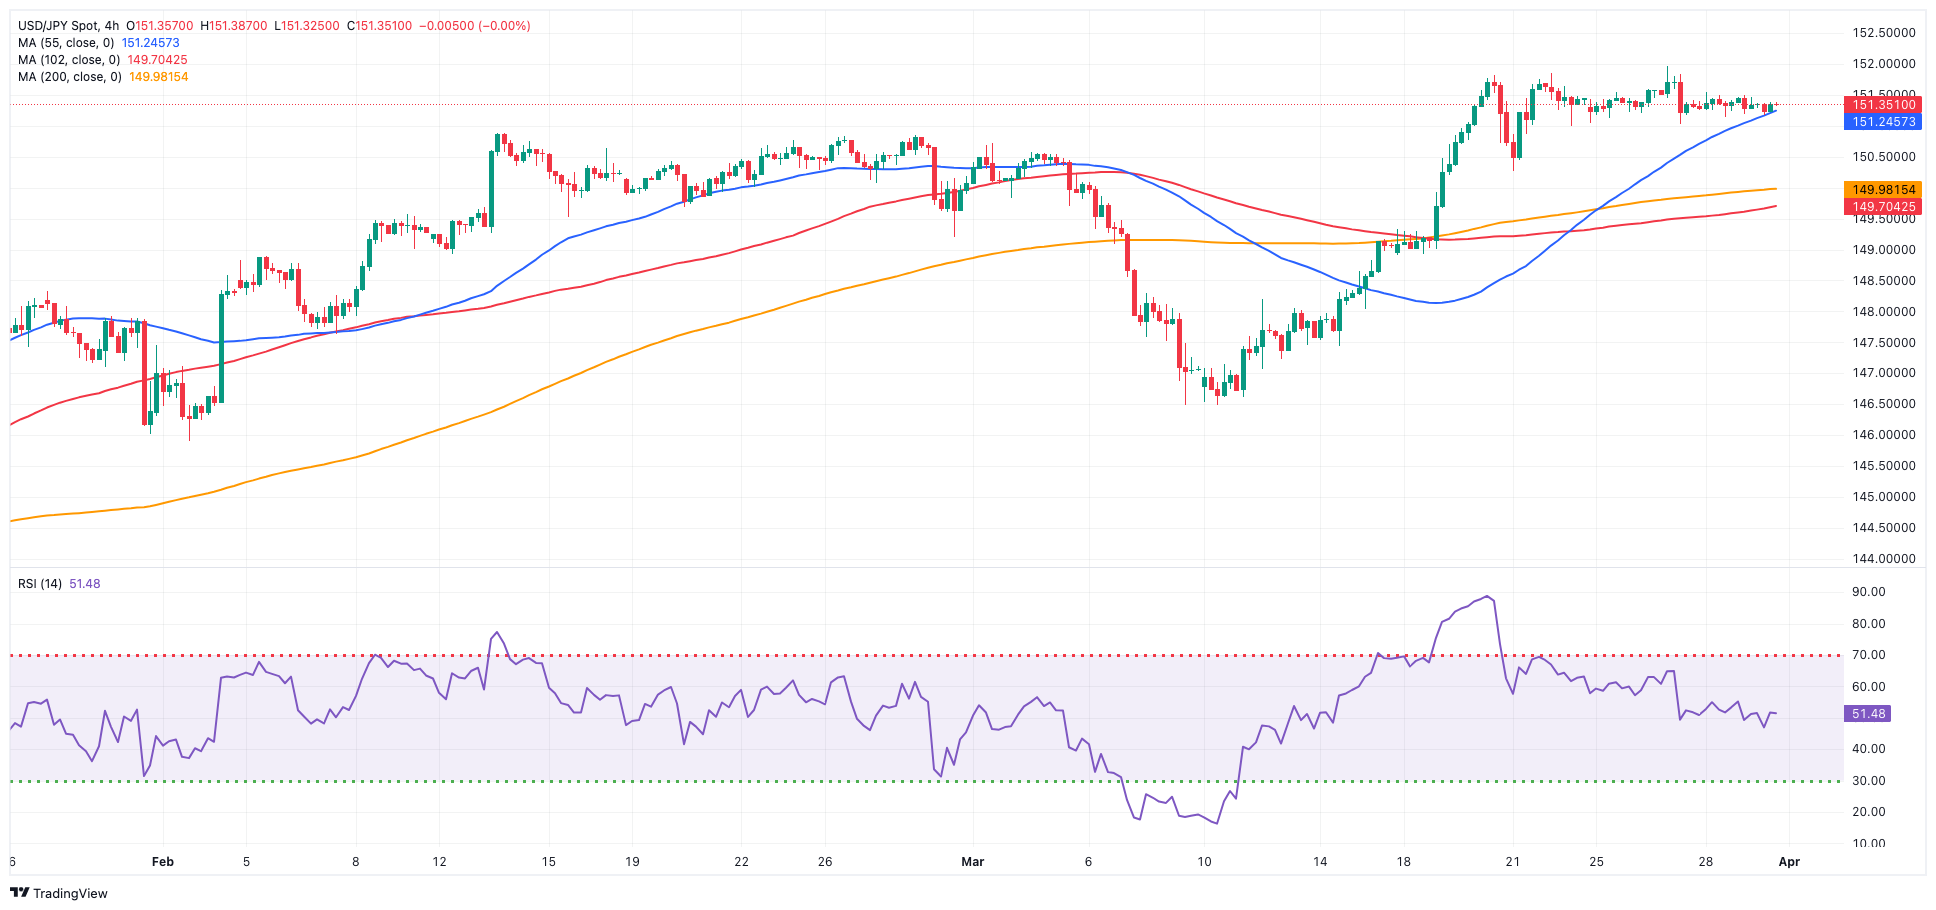
USD/JPY remained in a consolidation phase, with little change from the previous day's close during the Good Friday session, after hitting levels last observed in 1990 earlier in the week.
It's noteworthy that the pair has been trading within a narrow range just below the 152.00 level throughout the week, amidst ongoing concerns about possible FX intervention.
On the latter, Japan's Finmin Suzuki emphasized the significance of currencies reflecting fundamentals and moving in a stable manner. He expressed concern over rapid fluctuations in FX rates, attributing speculative activity to such movements. Suzuki highlighted the government's vigilance regarding FX developments and asserted readiness to take the necessary measures to address disorderly FX movements. He emphasized monitoring the speed rather than the level of FX fluctuations.
In the Japanese docket, results from the month of February saw the Unemployment Rate tick higher to 2.6% in February, Retail Sales expand above estimates by 4.6% YoY, Housing starts contract by 8.2% from a year earlier, and preliminary Industrial Production contract by 3.4% over the last twelve months.
USD/JPY faces an immediate upward barrier at the 2024 high of 151.97 (March 27), just before round number of 152.00. On the contrary, the pair is expected to find temporary support at the 55-day and 100-day SMAs of 149.21 and 147.67, respectively, all before the key 200-day SMA of 146.87 and the March low of 146.47 (March 8). A breakdown of this zone might lead to a return to the February low of 145.89 (February 1), which comes before the December 2023 bottom of 140.24 (December 28), the round number 140.00, and the July low of 137.23 (July 14). The daily RSI retreated slightly below 63.
Resistance levels: 151.97 155.80 160.25 (4H chart)
Support levels: 151.02 150.26 149.97 (4H chart)
GBPUSD
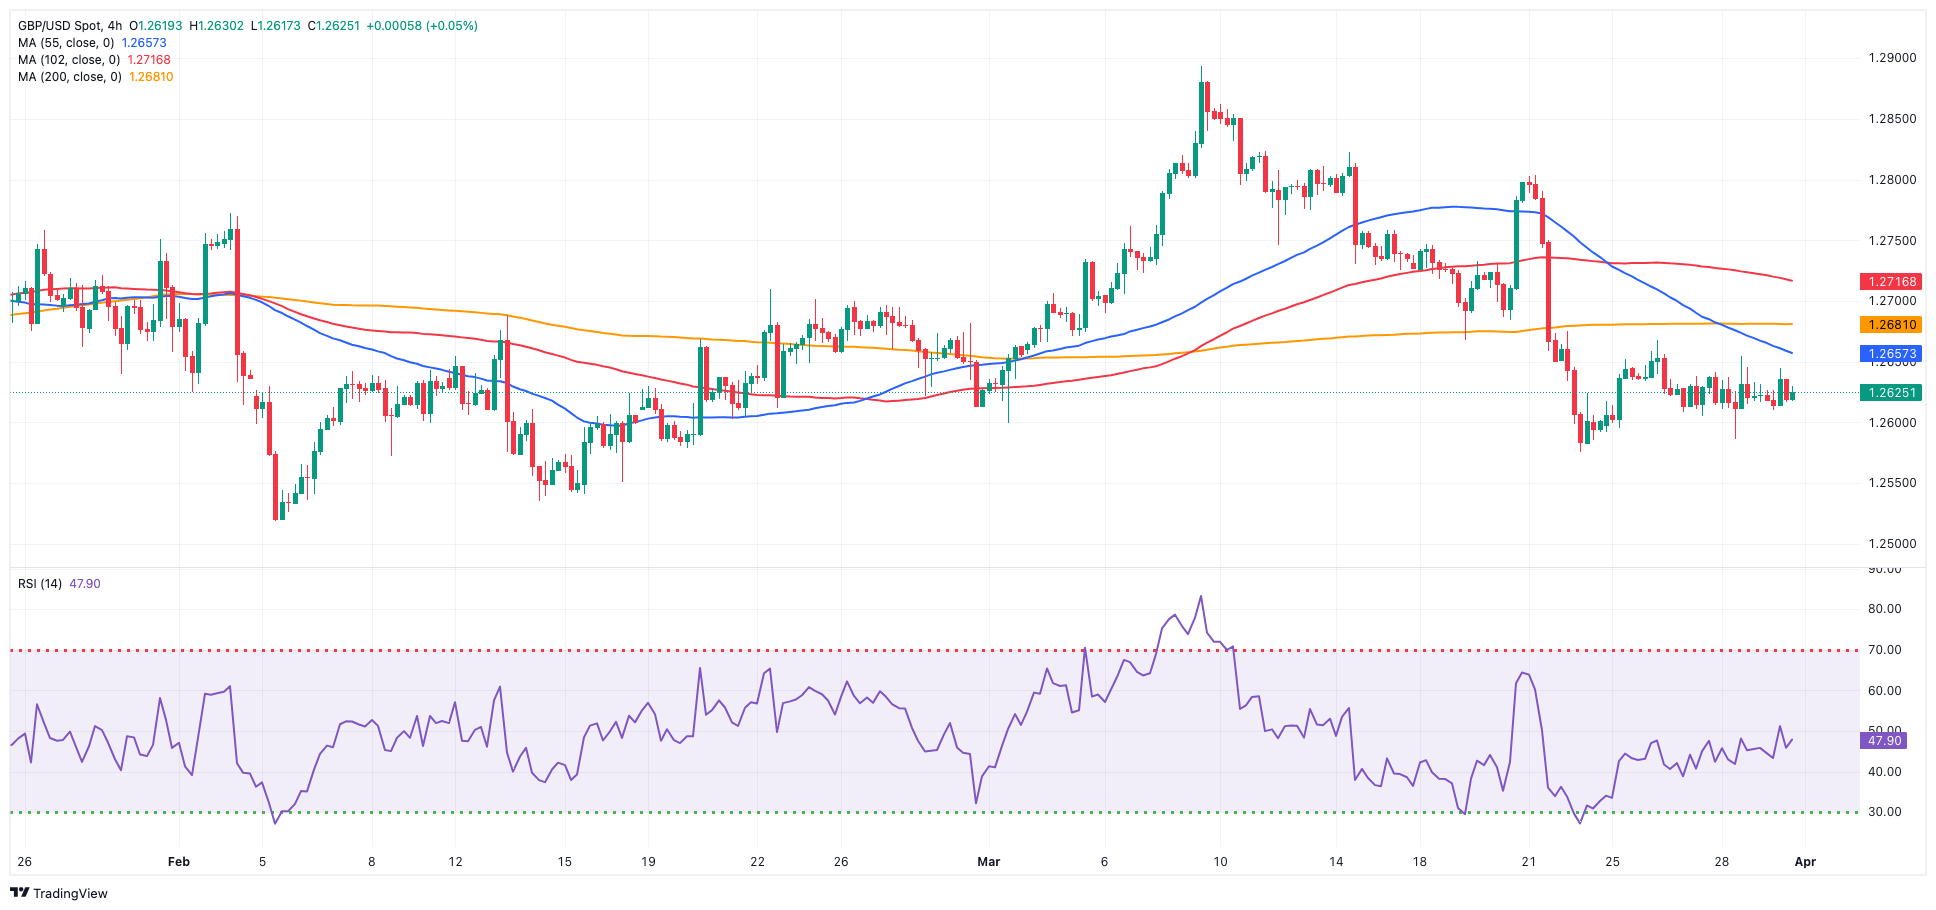
GBP/USD could not sustain an earlier move to daily highs near 1.2650, running out of steam afterwards and sliding to the 1.2620-1.2615 band towards the end of the NA session on Good Friday.
Meanwhile, price action around Cable was in tandem with marginal losses in the greenback, all against the backdrop of the generalized flat developments in the FX galaxy amid the kickstart of the Easter holiday and inactivity on most European markets.
There were no data releases scheduled across the Channel at the end of the week.
The loss of the March low of 1.2575 (March 22) could morph into a pullback towards the 2024 low of 1.2518 (February 5) ahead of the December 2023 bottom of 1.2500 (December 13). A deeper decline would not find significant support until the weekly low of 1.2187 (November 10, 2023), ahead of the October 2023 low of 1.2037 and the main 1.2000 support line. Just the opposite, the next upward barrier is the 2024 peak of 1.2893 (March 8), followed by the weekly high of 1.2995 (July 27, 2023) and the important 1.3000 level. The everyday RSI declined somewhat below 42.
Resistance levels: 1.2680 1.2803 1.2823 (4H chart)
Support levels: 1.2585 1.2575 1.2535 (4H chart)
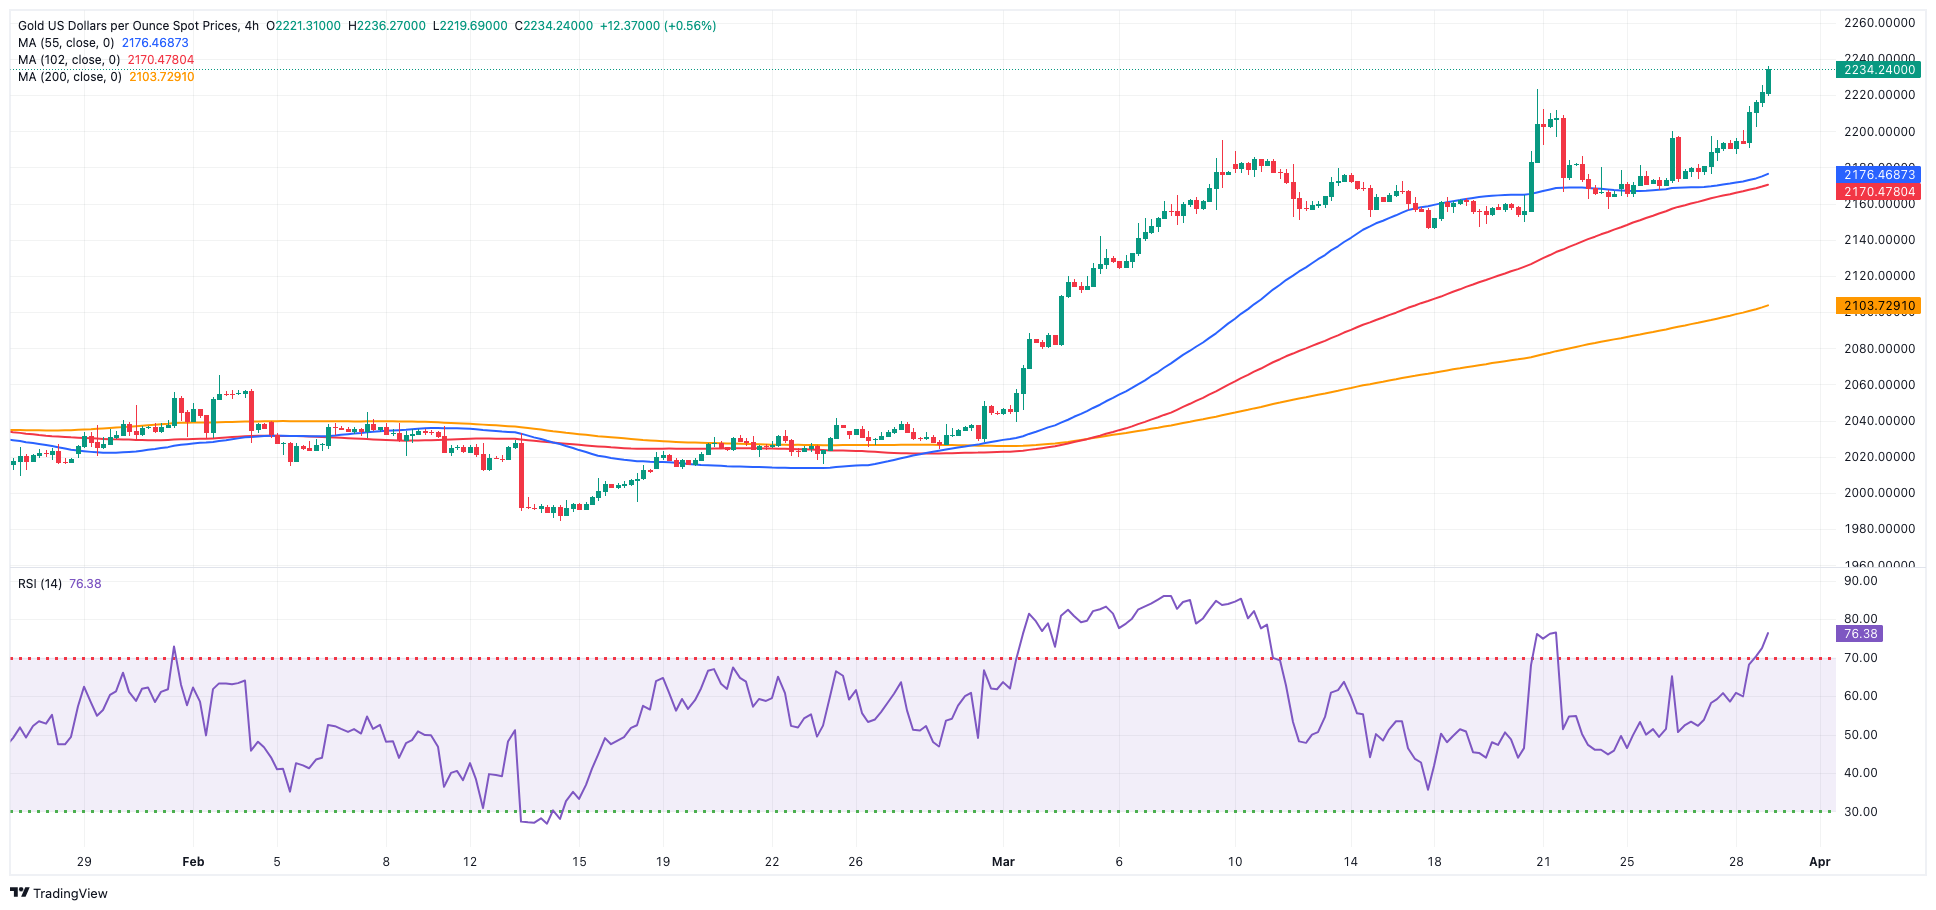
GOLD
Gold prices secured their fourth consecutive daily increase, printing an all-time high of $2,236 per troy ounce on Thursday.
The upward movement in the precious metal was primarily driven by safe-haven demand in the context of unabated geopolitical tensions across the globe, while the prospects of interest rate cuts by the Fed also bolstered prices.
Extra strength in the yellow metal came from the mixed performance of US yields across the curve, which saw small gains in the short end and the belly of the curve vs. a slight decline in the long end.
Gold faces immediate resistance at its all-time high of $2,236 (March 28). On the downside, the weekly low of $2,146 (March 18) comes first, seconded by the preliminary 55-day and 100-day SMAs of $2,076 and $2,049, respectively. Further south is the 2024 low of $1,984 (February 14), which appears to be supported by the important 200-day SMA ($1,988). Once the latter is addressed, a possible visit to the December 2023 low of $1,973 might begin before the November 2023 low of $1,931. The failure in this location may force the yellow metal to test its October 2023 bottom of $1,810, which is closely followed by the 2023 low of $1,804 and the critical $1,800 conflict zone.
Resistance levels: $2,236 (4H chart)
Support levels: $2,157 $2,146 $2,103 (4H chart)
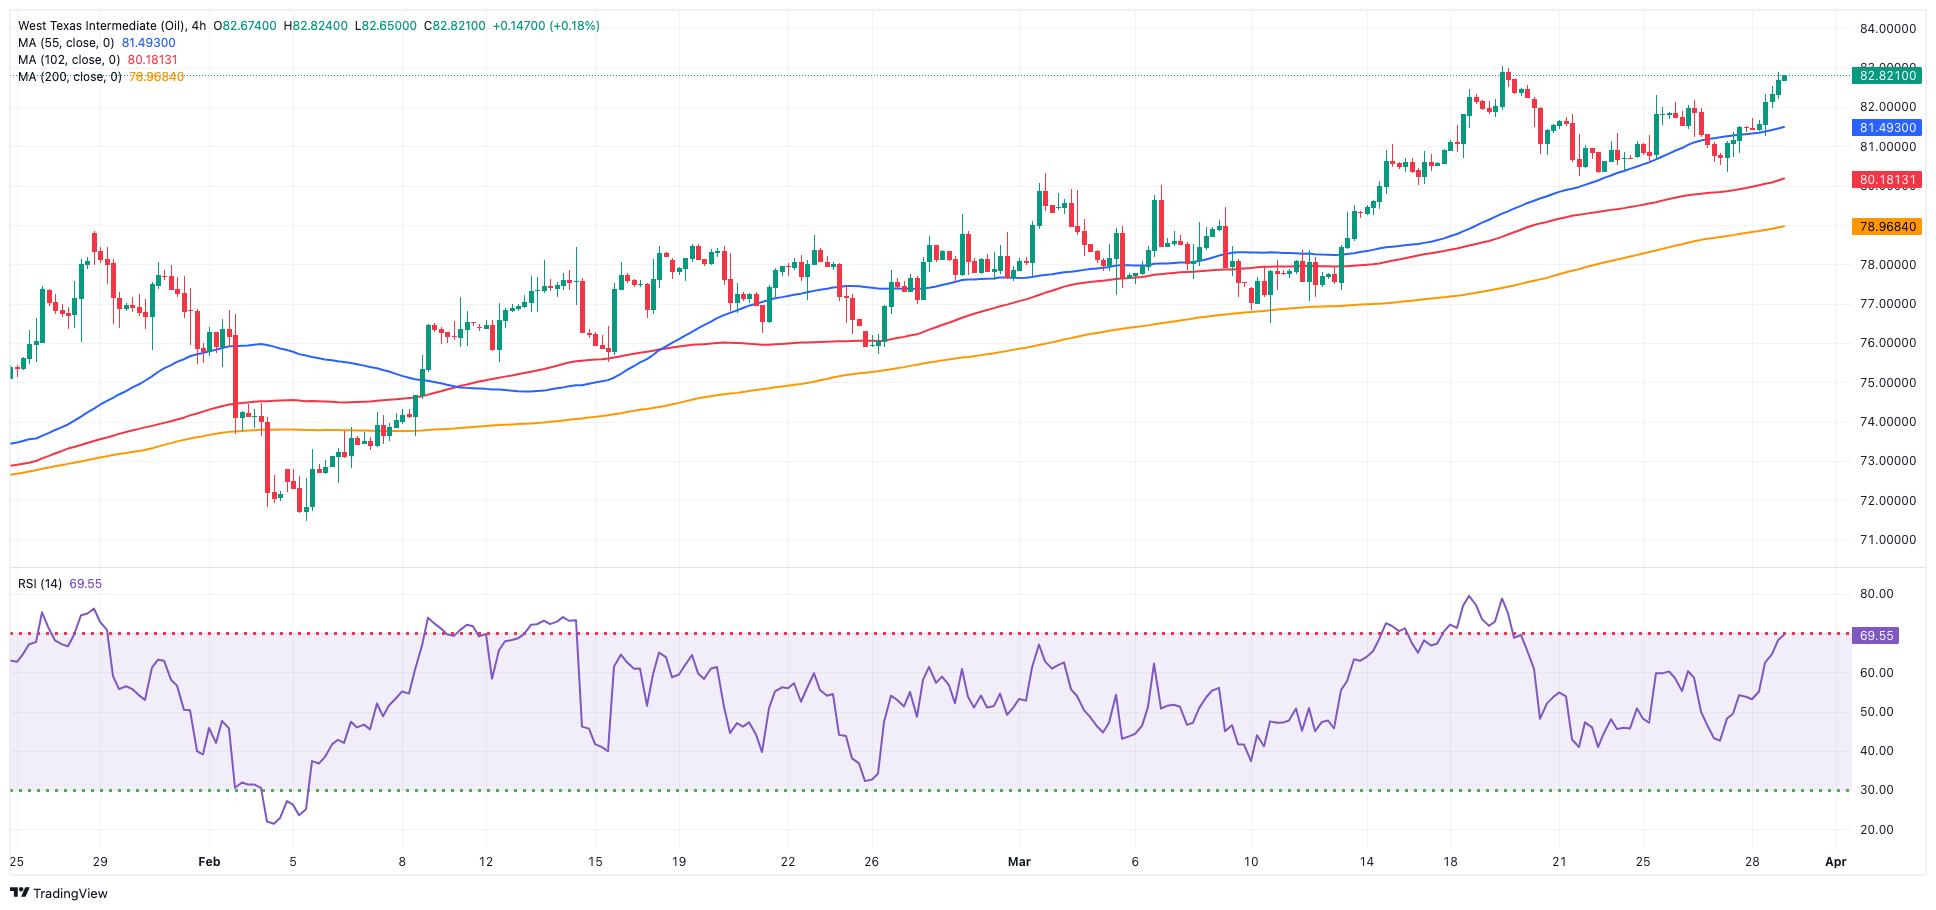
CRUDE WTI
On Thursday, WTI prices surged to new highs, reaching levels not seen since early November near $83.20 per barrel, just to settle around $83.00 towards the end of the session.
The increase in crude oil prices was supported by the revival of concerns regarding tight supply, with expectations that the OPEC+ producer alliance will continue its existing production cuts.
Furthermore, stronger US Q4 GDP data contributed to the positive sentiment surrounding the commodity, along with firm hopes that the Fed might start reducing its interest rates in the next few months.
On Friday, Deputy Prime Minister Alexander Novak stated that Russia has opted to prioritize reducing oil production rather than exports in the second quarter, a decision that aims to distribute production cuts evenly among other OPEC+ member nations.
The next upward challenge for WTI is the 2024 peak of $83.17 (March 28), which precedes the weekly high of $89.83 (October 18, 2023) and the 2023 top of $94.99 (September 28, 2023). Further north, the weekly peak of $97.65 (August 30) is just below the psychological $100.00 milestone. The other way around, the 200-day SMA, offers immediate contention at $78.77, ahead of the February low of $71.43 (February 5). Extra losses might push the critical $70.00 milestone over the 2024 low of $69.31 (January 3) and the December 2023 bottom of $67.74 (December 13).
Resistance levels: $83.17 $83.56 $89.82 (4H chart)
Support levels: $80.51 $79.16 $76.76 (4H chart)
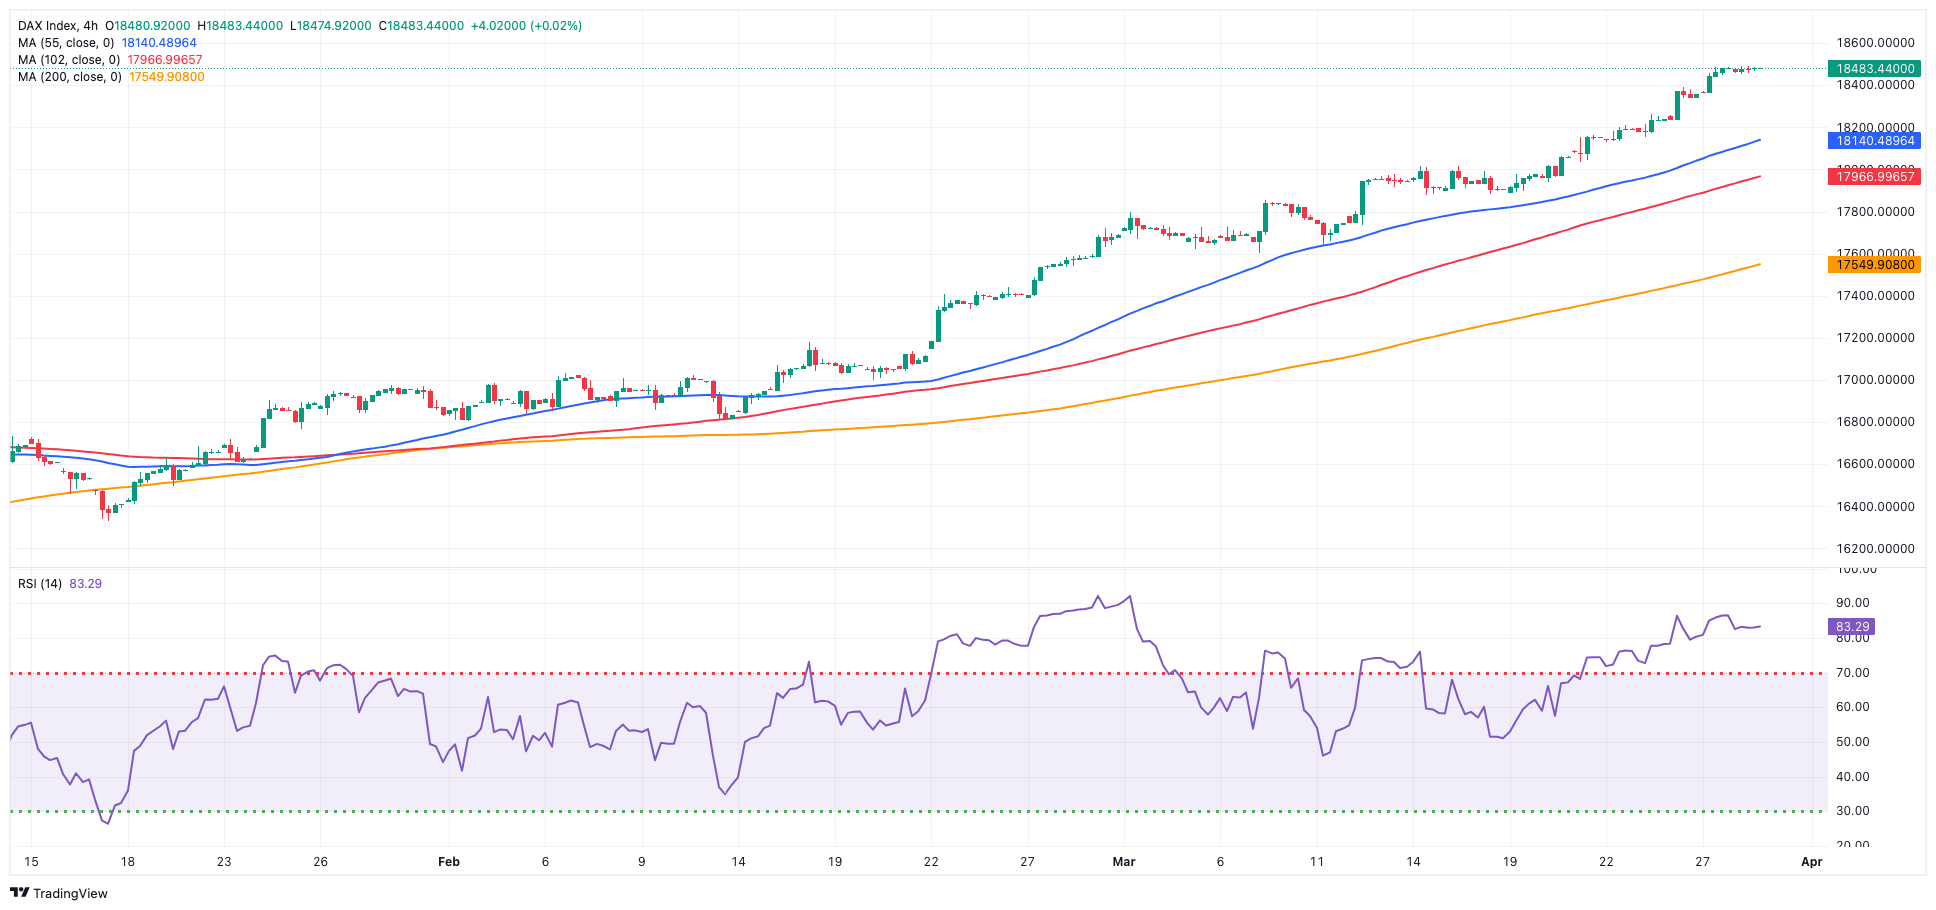
GER40
European stock markets were closed on Good Friday.
During the previous session, Germany's reference DAX40 has reached a significant milestone, seeing the index climb to an unprecedented level just above 18,500 points. This surge occurred amidst minimal volatility and subdued trading activity as the Easter holidays approached.
The continuous upward movement of the index was driven by expectations that major central banks will implement easing measures later this year due to ongoing disinflationary pressures.
Additionally, investors remained positive that favourable results from the upcoming US inflation data gauged by the PCE could prompt the FED to begin its easing cycle, possibly as soon as its June 12 meeting.
While European markets were close on Good Friday, it is worth pointing out that US headline PCE matched estimates and rose by 2.5% in the year to February and 2.8% when it came to the Core PCE.
The DAX40's next level of resistance is the record high of 18,513 (March 28). Having said that, the 55-day SMA at 17,349 should serve as temporary support before the February low of 16,821 (February 1). A drop below this level might drag the index to its 2024 low of 16,345 (January 17), which is ahead of the critical 200-day SMA at 16,265. After the latter is cleared, the weekly low of 15,915 (November 28) might be tested, seconded by the October low of 14,630 (October 23) and the 2023 low of 14,458 (March 20). The daily RSI approached 87, implying that the market remained very overbought.
Best Performers: Siemens Energy AG, Merck, Rheinmetall AG
Worst Performers: Deutsche Post, Dr Ing hc F Porsche Prf, Brenntag AG
Resistance levels: 18,511 (4H chart)
Support levels: 18,020 17,619 17,226 (4H chart)
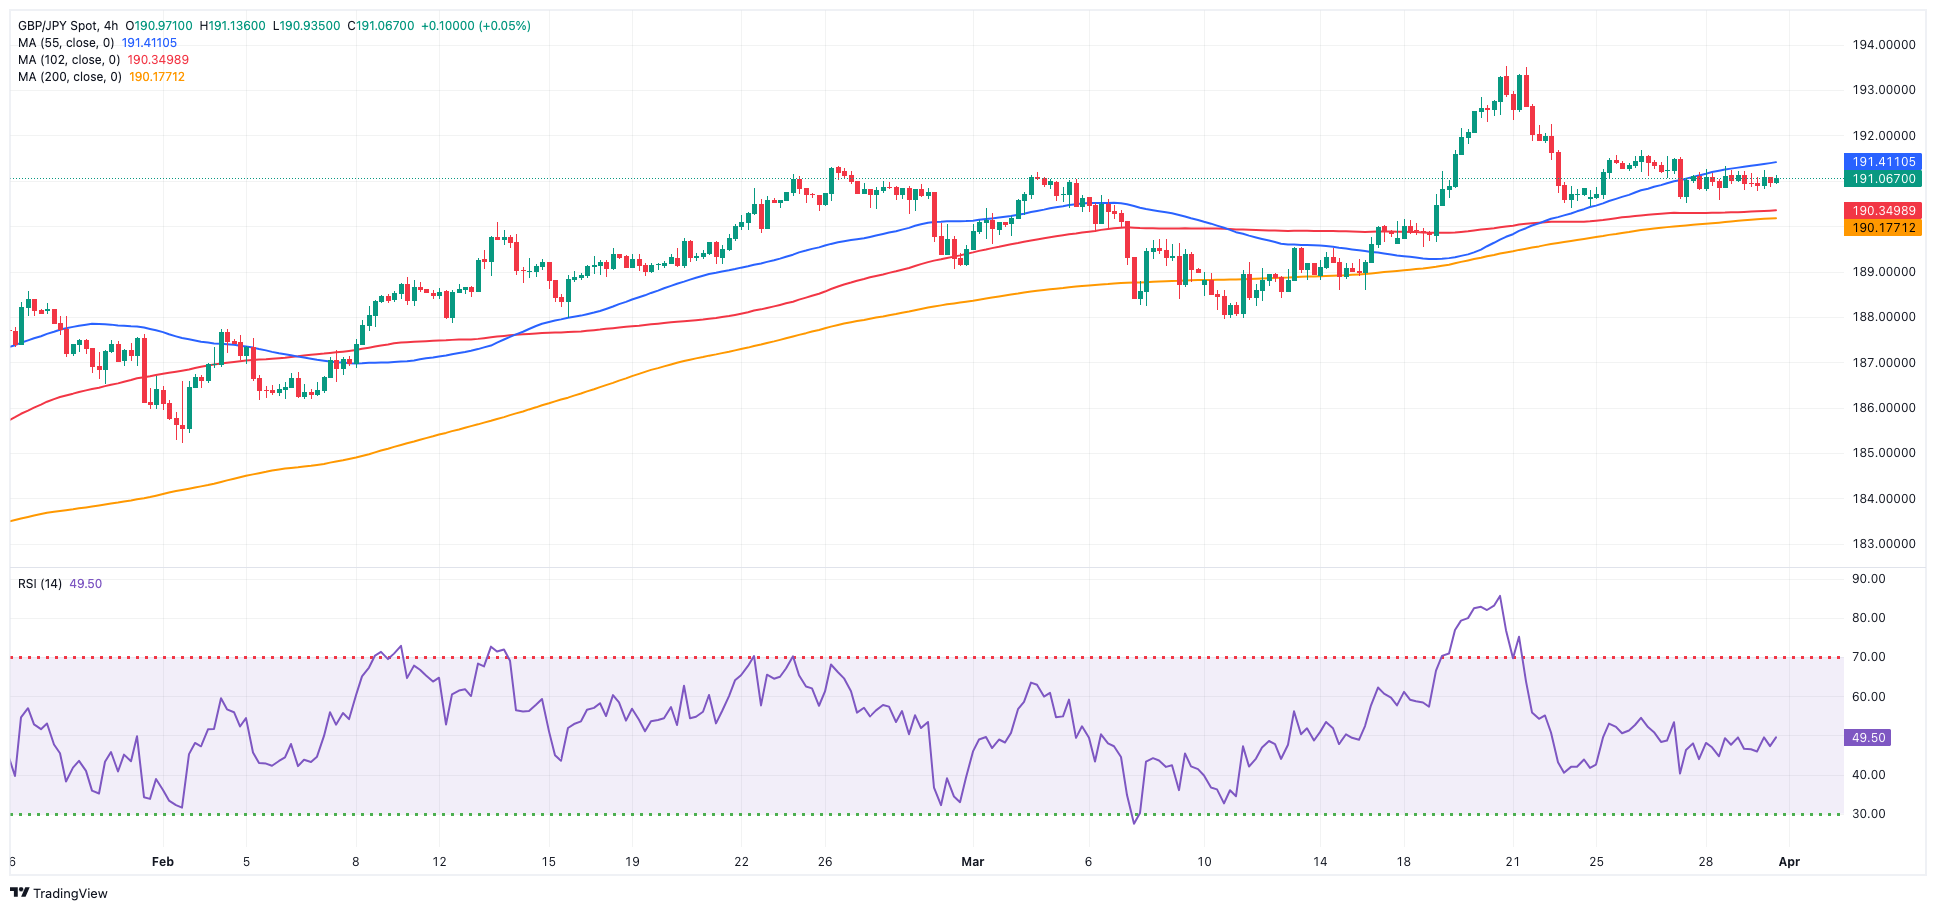
GBPJPY
The broad-based consolidative mood in the FX universe prompted GBP/JPY to trade in a tight range around the 191.00 region, eventually ending the week with marginal losses.
The prevailing risk-averse sentiment exerted downward pressure on the cross throughout most of the week, mainly fueled by the strengthening of the dollar and a range-bound theme surrounding the British pound.
Around the Japanese yen, concerns surrounding a potential FX intervention remained well on the rise, propped up by comments from the BoJ and government officials.
If bulls retake control, GBP/JPY could reach its 2024 top of 193.53 (March 20), ahead of the August 2015 peak of 195.28 (August 18) and the record high of 195.88 (June 24, 2015). In the other direction, the 55-day SMA at 189.19 offers interim support ahead of the March low of 187.96 (March 11), and the temporary 100-day SMA at 186.90. Once the latter is passed, the cross might target the February low of 185.22 (February 1), which is just above the crucial 200-day SMA of 184.89. A deeper retracement might bring the December 2023 low of 178.33 (December 14) back into view, ahead of the October 2023 bottom of 178.03 and the July 2023 low of 176.31 (July 28). The daily RSI slipped back below 55.
Resistance levels: 191.67 193.53 195.28 (4H chart)
Support levels: 190.34 189.54 187.98 (4H chart)
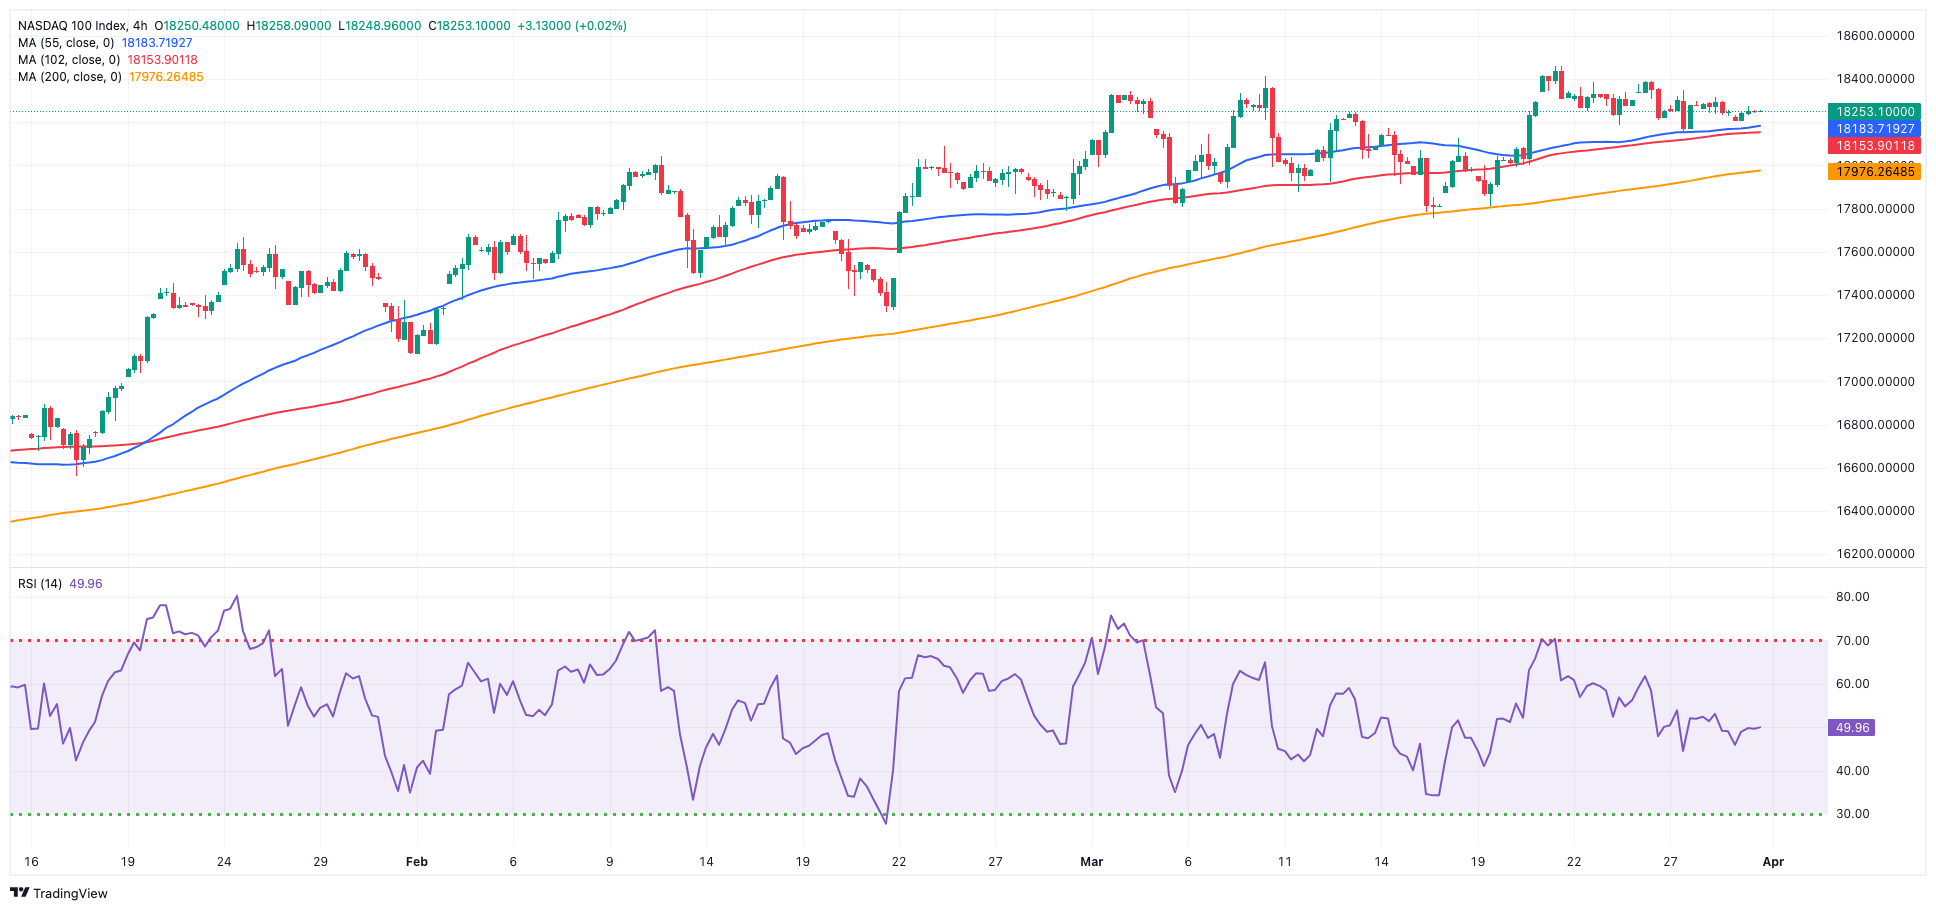
NASDAQ
US markets were closed on Good Friday.
During the previous session, the US technology sector demonstrated variable performance, echoing the behaviour of other US counterparts, ultimately closing the session with slight declines.
In particular, the Nasdaq 100 index showed uncertain price fluctuations amid mixed sentiment among investors and the ongoing upward trend of the dollar, which was accompanied by mixed developments in the US yield curve.
Regarding the Fed’s stance, FOMC's Waller stated that recent disappointing inflation data supports the case for the central bank to hold off on immediately lowering its short-term interest rate target. However, he did not rule out the possibility of rate cuts later in the year.
Further gains might take the Nasdaq 100 above its all-time high of 18,464 (March 21). Alternatively, the index is likely to find transitory contention at the 55-day SMA of 17,740, prior to weekly lows of 17,319 (February 21) and 17,128 (January 31). If the latter is surpassed, the index may fall to its 2024 low of 16,249 (January 5), ahead of the key 200-day SMA of 16,049 and the December 2023 low of 15,695 (December 4). Additional losses from here might revisit the October 2023 level of 14,058 (October 26), before the April 2023 low of 12,724 (April 25) and the March 2023 low of 11,695 (March 13). The daily RSI deflated somewhat below 57.
Top Gainers: Walgreen Boots, Old Dominion Freight Line, Analog Devices
Top Losers: Moderna, ON Semiconductor, Tesla
Resistance levels: 18,464 (4H chart)
Support levels: 17,764 17,319 17,128 (4H chart)
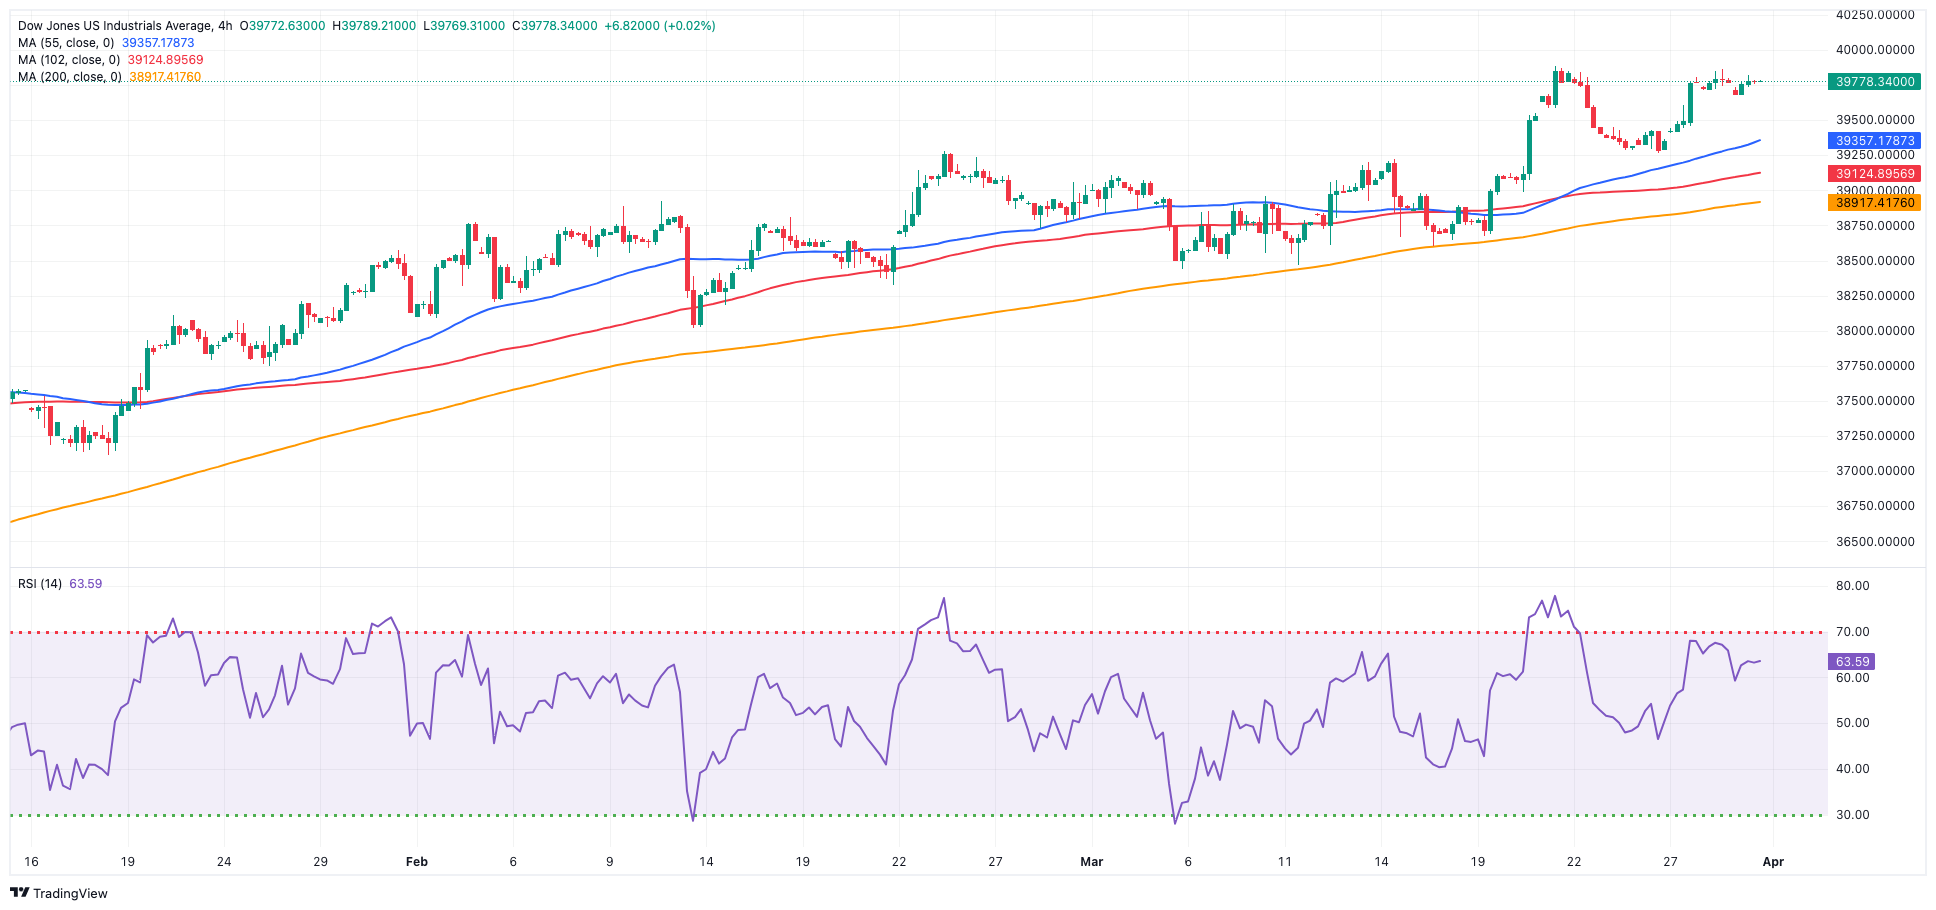
DOW JONES
American stocks traded with uncertainty, with the benchmark Dow Jones hovering near its recent all-time highs around 39,800 on Maundy Thursday, up modestly for the day.
The index's movement mirrored the overall low volatility in the market as the Easter holidays approached.
Factors influencing the index's performance included positive data releases in the US before the release of the US PCE on March 29, as well as expectations surrounding the earnings season, which contributed to market sentiment.
All in all, the Dow Jones rose 0.12% to 39,807, the S&P 500 advanced 0.11% to 5,254, and the tech-oriented Nasdaq Composite deflated 0.12% to 16,379.
If more increases are made, the Dow Jones might dispute its record high of 39,889 (March 21). On the other hand, there is provisional support at the 55-day SMA of 38,623, prior to the 2024 low of 37,122 (January 18) and the weekly low of 37,073 (December 20, 2023). If the index falls below this level, it might approach the preliminary 100-day SMA at 37,502 before attempting to test the 200-day SMA at 35,885. The weekly low of 33,859 (November 7, 2023) is followed by the October 2023 low of 32,327 (October 27), all ahead of the 2023 bottom of 31,429 (March 15). The daily RSI climbed a tad over 65.
Top Performers: 3M, Walt Disney, Verizon
Worst Performers: Apple, Walmart, Amgen
Resistance levels: 39,889 (4H chart)
Support levels: 38,623 38,457 38,039 (4H chart)
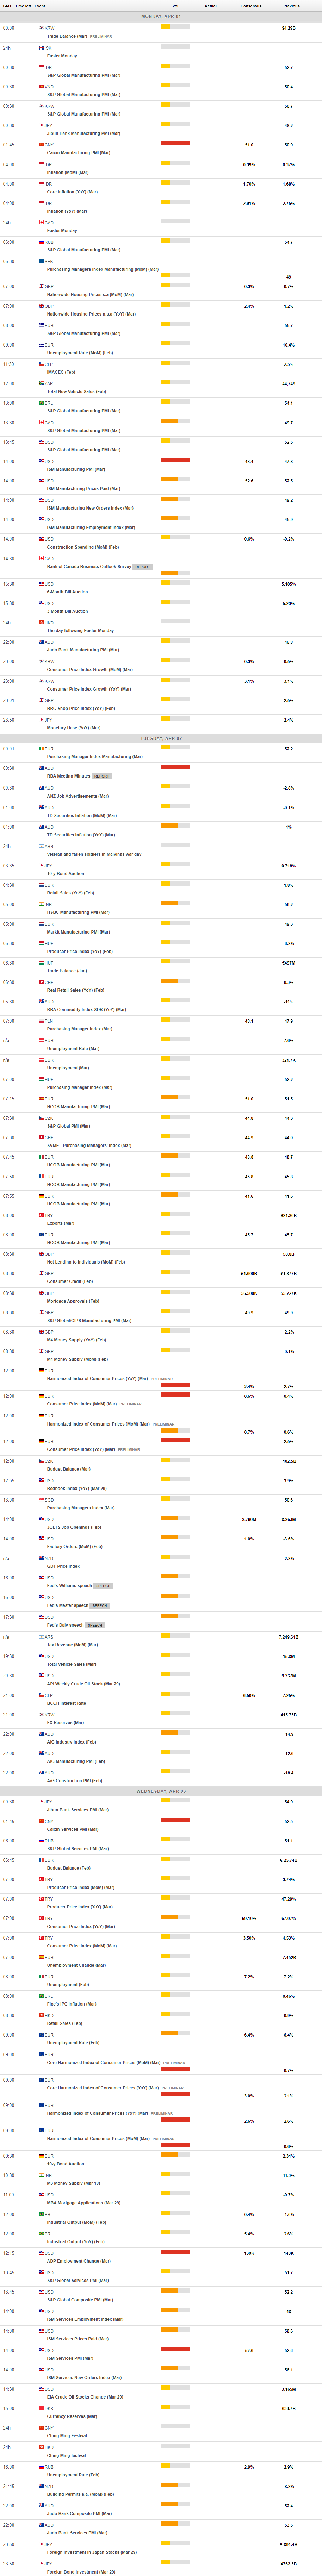
MACROECONOMIC EVENTS
All Information & Updates provided by:

All information relating to the financial markets available on this page has been prepared and issued by FXStreet (Forexstreet SL, Spain, Reg: B62498233) on the basis of publicly available information and all information believed to be reliable and does not conflict with Kuwaiti local laws, and all necessary care has been taken to before the company to ensure that the facts mentioned are correct from the source.
NCM Investment nor any of its directors or employees shall in any way be held responsible for the contents of this news, and the information contained on this page is intended only to provide clients with publicly available information and should not be construed as investment advice, report or analysis and/or constitute an offer or invitation to buy or sell financial instruments of any kind.
RISK WARNING: Forex and CFDs are highly risky leveraged products, as losses can exceed deposits. Please ensure you understand all the risks and take independent advice if necessary. NCM will segregate the clients based on the criteria of the regulator and its bylaws. NCM does not provide any advisory service; the material published does not constitute advice or a recommendation for a transaction in any financial instrument. NCM accepts no responsibility for any use of the content presented and any consequences of that use. Anyone acting on the information provided does so at their own risk.