
- Contact Us:
-

-

-

-


Daily Market Updates
02 Apr 2024
EURUSD
The greenback kicked off the week on a strong foot, advancing to levels last visited in early November 2023 north of the 105.00 barrier when tracked by the USD Index (DXY) on Monday.
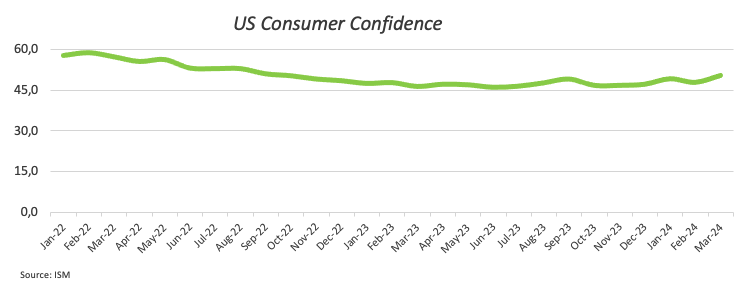
The sharp move in the index gathered extra pace after the key US ISM Manufacturing PMI surprised markets to the upside and improved past the 50 threshold (50.3) in March, returning to the expansion zone.
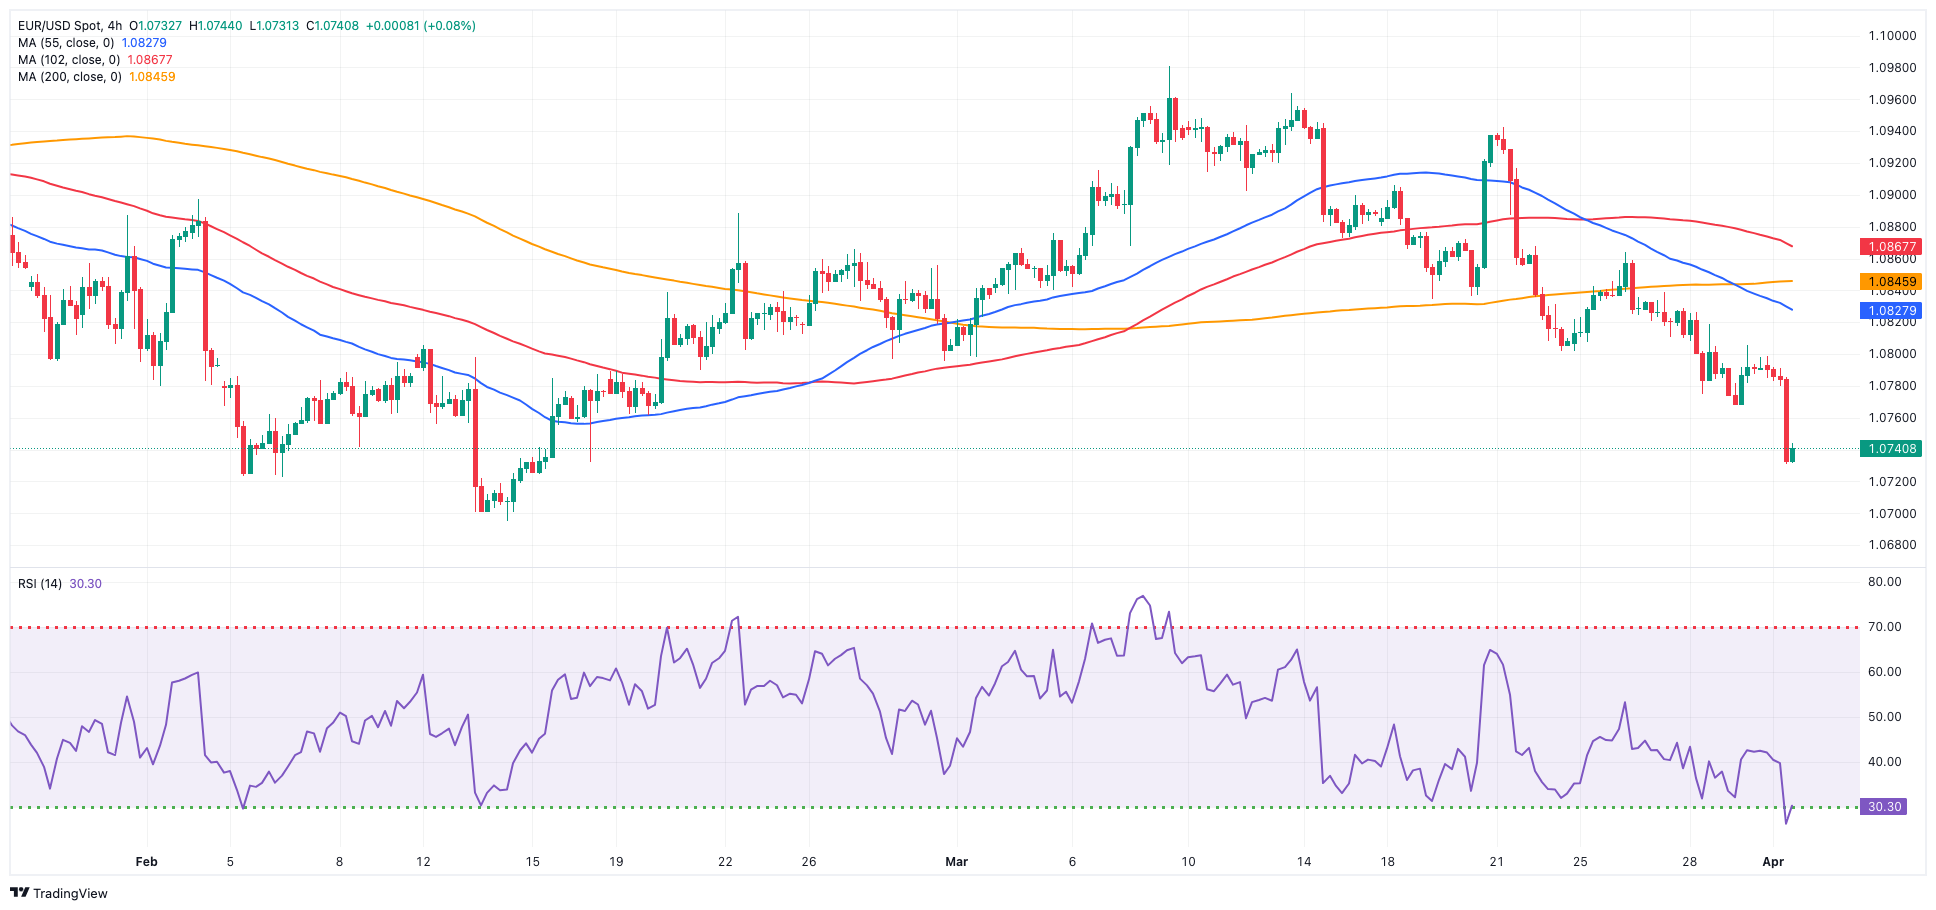
That said, the risk complex suffered a marked uptick in the dollar, and EUR/USD dropped to three-month lows around 1.0730 before meeting some contention.
The decline in spot was also accompanied by a robust bounce in US yields across the curve vs. a marginal advance in German 10-year bund yields.
Additional data releases in the US saw the final S&P Global Manufacturing PMI at 51.9 and Construction Spending contract by 0.3% MoM in February.
In the meantime, investors continued to digest the latest comments from Chief Powell. On this, last Friday, Powell maintained a prudent stance and showed no rush to reduce rates. Echoing sentiments expressed by some of his more hawkish counterparts, Powell remarked, "With the US economy showing robust growth and the labor market remaining exceedingly strong, we have the opportunity to exercise greater confidence in inflation easing before considering any significant rate cuts."
EUR/USD may fall further and reach its 2024 bottom of 1.0694 (February 14). A deeper decrease could reveal the weekly low of 1.0495 (October 13, 2023), which precedes the 2023 low of 1.0448 (October 3) and the round milestone of 1.0400. Instead, the initial up-barrier comes at the key 200-day SMA at 1.0834 prior to the March high of 1.0981 (March 8), and the weekly top of 1.0998 (January 5, 2011), which reinforces the psychological 1.1000 barrier. The breakout of this zone might put pressure on the December 2023 peak of 1.1139 (December 27), which is still propped up by the 200-week SMA of 1.1146 and comes before the 2023 high of 1.1275 (July 18). The daily RSI increased plummeted to around 34.
Resistance levels: 1.0843 1.0864 1.0942 (4H chart)
Support levels: 1.0730 1.0694 1.0656 (4H chart)
USDJPY
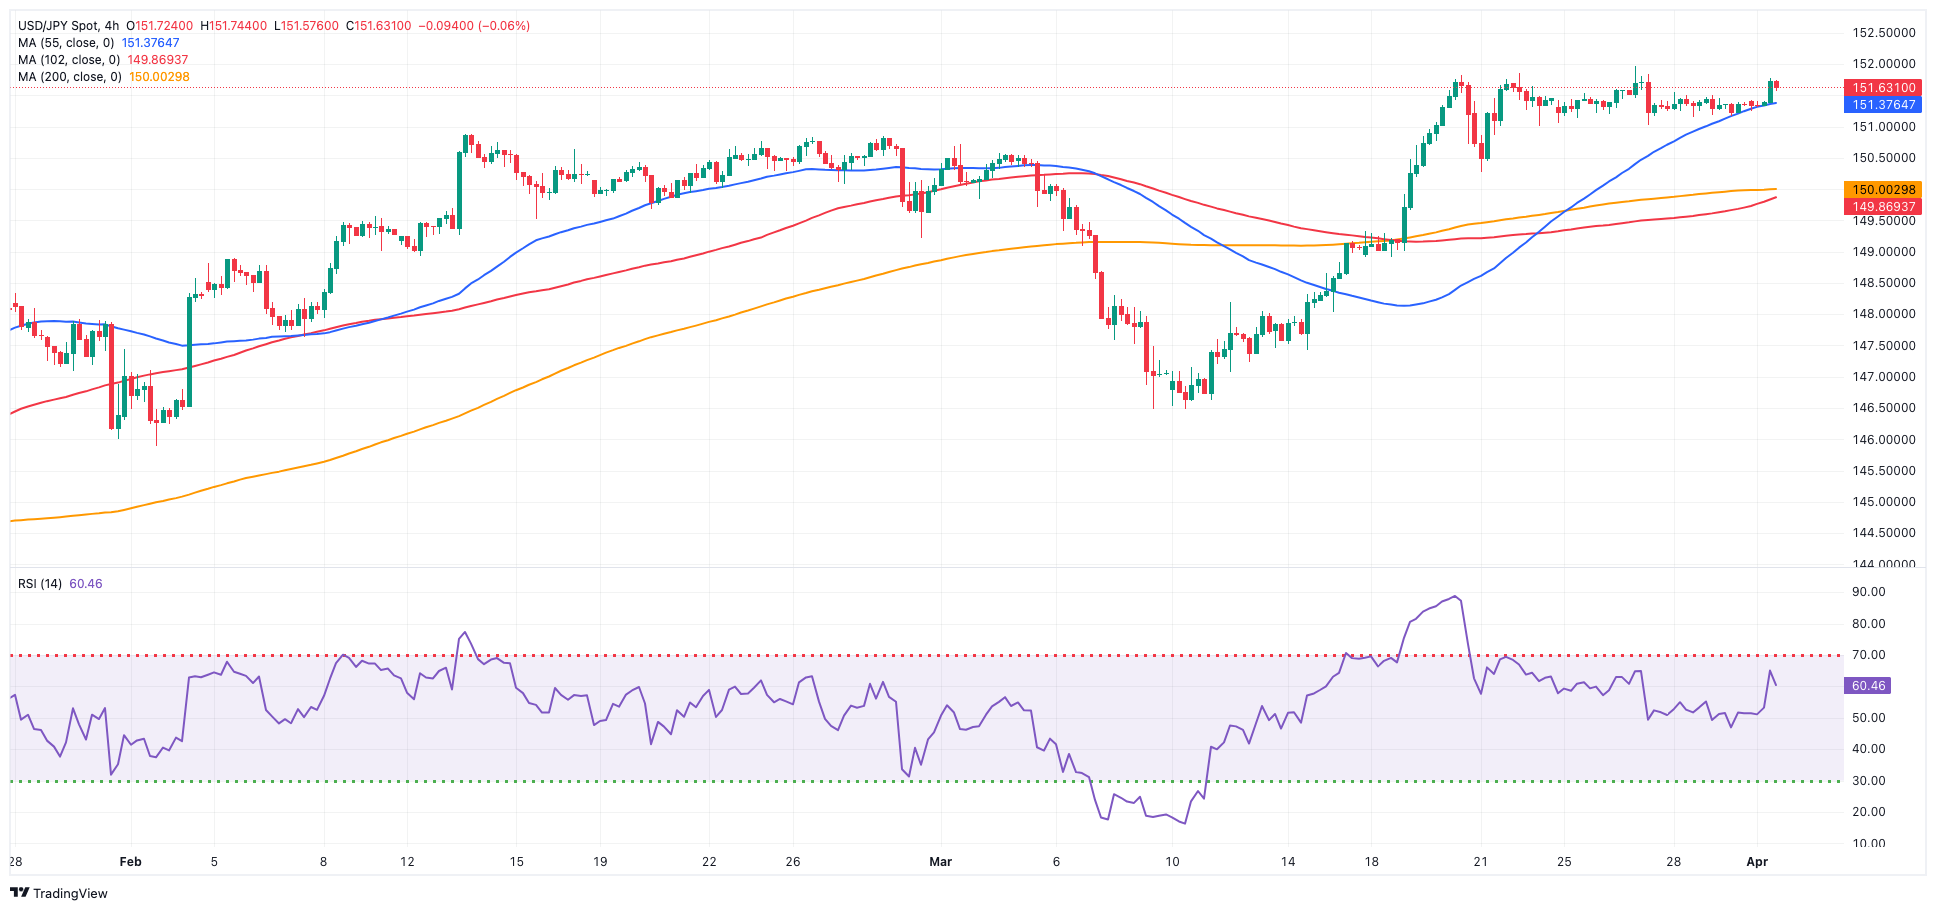
USD/JPY maintained its ongoing consolidative phase unchanged on Monday, always above the 151.00 mark and surrounded by steady speculation of potential FX intervention as the pair approaches the 152.00 barrier.
On the latter, finmin Suzuki refrained from discussing specific FX levels. He emphasized the importance of currencies moving in a stable manner that reflects underlying fundamentals, expressing concern about rapid fluctuations in FX rates. He attributed the recent weakening of the yen to speculative activities. Suzuki stated that no options are ruled out in response to disorderly FX movements and emphasized the close monitoring of FX developments with a heightened sense of urgency, promising appropriate responses to such movements.
On the domestic docket, the Tankan survey for Q1 was released: the Tankan Large All Industry Capex rose 4%, the Tankan Large Manufacturers Index came in at 11, the Tankan Large Manufacturing Outlook improved to 10 and the Tankan Large Non-Manufacturing Index rose to 34.
USD/JPY faces an immediate upward barrier at the 2024 high of 151.97 (March 27), just ahead of the round number of 152.00. In contrast, the pair is projected to find temporary support around the 55-day and 100-day SMAs of 149.32 and 147.67, respectively, all before the critical 200-day SMA of 146.91 and the March low of 146.47 (March 8). A collapse of this zone might result in a return to the February low of 145.89 (February 1), which precedes the December 2023 bottom of 140.24 (December 28), the round number 140.00, and the July low of 137.23 (July 14). The daily RSI rose past 65.
Resistance levels: 151.77 151.97 155.80 (4H chart)
Support levels: 151.02 150.26 149.99 (4H chart)
GBPUSD
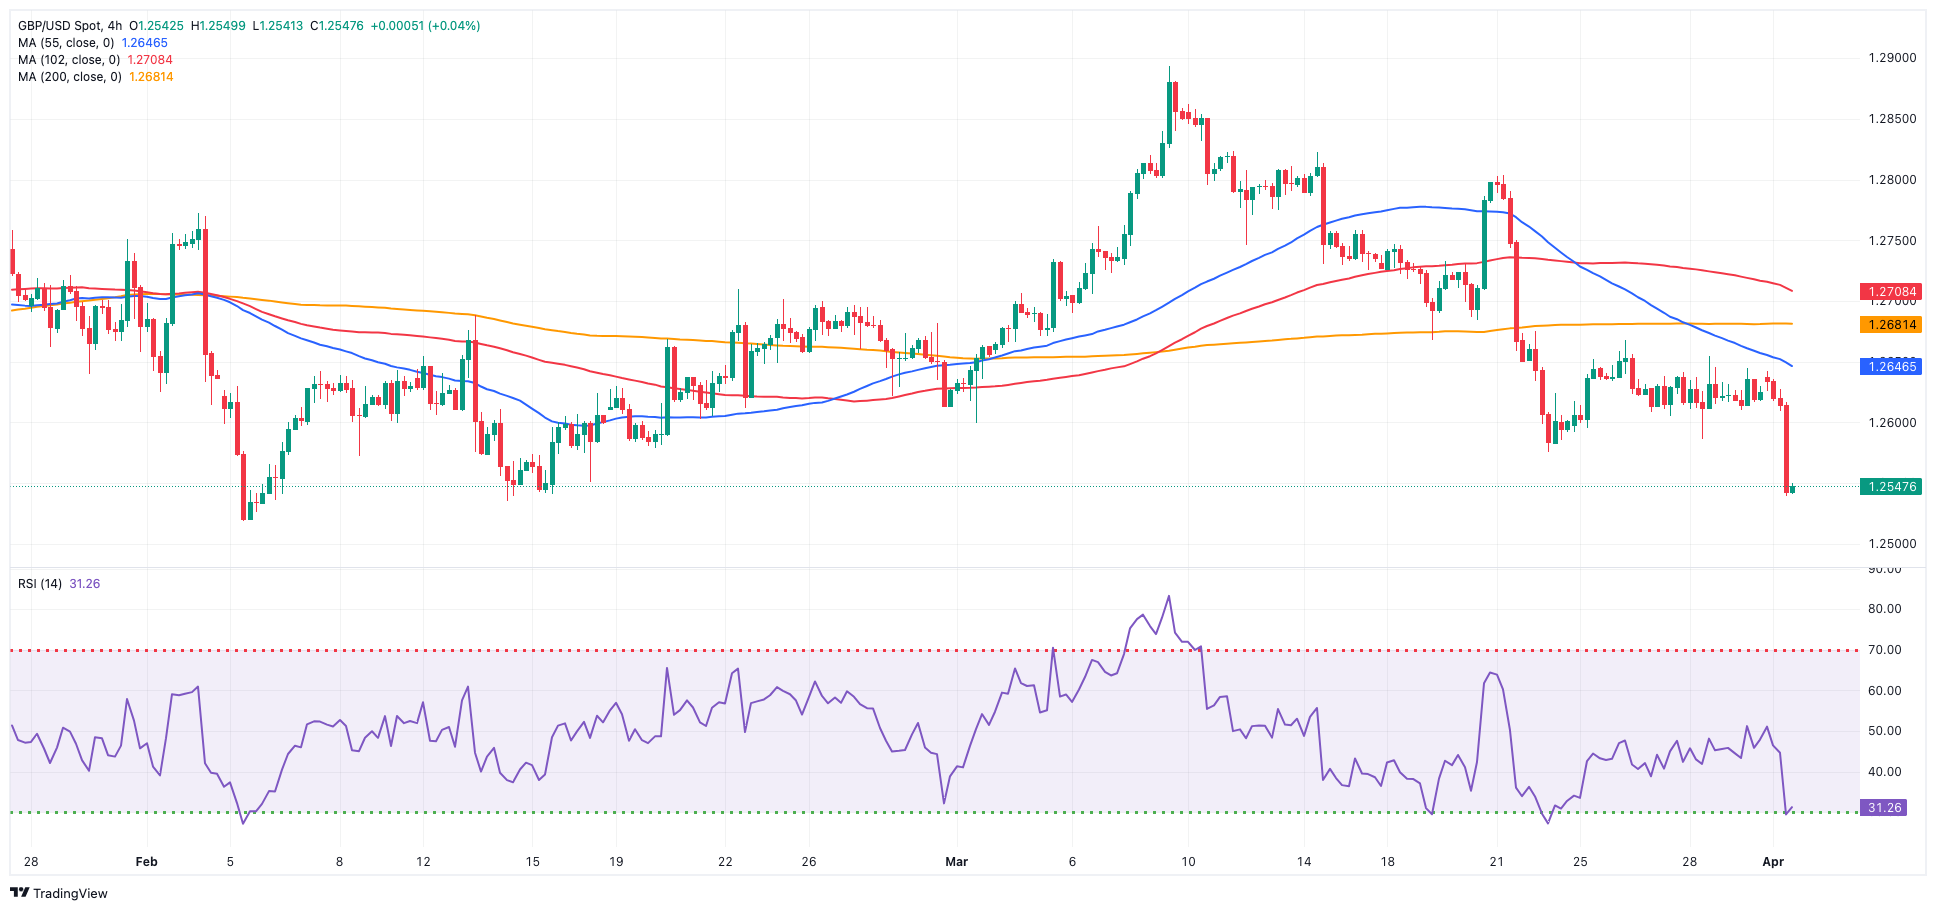
In line with the broad performance of the risk-linked space, the British pound markedly weakened and motivated GBP/USD to retreat to new multi-week lows around 1.2540 at the beginning of the week.
Once again, the firm data-driven rebound in the dollar put the quid and the rest of its risky peers under extra pressure, sparking the third daily decline in a row in Cable and forcing it to breach the key 200-day SMA (1.2587), which in turn opens the door to extra losses in the very near term.
It is worth mentioning that the UK markets were closed on Easter Monday.
Extra retracements could prompt GBP/USD to revisit the 2024 low of 1.2518 (February 5) prior to the December 2023 low of 1.2500 (December 13). A deeper slide would not find major support until the weekly low of 1.2187 (November 10, 2023), which precedes the October 2023 low of 1.2037 and the main 1.2000 line. On the contrary, the next upward hurdle is the 2024 top of 1.2893 (March 8), followed by the weekly high of 1.2995 (July 27, 2023) and the crucial 1.3000 mark. The everyday RSI fell to the 35 area.
Resistance levels: 1.2667 1.2681 1.2803 (4H chart)
Support levels: 1.2539 1.2518 1.2500 (4H chart)
GOLD
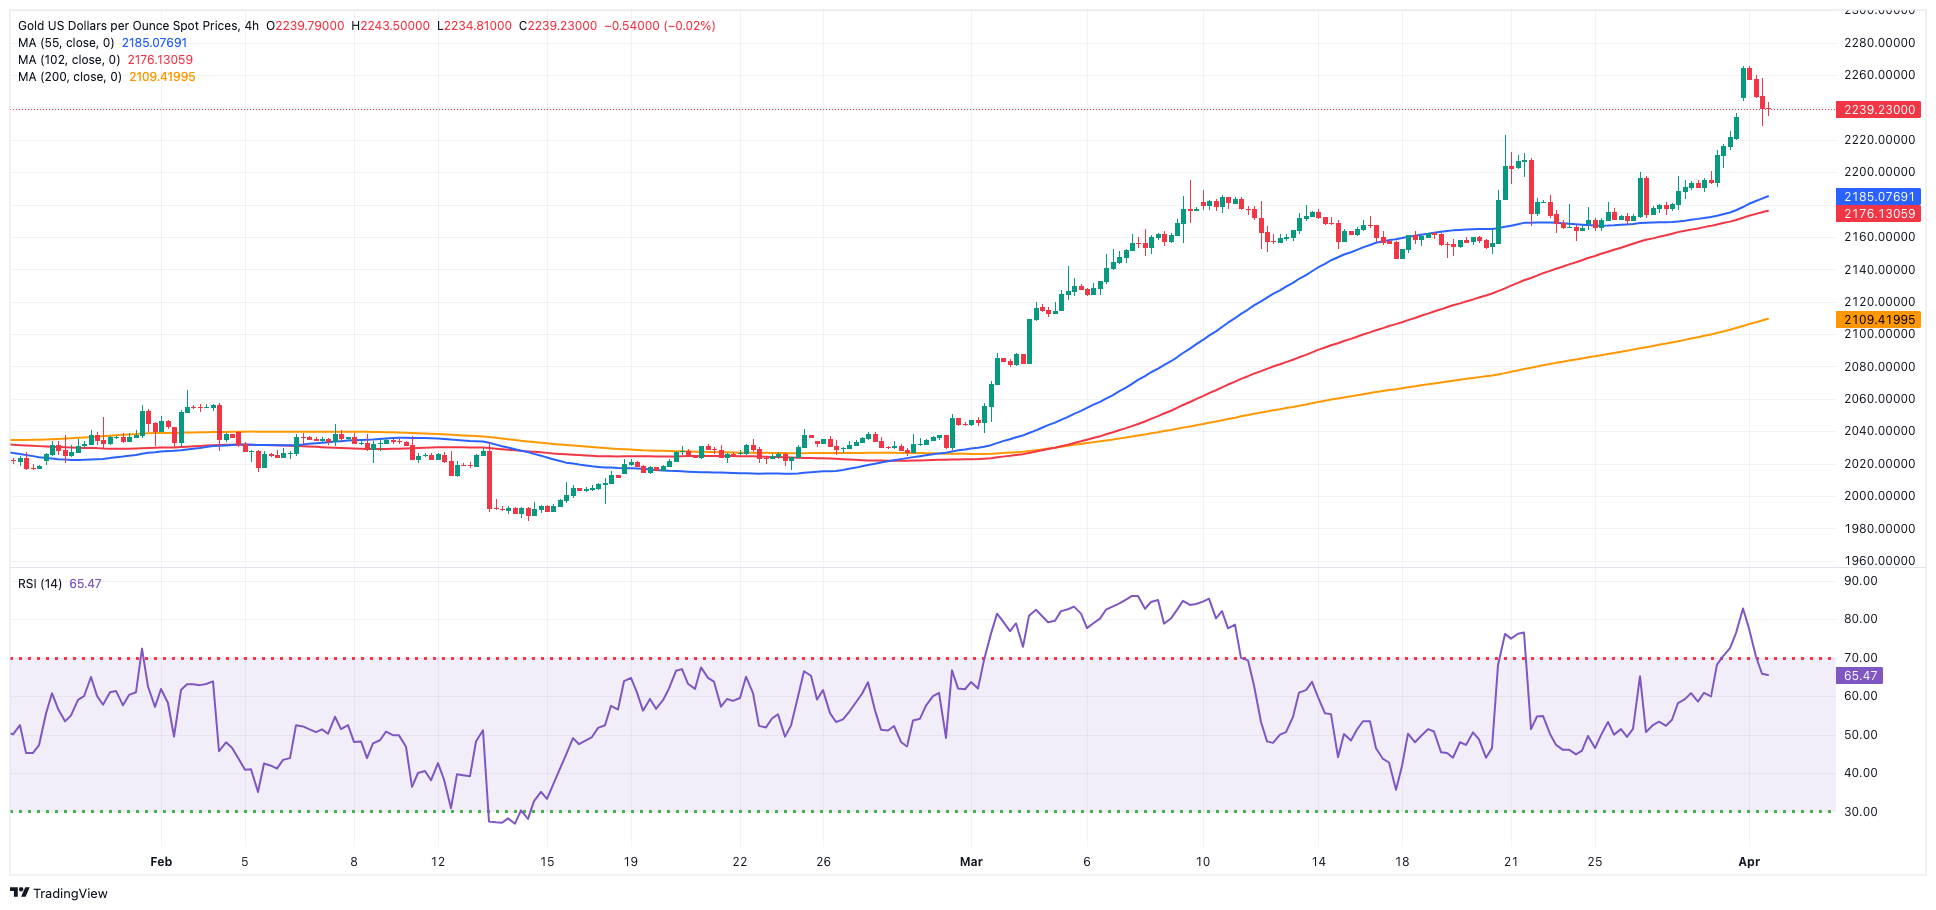
Prices of Gold rose to an all-time high of around $2,265 per troy ounce on Monday.
Indeed, the precious metal clinched its fifth session in a row of gains, although the upside momentum ran out of steam in the wake of the firmer-than-expected US ISM Manufacturing PMI, which sparked a sharp bounce in both the dollar and yields and eventually deflated the metal’s advance.
In the meantime, Friday’s US PCE data revealed a moderation in US prices during February, thereby maintaining the possibility of a June interest rate cut by the Fed. Subsequently, Chair Powell commented that the inflation figures for February were "more aligned with our desired trajectory."
The increase in the price of the yellow metal was further boosted by the demand for safe-haven assets due to ongoing geopolitical tensions worldwide.
Gold is facing immediate resistance above its all-time high of $2,265 (April 1). On the downside, the weekly low of $2,146 (March 18) ranks first, followed by the preliminary 55-day and 100-day SMAs of $2,080 and $2,052, respectively. Further south is the 2024 low of $1,984 (February 14), which appears to be supported by the 200-day SMA ($1,989). Once the latter is resolved, a possible visit to the December 2023 low of $1,973 may commence before the November 2023 low of $1,931. The failure in this region may drive the yellow metal to test its October 2023 low of $1,810, which is immediately followed by the 2023 low of $1,804 and the important $1,800 conflict zone.
Resistance levels: $2,265 (4H chart)
Support levels: $2,185 $2,146 $2,110 (4H chart)
CRUDE WTI
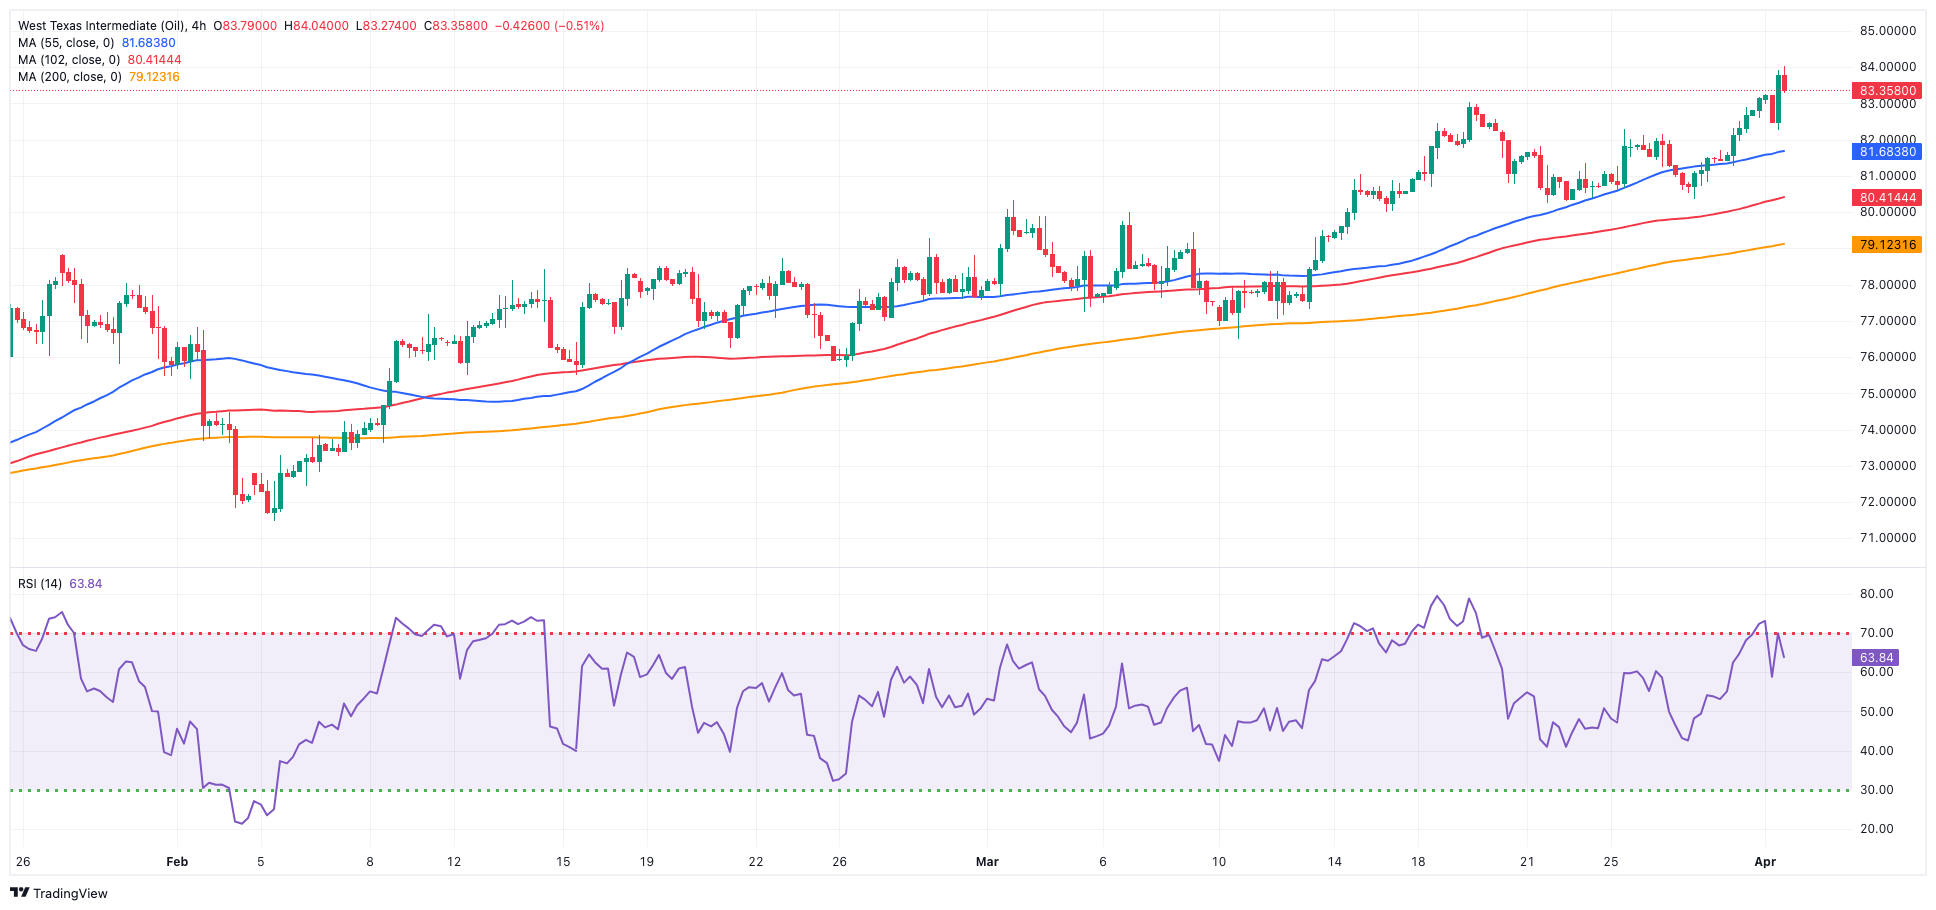
Prices of the American benchmark for sweet light crude oil rose for the third session in a row and reached new six-month highs north of the $84.00 mark per barrel on Monday.
In fact, optimism around the commodity regained traction following auspicious results from the Chinese manufacturing sector over the weekend, while US PCE published on Friday reinforced prospects of a rate cut by the Fed at its June event, and geopolitical concerns remained far from abated.
The rise in crude oil prices was further bolstered by the resurgence of concerns over tight supply conditions, fueled by expectations that the OPEC+ alliance of producers will maintain its current production cuts. Lending credence to this view, Russia's Deputy Prime Minister Alexander Novak stated on Friday that Russia has chosen to prioritize reducing oil production over exports in the second quarter, a decision aimed at distributing production cuts evenly among other OPEC+ member nations.
The next upward challenge for WTI is the 2024 peak of $84.46 (April 1), which comes before the weekly high of $89.83 (October 18, 2023) and the 2023 top of $94.99 (September 28, 2023). Further north, the weekly peak of $97.65 (August 30) is barely short of the psychological $100.00 mark. Just the opposite, the 200-day SMA should offer decent contention at $78.83, prior to the February low of $71.43 (February 5) and the important $70.00 milestone. Extra losses might push prices over the 2024 low of $69.31 (January 3) ahead of the December 2023 low of $67.74 (December 13).
Resistance levels: $84.46 $85.85 $89.82 (4H chart)
Support levels: $82.58 $80.51 $79.32 (4H chart)
GER40
European stock markets were closed on Easter Monday.
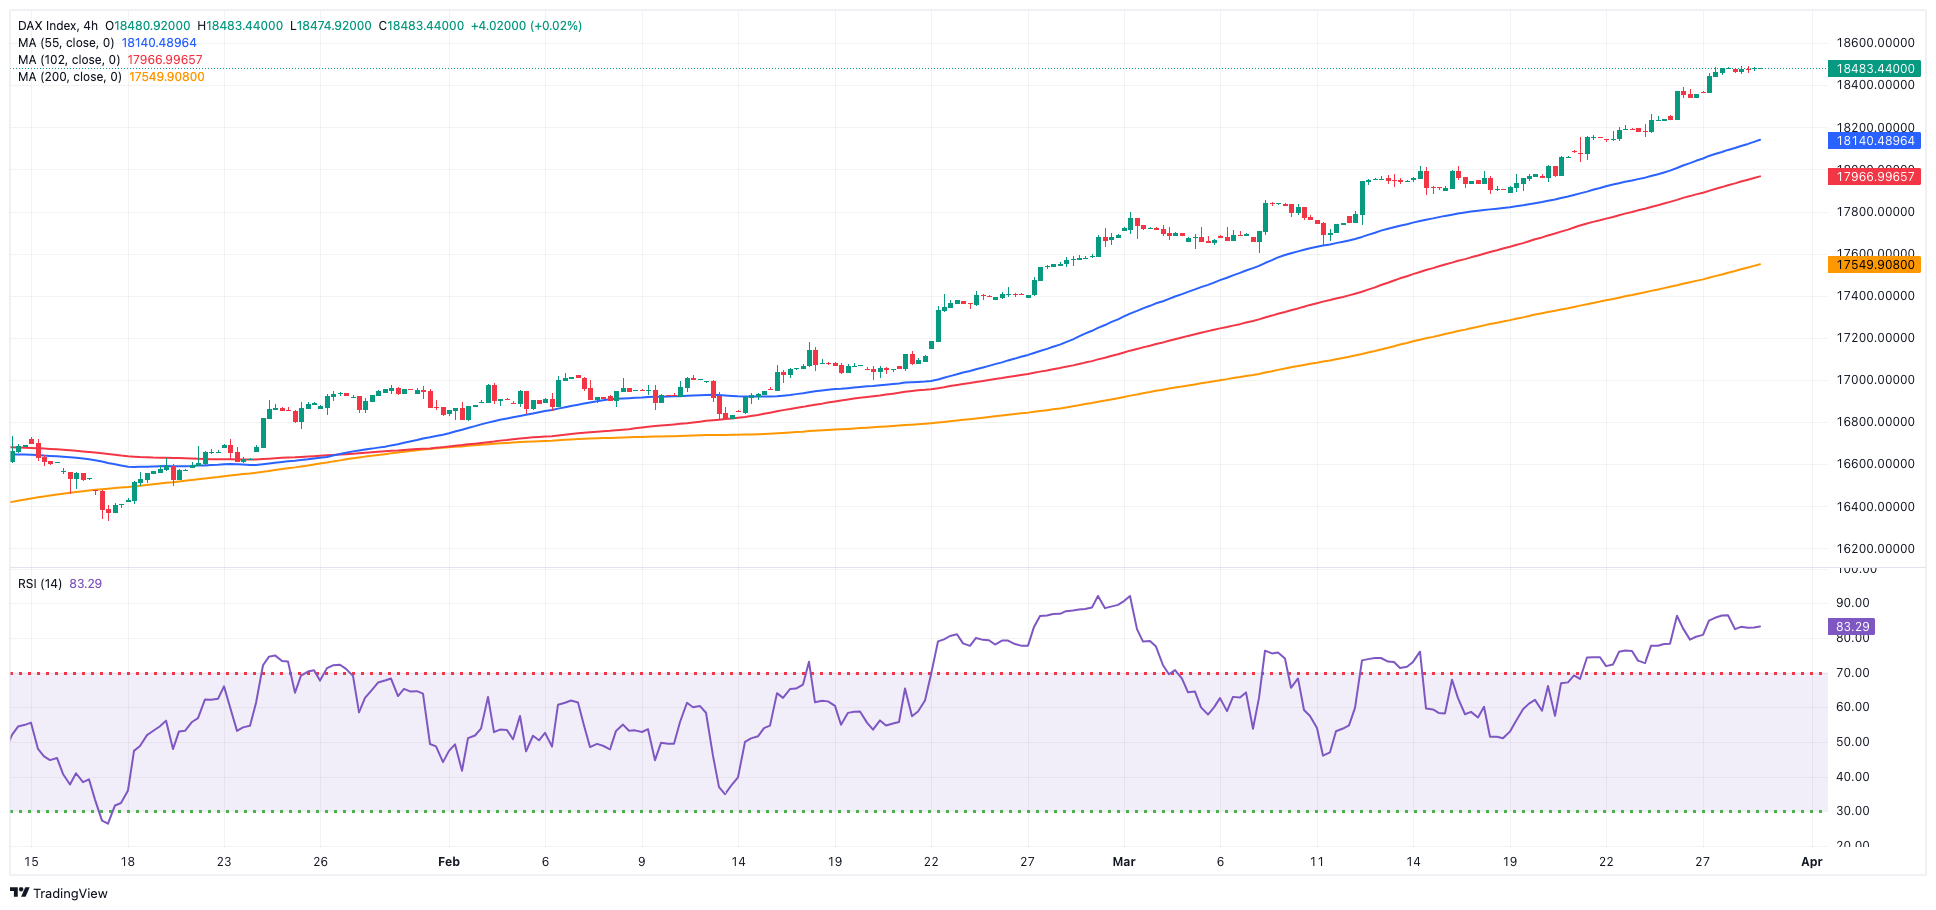
On Maundy Thursday, Germany's benchmark DAX40 index achieved a significant milestone, reaching an unprecedented level just above 18,500 points. This surge occurred amid minimal volatility and subdued trading activity as the Easter holidays approached.
The sustained upward movement of the index was propelled by expectations that major central banks would implement easing measures later in the year due to ongoing disinflationary pressures.
Moreover, investors maintained optimism that favourable results from the upcoming US inflation data, as measured by the PCE, could prompt the Fed to initiate its easing cycle, potentially as early as its June 12 meeting.
While European markets were closed on Good Friday, it is noteworthy that the US headline PCE met estimates, rising by 2.5% in the year to February, and by 2.8% for Core PCE.
The DAX40's next level of resistance is the record high of 18,513 (March 28). Having said that, the 55-day SMA of 17,349 should provide transitory support before the February low of 16,821 (February 1). A loss below this level might send the index to its 2024 low of 16,345 (January 17), which is above the key 200-day SMA at 16,265. After clearing the latter, the weekly low of 15,915 (November 28) may be tested, followed by the October low of 14,630 (October 23) and the 2023 low of 14,458 (March 20). The daily RSI touched 87, indicating that the market remained extremely overbought.
Best Performers: Siemens Energy AG, Merck, Rheinmetall AG
Worst Performers: Deutsche Post, Dr Ing hc F Porsche Prf, Brenntag AG
Resistance levels: 18,511 (4H chart)
Support levels: 18,020 17,619 17,226 (4H chart)
GBPJPY
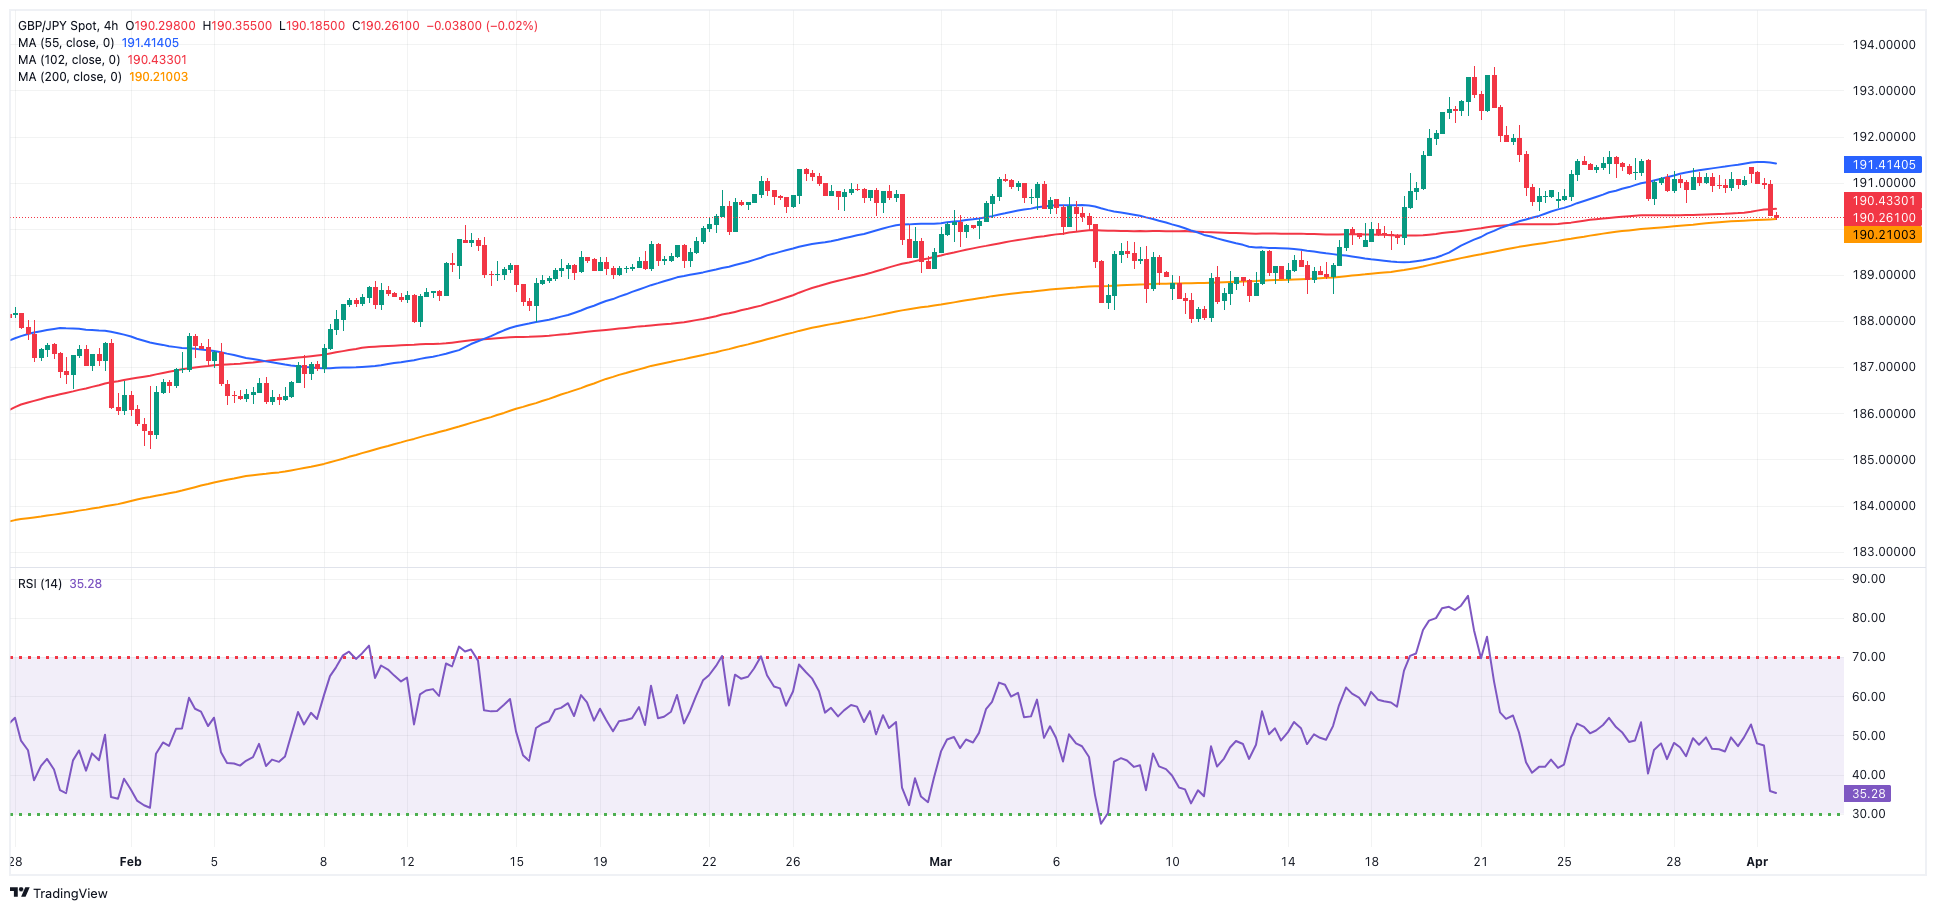
The intense decline in the British pound sponsored the fourth consecutive daily drop in GBP/JPY, this time testing the area of multi-day lows in the 190.30 zone at the beginning of the week.
In fact, another strong session in the dollar put the risk-associated universe under heightened pressure, while prudence remained unchanged over a potential intervention in the FX markets by Japanese officials to support the yen.
Further losses could drag GBP/JPY to the 55-day SMA at 189.28 before the March low of 187.96 (March 11) and the temporary 100-day SMA at 186.95. Once the latter is passed, the cross could go for the February low of 185.22 (February 1), which is just above the critical 200-day SMA of 184.93. A deeper retracement might bring the December 2023 low of 178.33 (December 14) back into focus, ahead of the October 2023 low of 178.03 and the July 2023 low of 176.31 (July 28). In the other direction, the immediate up-barrier comes at its 2024 high of 193.53 (March 20), ahead of the August 2015 top of 195.28 (August 18) and the record peak of 195.88 (June 24, 2015). The RSI slipped back below the 50 yardstick on the daily chart.
Resistance levels: 191.67 193.53 195.28 (4H chart)
Support levels: 190.27 189.54 187.98 (4H chart)
NASDAQ
The resumption of normal activity in US markets saw the tech reference Nasdaq 100 retreat marginally and revisit the 18,200 zone on Monday.
In fact, the index alternated gains with losses against the backdrop of a generalized bearish view from investors, after solid prints from the US manufacturing sector seem to have poured cold water over expectations of a Fed’s rate cut in June.
Adding to the downside pressure in the index, the dollar rose to four-month tops and US yields saw their upside reinvigorated, which eventually weighed on rate-sensitive stocks.
Further advances might lift the Nasdaq 100 past its all-time high of 18,464 (March 21). Alternatively, the index is projected to find temporary support at the 55-day SMA of 17,767, before hitting weekly lows of 17,319 (February 21) and 17,128 (January 31). If the latter is surpassed, a potential test of its 2024 low of 16,249 (January 5) could start emerging on the horizon ahead of the critical 200-day SMA of 16,066 and the December 2023 low of 15,695 (December 4). Additional losses from here may revisit the October 2023 level of 14,058 (October 26), prior to the April 2023 low of 12,724 (April 25) and the March 2023 low of 11,695 (March 13). The daily RSI dropped little below 57.
Top Gainers: Micron, PDD Holdings DRC, ASML ADR
Top Losers: Walgreen Boots, Illumina, Comcast
Resistance levels: 18,464 (4H chart)
Support levels: 17,764 17,319 17,128 (4H chart)
DOW JONES
US equities gauged by the Dow Jones started the week on the back foot, reversing two sessions in a row of gains and returning to the 39,500 zone.
In fact, stronger-than-estimated results from the US manufacturing sector saw the ISM Manufacturing PMI return to the expansion territory for the first time since October 2022, prompting bets for a rate cut by the Fed in June to dwindle somewhat.
In addition, investors kept digesting Friday’s release of sticky PCE figures and the cautious tone from Chief Powell, who reiterated that the central bank is not in a hurry to reduce interest rates, emphasizing the need for further evidence that inflation remains under control. Powell specifically highlighted the solid pace of economic growth in the US and the robust labour market, suggesting that these factors provide the Fed with the opportunity to gain more confidence in inflation moderating before considering the significant move of cutting rates.
At the beginning of the week, the Dow Jones retreated 0.73% to 39,517, the S&P 500 dropped 0.40% to 5,233, and the tech-oriented Nasdaq Composite eased 0.17% to 16,351.
In case bulls regain the initiative, the Dow Jones might challenge its record high of 39,889 (March 21). On the flip side, there is temporary support at the 55-day SMA of 38,657, which precedes the 2024 low of 37,122 (January 18) and the weekly low of 37,073 (December 20, 2023). If the index falls below this level, it may reach the provisional 100-day SMA at 37,556 before attempting to test the 200-day SMA at 35,912. The weekly low of 33,859 (November 7, 2023) comes next and is followed by the October 2023 low of 32,327 (October 27), all ahead of the 2023 bottom of 31,429 (March 15). The daily RSI receded to around 58.
Top Performers: 3M, Chevron, Dow
Worst Performers: Home Depot, Nike, Boeing
Resistance levels: 39,889 (4H chart)
Support levels: 38,657 38,457 38,039 (4H chart)
MACROECONOMIC EVENTS
All Information & Updates provided by:

All information relating to the financial markets available on this page has been prepared and issued by FXStreet (Forexstreet SL, Spain, Reg: B62498233) on the basis of publicly available information and all information believed to be reliable and does not conflict with Kuwaiti local laws, and all necessary care has been taken to before the company to ensure that the facts mentioned are correct from the source.
NCM Investment nor any of its directors or employees shall in any way be held responsible for the contents of this news, and the information contained on this page is intended only to provide clients with publicly available information and should not be construed as investment advice, report or analysis and/or constitute an offer or invitation to buy or sell financial instruments of any kind.
RISK WARNING: Forex and CFDs are highly risky leveraged products, as losses can exceed deposits. Please ensure you understand all the risks and take independent advice if necessary. NCM will segregate the clients based on the criteria of the regulator and its bylaws. NCM does not provide any advisory service; the material published does not constitute advice or a recommendation for a transaction in any financial instrument. NCM accepts no responsibility for any use of the content presented and any consequences of that use. Anyone acting on the information provided does so at their own risk.